

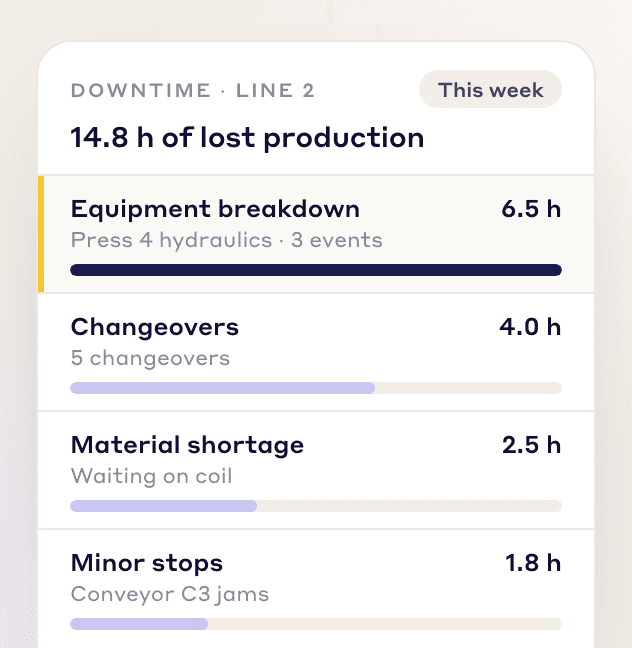
Downtime losses
Log lost production by cause, from breakdowns and changeovers to material shortages, and use it to fix maintenance and scheduling.
Loss and cost management in LeanSuite shows where your plant loses money: import your loss data, get a loss tree that puts a cost on each loss, and track the savings as you remove them.
By clicking "Schedule Demo," you agree to the use of your data in accordance with LeanSuite's Privacy Notice, including for marketing purposes.
GAIN FINANCIAL CONTROL
One structure for the three main categories of operational loss: downtime, poor quality and waste.
Log lost production by cause, from breakdowns and changeovers to material shortages, and use it to fix maintenance and scheduling.
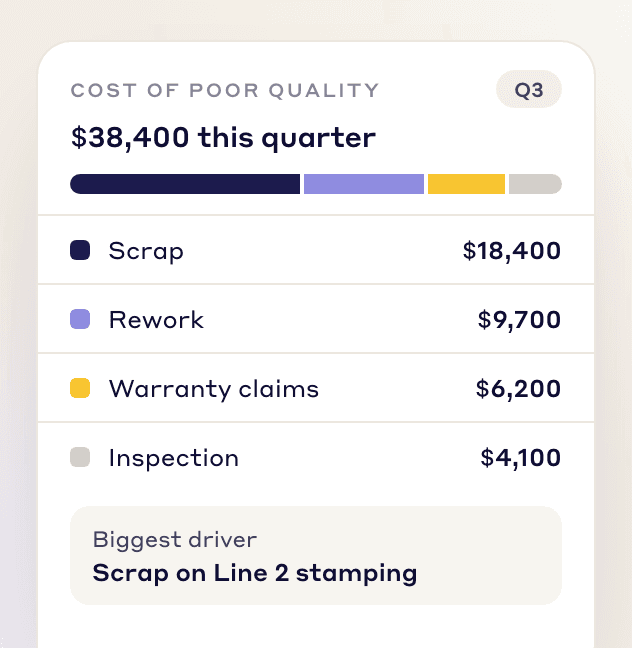
Put a cost on defects by capturing scrap, rework, warranty claims and inspections, then rank quality projects by what they are worth.
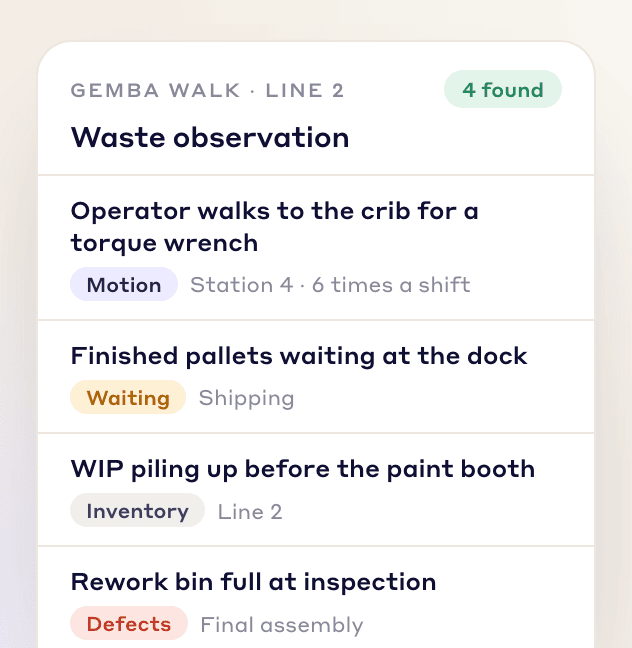
Use digital Gemba walks and waste observation forms to find and remove the 8 wastes of Lean, from excess motion to unused talent.
LOSS PRIORITIZATION MATRIX
Turn raw loss data from across your plant into an action plan ranked by cost.
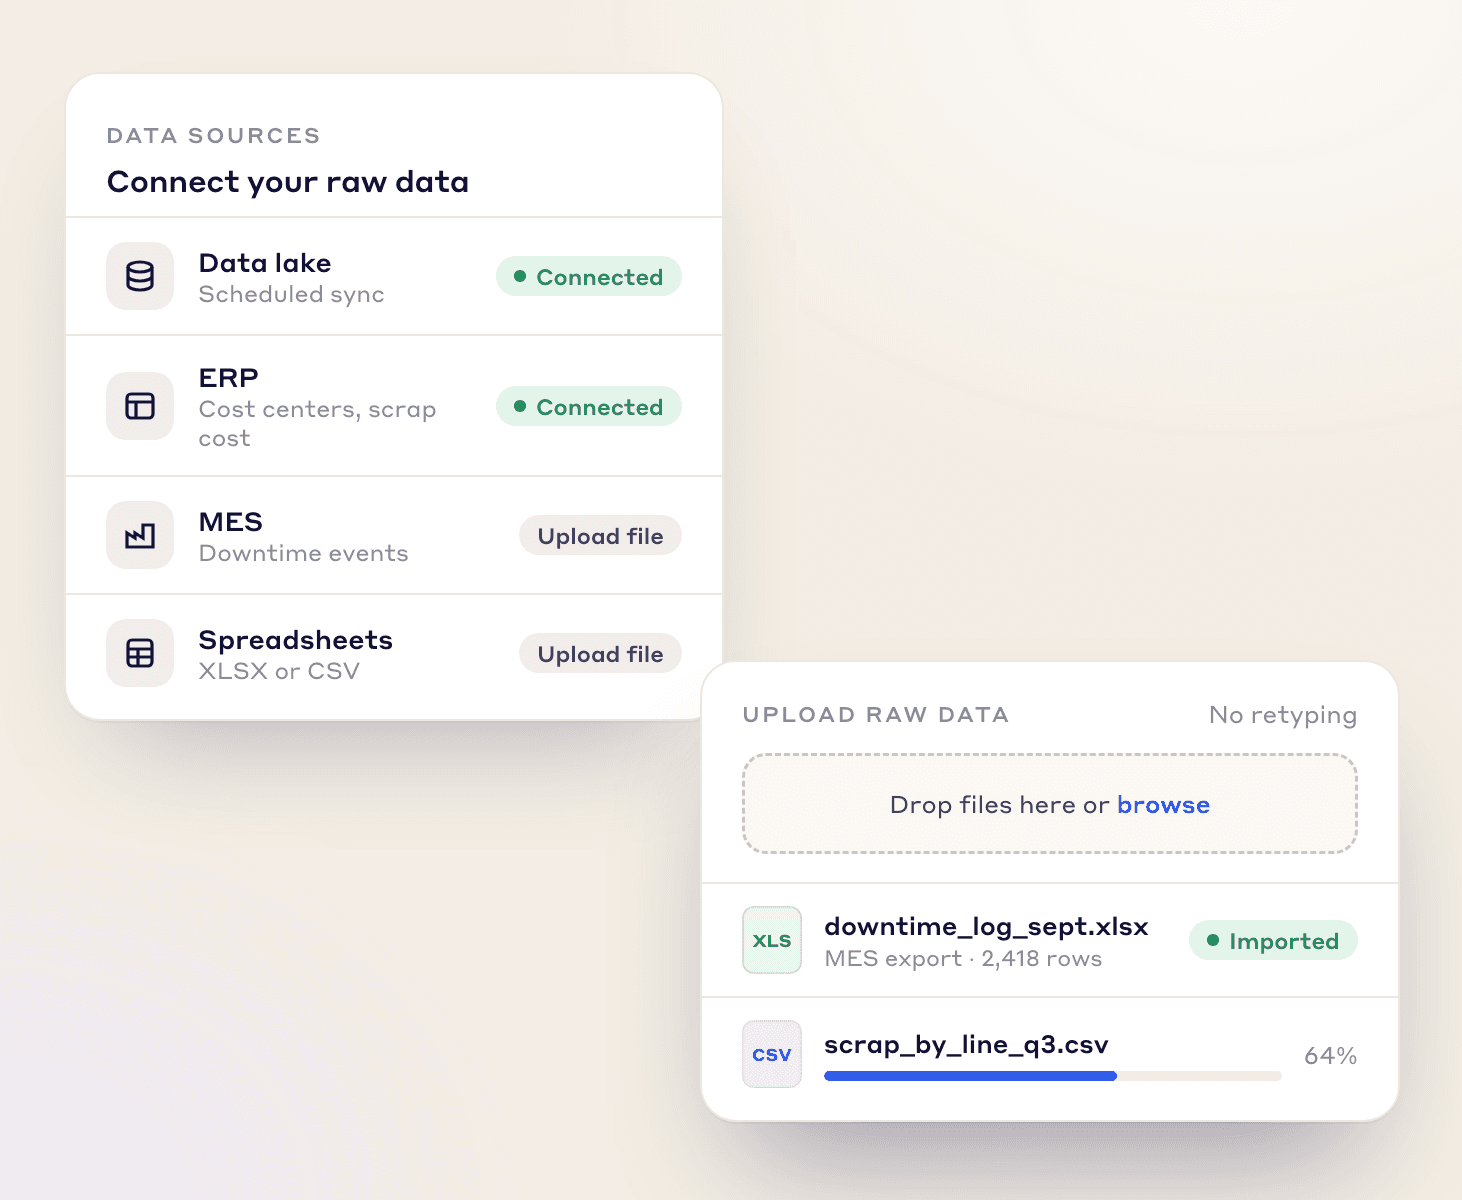
Upload data
Upload loss or defect data from any spreadsheet and map its columns once. You can also connect your existing data lake, or upload raw data files from your ERP or MES. Every import is kept in an import history. See how it works
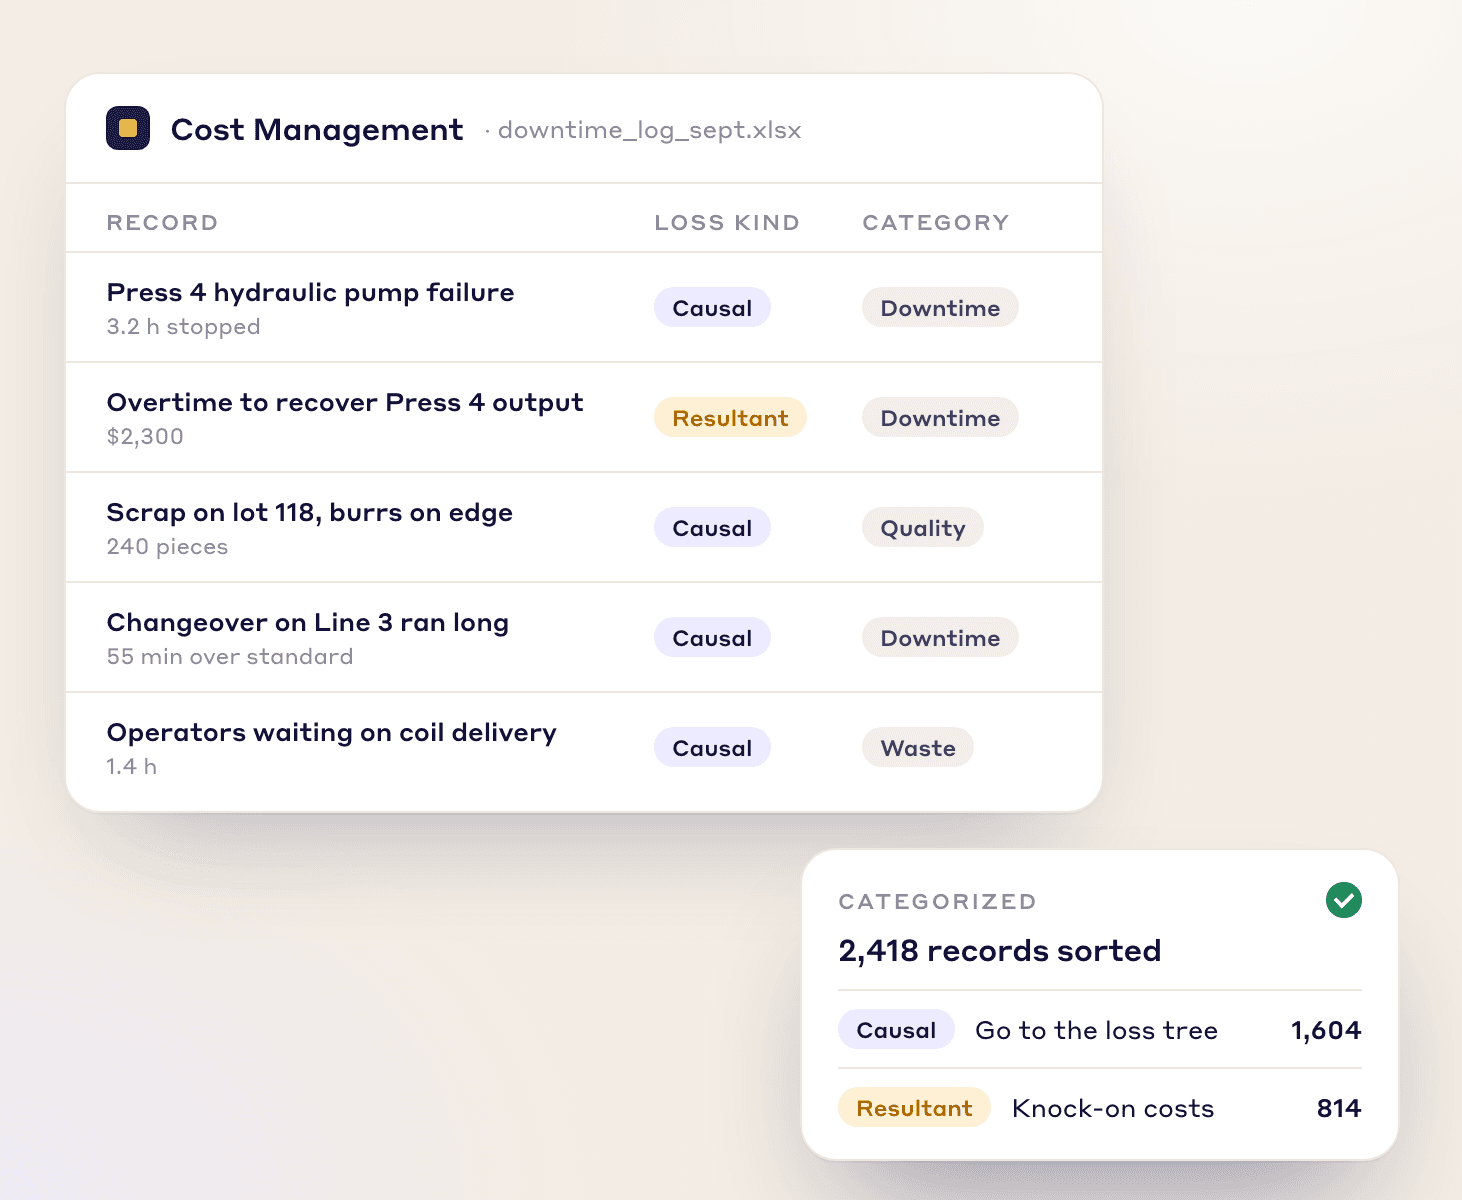
Categorized losses
LeanSuite sorts each record into a cost bucket and a causal or resultant loss, so raw numbers get a clear structure.
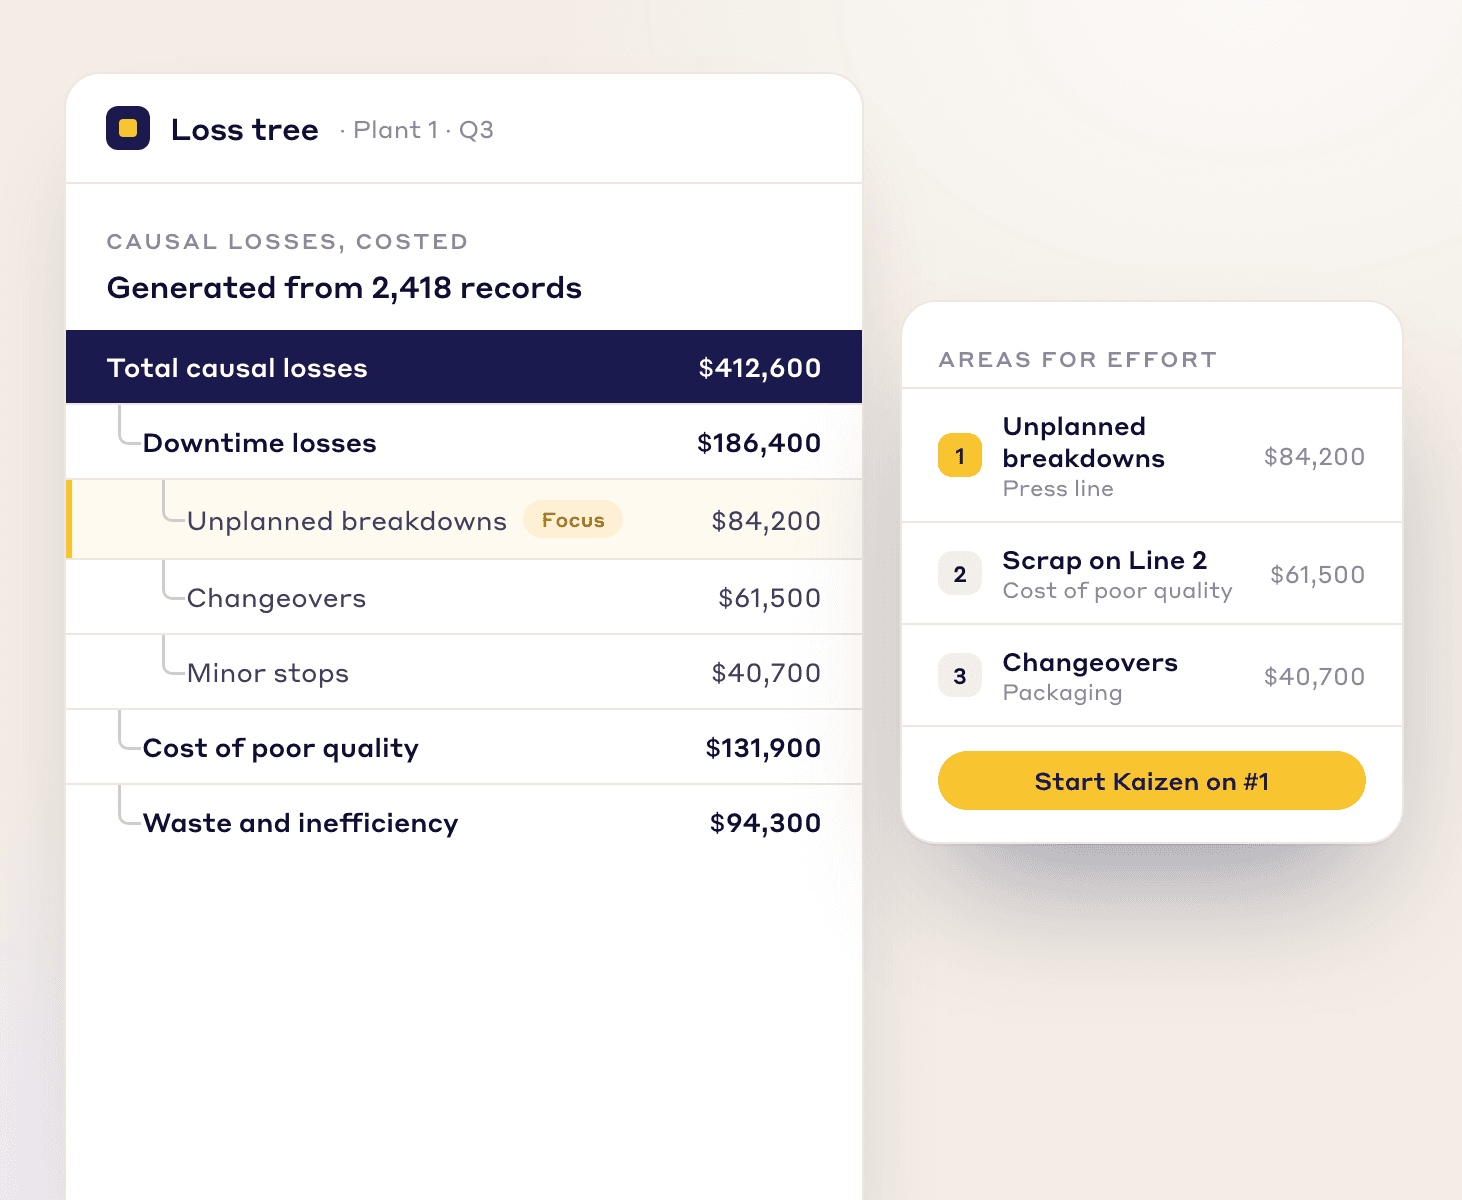
Loss tree report
LeanSuite builds a "loss tree" for any date range that puts a cost on every causal loss and ranks your biggest improvement opportunities:
The Top Losses report shows which losses are worth your team's effort first.
Start projects and Kaizen events straight from the ranked list.
FINANCIAL IMPACT
The same 10 minutes of downtime can cost very different amounts. LeanSuite puts a cost on each loss so you work on what matters most.
This line is a critical bottleneck. The downtime here starves downstream processes, risking late shipments and lost sales.
Financial impact
$4,500
This line is not a bottleneck. The financial impact is limited to the labor and energy costs for that 10-minute period.
Financial impact
$150
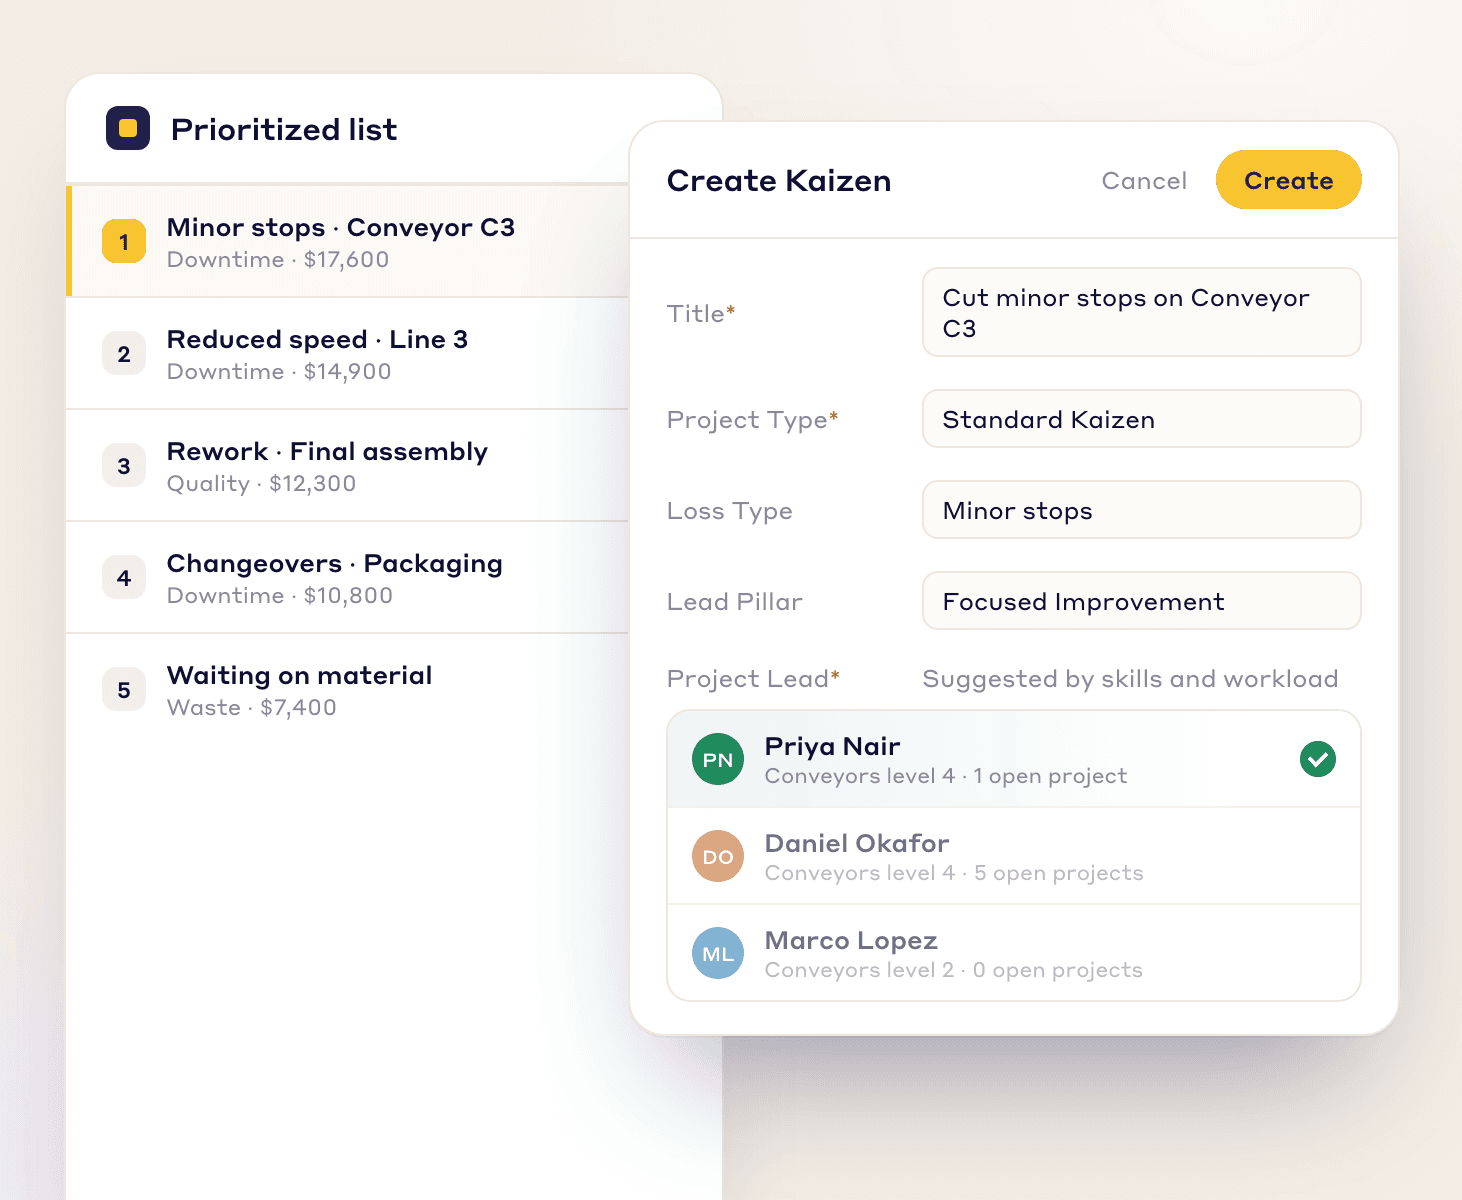
TAKE ACTION
Start a Kaizen event from a high-impact loss in one click. Skills and workload are shown side by side, so you pick the right lead without overloading your top performers.
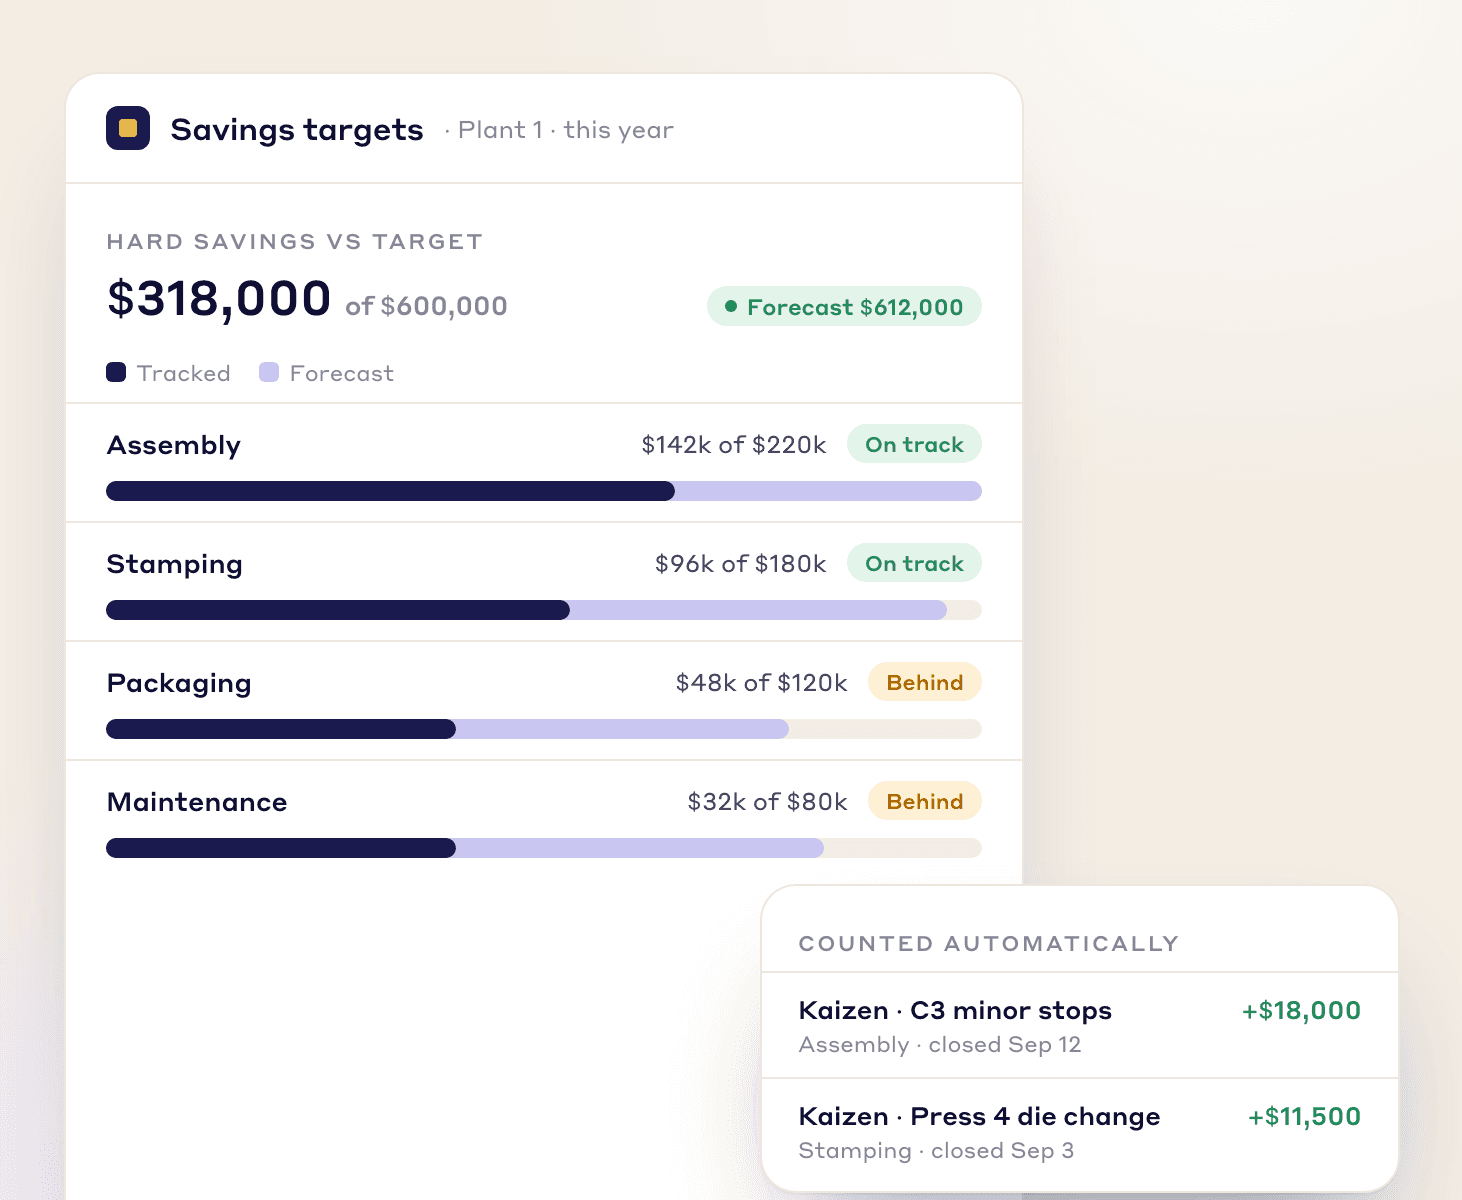
FINANCIAL VISIBILITY
Set yearly savings targets for each department, with seasonality month by month. The Glidepath report shows closed, projected and carried-over savings against target, and the Project Pipeline shows what's coming. See how it works
FAQs
FREE RESOURCES
Not ready for software yet? Start with these free resources.
See how LeanSuite shows where your plant loses money and helps you win it back.