Reduce Defect Rate
Quality Improvement: Catch defects, fix root causes, keep quality high
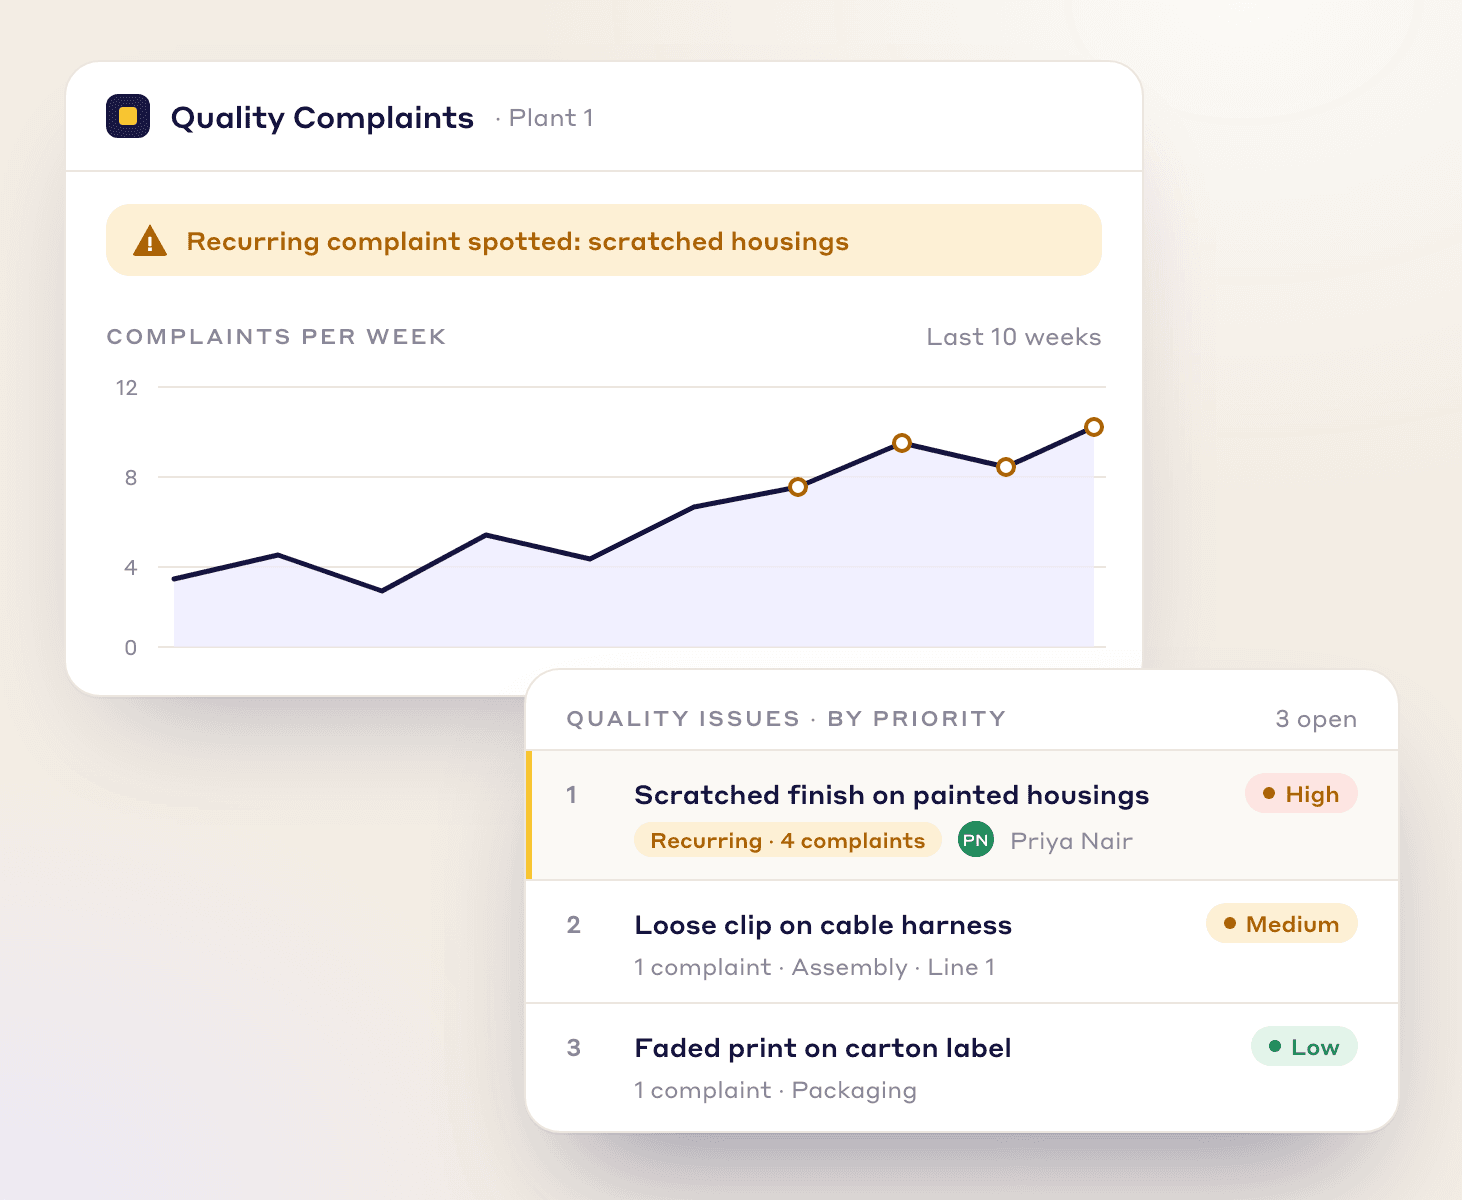
Quality improvement in manufacturing, from defect to fix: log quality issues from the floor, rank them in the QA Matrix, trace each to its root cause and follow the CAPA to closure.
By clicking "Schedule Demo," you agree to the use of your data in accordance with LeanSuite's Privacy Notice, including for marketing purposes.
Why LeanSuite
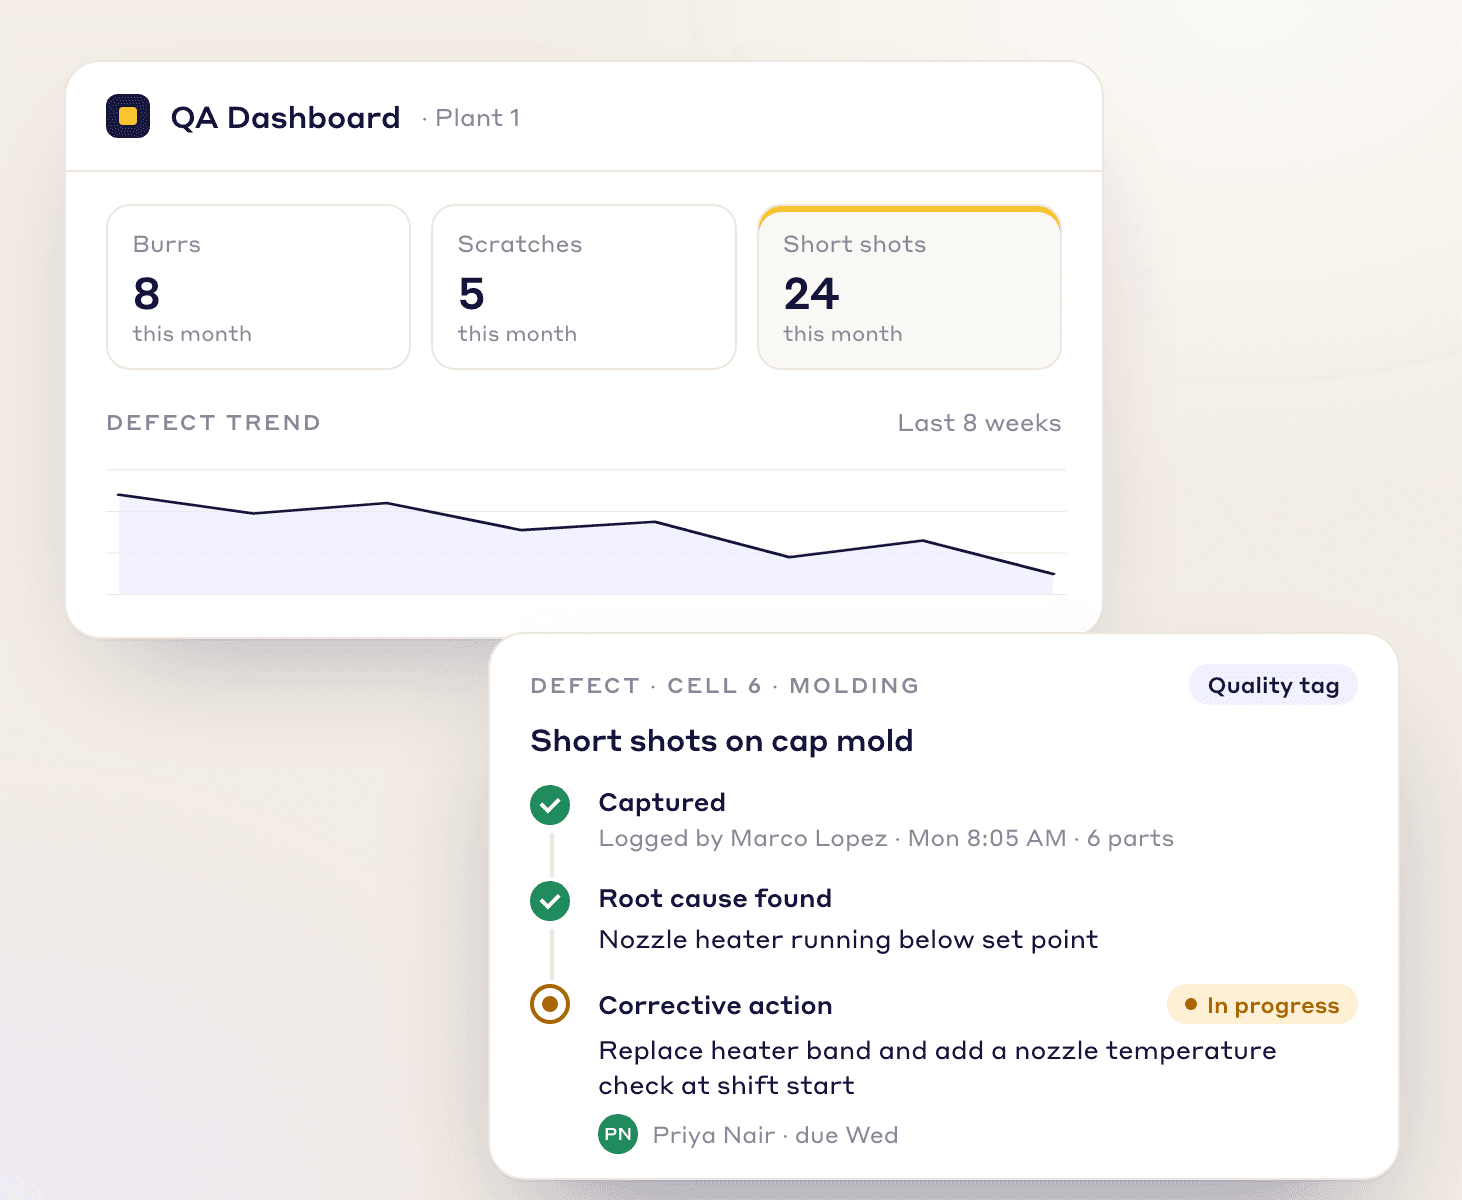
Quality improvement in manufacturing, from defect to fix


Minimize Cost of Quality
Improve quality while reducing costs

Increase Customer Satisfaction
Solve the issues that matter most first

Standardize Quality Processes
Follow the correct steps, every time
Our solutions
Tools to run your quality improvement program
Monitor and improve quality across your organization from one place.
Tag Management System
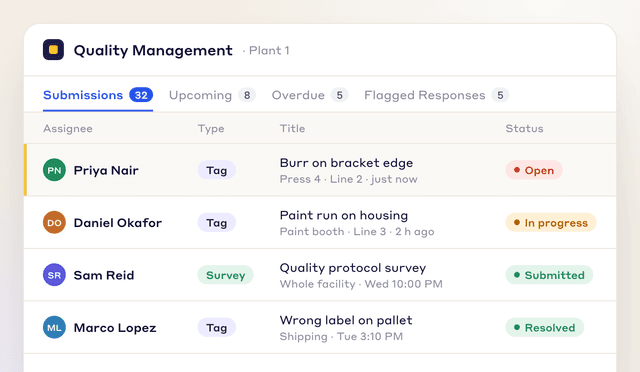
Track quality issues from report to resolution
Capture, route and resolve quality concerns in one place, so everyone sees what's open and who owns it.
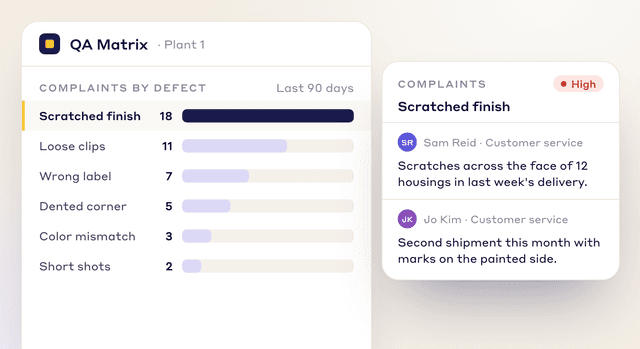
Quality Assurance (QA) Matrix
Prioritize and visualize quality improvements
Each imported defect gets an AA, A, B or C priority, and any defect can start a Kaizen or CAPA.
Manufacturing Document Builder
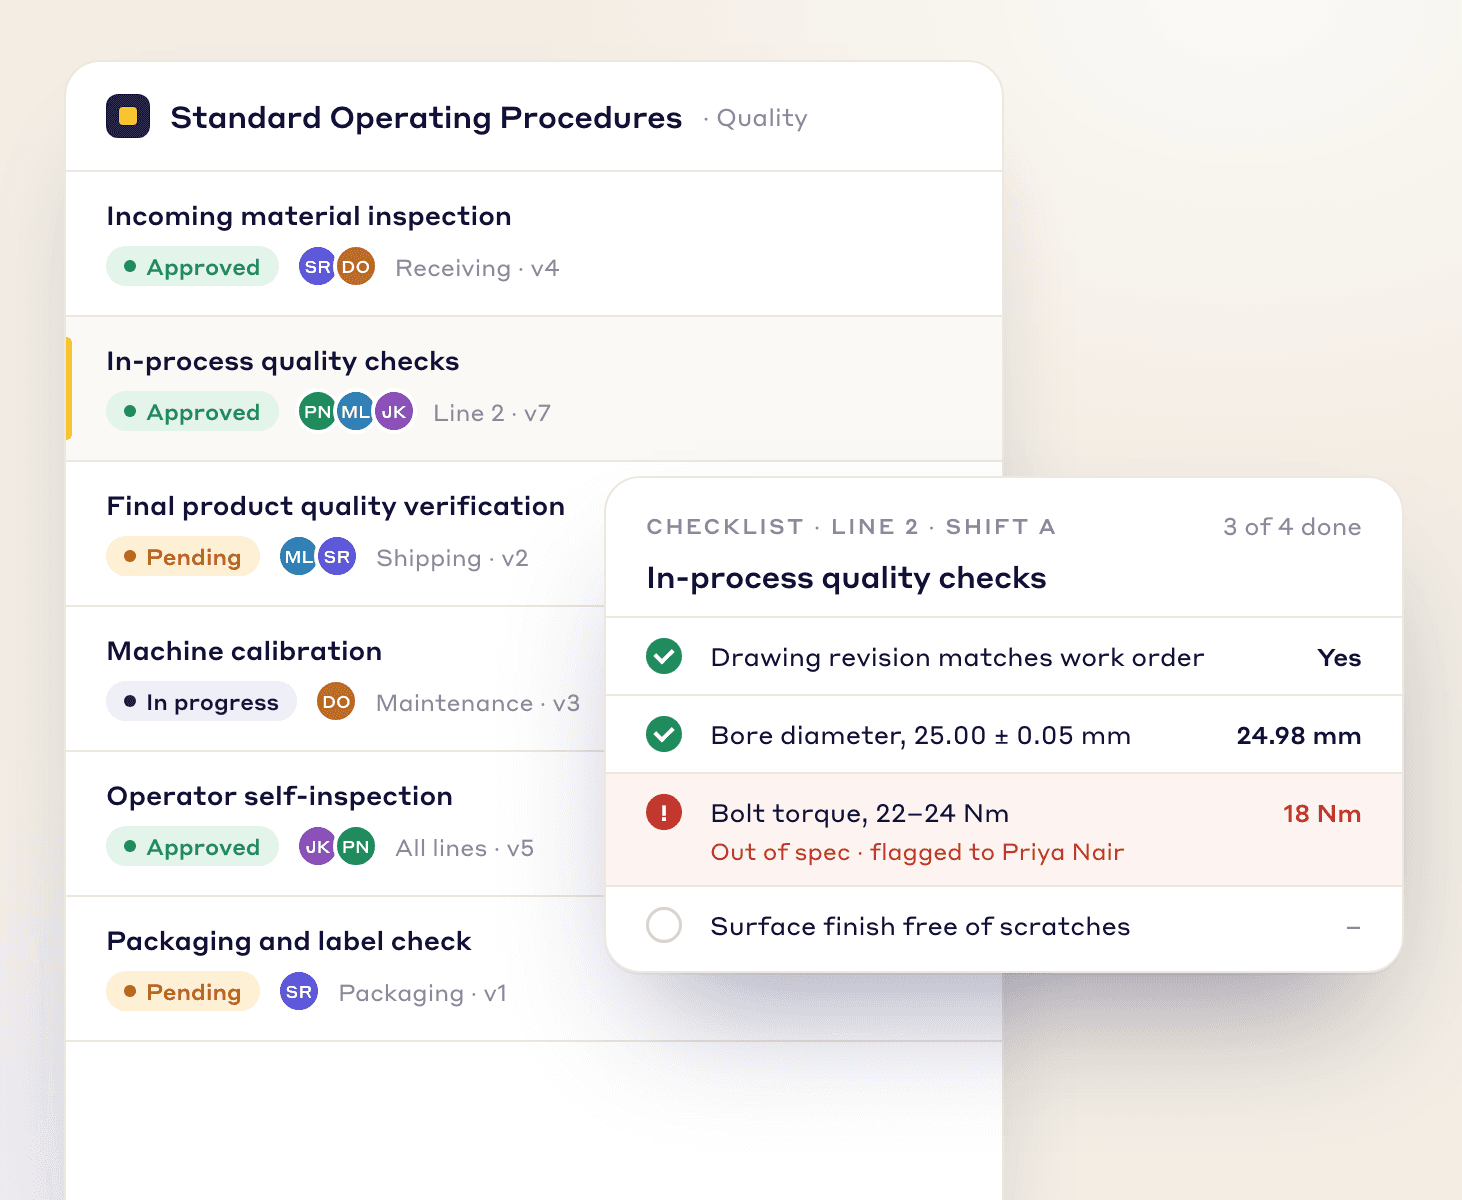
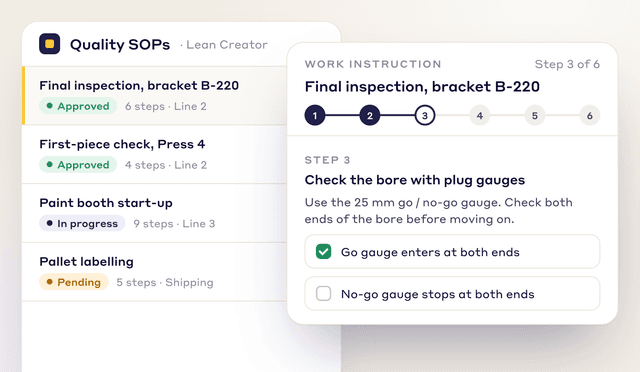
Build quality into every task with standard documents
Digital instructions and checklists, with number limits, required photos and signatures, build quality into every task.
KPI Builder & Dashboards
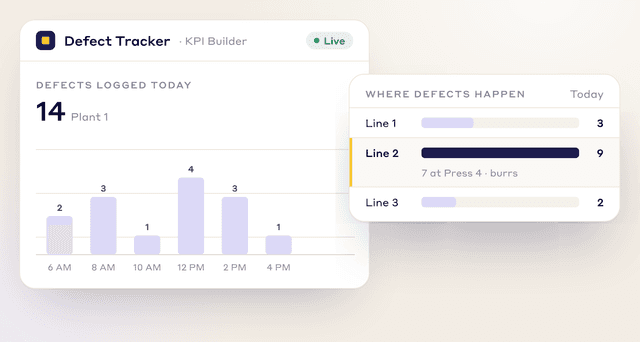
Track quality with custom KPIs
Track quality KPIs against targets and see where defects happen, so you can solve problems at the source.
Tag Management System
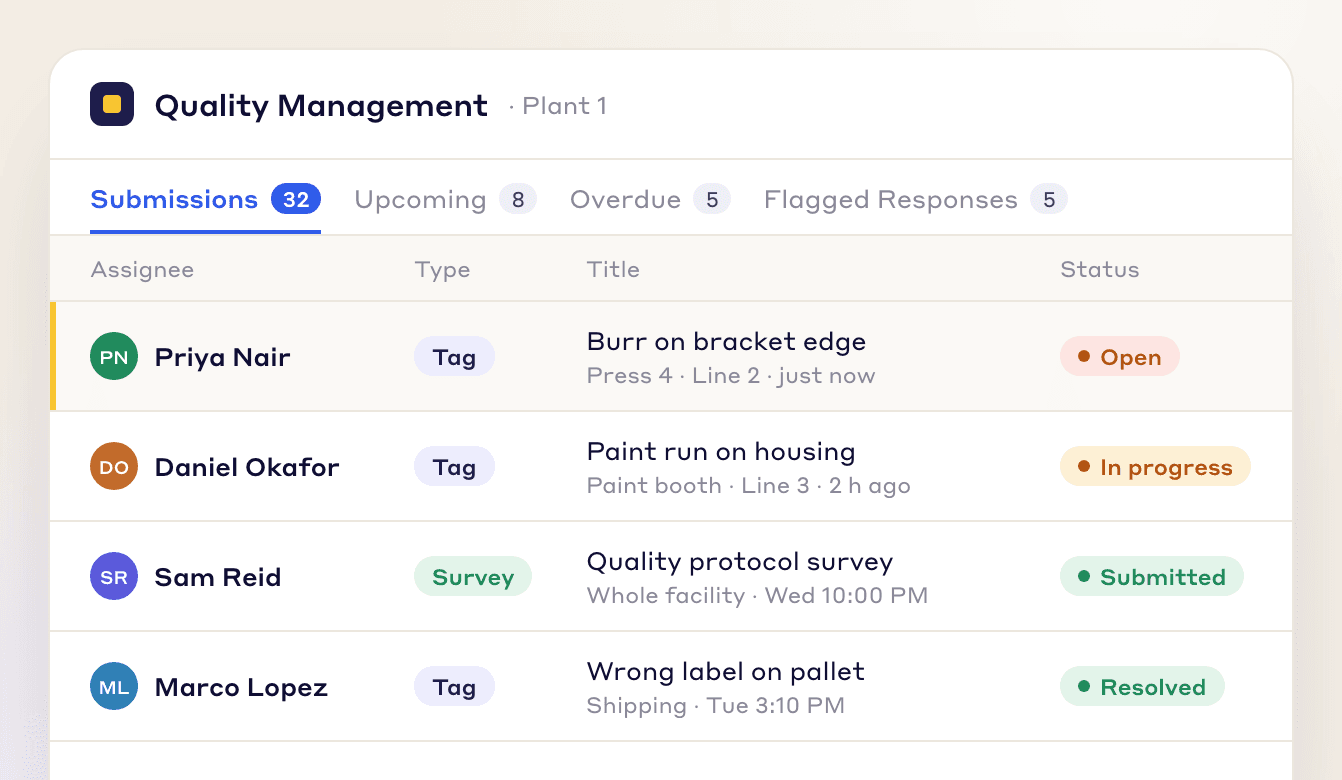
Track quality issues from report to resolution
Capture, route and resolve quality concerns in one place, so everyone sees what's open and who owns it.
Schedule Demo
FAQs
Frequently Asked Questions
Quality improvement is the ongoing work of finding defects, tracing them to their root causes and changing the process so they don't come back.
PDCA, Six Sigma's DMAIC, root cause analysis with the 5 Whys or a fishbone diagram, error-proofing (poka-yoke), statistical process control and standard work. Most plants combine several.
Measure where defects happen and what they cost, fix the biggest at the root cause, and lock the fix in with standard work.
Process improvement makes a process faster, cheaper or simpler; quality improvement makes its output right more consistently. They overlap heavily and share tools such as PDCA and root cause analysis.
The Quality Assurance (QA) Matrix ranks defects by product category and group, giving each an AA, A, B or C priority from where it was caught, its severity, cost and recurrence.
Defects are logged as tags, ranked in the QA Matrix, and systemic ones become CAPA projects with approvals, root cause analysis and an action plan.
Build the checks in Lean Creator and schedule them with Daily Standard Work; a failed check can raise a tag or start a CAPA.
Built-in quality means each step is set up so defects are prevented or caught where they are made, instead of found at final inspection. Standard work, error-proofing (poka-yoke) and stopping to fix a problem at its source are the main tools.
FREE RESOURCES
Free templates, posters and tools
Not ready for software yet? Start with these free resources.
- Defect check sheetTally defects by type and day, with units inspected, defect rates, a location sheet and the week's Pareto.
- PFMEA template (process FMEA)Failure modes, effects and causes rated for severity, occurrence and detection, with RPN before and after action.
- Design FMEA (DFMEA) templateA design FMEA worksheet with S, O, D and RPN before and after action, a class column and a design rating guide.
- Control plan templateWhat is checked at each step, against which limits, how, how often, and what to do when a result is out.
- Process capability (Cpk) study sheet25 subgroups of readings with Cp, Cpk, Pp and Ppk worked out, control limits to check stability, and a histogram.
- X-bar and R control chart template25 subgroups with means and ranges, control limits from A2, D3 and D4, signal flags, both charts and a reaction log.
- I-MR chart template (individuals and moving range)Up to 100 single readings with moving ranges, limits from a baseline, five run-rule flags, both charts, a second phase and a reaction log.
- Attribute control chart template (p, np, c and u charts)p, np, c and u charts in one workbook: a chart selector, a sample size check, limits for each subgroup, signal flags and four worked examples.
- Gage R&R study sheet10 parts, 2 or 3 appraisers, 2 or 3 trials: EV, AV, GRR, PV, %GRR and ndc by the average and range method.
- Measurement uncertainty budget templateA GUM uncertainty budget: Type A and B rows, divisors by distribution, sensitivity coefficients, uc, νeff, k from the t-table, U, TUR and a guard band check.
- First article inspection (FAI) report templatePart information, a ballooned characteristic table with tolerances and results, material and process certificates, and sign-off.
- Pre-shipment inspection checklistThe last check before shipping: part, quantity, labels, packaging, paperwork and photos, then release.
- 8D report templateD0 to D8 with targets, containment counts, occurrence, escape and systemic causes, verified actions and a worked example.
- Poka-yoke worksheetEach step's errors and what they cost, the device (approach, function, method), payback, and a log that proves each device works.
- QA matrix templateDefect modes against stations in flow order: where each is made and first caught, a weight × occurrence × detection score, an AA to C class and the escapes flagged.
- Histogram templateReadings, bins set by the square root rule, a tally and counts, the spec limits drawn and the share out of spec, with the common shapes explained.
- Scatter diagram templateUp to 50 pairs with a group code, r and R², the least squares line, the quadrant count and r for each group.
- TQM self-assessment templateThe eight TQM principles in 24 statements you can check on the floor, scored 0 to 4 by several people, with the spread, the top 3 gaps and an action plan.
- 7 basic quality tools posterIshikawa's seven tools, each drawn and explained in one line.
- Poka-yoke types posterThe three poka-yoke methods with examples, and control versus warning devices.
- Jidoka and quality at the source posterDon't accept, make or pass on a defect, and the four steps of stopping at an abnormality.
- First piece (first article) check posterWhen to check the first part, the five steps before you run, and what to do if it fails.
- Defect escalation poster (red tag and stop the line)What to do when you find a defect, and an escalation ladder with times to fill in.
- PDCA cycle posterPlan, do, check, act as a cycle, with what to do in each step.
- First pass yield (FPY) calculatorFirst pass yield at each step and rolled throughput yield (RTY) across the whole process.
- Process capability (Cp, Cpk) calculatorCp and Cpk against your specification limits, plus Pp and Ppk from pasted measurements, with a distribution chart.
- DPMO and sigma level calculatorDPMO, defects per unit, yield and sigma level from the defects found, units checked and opportunities per unit.
Managing quality issues doesn't have to be painful
See how LeanSuite helps you deliver to your quality standards.