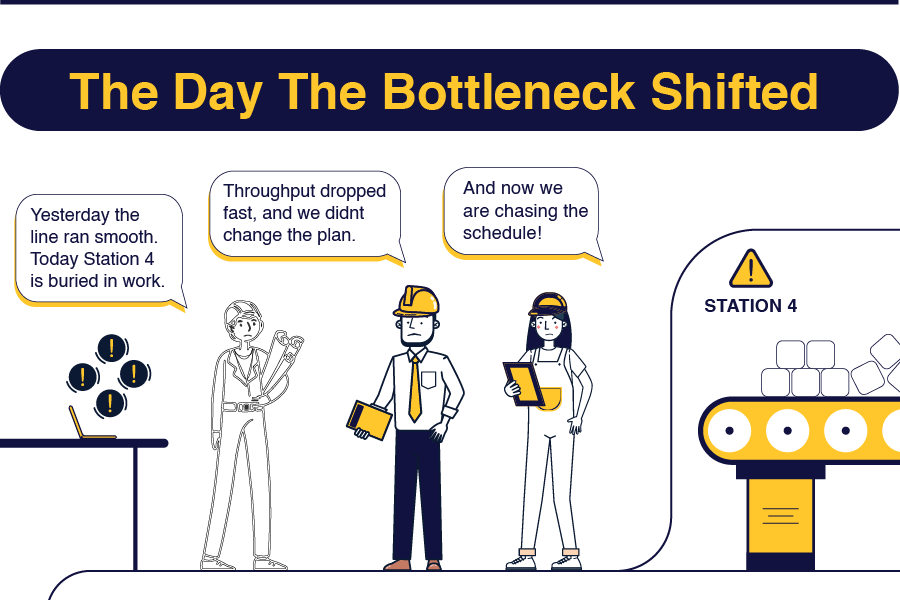
Production lines that ran perfectly yesterday can face order backlogs at Station 4 today. Throughput that reached 200 units yesterday may struggle to hit 140 units today. Bottlenecks appear overnight, forcing teams to scramble for constraint identification while production falls further behind schedule.
This scenario plays out daily in manufacturing plants worldwide. Production bottlenecks shift, hide, and multiply faster than most teams can respond, and the cost is staggering. Industry analysis found that manufacturers lose billions globally each year to production delays and bottlenecks caused by unmanaged constraints.
However, bottleneck elimination does not require massive investment or months of planning. The most effective strategies for elimination focus on key basics, daily identification, rapid response, and systematic prevention. Factories and plants that master these 3 elements observe throughput gains of 40-60% within quarters, not years.
This guide walks through five proven strategies for daily bottleneck management and elimination, highlighting methods to spot constraints before they impact schedules, respond within hours instead of days, and build systems that prevent recurring bottleneck occurrence.
By the end of this guide, a framework will be ready for implementation immediately.

Why Bottlenecks Keep Shifting
Most manufacturing teams think of bottlenecks as fixed problems where Machine 7 is always the constraint, station 3 always runs behind, or quality inspection always creates delays. In practice, the reality is far more complex. Bottlenecks move their positions based on product mix, staffing levels, material availability, equipment condition, and other factors on the floor. What constrained production Monday might run smoothly Wednesday, and what worked on the first shift might fail on the second shift.
This dynamic nature makes traditional bottleneck analysis obsolete by the time it is completed. Teams might spend two weeks studying the constraint, building a solution, and adjusting resources, only to discover the bottleneck has moved to a different process entirely.
Research from Chalmers University of Technology proves this point effectively. Their study compared static observation methods to real-time data analysis for bottleneck identification. The result showed that data-driven approaches outperformed observation by 37.84%.
The implications are clear. Daily bottleneck elimination requires systems that detect shifting constraints in real-time rather than week-long analysis producing outdated recommendations.
Consider what changes daily in manufacturing operations.
- Product mix varies based on customer orders
- Staffing levels fluctuate with absences and skill availability.
- Material quality differs between supplier batches.
- Equipment performance degrades gradually between maintenance cycles.
- Process parameters drift without constant monitoring.
The bottleneck that was resolved yesterday might return today under different conditions or move to the next weakest link in the process. Traditional approaches fail because they assume stability, identifying the constraint, implementing a fix, and moving on. Manufacturing operations are not stable systems but rather dynamic environments where constraints shift constantly.
Effective bottleneck elimination accepts this reality and builds responsive systems rather than one-time fixes.

Five Strategies for Bottleneck Management
Addressing dynamic constraints requires systematic approaches rather than reactive problem-solving. The following five strategies work together as an integrated system, each addressing a different aspect of constraint management. Implementation can begin immediately with existing resources.

Strategy 1: Real-Time Bottleneck Identification
Elimination cannot occur without rapid visibility into constraints. The first strategy focuses on detection speed to enable proactive intervention before significant production losses accumulate.
Traditional bottleneck identification relies on end-of-shift reports, weekly reviews, and manual observation. By the time constraint identification occurs, hours of production capacity have already been lost. Those hours are gone forever, and the lost throughput cannot be recovered.
Real-time identification changes the equation fundamentally. Instead of discovering bottlenecks after they impact production, manufacturing teams can see them forming and intervene before significant losses occur.

Measure 1 : Work-in-Progress Accumulation Tracking
The simplest indicator of a bottleneck is inventory piling up before a process step. If Station 4 consistently has 20 units queued while Station 5 sits idle, Station 4 represents the current constraint.
Floor walks every two hours provide visibility into where WIP (Work In Progress) accumulates. The pattern reveals the current bottleneck regardless of what prior analysis predicted. This approach takes 10 to 20 minutes per walk and catches approximately 80% of constraints.
For better visibility, simple counters at each station enable operators to track queue length hourly. When any station exceeds its normal buffer by 50%, supervisors can investigate immediately. This system requires minimal investment and provides continuous monitoring capability.
Measure 2 : Cycle Time Comparison
Measuring actual cycle time at each process step daily reveals constraints through the longest cycle time. However, single measurements provide insufficient data since cycle times fluctuate. Measurement every shift captures the dynamic nature of manufacturing constraints.
Creating a simple board showing cycle times across all stations and updating it at shift change provides visibility. When one station's time increases 20% above baseline, an emerging bottleneck has been identified for immediate attention before it fully restricts throughput.
Measure 3: Capacity Utilization Analysis
The station running at highest capacity typically represents the bottleneck. Tracking utilization by shift rather than by week or month captures the patterns that matter most, since daily variations often exceed long-term averages.
A station running at 95% utilization while others run at 70% is constraining the system. However, utilization can shift daily based on product mix. Monday's bottleneck might be Tuesday's underutilized resource if the product mix changes significantly.
Modern systems make this measurement easier through automated data capture. Digital platforms capture cycle times, queue lengths, and utilization automatically. Dynamic Dashboards show current constraints without manual calculation, and alerts notify supervisors when patterns indicate emerging bottlenecks.
The key principle remains consistent: see problems while they're forming, not after they've impacted production capacity.
Strategy 2: Five-Minute Bottleneck Response Protocol
Identifying bottlenecks quickly only matters when response is equally rapid. The second strategy focuses on immediate intervention to minimize throughput loss.
Most plants discover a bottleneck, schedule a meeting to discuss it, form a team to analyze it, and implement a solution days or weeks later. Meanwhile, the constraint destroys throughput every hour that passes without resolution.
Leading manufacturers use a five-minute response protocol instead. When bottleneck identification systems flag a constraint, the response is immediate and standardized through a structured three-step approach.

Step 1: Immediate Flow Control (Minutes 1-2)
Preventing the bottleneck from drowning in work requires slowing down upstream processes feeding the constraint. This stops queue buildup that worsens the problem and hides the root cause.
If Station 4 represents the bottleneck, slowing Station 3's output to match Station 4's capacity becomes necessary. While this temporarily reduces Station 3's utilization, overall system throughput is determined by the constraint, not by non-constraints running at maximum speed.
This approach seems counterintuitive to many managers. However, overproducing upstream creates inventory pileups, increases handling requirements, and obscures the real problem. Controlling the flow enables clear visibility into the constraint's actual nature.
Step 2: Resource Reallocation (Minutes 3-4)
Quickly adding capacity to the bottleneck through resource reallocation delivers immediate results. Moving a cross-trained operator from an underutilized station, bringing in a supervisor to assist, or deploying available personnel provides temporary relief.
Temporary help at a bottleneck delivers massive ROI. One lost hour at a constraint translates to one lost hour for the entire system, and that hour can never be recovered. The economics strongly favor paying overtime to prevent that loss in every scenario.
Checking whether alternative equipment can handle the bottleneck work provides another option. The equipment doesn't need to match the primary machine's speed or efficiency. Any capacity added to a constraint increases total system throughput. A slower backup machine running at 60% of primary speed still adds 60% more constraint capacity.
Step 3: Clear Immediate Obstacles (Minute 5)
Determining what's actually causing the constraint right now enables targeted intervention. Missing materials, tool problems, quality issues requiring rework, or operators struggling with unfamiliar work all represent solvable immediate causes.
Addressing the immediate cause provides value even when it's not the root cause. This intervention buys time to analyze and implement a permanent fix. Quick patches at a bottleneck restore throughput immediately, making them worthwhile despite their temporary nature.
One manufacturer cut response time from two hours to five minutes using this protocol. Their throughput increased 23% in the first month because constraints got addressed before causing significant losses. The system didn't require new equipment or major investment, just a faster response to visible problems.
The key principle is straightforward: respond in minutes, not hours or days.
Strategy 3: Theory of Constraints Application
The third strategy provides the framework for systematic bottleneck elimination. Theory of Constraints, developed by Eli Goldratt, remains the most effective methodology for constraint management despite being created decades ago.
TOC works because it focuses improvement efforts where they matter most. Most continuous improvement programs scatter resources across many small problems, diluting the impact. TOC concentrates resources on the one constraint limiting total system performance, delivering breakthrough results instead of marginal gains.

Step 1: Identify the System Constraint
The constraint exists wherever work accumulates and throughput drops. Using the identification methods from Strategy 1 provides data-driven answers rather than assumptions based on institutional knowledge.
Many plants believe they know their bottleneck but are often incorrect. Resources get focused on improvement in the wrong process while the real constraint continues limiting throughput. Data beats assumptions in every scenario.
Step 2: Exploit the Constraint
Getting maximum output from the bottleneck with existing resources represents the first improvement opportunity. This exploitation means eliminating any downtime at the constraint, ensuring highest quality inputs to prevent rework, optimizing setup and changeover procedures, keeping skilled operators assigned to the bottleneck, and maintaining buffer stock before the constraint.
Exploitation doesn't require capital investment. Rather, it focuses on using existing resources optimally. One plant increased bottleneck output 15% simply by ensuring the equipment never sat idle waiting for materials or operators.
Step 3: Subordinate Everything Else
This step is where most implementations fail. Subordination means running non-constraint resources below maximum capacity to support the constraint rather than maximizing individual machine utilization.
The entire production schedule should match the bottleneck's capacity. Overproducing upstream or running non-constraints at maximum speed to "improve their utilization" works against system optimization. Total system throughput equals bottleneck throughput, making all other considerations secondary.
This principle requires cultural change since managers naturally resist deliberately underutilizing equipment. However, utilization at non-constraints is operationally irrelevant. Only constraint utilization impacts throughput and profitability.
Step 4: Elevate the Constraint
When exploitation and subordination don't provide sufficient capacity, adding resources to the bottleneck becomes justified. This represents the appropriate time for capital investment decisions.
Buying another machine for the bottleneck operation, hiring dedicated operators, extending operating hours, or outsourcing some bottleneck work all represent elevation options. However, investment should only occur after fully exploiting existing capacity. Most constraints can gain 20-40% more throughput through better management before requiring capital expenditure.
Step 5: Repeat When the Constraint Moves
Successfully elevating a constraint causes it to move to the next weakest link. This represents success, not failure. System capacity has increased, and the improvement process continues by identifying the new constraint and starting the process again.
Continuous improvement in this context means continuously managing the shifting bottleneck as each constraint gets resolved. One manufacturer applied TOC rigorously for 18 months, watching their bottleneck move four times as each constraint was elevated. Total throughput increased 88.8% over that period, not from working harder but from focusing improvement where it delivered maximum impact.
The key principle: concentrate all improvement efforts on the constraint until it moves, then concentrate on the new constraint.
Strategy 4: Value Stream Mapping for Bottleneck Prevention
The fourth strategy shifts from reaction to prevention. Value stream mapping reveals why bottlenecks form and how to prevent them from occurring in the first place.
Most bottleneck elimination is reactive in nature. Teams identify the constraint, fix it, and wait for the next one to appear. This cycle never ends because symptoms get treated without addressing root causes.
Value stream mapping changes the approach by visualizing the entire production flow from raw material to finished product. The map shows where value is added, where waste accumulates, and what creates constraints that limit throughput.

Step 1: Document Current State Reality
Walking the production process with a notebook and stopwatch to record actual cycle times rather than standard times provides the foundation. Noting every delay, every queue, and every handoff creates an accurate picture of current operations.
Mapping information flow alongside material flow reveals hidden constraints. Often the bottleneck isn't a physical process but an information delay. Waiting for approvals, drawings, quality data, or scheduling decisions creates constraints as damaging as machine capacity limits.
Special attention should be paid to batch sizes and changeover frequency, quality inspection points and rework loops, material handling and transportation distances, inventory levels between processes, and setup and teardown procedures.
Step 2: Calculate Process Capacity and Demand
For each process step, calculating available capacity per shift and comparing it to customer demand or downstream requirements reveals constraints and emerging bottlenecks. Where capacity falls below demand, the constraint has been identified.
However, analysis shouldn't focus on average capacity alone. Practical capacity accounting for changeovers, breaks, maintenance, and realistic utilization provides more accurate insight. Theoretical capacity assumes 100% uptime and zero losses, conditions that never occur in real manufacturing environments.
One plant discovered their "bottleneck" actually had adequate capacity. The real problem was excessive changeovers fragmenting available time. Reducing changeover frequency eliminated the constraint without adding any equipment capacity.
Step 3: Identify Waste Creating Constraints
Bottlenecks often result from waste more than from capacity limits. Common waste sources include overproduction upstream creating inventory that hides problems, transportation waste moving material excessive distances, waiting waste when processes depend on batch completions, defects requiring rework at capacity-constrained processes, and motion waste with poor ergonomics slowing operators.
Eliminating the waste often causes the bottleneck to disappear entirely. This approach costs far less than purchasing new equipment while delivering equivalent or superior results.
Step 4: Design Future State
Mapping how production should flow with waste eliminated and constraints addressed focuses on continuous flow where possible instead of batching, pull systems triggering production based on actual demand, balanced workload across process steps, quick changeover enabling smaller batches, and quality at source preventing defects from reaching constraints.
The gap between current state and future state becomes the implementation roadmap. Prioritizing changes that eliminate or prevent bottlenecks delivers maximum impact on system throughput.
Value stream mapping typically requires 2-4 weeks for a complete product family. The insights last much longer, revealing systemic issues that create recurring constraints rather than just current bottlenecks.
The key principle: prevent bottlenecks by eliminating the waste that creates them.
Strategy 5: Cross-Training for Flexible Capacity
The fifth strategy addresses the most common and preventable bottleneck cause: labor constraints.
According to Supply Chain Management Review analysis, 20.6% of US manufacturing plants can't operate at full capacity due to labor and skill shortages.
Cross-training creates flexible capacity that eliminates labor-based bottlenecks. When any process becomes constrained by available skills, shifting qualified people from underutilized areas provides immediate relief without capital investment.

Component 1 : Skills Matrix Visibility
Documenting who can perform which operations and at what skill level provides the foundation for flexible deployment. Using a simple color-coded matrix with green for fully capable, yellow for capable with supervision, and red for not trained creates clear visibility.
Updating the matrix weekly ensures accuracy. When absences occur or bottlenecks form, supervisors immediately see who can help. Without this visibility, capable people sit idle while bottlenecks restrict throughput.
Component 2: Prioritized Training Plans
Random cross-training delivers minimal value. Focusing on bottleneck and near-bottleneck operations first delivers maximum impact since training people on non-constraint processes doesn't increase system capacity.
Identifying the top three constraints and ensuring at least three people per shift can perform each constraint operation prevents single points of failure when key operators are absent. For near-bottleneck processes that become constraints when conditions change, training at least two people per shift provides adequate coverage.
Component 3: Deployment Flexibility
Cross-training only helps when people actually get redeployed as bottlenecks emerge. Many plants train operators extensively but never move them from their assigned stations, negating the investment entirely.
Empowering supervisors to reassign people during the shift based on current constraints enables the system to work. If Station 4 is backed up and Station 2 is idle, moving a cross-trained operator from Station 2 to Station 4 immediately addresses the constraint.
This approach requires culture change since operators often resist leaving "their" workstation. Management must communicate that flexibility serves everyone's interest by protecting throughput and employment stability.
Component 4: Deployment Intelligence Tools
Making redeployment decisions easy requires real-time data showing current workload, queue lengths, and available cross-trained staff. Supervisors can see instantly who can help where, eliminating guesswork.
Without tools, supervisors spend valuable time determining current constraints and available skills. By the time they figure out optimal deployment, the bottleneck has already cost significant production time.
Modern platforms provide live skills matrices filtered by current availability and proximity. When Station 4 becomes a bottleneck, the system immediately shows qualified operators within reasonable distance who could provide assistance.
One manufacturer implemented systematic cross-training focused on their top five constraint operations. Within six months, labor-related bottlenecks dropped 60%. The improvement came not from hiring more people but from deploying existing staff more effectively based on real-time constraints.
The key principle: build flexible capacity through skills development, not just through equipment investment.
Measuring Bottleneck Elimination Success
Effective strategies require measuring progress to validate results and guide continuous improvement. Four metrics matter most for bottleneck elimination assessment.

Metric 1: Overall Equipment Effectiveness
OEE combines availability, performance, and quality into one comprehensive metric. When bottleneck elimination succeeds, OEE increases because constraint resources achieve higher utilization with fewer disruptions.
Tracking OEE daily at the identified bottleneck provides clear visibility. A 30% OEE gain at the constraint typically translates to 20-25% throughput improvement system-wide since the constraint determines total capacity.
Metric 2: Production Throughput
Measuring units completed per shift or day provides the ultimate test. Did bottleneck elimination actually increase output, or did the constraint simply move without gaining system capacity?
Tracking throughput across multiple shifts and product mixes validates strategy effectiveness. Strong bottleneck strategies increase throughput consistently, not just under ideal conditions.
Metric 3: Cycle Time Reduction
Measuring time from order receipt to shipment reveals system-level improvement. Bottleneck elimination should reduce total cycle time even when individual process times remain unchanged.
The improvement occurs because removing constraints eliminates waiting time between processes. Material flows continuously instead of accumulating in queues, reducing overall cycle time dramatically.
Metric 4: Constraint Resolution Time
Measuring how quickly emerging bottlenecks get identified and addressed provides a process metric that predicts throughput results. Plants that cut constraint resolution time from days to hours see immediate throughput gains.
The faster emerging bottlenecks get resolved, the less production time they cost. This metric also reveals whether the organization is building systematic capability or just solving individual problems.
Research shows manufacturers implementing systematic bottleneck elimination achieve 56-89% production increases with 46% capacity enhancements. These aren't marginal gains from working harder but breakthrough results from eliminating the constraints that were artificially limiting throughput.
Common Bottleneck Elimination Mistakes
Even with good strategies, common mistakes undermine results and waste improvement resources. These errors occur not from lack of effort but from deeply ingrained management habits and cultural assumptions about how manufacturing should operate. Recognizing and avoiding these patterns proves as important as implementing the right strategies.

Mistake 1: Optimizing Non-Constraints
Improving processes that aren't bottlenecks wastes improvement resources, since capacity added anywhere except the constraint doesn't increase system throughput. Maintaining focus on actual constraints proves challenging, since teams naturally want to fix every visible problem. However, effective bottleneck elimination requires concentrating effort on the one or two processes actually limiting throughput.
Mistake 2: Assuming Static Constraints
What represents the bottleneck today won't necessarily be the bottleneck next week. Successful elimination means the constraint moves to the next weakest link. Without tracking shifting constraints daily, teams optimize yesterday's problem while today's constraint destroys throughput. Building systems that detect moving bottlenecks rather than conducting one-time analysis prevents this mistake.
Mistake 3: Overproducing at Non-Constraints
Running upstream processes at maximum speed doesn't increase throughput and simply creates inventory pileups that hide problems and complicate workflow. Matching upstream pace to bottleneck capacity feels counterintuitive but achieves better results by maintaining system balance.
Mistake 4: Ignoring Information Bottlenecks
Physical process constraints get immediate attention while information delays get ignored despite creating equal impact. Waiting for approvals, specifications, or scheduling decisions constrains throughput as much as machine capacity limitations. Mapping information flow alongside material flow reveals these hidden constraints for systematic elimination.
Mistake 5: Analysis Paralysis
Some teams spend months analyzing bottlenecks before taking action. Meanwhile the constraint continues limiting production every single day, compounding losses. Perfect analysis isn't required for effective action. Identifying the obvious constraint and starting elimination immediately delivers results while analysis continues. Action beats analysis in bottleneck management.
Implementation Starting Point
Bottleneck elimination doesn't require months of preparation. Implementation can begin immediately with four simple actions. These four actions cost nothing and start producing results immediately. Executing them daily for two weeks reveals which strategies work best in the specific operation and enables refinement based on actual results.

Morning Floor Walk
Walking the production floor to note where inventory accumulates, where people stand idle, and where activity seems frantic, reveals current constraints faster than any report. Taking 15 minutes with a notebook and asking operators one question provides immediate insight: "What's slowing operations down right now?"
Quick Cycle Time Check
Picking the five main process steps and timing one complete cycle at each reveals the constraint through the longest cycle time. This measurement takes 30 minutes and provides data to guide improvement efforts immediately.
Implement Five-Minute Response
Briefing supervisors on the response protocol enables immediate action. When they spot a bottleneck forming, the standardized response occurs in five minutes: control upstream flow, reallocate resources, clear immediate obstacles. One meeting with one page of instructions starts the process today.
Track Throughput Daily
Counting units completed each shift and posting the number visibly creates accountability. When throughput increases, bottleneck elimination is working effectively. When it stagnates, effort is being applied to the wrong problems. Simple measurement drives focus better than complex analysis.
LeanSuite: A complete lean manufacturing software
Schedule Demo