

Guide and free templates
Hoshin kanri: meaning, X-matrix, catchball and free templates
Short answer
Hoshin kanri, also called policy deployment, strategy deployment or hoshin planning, is a lean method for turning a company's few most important goals into the work that every level does. Leaders and teams agree the goals and the plans in a back-and-forth called catchball, record them on a one-page X-matrix and check progress every month.
Why companies use it
Why companies use hoshin kanri
Most plants have more good ideas than people to carry them out. Hoshin kanri makes the choice on purpose: a few goals for the year, and only the improvement work that serves them. A project that serves no goal comes off the list, which frees time for the ones that do.
It also closes the gap between the office and the floor. A goal such as lower scrap or better on-time delivery means little to a supervisor until it has been turned into something that supervisor's area can act on, with a name against it. Hoshin kanri does that translation level by level, with the people who have to deliver the result.
And it sets a rhythm. The plan is drawn once a year and checked every month, so a target that is slipping shows up in the spring and not at year end.
The name is Japanese. Hoshin is a direction, like a compass heading, and kanri is management. The glossary entry has the short definition and our Japanese lean terms page has the pronunciation.
The process
How a hoshin kanri year runs
The longer version, with examples of each step, is in our post on the seven steps of hoshin kanri.
Step 1: Confirm the direction
Leadership writes down what the company is aiming at over the long run, often called True North. Everything else is checked against it.
Step 2: Set the long-term objectives
Pick the breakthrough objectives for the next three to five years. Three or four is enough. Each one is a result, not an activity.
Step 3: Set this year's objectives
For each long-term objective, decide what this year has to deliver, written as a number a person can check.
Step 4: Choose the priorities and the targets
List the few improvement efforts that will deliver the annual objectives, and the measure with a target that shows each one is working.
Step 5: Run catchball
The draft goes down to the departments and comes back with what they can commit to and what they need. It goes round until both sides agree.
Step 6: Fix the plan and name the owners
Put the agreed plan on the X-matrix with one owner for each priority. Each department then takes its part and plans its own.
Step 7: Run it, review it, learn from it
Daily management carries the work. The plan is reviewed every month on a bowling chart, stepped back from every quarter and reviewed at the end of the year, and what was learned goes into the next plan.
What was learned goes into next year's plan.
The one-page plan
The hoshin kanri X-matrix explained
The X-matrix puts the whole plan on one page. Four lists sit around a central X, and the grid in each corner shows which items on its two neighboring lists support each other.
- Corner A: Which annual objective serves which long-term objective.
- Corner B: Which priority delivers which annual objective.
- Corner C: Which target measures which priority.
- Corner D: Which target shows progress on which long-term objective.
Read it from number 1, clockwise. The words in each list are yours; the picture shows only where each list sits.
The four lists
- 1
Long-term objectives. The breakthrough objectives for the next three to five years. Keep them to three or four.
- 2
Annual objectives. What this year has to deliver toward each long-term objective, written as a result you can measure.
- 3
Top-level improvement priorities. The improvement efforts that will deliver the annual objectives. Each one has to connect to at least one annual objective, and a priority that connects to nothing comes off the list.
- 4
Targets to improve. The measures, each with a target, that show whether the priorities are working.
How to read it
Start at the bottom and go clockwise: a long-term objective, the annual objective that serves it, the priority that delivers that, and the target that shows it is working. A mark in a corner grid is a link. A row or column with no mark is a warning, either a priority with no objective behind it or an objective with nothing working on it.
Owners and resources
A grid down the right edge of the full matrix shows who owns each priority and which departments help. One owner per priority is the aim, even when several departments contribute. A priority with no name against it usually does not get done.
How big it should be
A workable matrix has three or four long-term objectives, four to six annual objectives and five to eight priorities. A matrix with far more than that is usually a list of every project in the plant.
Method and tool
Hoshin kanri is the method and the X-matrix is the page it is usually drawn on. The same matrix is also called a hoshin X-matrix or a policy deployment matrix. Layouts vary, and the links between the lists are what matter.
The free X-matrix template has the four lists, the corner grids and the owners ready to fill in. The post on how to build an X-matrix goes through the order step by step.
Agreeing the goals
Catchball: how goals are negotiated down and back up
Catchball is the back-and-forth that agrees goals and plans between levels. The name comes from tossing a ball: leaders pass a draft down, the level below passes it back with what it can commit to and what it needs, and the draft goes round until both sides can live with it.
Leadership
Departments
Teams in each area
- 1
Leaders send a draft, not a decree
The draft says the objective, the number and why it matters, and it is clear that it can still change.
- 2
Each department answers
What would it take? What can we commit to? What do we need, whether that is people, time, money or a decision somewhere else?
- 3
Leaders compare the answers
Where the commitments add up to the target, the objective stands. Where they do not, the objective changes or leadership finds what is missing.
- 4
The same happens one level down
Department leads repeat it with the teams under them, so the plan reaches the area where the work is done.
- 5
Stop when every target has an owner who agreed
A common pattern is to give departments two or three weeks to respond before the matrix is fixed.
Skip it and the targets are assigned instead of owned, so the first red month turns into an argument about whether the target was fair. More in the glossary entry on catchball and our post on the catchball process.
The monthly review
The hoshin kanri bowling chart for the monthly review
The X-matrix is drawn once a year. The bowling chart is how the plan is checked every month. It is a scorecard with one row per target, the planned value and the actual value for each month side by side, green when the actual meets the plan and red when it misses. The name comes from the way a row of monthly scores looks like a bowling score sheet.
| KPI | Row | Jan | Feb | Mar | Apr | May | YTD |
|---|---|---|---|---|---|---|---|
| OEE, Line 2 | Plan | 72% | 73% | 74% | 75% | 76% | 74% |
| Actual | 73%, on plan | 72%, off plan | 75%, on plan | 75%, on plan | 74%, off plan | 74%, on plan | |
| Recordable incidents | Plan | 0 | 0 | 0 | 0 | 0 | 0 |
| Actual | 0, on plan | 0, on plan | 1, off plan | 0, on plan | 0, on plan | 1, off plan |
- 1
Set the plan before the year starts
Spread each annual target across the twelve months. A ramp is more honest than a flat line when the improvement cannot land until later in the year.
- 2
Owners fill in the actual
Each target's owner enters the month's result before the review, so the meeting is spent on what to do, not on collecting numbers.
- 3
Go row by row
Green rows get a sentence. Red rows get the countermeasure the owner brought. Plant leadership reviews usually run 60 to 90 minutes.
- 4
Two reds in a row get an A3
A target that is red two months running gets an A3 and a named lead. The plan is not rewritten to turn the month green.
- 5
Step back every quarter
Look at the X-matrix again and ask whether the priorities are delivering the targets, or whether a priority is the wrong one.
More than eight to ten rows on a bowling chart usually means the X-matrix was not selective. See hoshin kanri review cycles for the monthly and quarterly routine in more depth.
From the plan to the floor
How hoshin kanri connects to daily management, kaizen and A3
A plan on a wall changes nothing until it reaches the daily work. Hoshin kanri connects to the rest of lean management in three places.
- Company goals
- Tier boards
- Daily issues
- Kaizen
- Results
Tier boards and daily management
The annual targets become the metrics that the tier boards show at each level, so a team's board carries the part of a target that its area owns. The tier board looks at yesterday and the bowling chart looks at the year. A number that is red at the huddle is raised there, and a problem the team cannot solve goes up to the next tier. Our post on tier boards explains how the tiers connect.
Kaizen
Each improvement priority is delivered through kaizen, which covers events, projects and the small daily improvements teams make. The priority names the problem worth solving and kaizen is how it gets solved.
A3
When a target is red twice, an A3 is the usual way to find the cause and agree the countermeasure. Some plants also write an A3 for each priority so the owner can show the problem, the target, the actions and the progress on one page. The A3 problem solving template is free.
A fair comparison
Hoshin kanri vs OKRs
Both ask a company to choose a few priorities and check progress often, and some companies run OKRs in the offices and hoshin kanri in the plants. They differ in what they set and how the goals travel.
| Aspect | Hoshin kanri | OKRs |
|---|---|---|
| Where it comes from | Japanese manufacturers, from the 1960s | Intel in the 1970s, then popularized by Google |
| Time frame | A three to five year direction, with a plan for the year | Usually a quarter or a year |
| What gets set | Objectives, the improvement priorities that deliver them and the targets, with an owner for each, on one page | An objective and a few measurable key results. How to reach them is mostly left to the team |
| How goals travel | Catchball between levels until the owner agrees | Teams usually write their own to line up with the company's, then share them openly |
| Ambition | Targets are plan figures. A red month gets a countermeasure and sometimes an A3 | Stretch goals are common, and a score below full marks is often expected |
| Review | A monthly bowling chart, a quarterly step back and a review at year end | Regular check-ins and a score at the end of the quarter |
| Fits best | Plants that already run tier meetings and kaizen, because it names the improvement work as well as the goal | Work where the route to the goal is not known in advance, such as product, sales and marketing |
If your plant already runs tier meetings and kaizen, hoshin kanri fits what you have. If the work is less repetitive, OKRs may fit better. Neither one works without an owner for every goal and a review that actually happens.
What goes wrong
Common hoshin kanri mistakes
Too many objectives
A matrix with twenty priorities is a to-do list. Cut until each remaining priority links to an objective and has a person with the hours to work on it.
No owner on the row
A priority or target with no name against it has nobody to bring a countermeasure when it goes red. Put one owner on each row, even when several departments help.
Skipping catchball
Targets that arrive from above without discussion get complied with or ignored. Give departments time to respond before the plan is fixed.
No monthly review
A matrix drawn in January and not looked at again is a poster. Hold the review every month at the bowling chart, including the months that went well.
Goals nobody can see at the floor
If supervisors and team leaders cannot see how their board relates to the company's goals, the plan lives in the office. Put the part of each target that an area owns on that area's board.
Rewriting the plan to turn red green
Changing a target mid-year hides the miss. Keep the plan, record the countermeasure, and change the plan only at the quarterly step back, with the reason written down.
Free download
Free hoshin kanri X-matrix and bowling chart templates
The X-matrix template comes as a printable PDF and an Excel file, and includes a bowling chart for the monthly review. The bowling chart also has its own page, with a sample and the questions people ask.
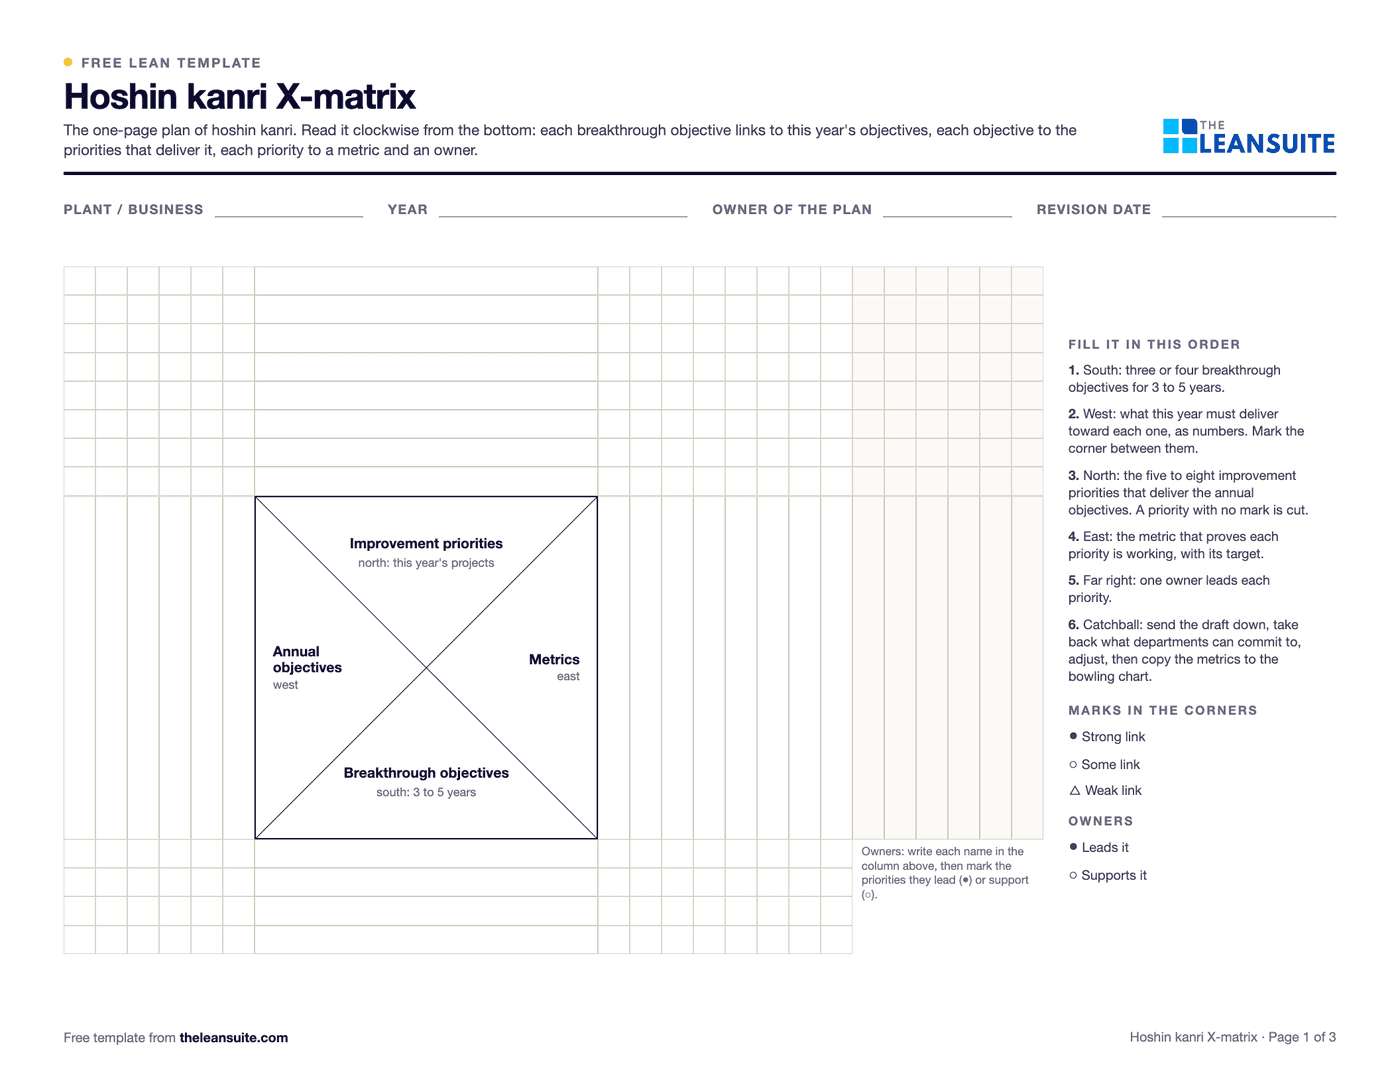 PDF and ExcelHoshin kanri X-matrix template with bowling chartA landscape sheet with the four lists, the corner grids and owners, a filled-in sample and a bowling chart. The Excel file checks each row and column for a missing link or owner, and colors each bowling chart month green or red against plan.Get the templateLean Studio boardHoshin bowling chartThe monthly scorecard as a board: a row per KPI with the plan and the actual side by side, green or red, and a year-to-date column. The page has a sample and the questions people ask.See the bowling chart
Templates that go with them
In LeanSuite
Hoshin kanri in LeanSuite
Six things you can do with your goals in LeanSuite.
A KPI on an X-matrix objective
You can attach a KPI to an objective on the X-matrix, so the objective has a number it is measured by.
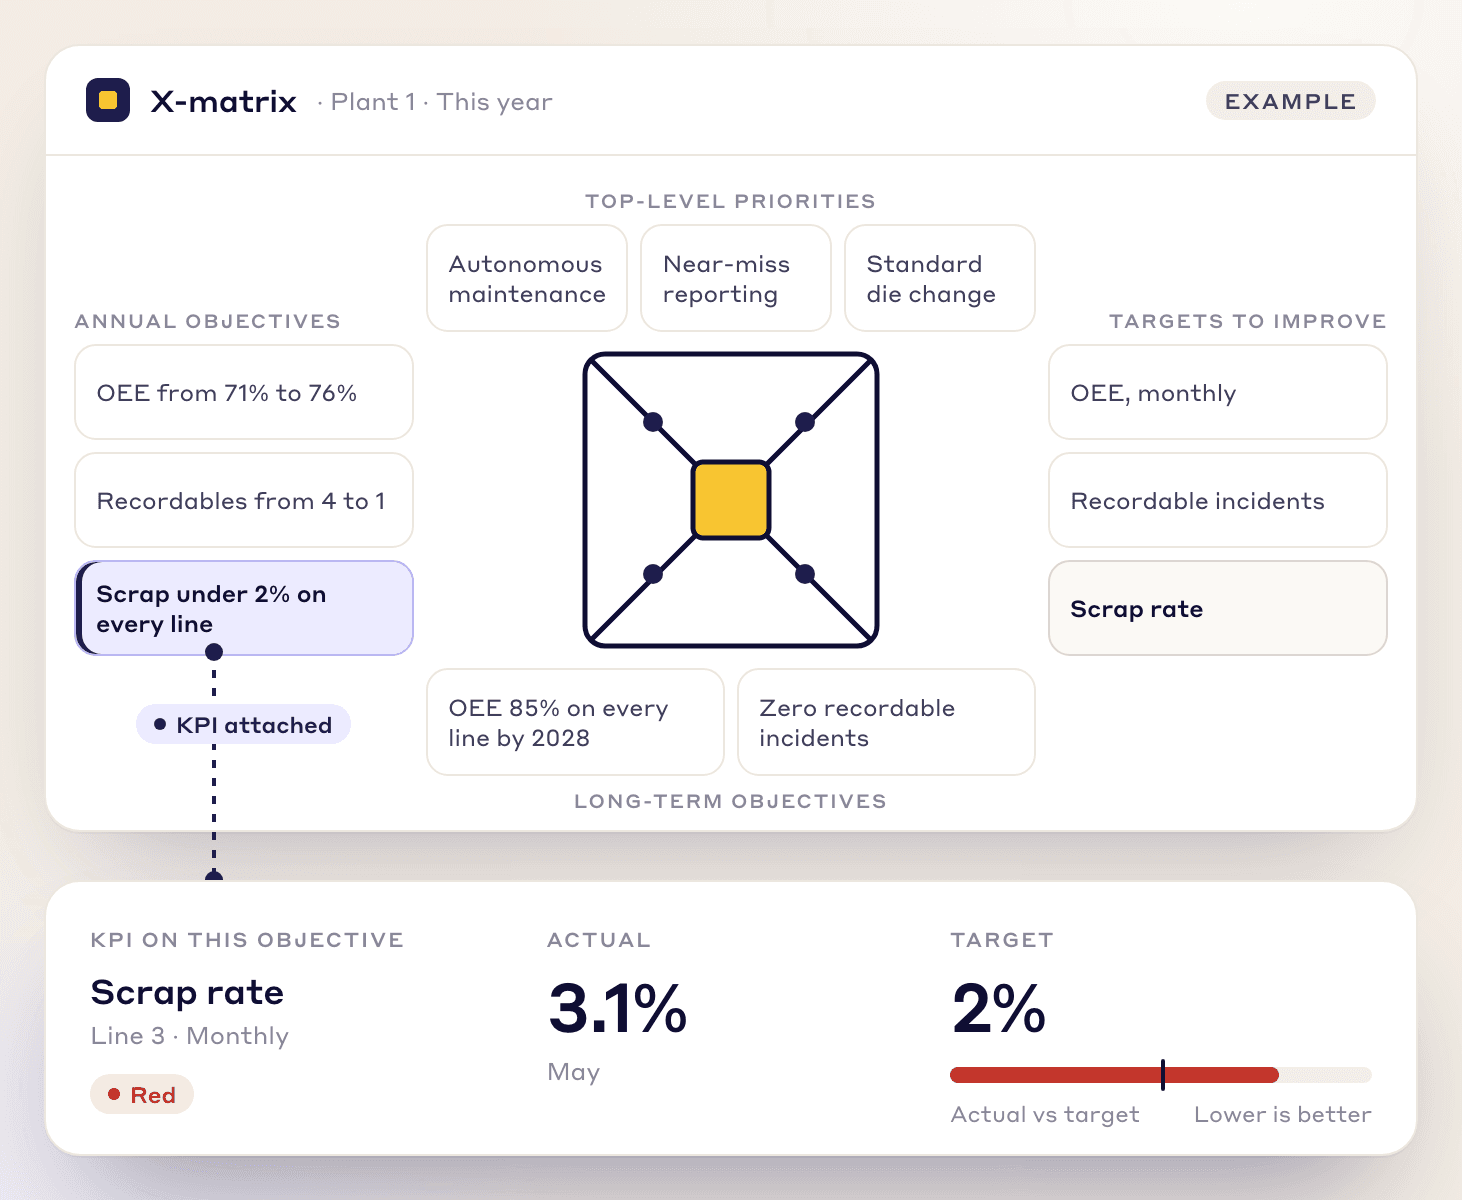
An example with sample data. A kaizen project tagged to a goal
You can tag a kaizen project to a goal, so the improvement work is linked to the goal it serves.
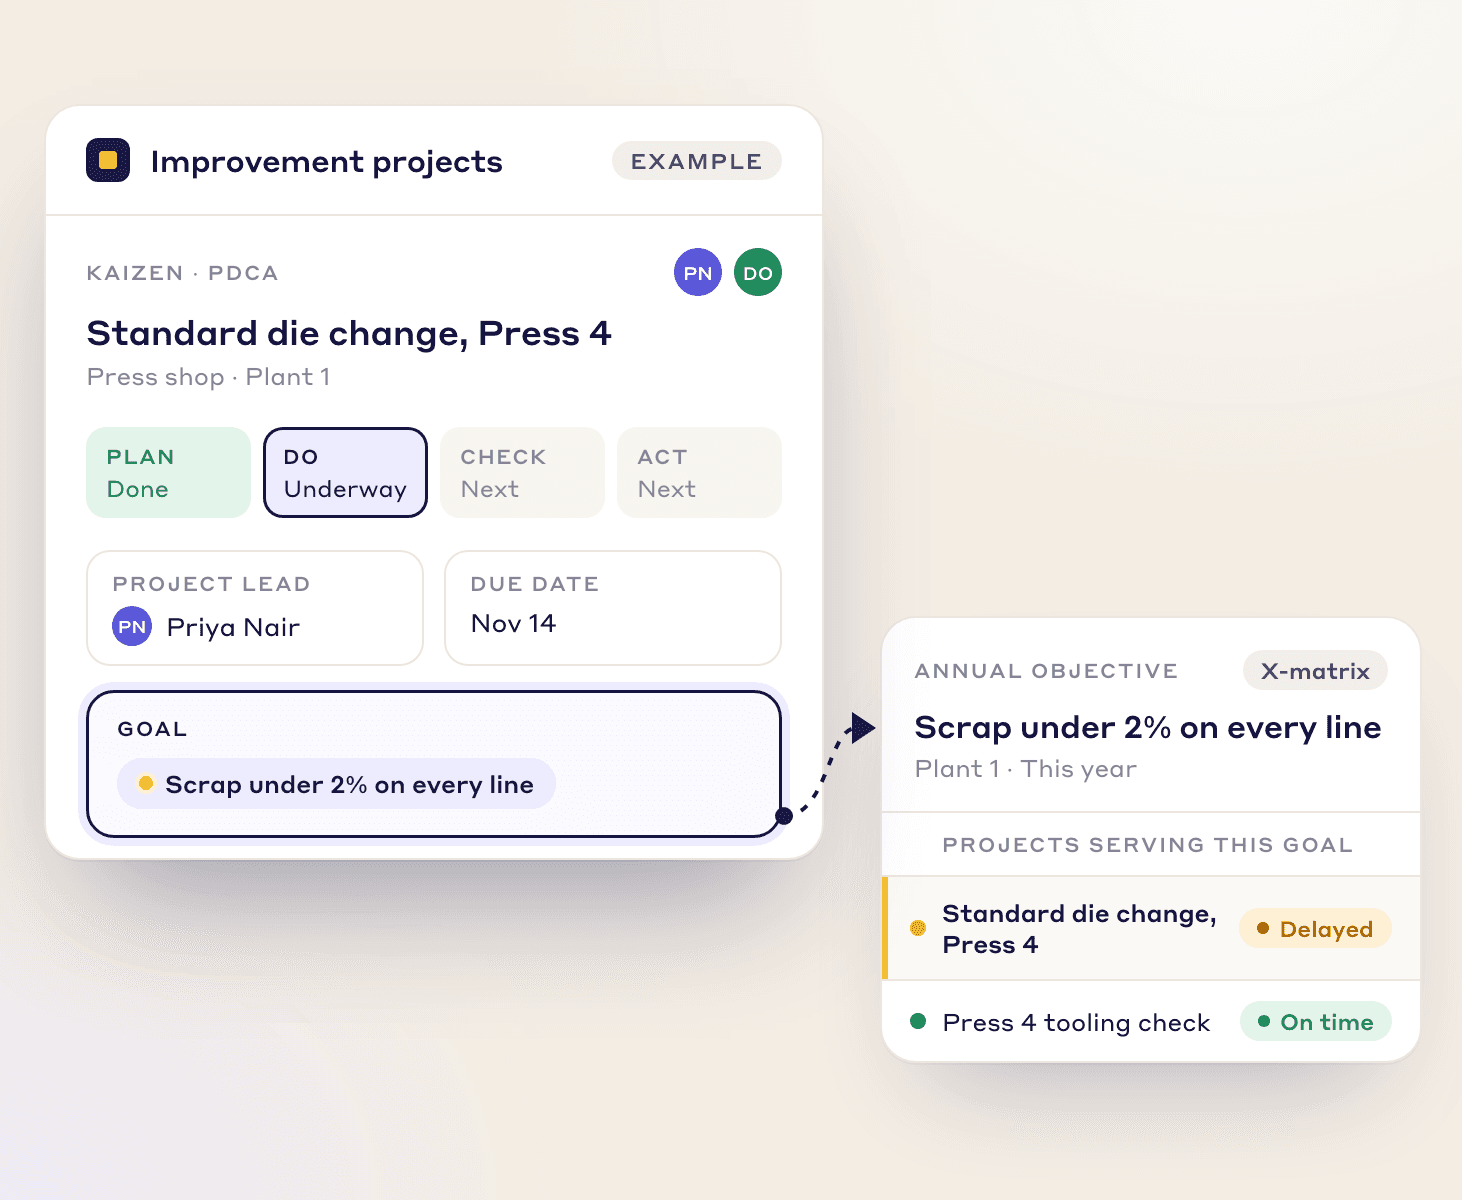
An example with sample data. An A3 started from a red KPI
You can start an A3 directly from a red KPI, so problem solving begins from the miss itself.
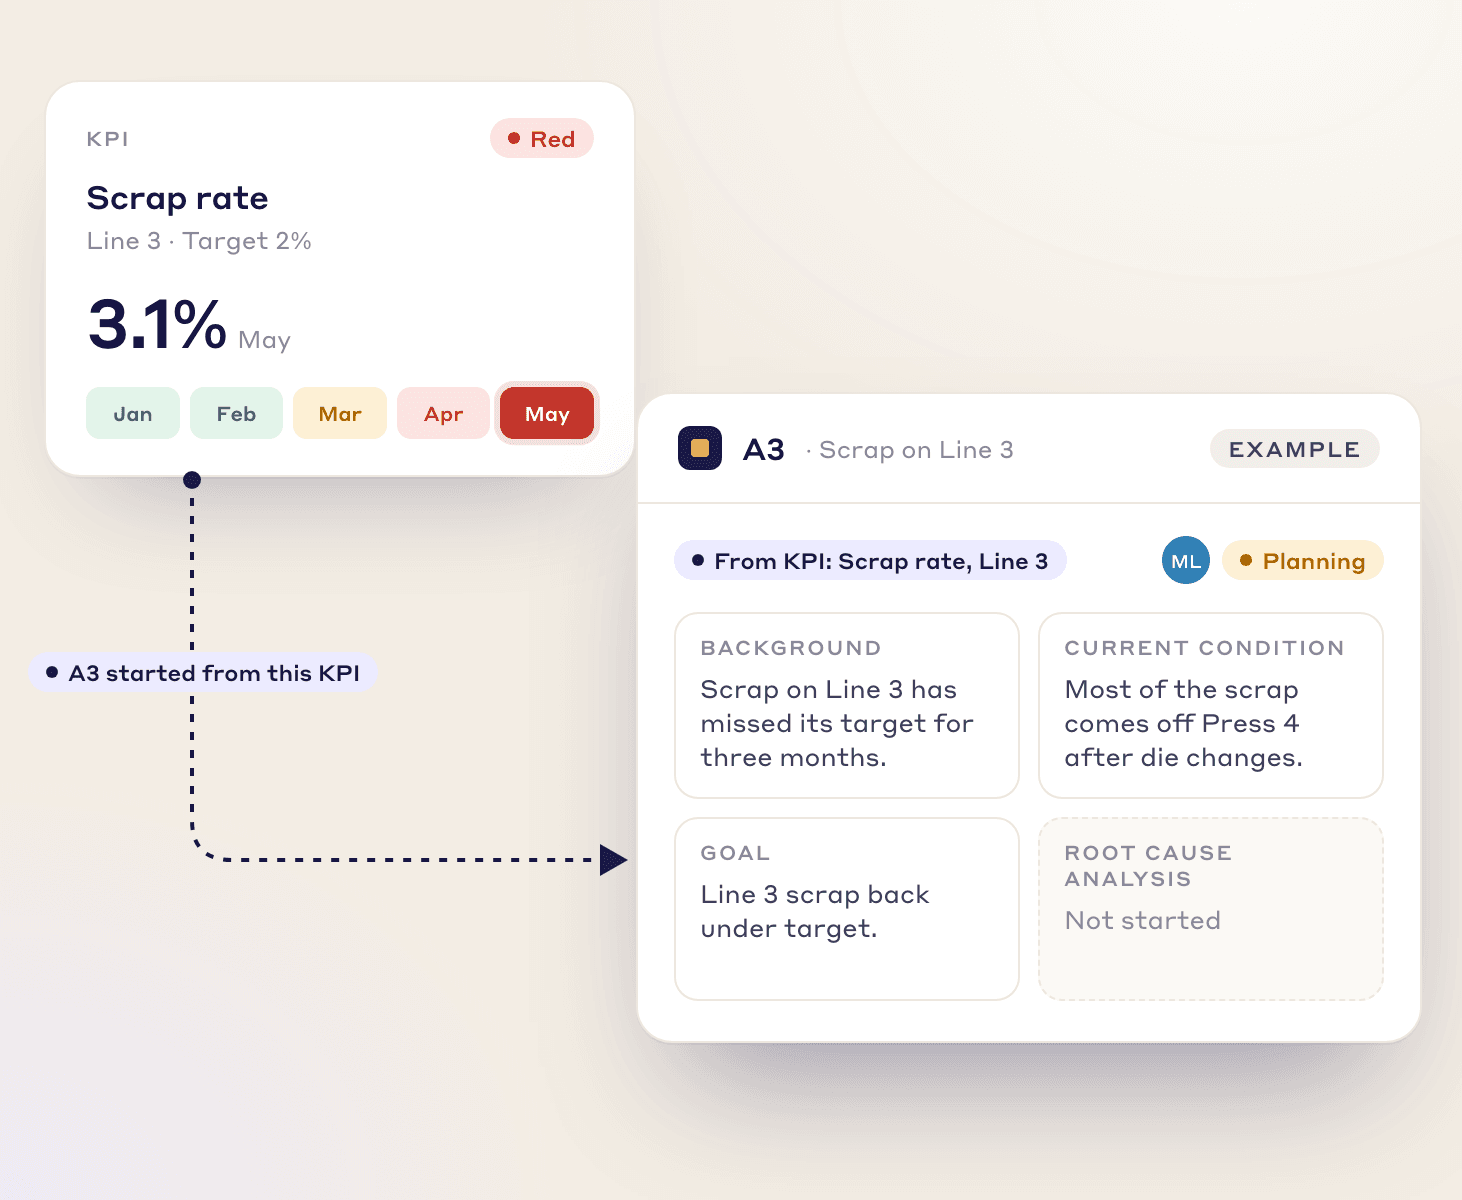
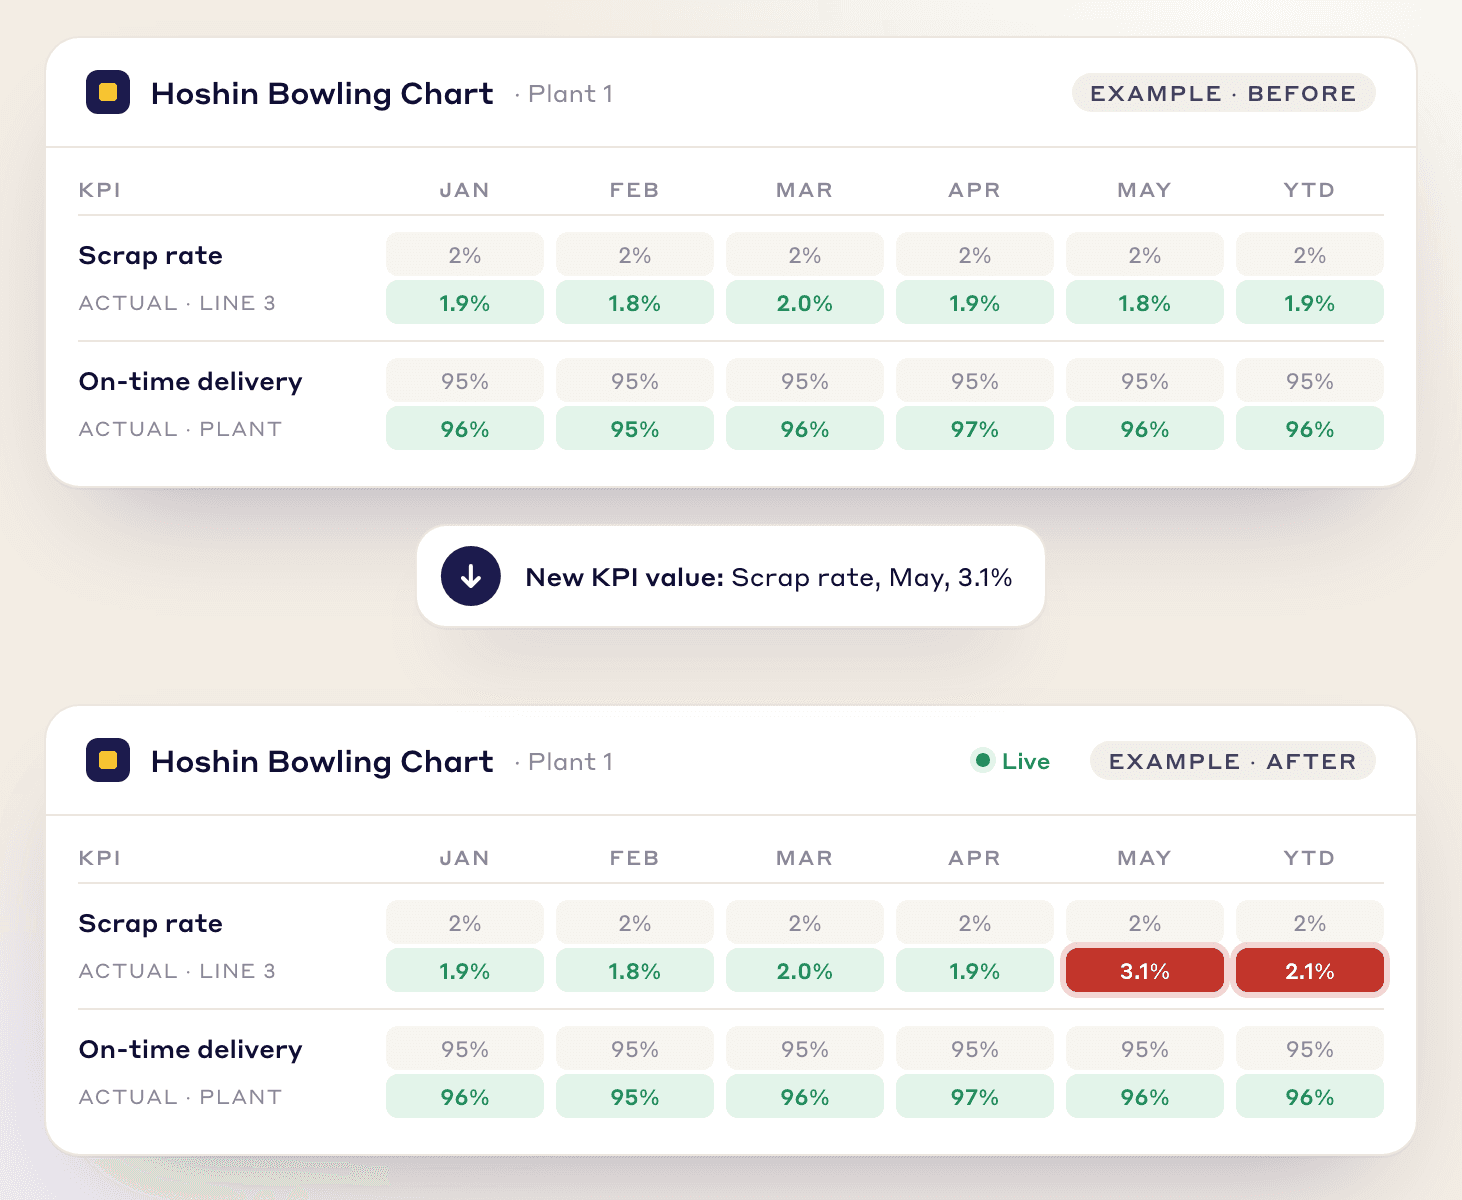
An example with sample data. Boards that update from KPI values
The boards update live from KPI values. When a KPI value changes, the board shows the change.
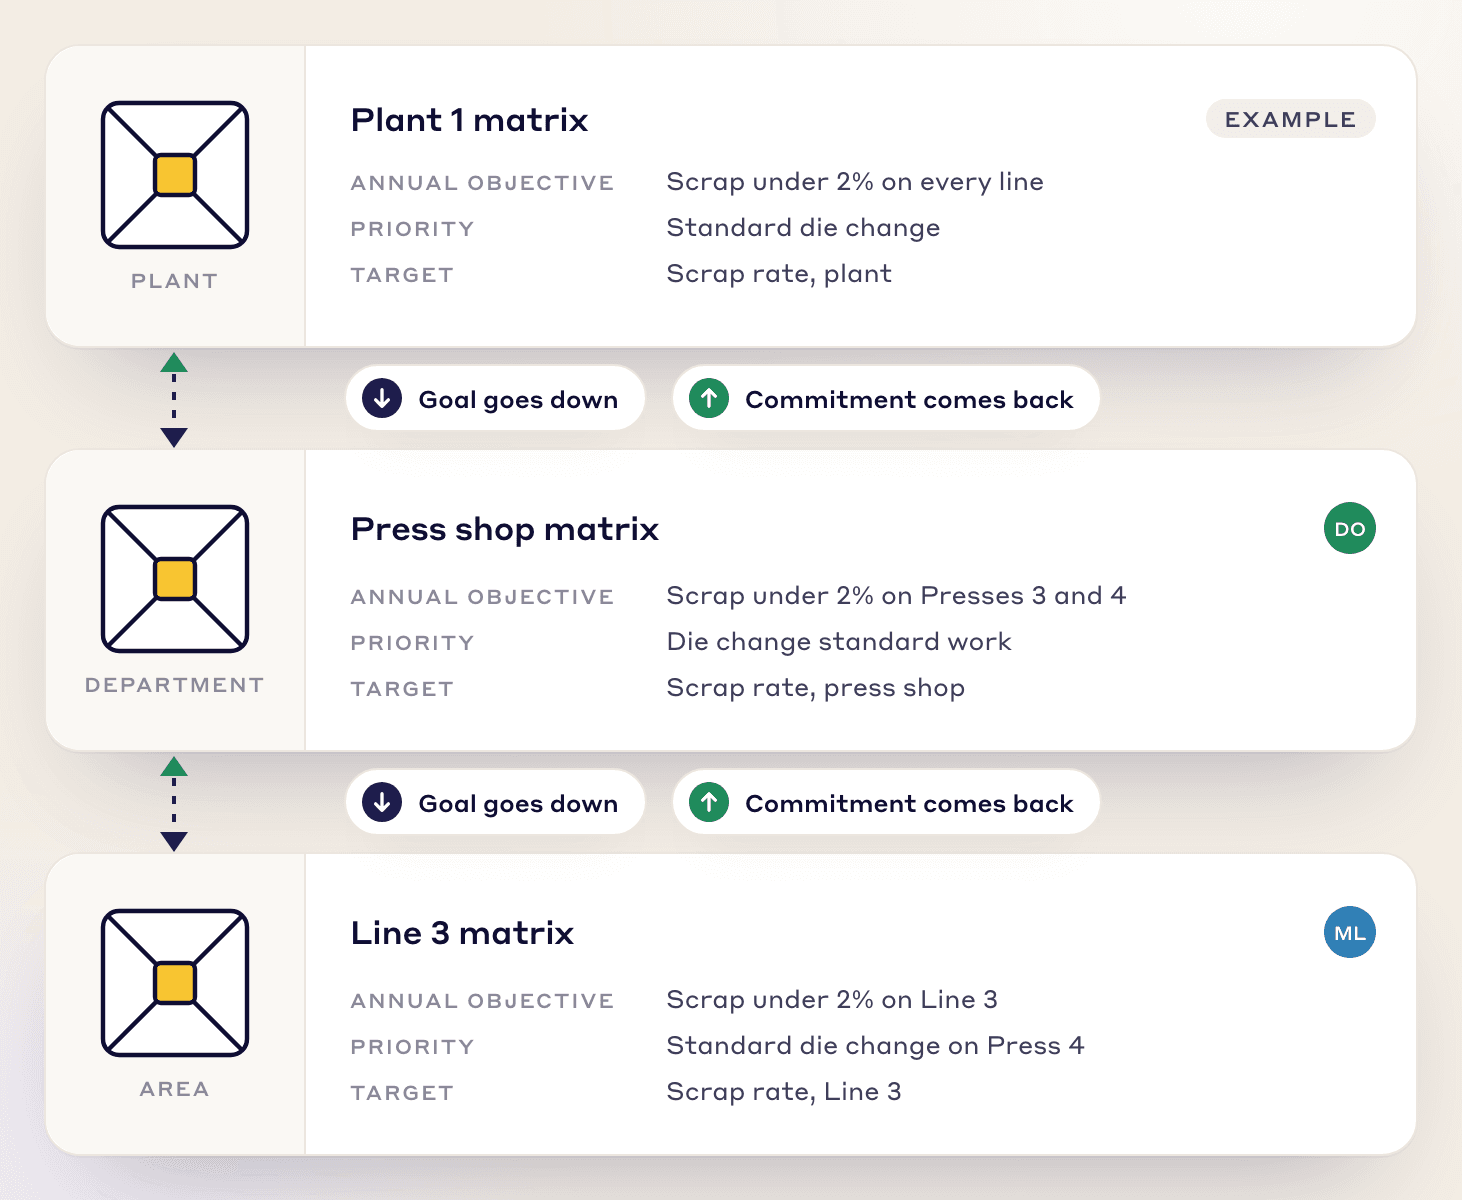
An example with sample data. A linked matrix at every level
Each level can have its own linked matrix, whether it is the area, the department or the plant, so catchball works in LeanSuite.
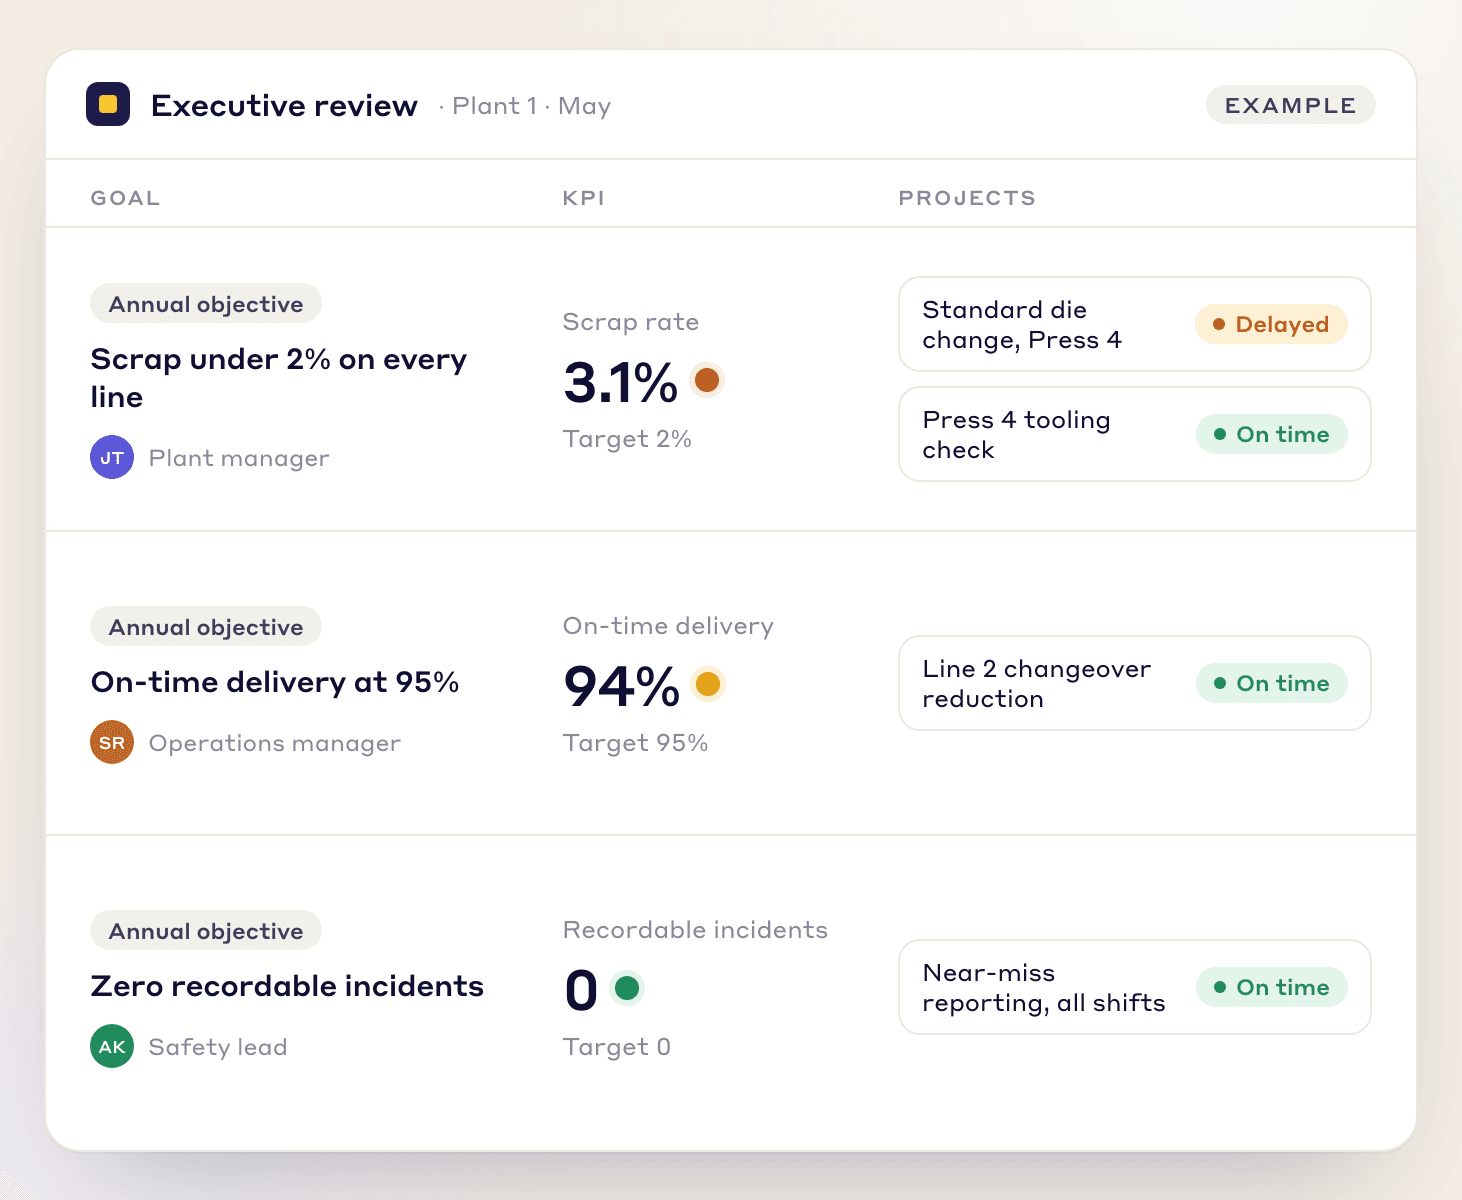
An example with sample data. One screen for the executive review
There is one screen for an executive review, with the goals, their KPIs and the projects on a single view.
An example with sample data.
Where to look next
Lean Studio has a Hoshin Kanri X-Matrix board and a Hoshin Bowling Chart board to start from, and department KPIs roll up to the plant and the company through KPI trees. Kaizen projects track owners, phases and savings, and the monthly review can run as a tier meeting on Lean Studio boards.
See it on your own goals
Try the interactive demo in your browser with sample data, or pilot LeanSuite on your own lines for 90 days, with the setup done by our team.
Read more on hoshin kanri
- Hoshin Kanri: The 7 Steps and the X-Matrix ExplainedThe year in seven steps, how to read the X-matrix and why deployments stall.
- How to Build an X-Matrix: Step-by-Step GuideThe order to fill it in, from the long-term objectives to the owners.
- Catchball Process: Hoshin Kanri Team AlignmentHow the two-way conversation turns a top-down plan into agreed targets.
- Hoshin Kanri Review Cycles: Monthly Quarterly GuidePlan, do, check and act at the monthly and quarterly reviews.
- Tier Boards: Cascading Daily Management in ManufacturingHow the daily boards connect from the team to the plant.
- Lean leadership and employee engagementAll our articles on hoshin kanri, gemba walks and leading on the floor.
FAQ
Questions about hoshin kanri
Want your goals and your daily boards on the same page?
Bring your X-matrix or your annual goals, and we will show you on a call how they link to KPIs and kaizen in LeanSuite.