
















Manual KPI reporting

You spend Monday retyping numbers the plant already has

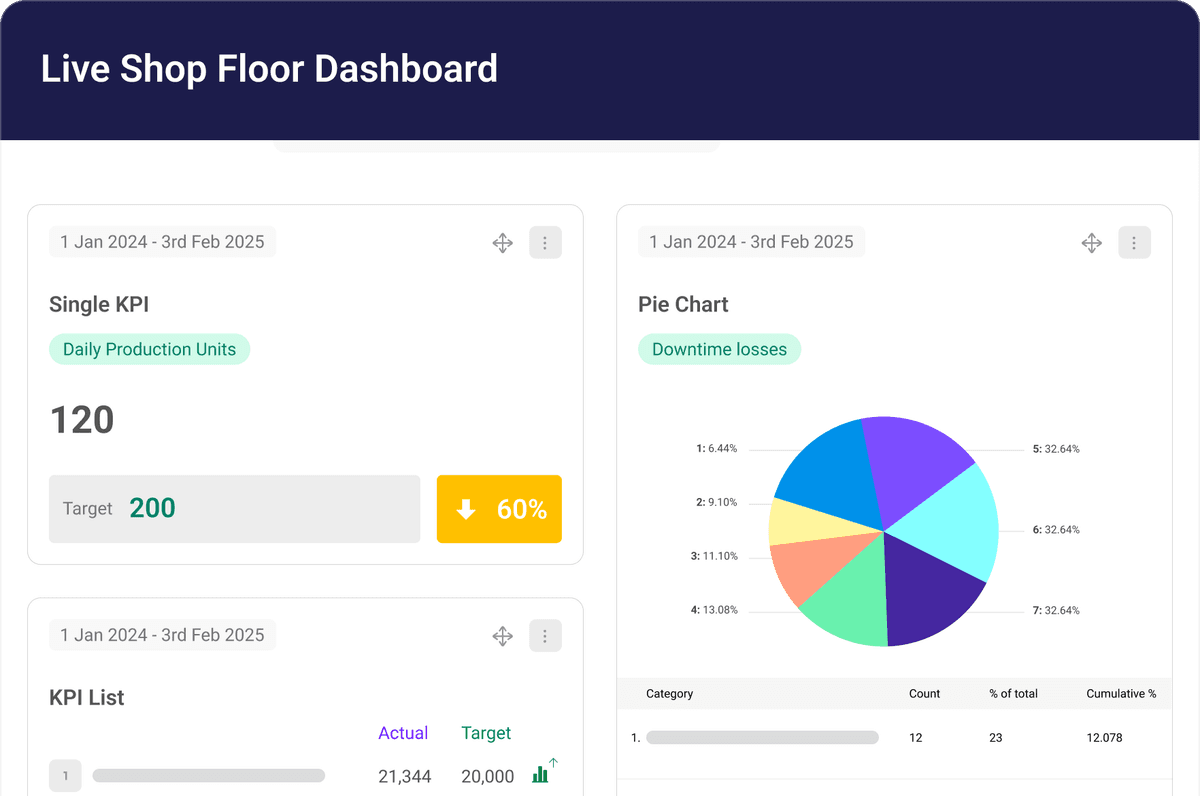
The figures already exist in a sheet, a SharePoint file or a machine system, and somebody keys them in again anyway. Give the plant a manufacturing KPI dashboard that fills itself, so that hour goes back to acting on what it says.

By clicking "Schedule Demo," you agree to the use of your data in accordance with LeanSuite's Privacy Notice, including for marketing purposes.

Two reporting weeks

A manufacturing KPI dashboard, or another retyped Monday

Same numbers, same board, same meeting. The only difference is whether a person carries the data across by hand.

The weekly copy job

Imagine even when you go to any factory today, I'm assuming they have many different spreadsheets to look at many different types of data. Someone is writing that on the board or someone is putting that somewhere and then giving it to you to put it into a spreadsheet.

The board updates itself

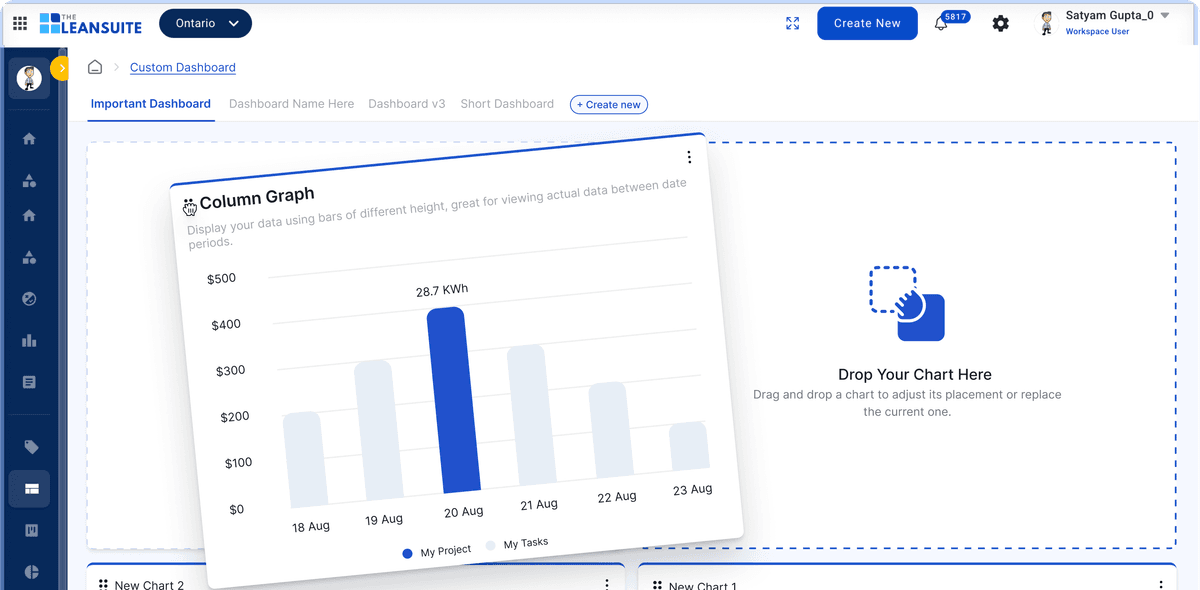
They pretty much just connect their account and link those columns, those sheets with the KPI, define the frequency and bring in the data automatically at that very frequency. So all they have to worry about is what are we doing once it's updated with that information. These dashboards are not just displaying numbers, but they're actually actionable things.

Sound familiar?

Monday gone, and the board still shows last week

For safety, they might have one spreadsheet with a dashboard built inside Excel. Quality might have another dashboard built somewhere else on someone's desktop. You collect ideas from the shop floor in a separate way and somebody separately manages them in a spreadsheet. With other dashboards or general dashboards you tend to forget things, and someone has to make notes somewhere else. Our thought process with that interactive dashboard is, during those huddles or during those whiteboard meetings, how do we get rid of pencil and paper and whiteboards?

Reporting by hand

The week starts with typing

Your first hours go into copying figures across instead of walking the floor.

Nobody trusts the board

Two versions of the same number exist and the meeting argues about which one is right.

Decisions on stale data

The chart arrives after the shift that caused the problem has already gone home.

Sources feeding the board

Point a KPI at its source

It could come from anywhere from LeanSuite, it could come from SharePoint, it could come from Google Drive, or manual entry.

KPIs you build yourself

Whether you want to see it in trend line, whether you want to see it in a donut chart, area chart, that will be up to you how you want to visualize that KPI. You can bring in multiple KPIs together and merge them together to build advanced KPIs as well.

Act inside the board

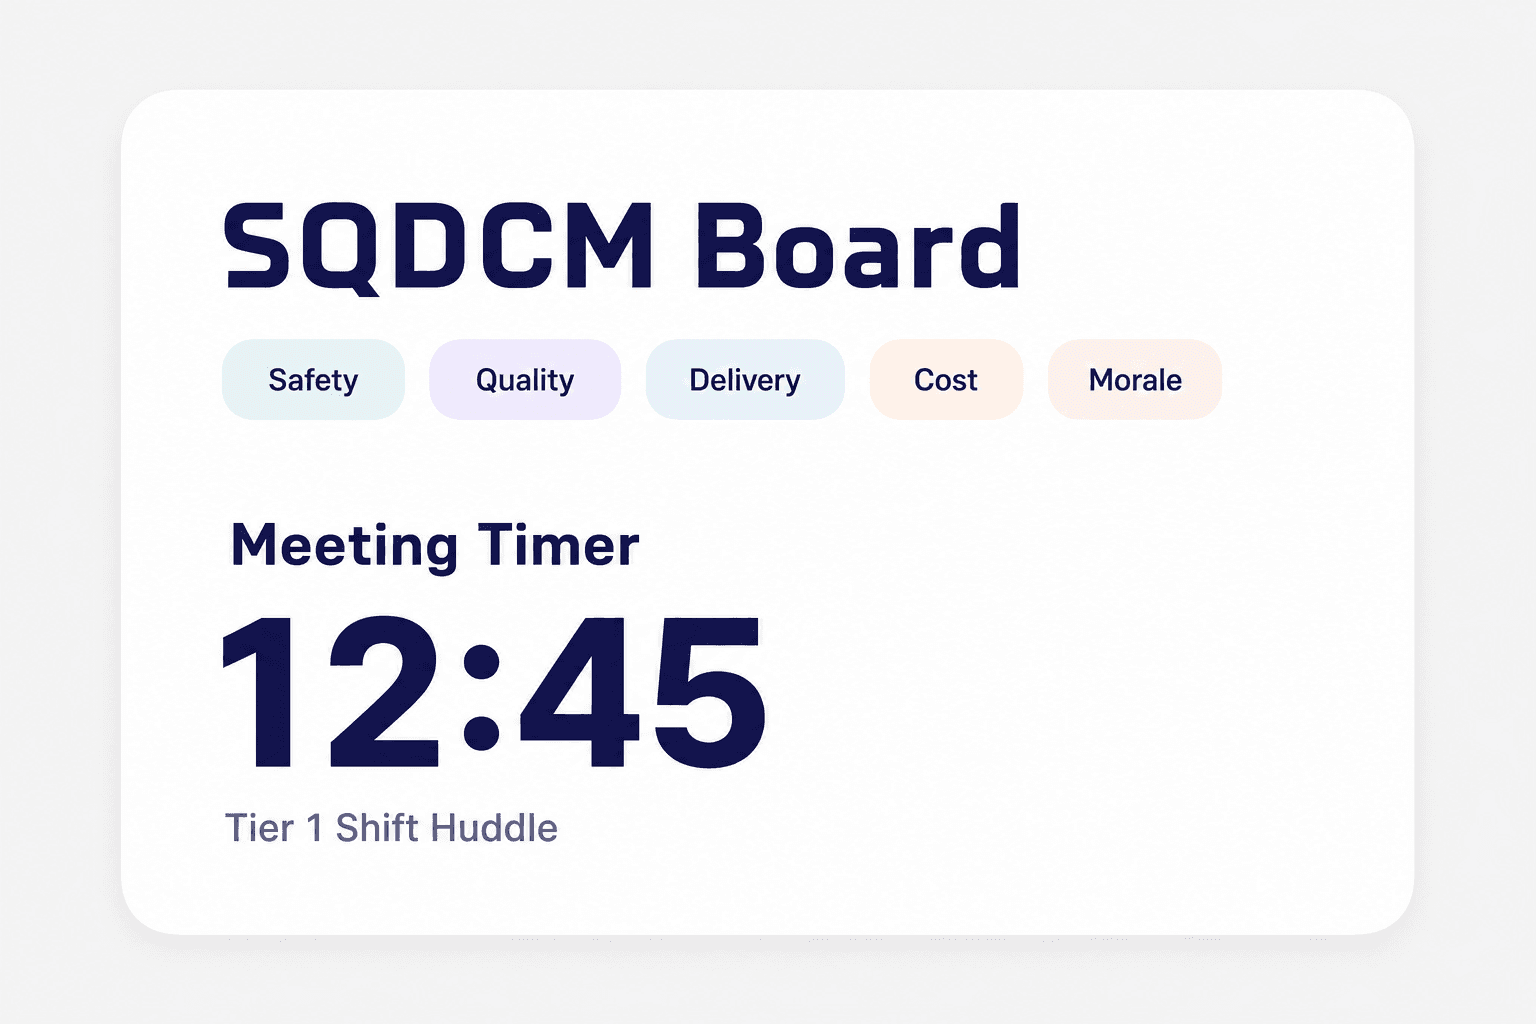
You could run the timer, that okay, let's just talk about main issues. They can add commentary, they can add any attachments and have the conversation. You would never have to leave these live dashboards and you're pretty much working on that meeting.

Sound familiar

Signs your reporting time beats your action time

How it works

From scattered sheets to a live board

There could be multiple KPIs that could be built in the system, and each KPI could have its own source, so to speak. So you could have a different Google Sheet or Excel Sheet somewhere, but it just brings everything all together in one platform so that the silos are broken down.

  1. Point each KPI at its source
  2. Build the KPI and its ranges
  3. Let the floor enter what has no system
  4. Run the meeting off the board

Step 1

Point each KPI at its source

So we can build those KPIs and then define what will be the source of that KPI. Is it another Google Sheet somewhere? Is it a manual entry that we want right on the dashboard? Is it an Excel sheet on a SharePoint somewhere? Or is that KPI being tracked inside LeanSuite somewhere?

Step 2

Build the KPI and its ranges

Let's say if you're collecting defect information or you're collecting breakdown information or minor stop information, you're able to then build your own KPIs, what you want to see. So let's say if I want to see breakdowns per hour, I can actually build that KPI and put it on a dashboard to view it. And you'll be able to define, is upward trend better, downward trend better, what's your rag score, so red, amber and green.

Step 3

Let the floor enter what has no system

They're able to manually put that information as well if you don't want to connect it to any Excel sheet or any other KPI within LeanSuite, just to give that ownership that, hey, you have to come to this dashboard and just update this information. There's no user limit, so everybody has access to it, and usually we encourage that everybody in the facility should have access.

Step 4

Run the meeting off the board

Let's say if you're running a meeting, you could be like, okay, we're only going to run this for five minutes, and then have conversation around that. Do we have any open items from last week? You could work on those open items right from the dashboard itself. And if there's a conversation that's going on that needs this part by next week, it would date stamp you that information and you could pin that information until next week. So it just helps you in carrying out those meetings versus this being simply charts.

Lean Studio board used to run a tiered meeting with live KPIs

What gets tried first

Why the usual fixes fade

1

One master spreadsheet

Not everybody has access to the file, and the person who keeps it is off some days. Cells go stale, a second copy appears, and the meeting argues about which one is right.

2

A reporting tool on top

Yes, you're able to bring in the data, but now what do you do with that data? Dashboards generally are like, okay, we looked at this, now we go somewhere else to action.

3

A photo of the board in chat

It is fast for the shift, but somebody still types it into a sheet later. The history ends up scattered through a chat thread nobody can report on.

Angad Singh, Co-Founder of LeanSuite

From our co-founder

If someone is writing that on the board, or putting it somewhere and then giving it to you to put into a spreadsheet, might as well just put it on the dashboard.
Angad Singh, Co-Founder, LeanSuite

Where next

Three pages that replace the Monday retype

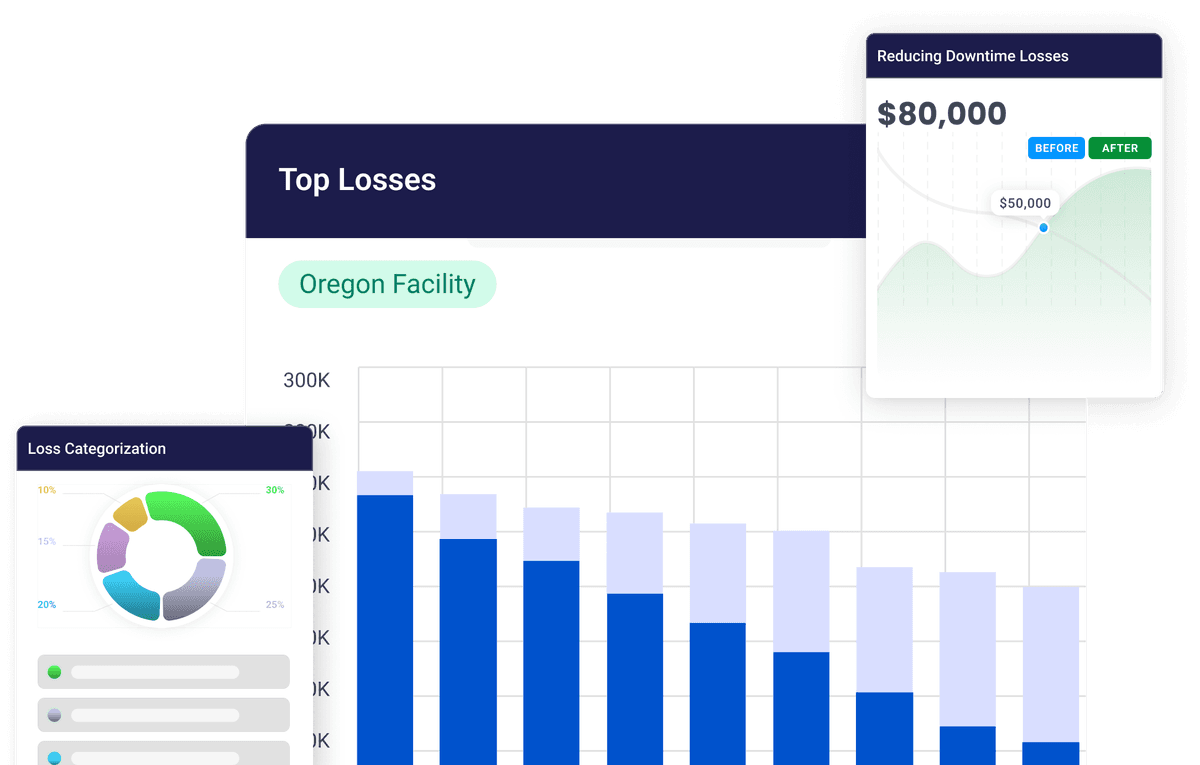
Each one takes a piece of the Monday job off your desk: the board that builds itself, the meeting that reads live numbers, and the losses those numbers point to. Start with whichever part of your week hurts most.

See your own KPIs on a live board

Bring one report you build by hand every week and we will show you where its data would come from instead.