
Whiteboard Fiction
Drawn VSMs reflect what people remember, not what happens.
Leansuite stitches video from each process step into a current-state VSM with cycle times, lead times, and inventory.
By clicking "Schedule Demo," you agree to the use of your data in accordance with LeanSuite's Privacy Notice, including for marketing purposes.
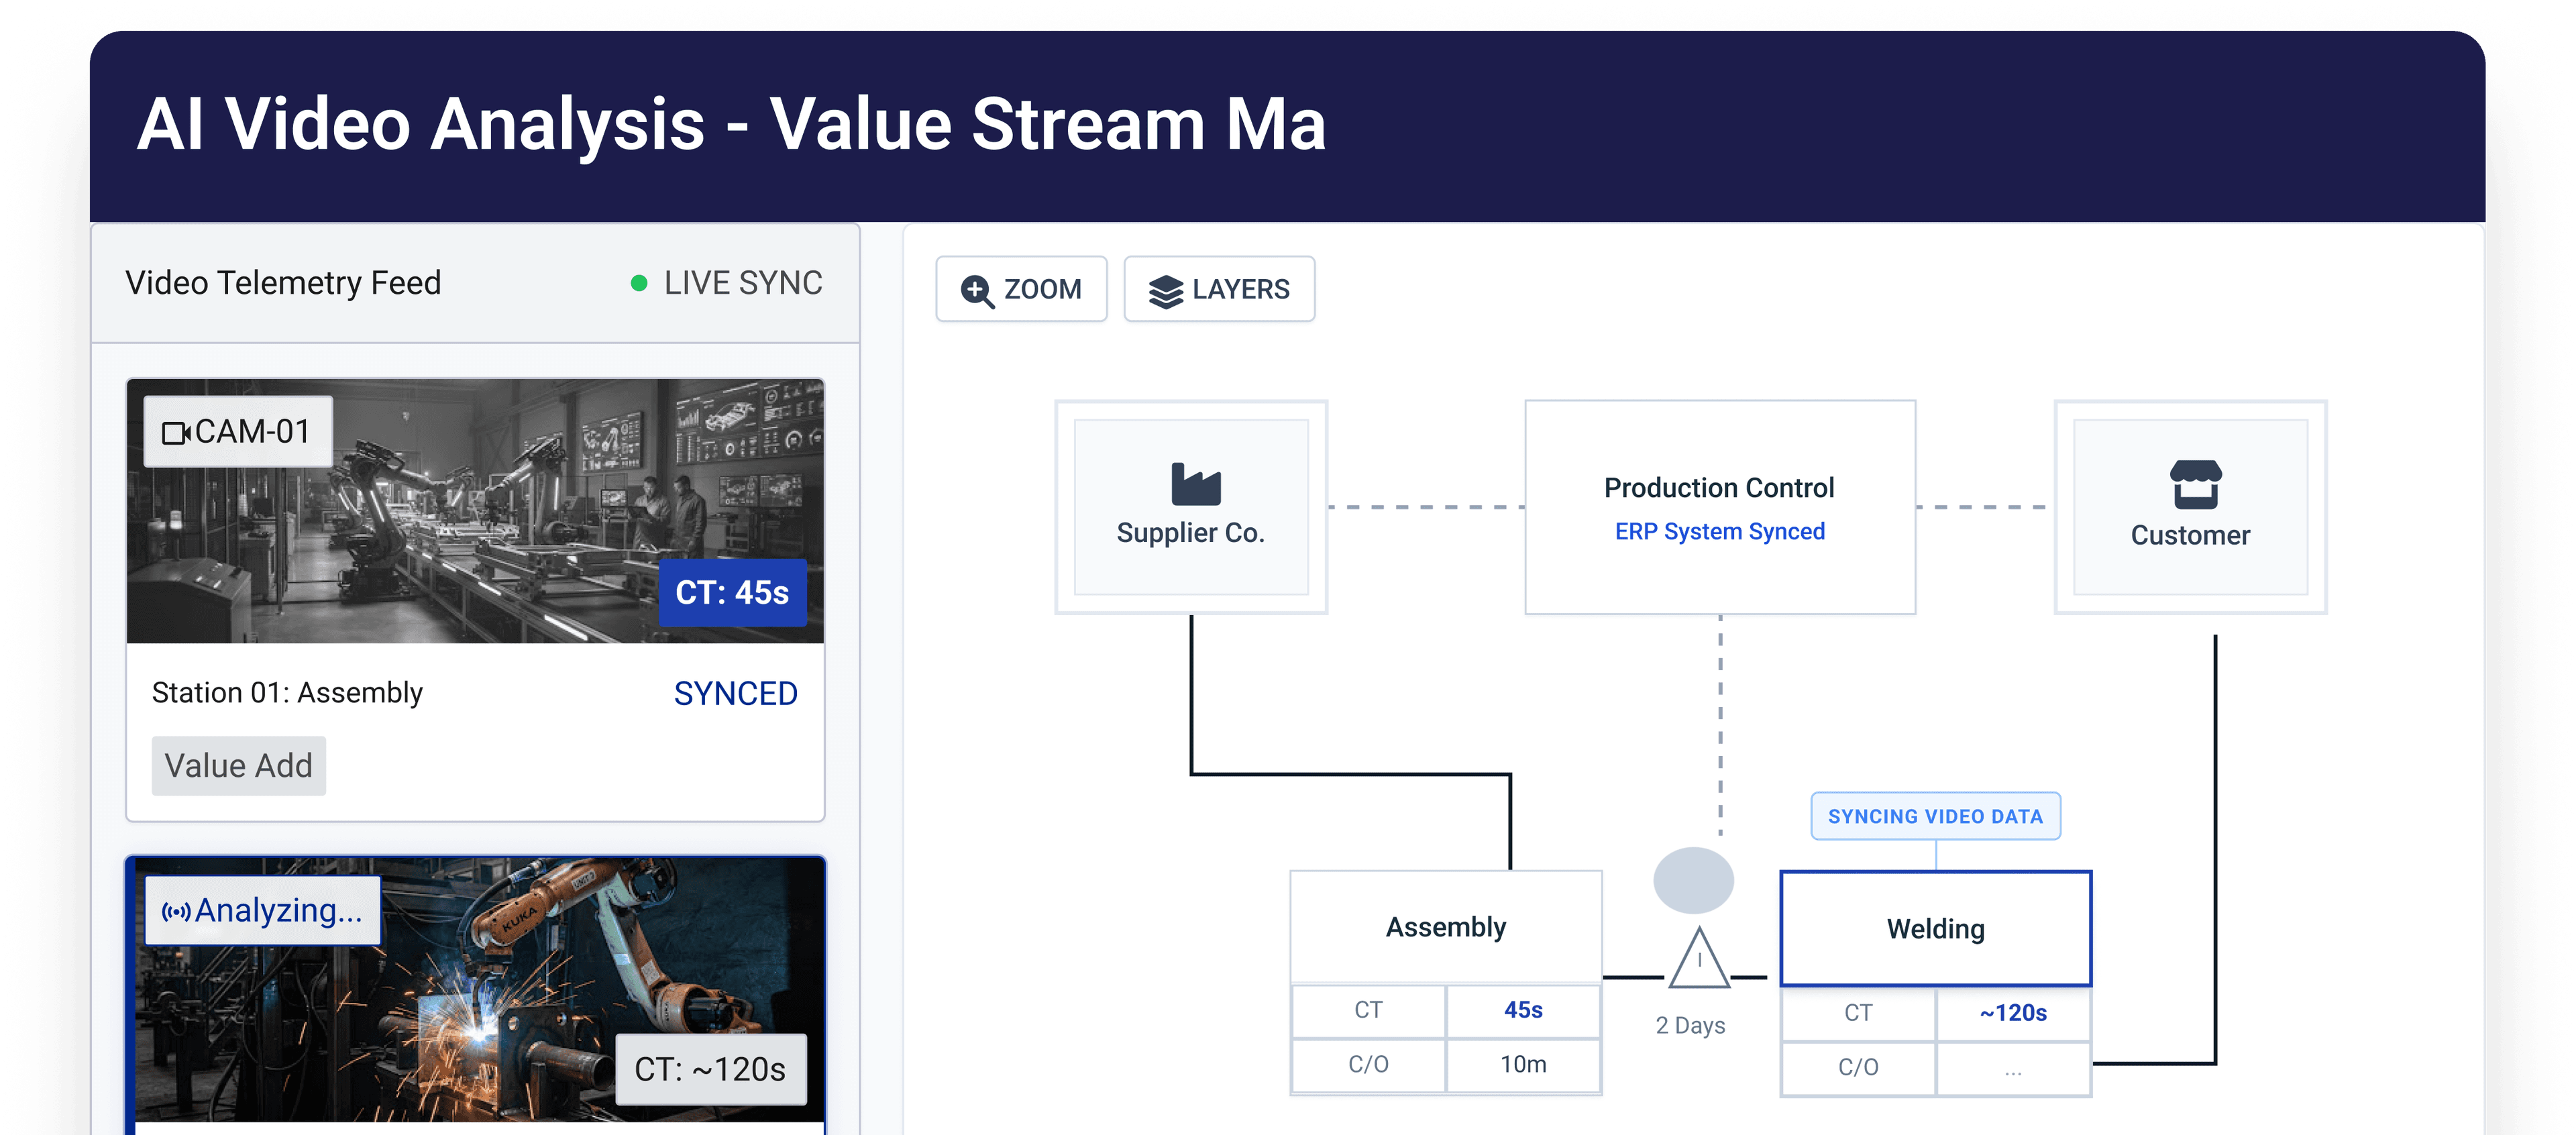
Value stream mapping
Why teams struggle with value stream mapping — and what Vision AI changes.
Drawn VSMs reflect what people remember, not what happens.
By the time the map is done, the process has changed.
Cycle and lead times are guessed, not measured.
How it works
From video upload to actionable output in three steps.

Film cut, weld, paint, assembly, and ship areas.
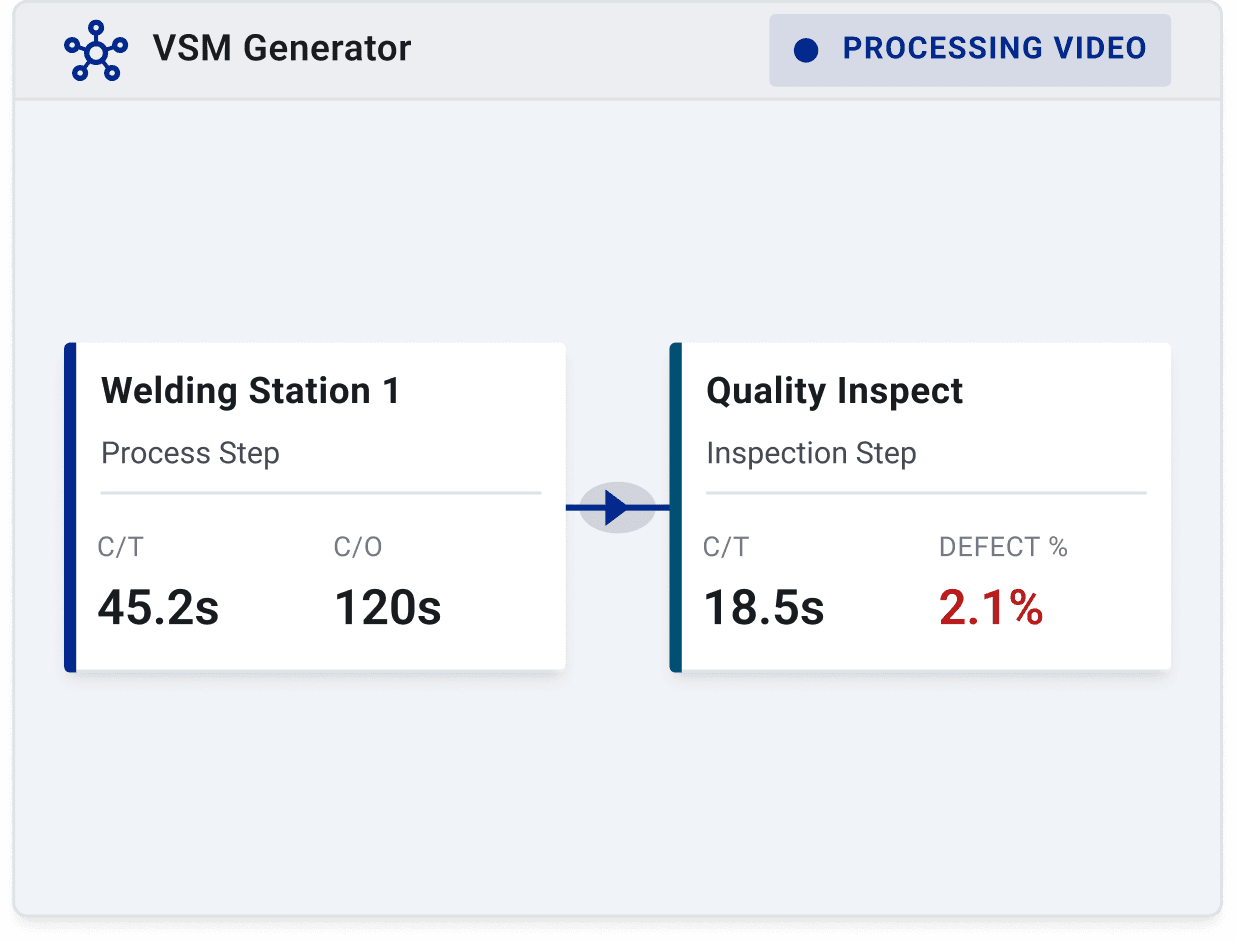
AI builds the flow with process boxes, C/T, and lead time.
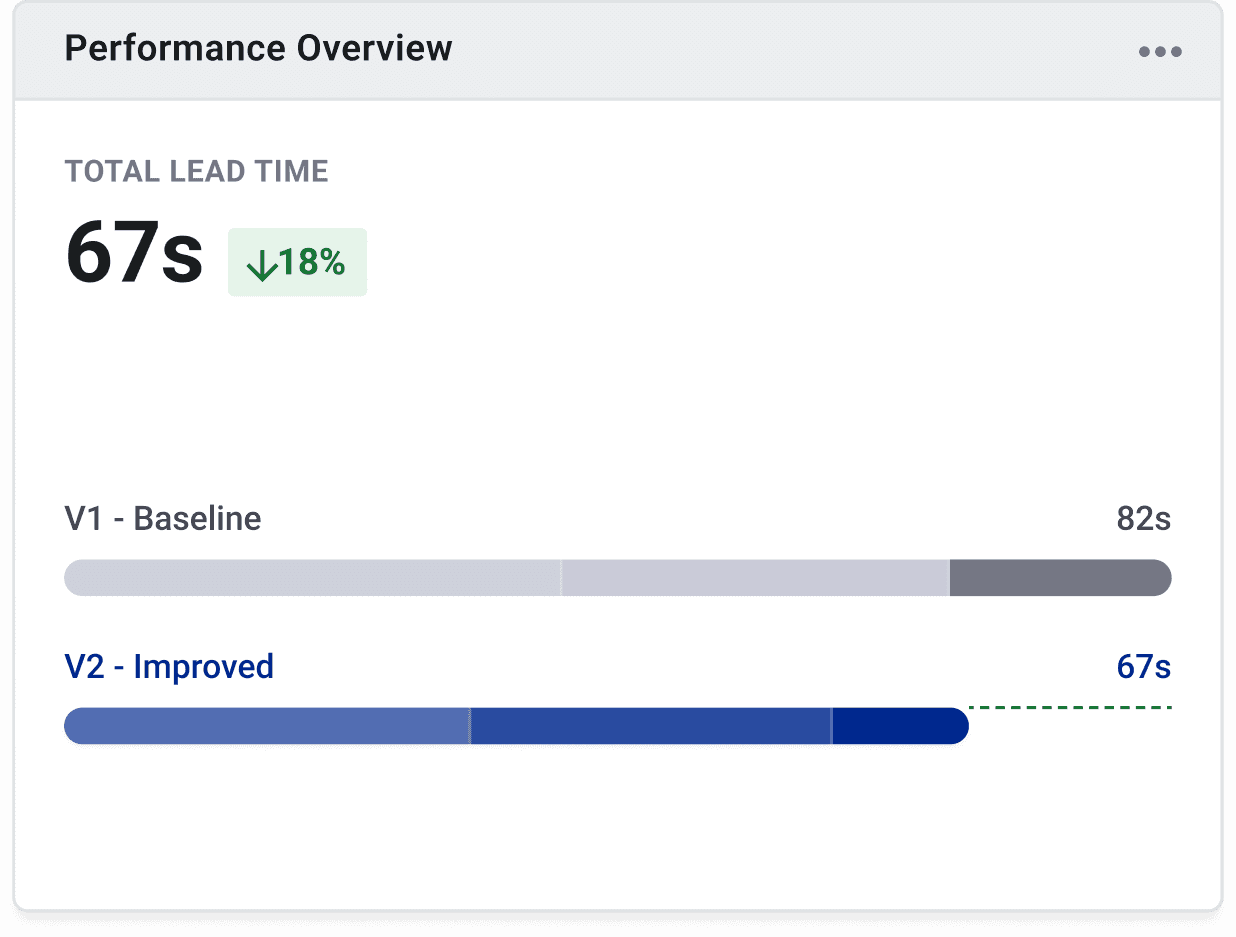
Update the VSM after every improvement with a fresh upload.
LET'S TALK STATS
This section highlights key statistics that provide insight into the current trends and performance metrics relevant to our analysis.
Features
Built for industrial engineers, CI leads, and frontline supervisors — no AI expertise required.
Feature 01
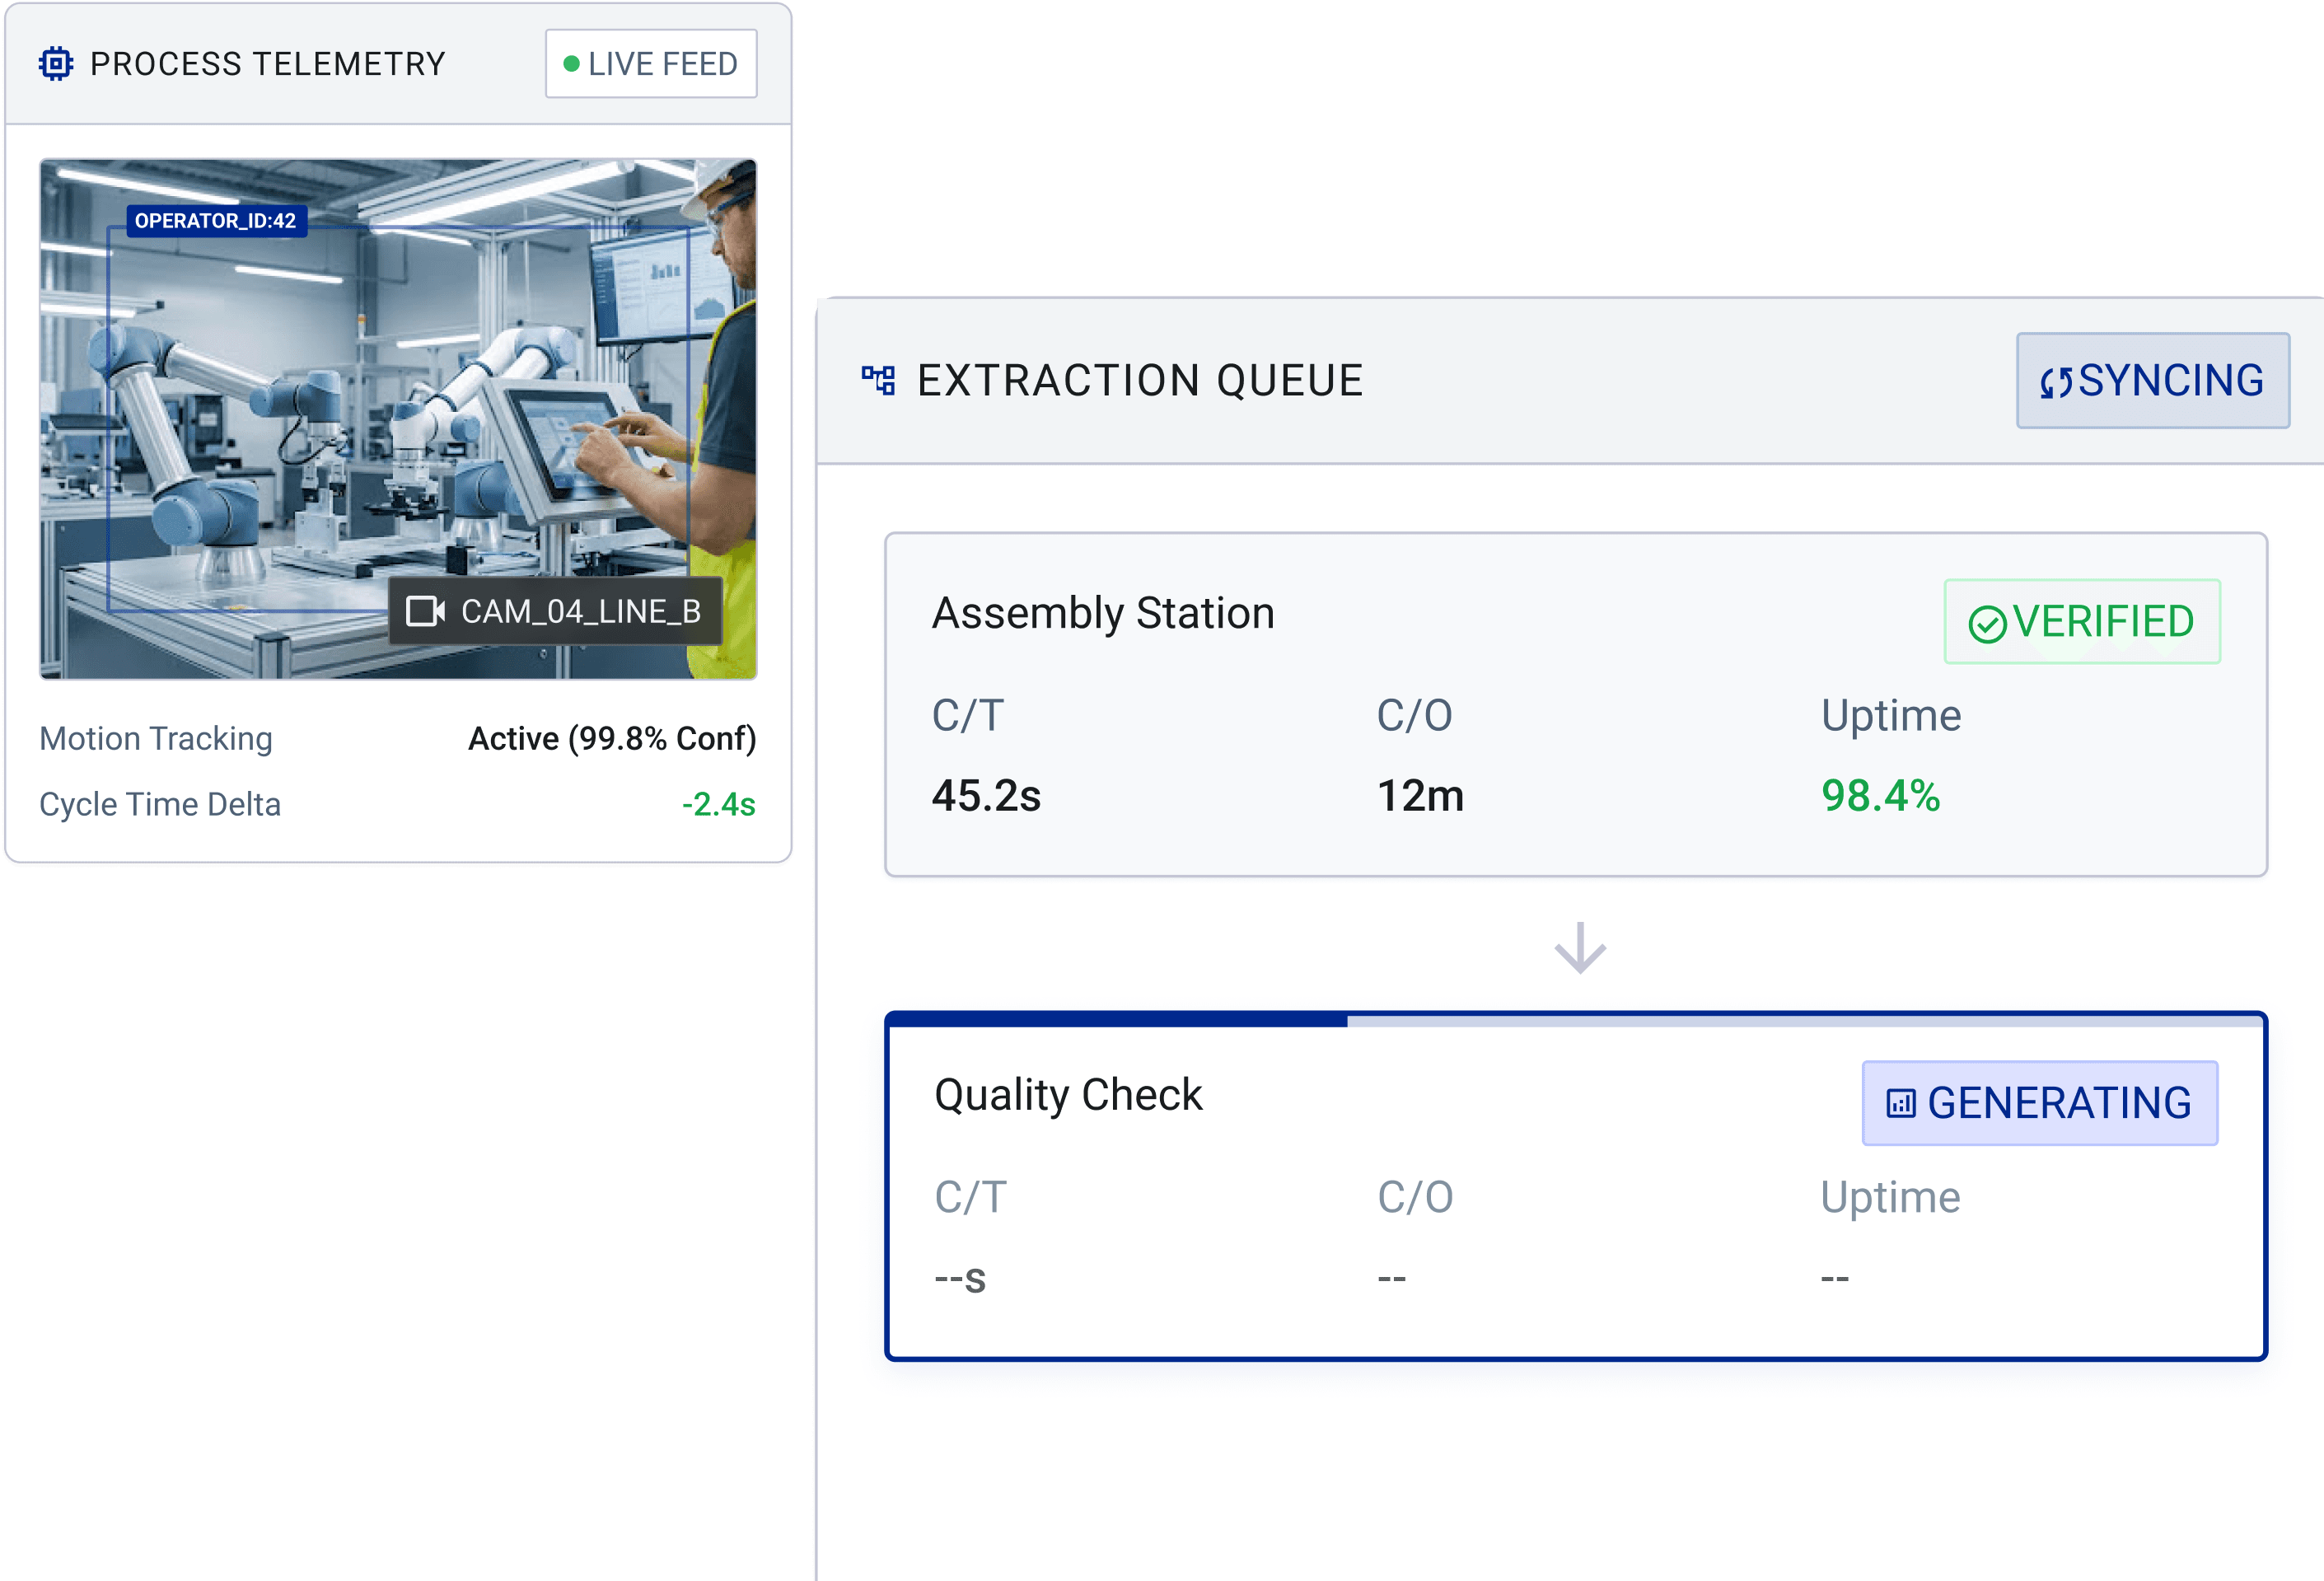
Every filmed process step converts automatically into a properly formatted VSM box, complete with cycle time, changeover time, and uptime pulled straight from the footage — no manual box-drawing or stopwatch reconciliation required.
Automatic VSM box generation per filmed step
C/T, C/O, and uptime populated from video data
Zero manual box-drawing or data entry
Feature 02
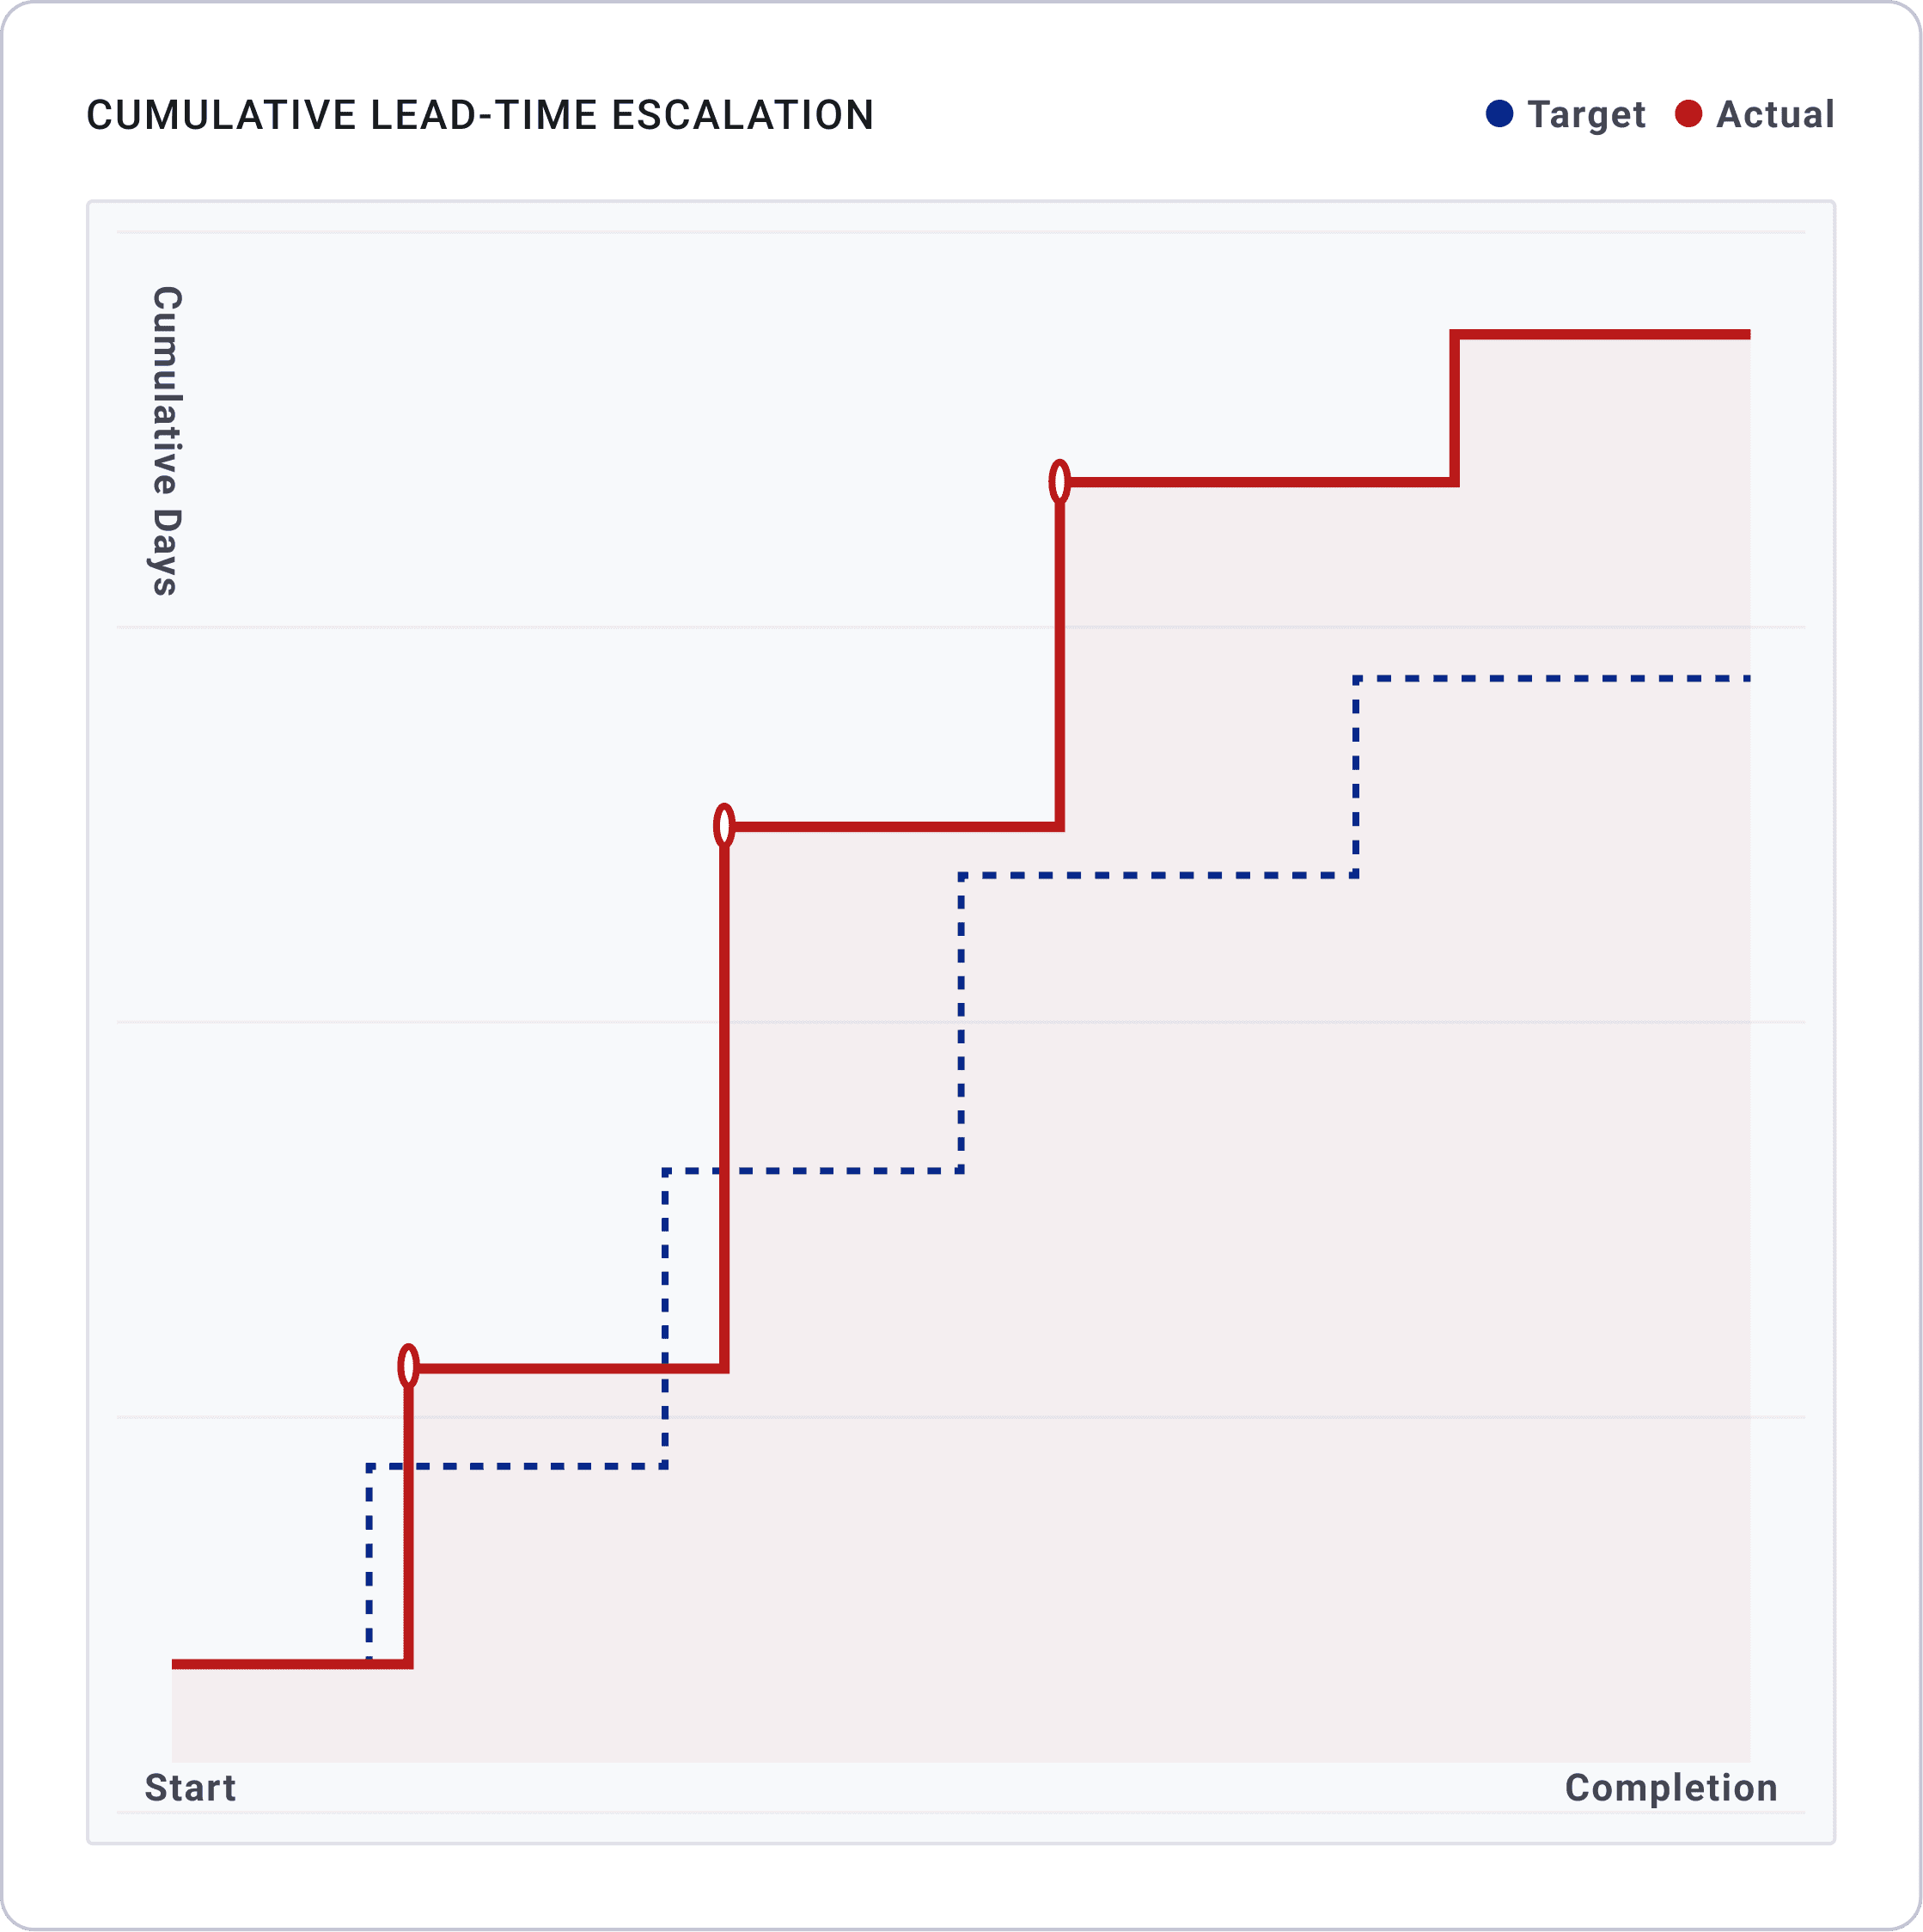
AI measures the actual inventory sitting between each process step and converts it into WIP days automatically, giving you a real lead-time ladder instead of an estimate based on someone's memory of the floor.
Automatic WIP-to-days conversion
Inventory measured directly between steps
Real observed data, not manual estimates
Feature 03
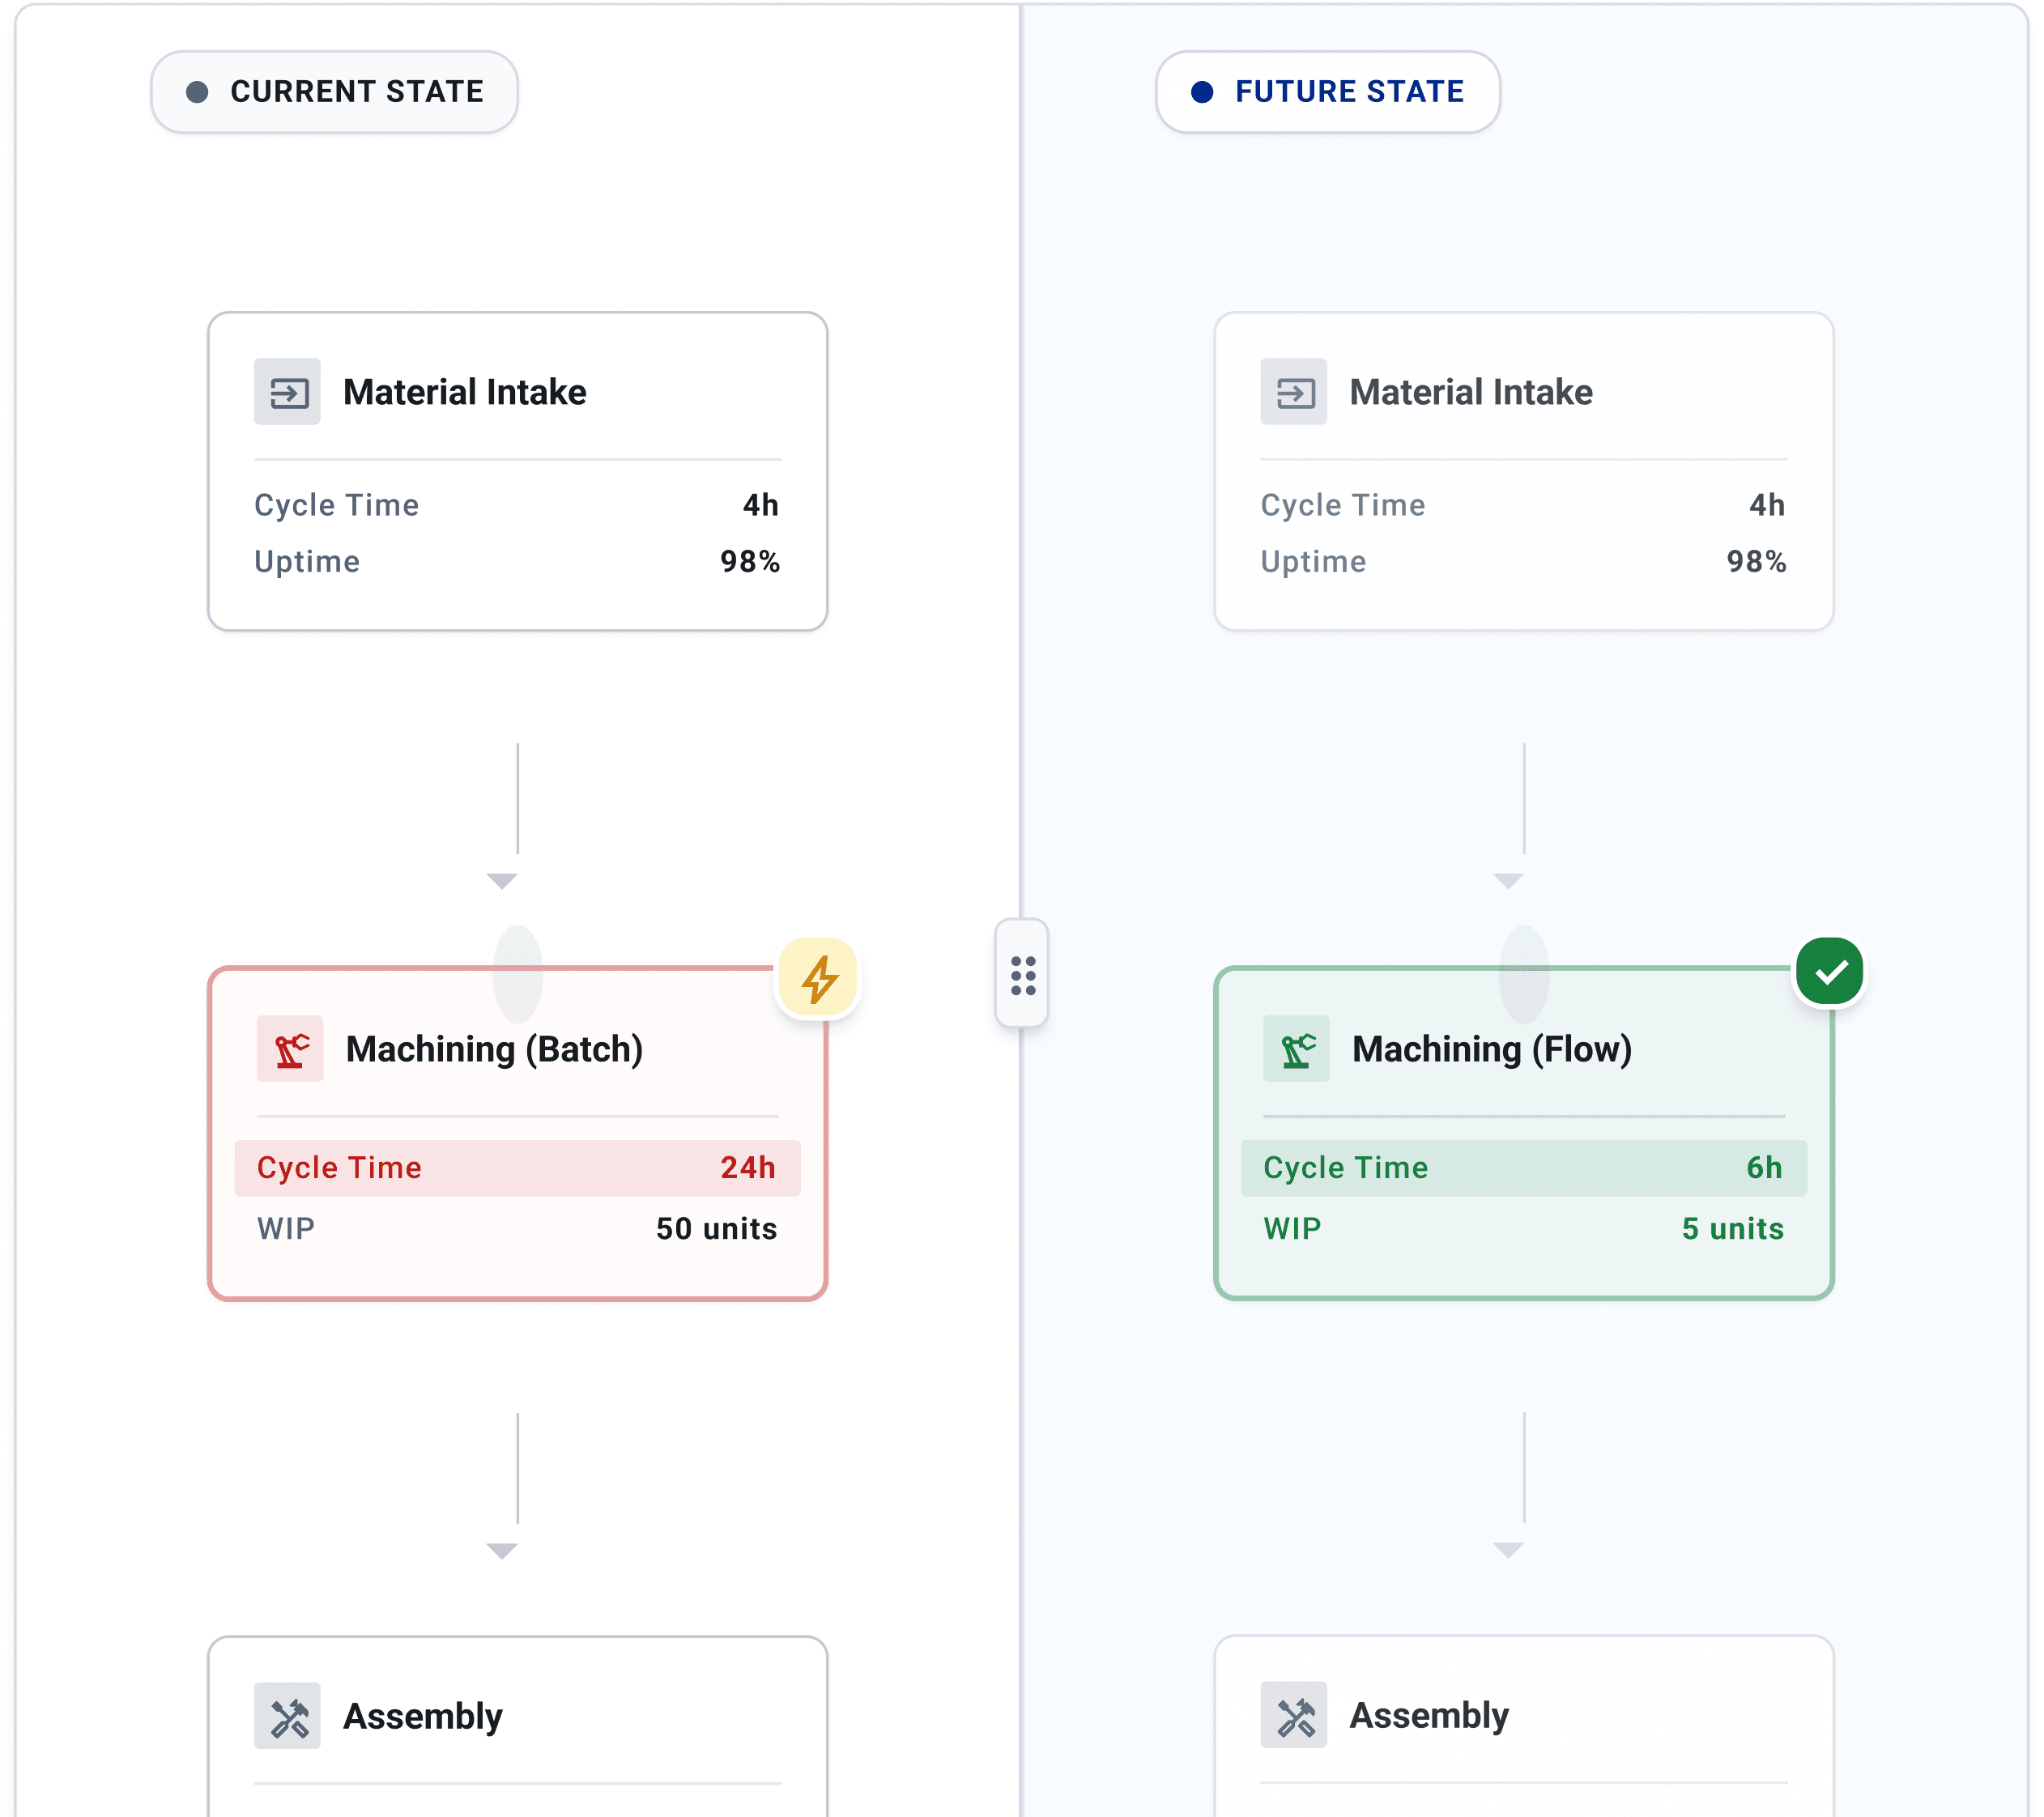
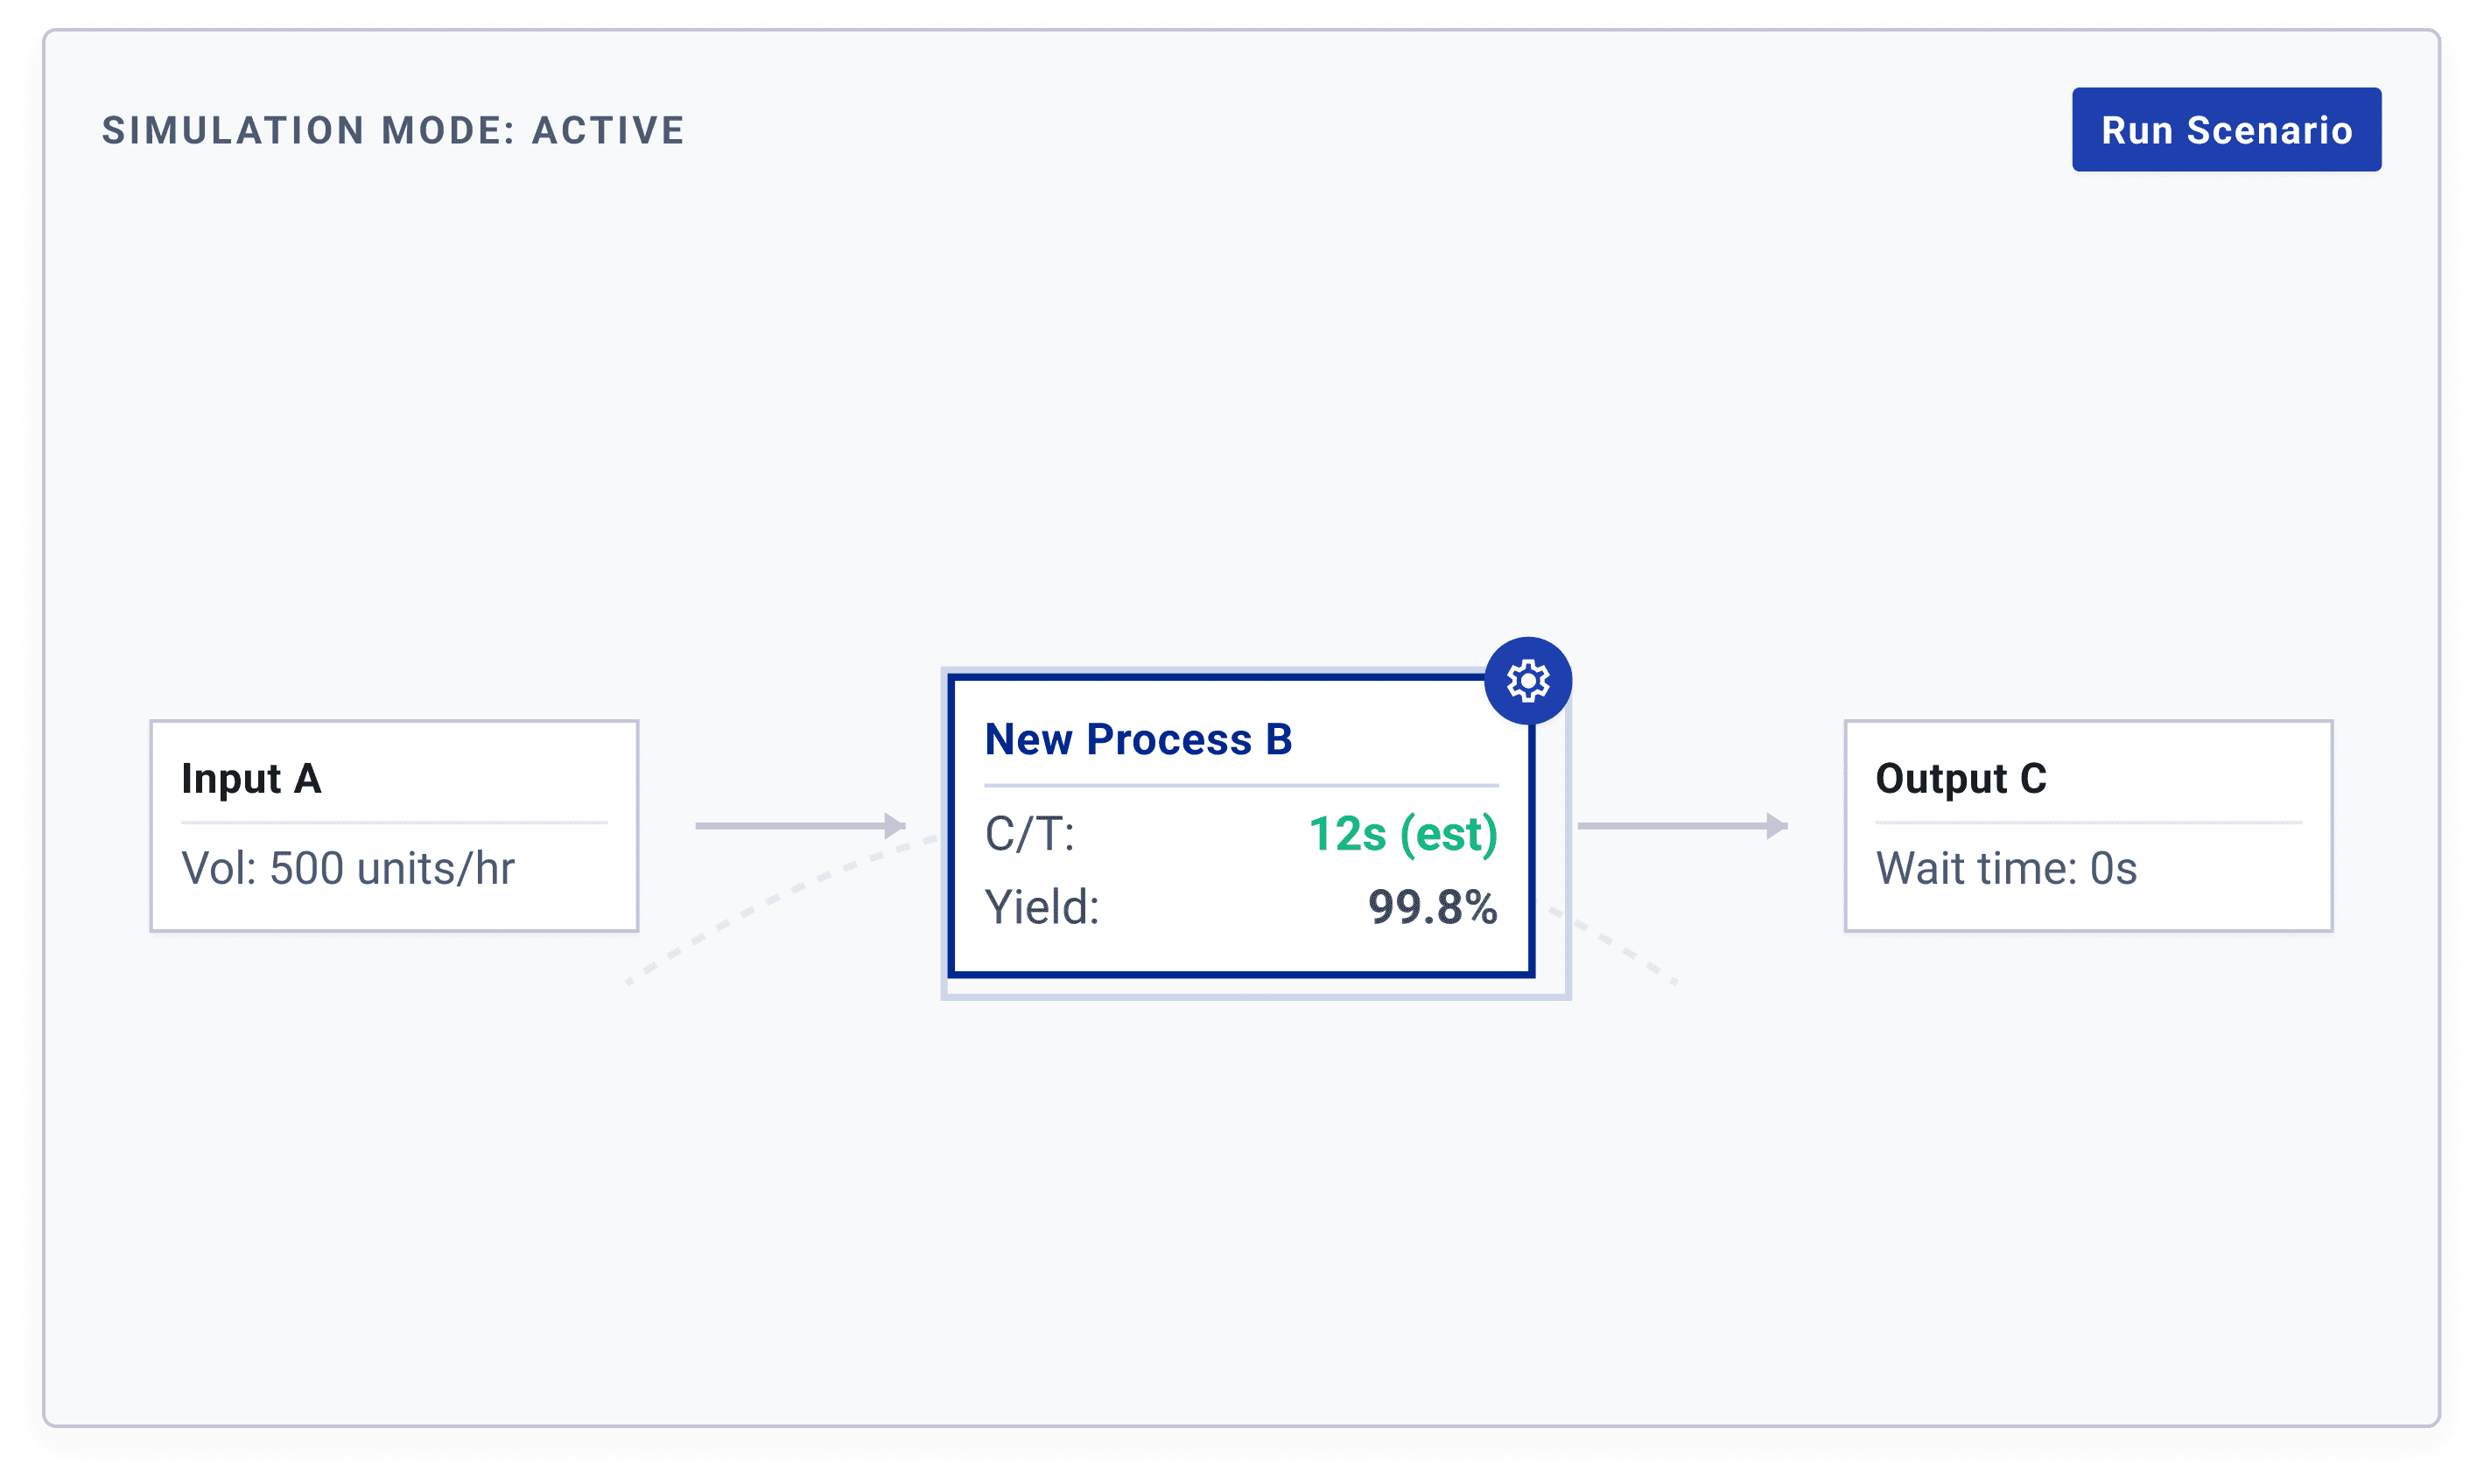
Branch off your current-state map and sketch future-state kaizen bursts in the same view, so you can compare before-and-after side by side without maintaining two separate diagrams.
Branch current state into future-state scenarios
Kaizen bursts simulated in-line
Side-by-side comparison in one map
Feature 04
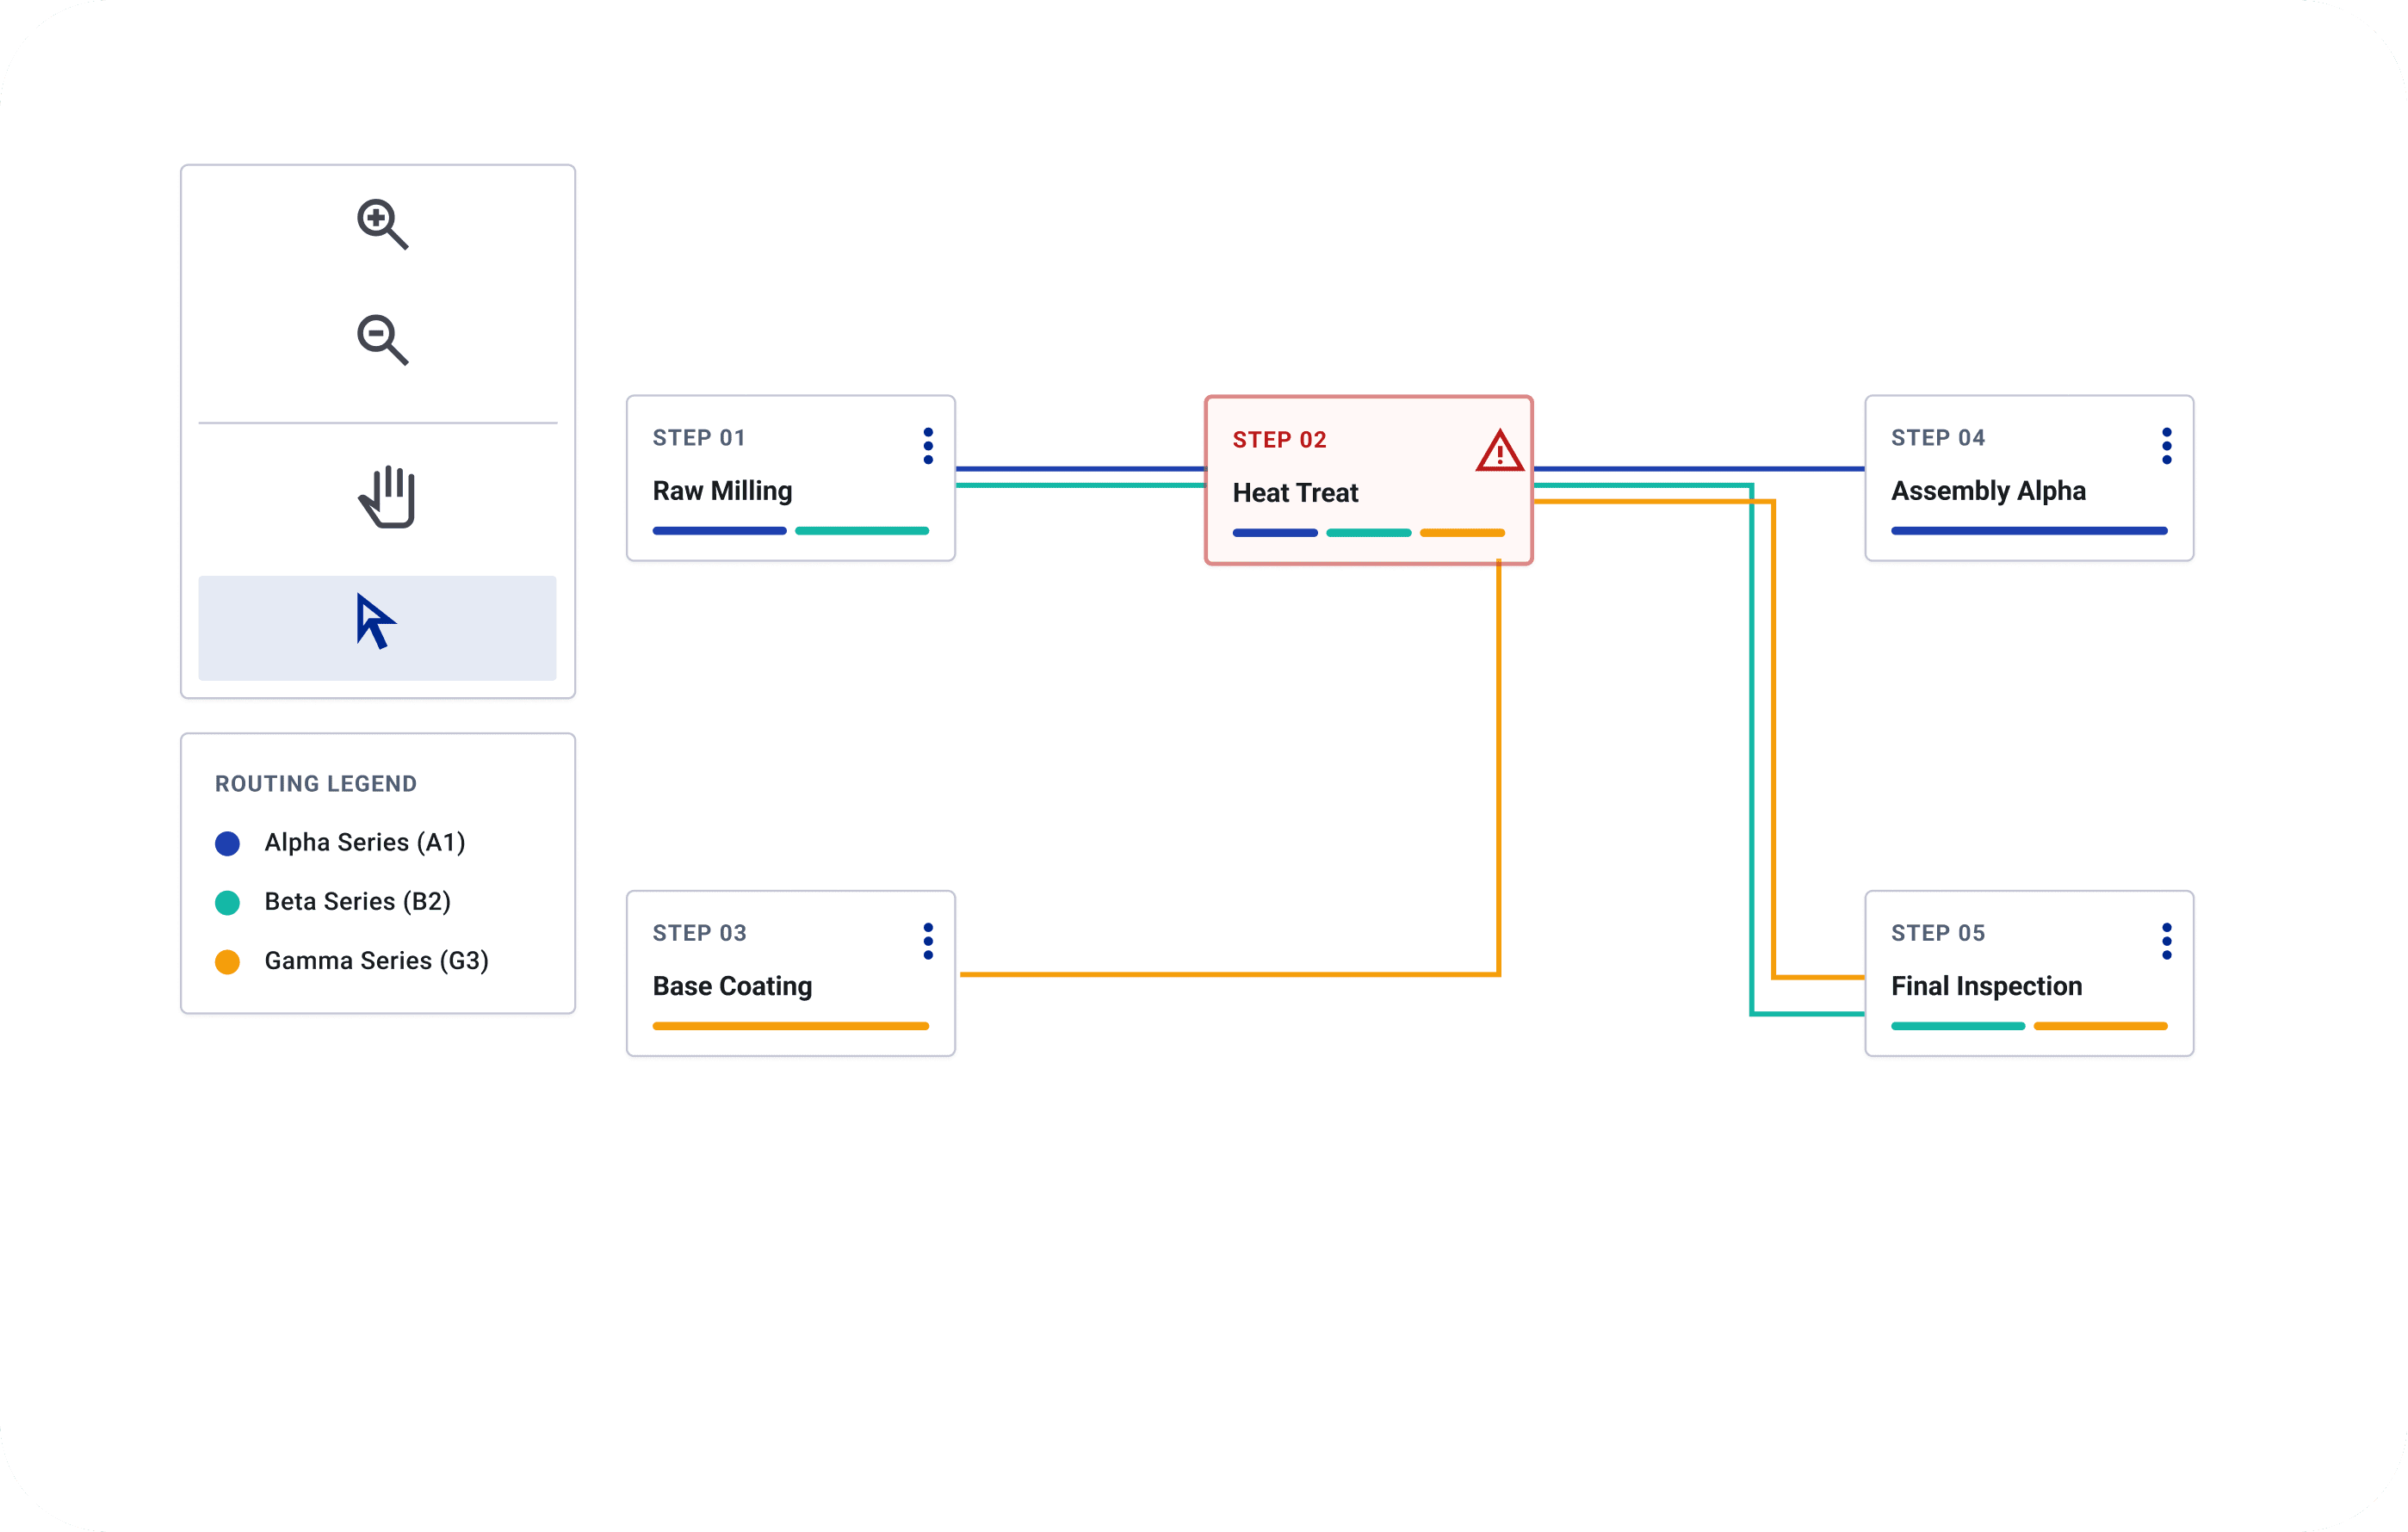
Model several product families on a single value stream map, each with its own routing, so shared and divergent steps are visible in one place instead of scattered across separate maps.
Multiple product families on one map
Independent routing per family
Shared vs. divergent steps visible at a glance
Feature 05
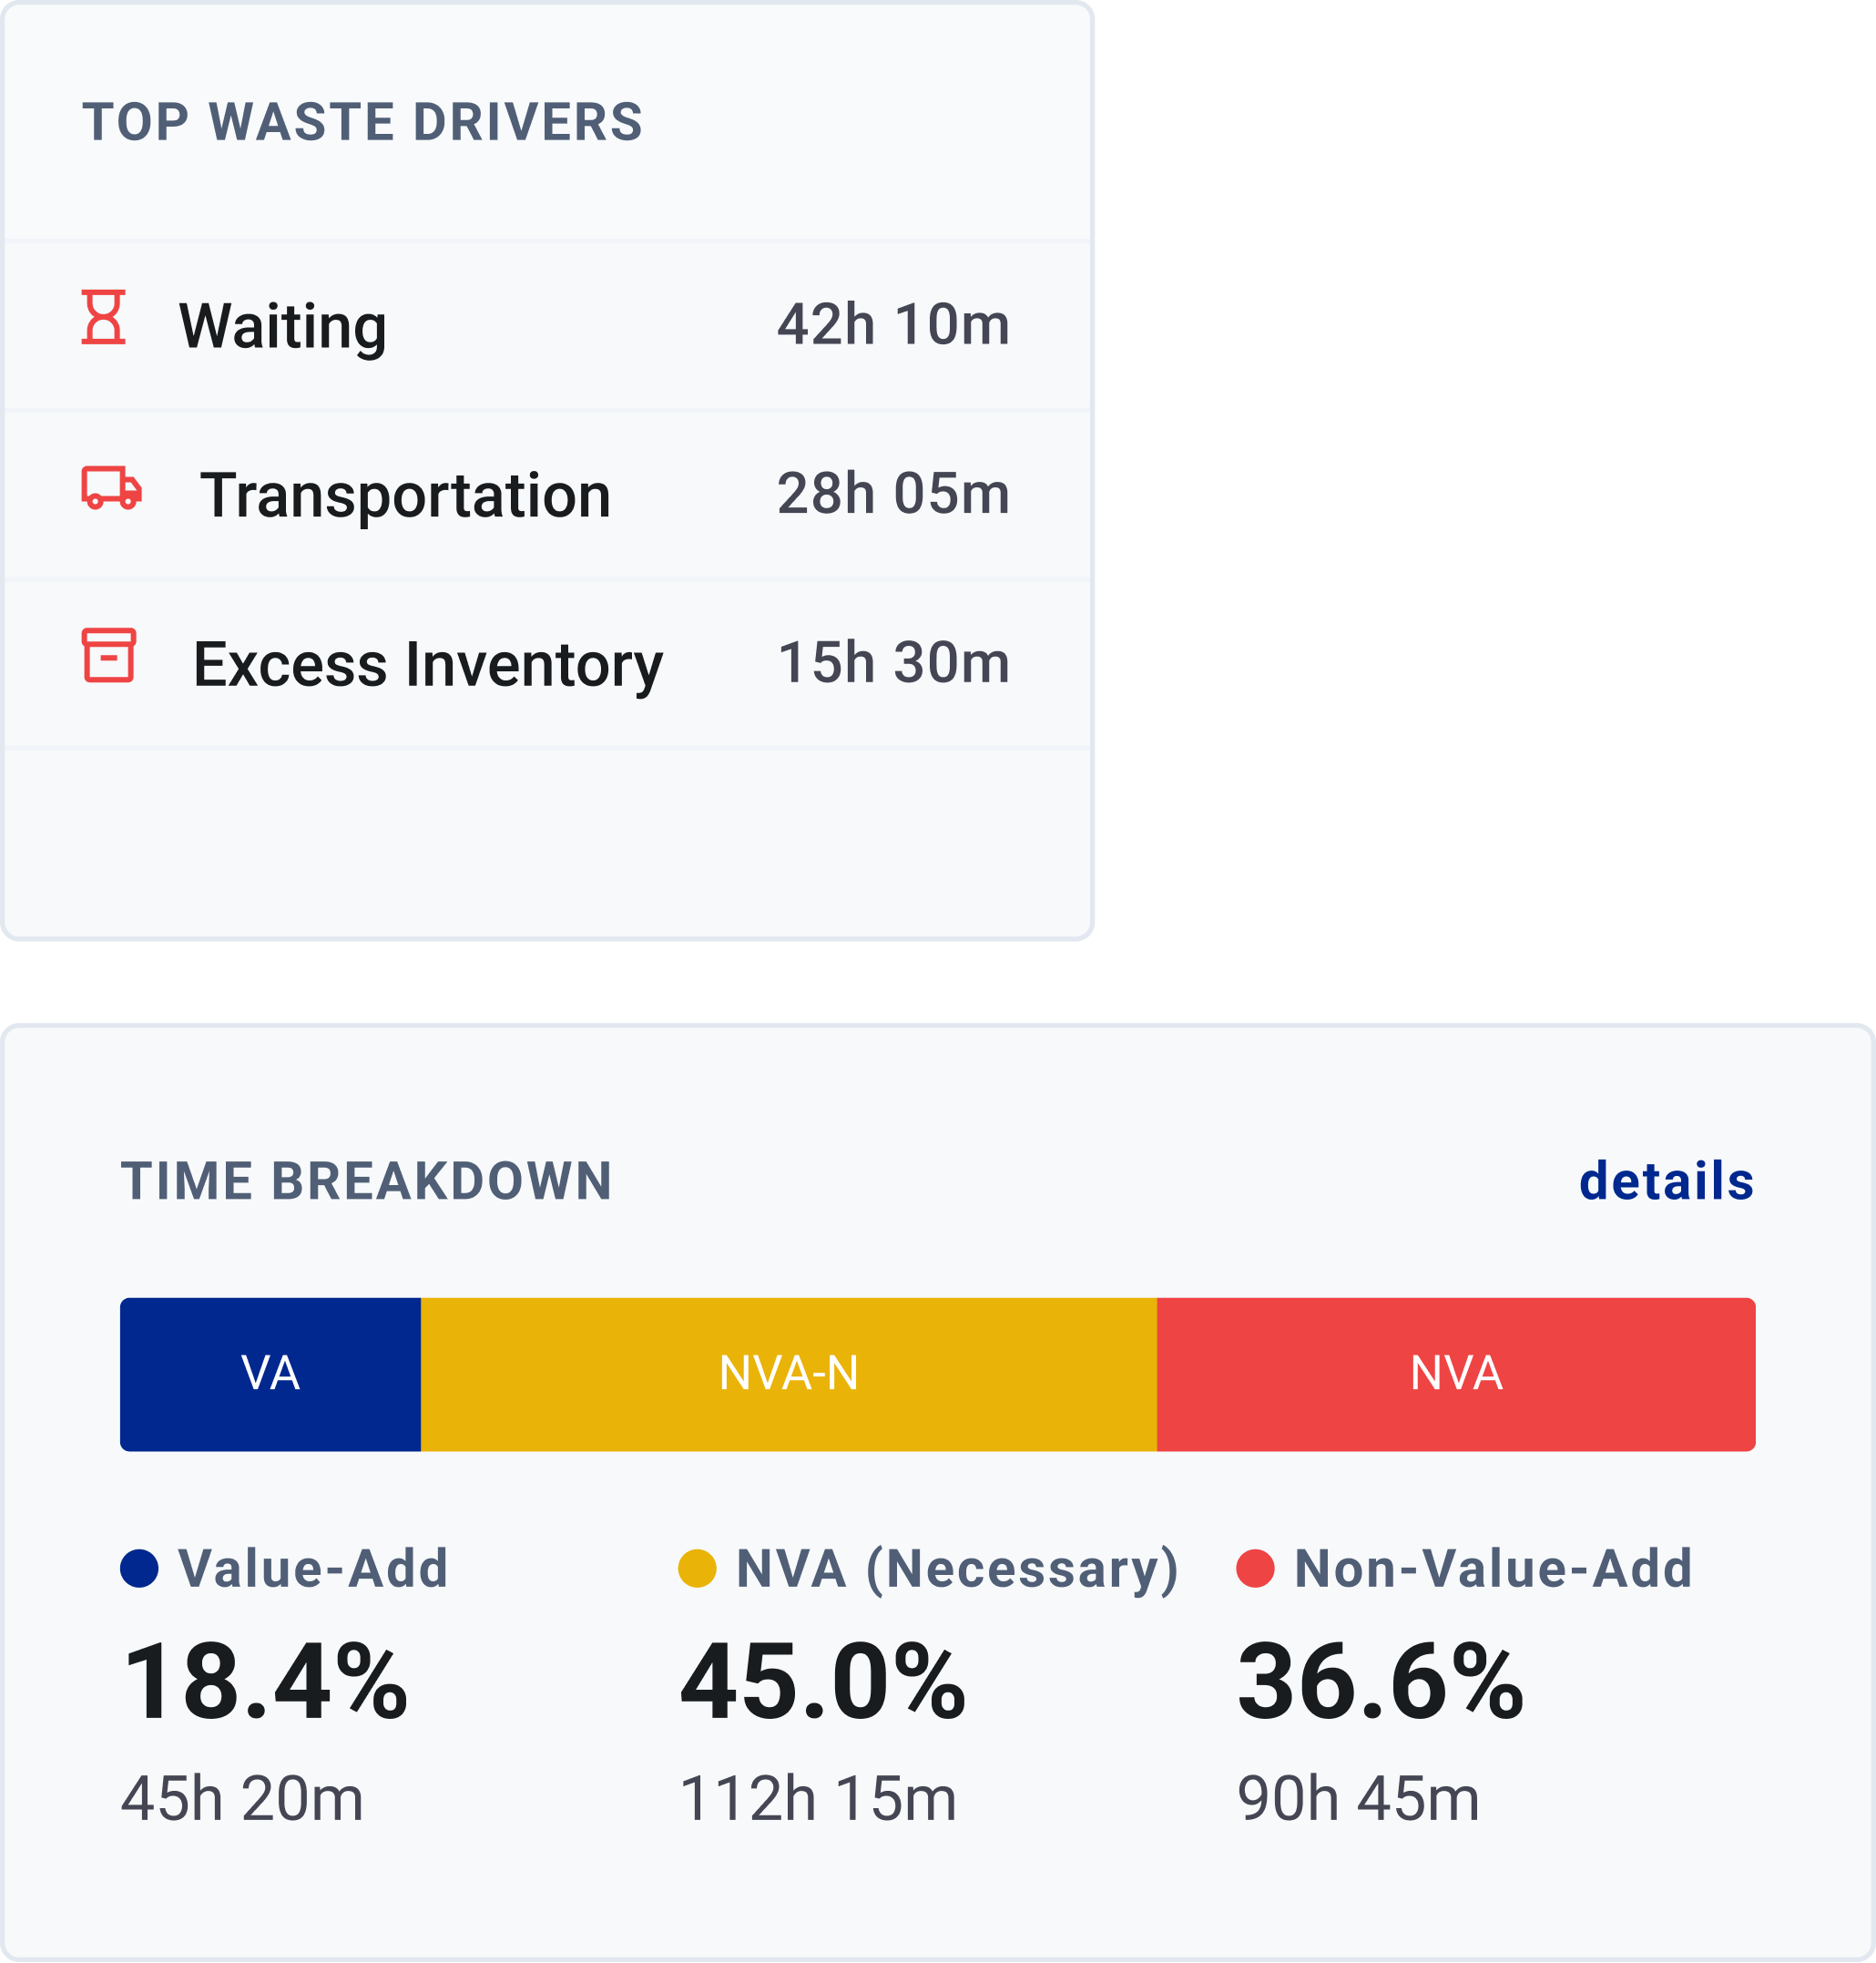
Process Cycle Efficiency is calculated automatically from your mapped value-add and non-value-add time, so you get a live PCE score without pulling out a separate spreadsheet.
Automatic PCE calculation from mapped data
Live value-add vs. non-value-add breakdown
No separate spreadsheet needed
Feature 06
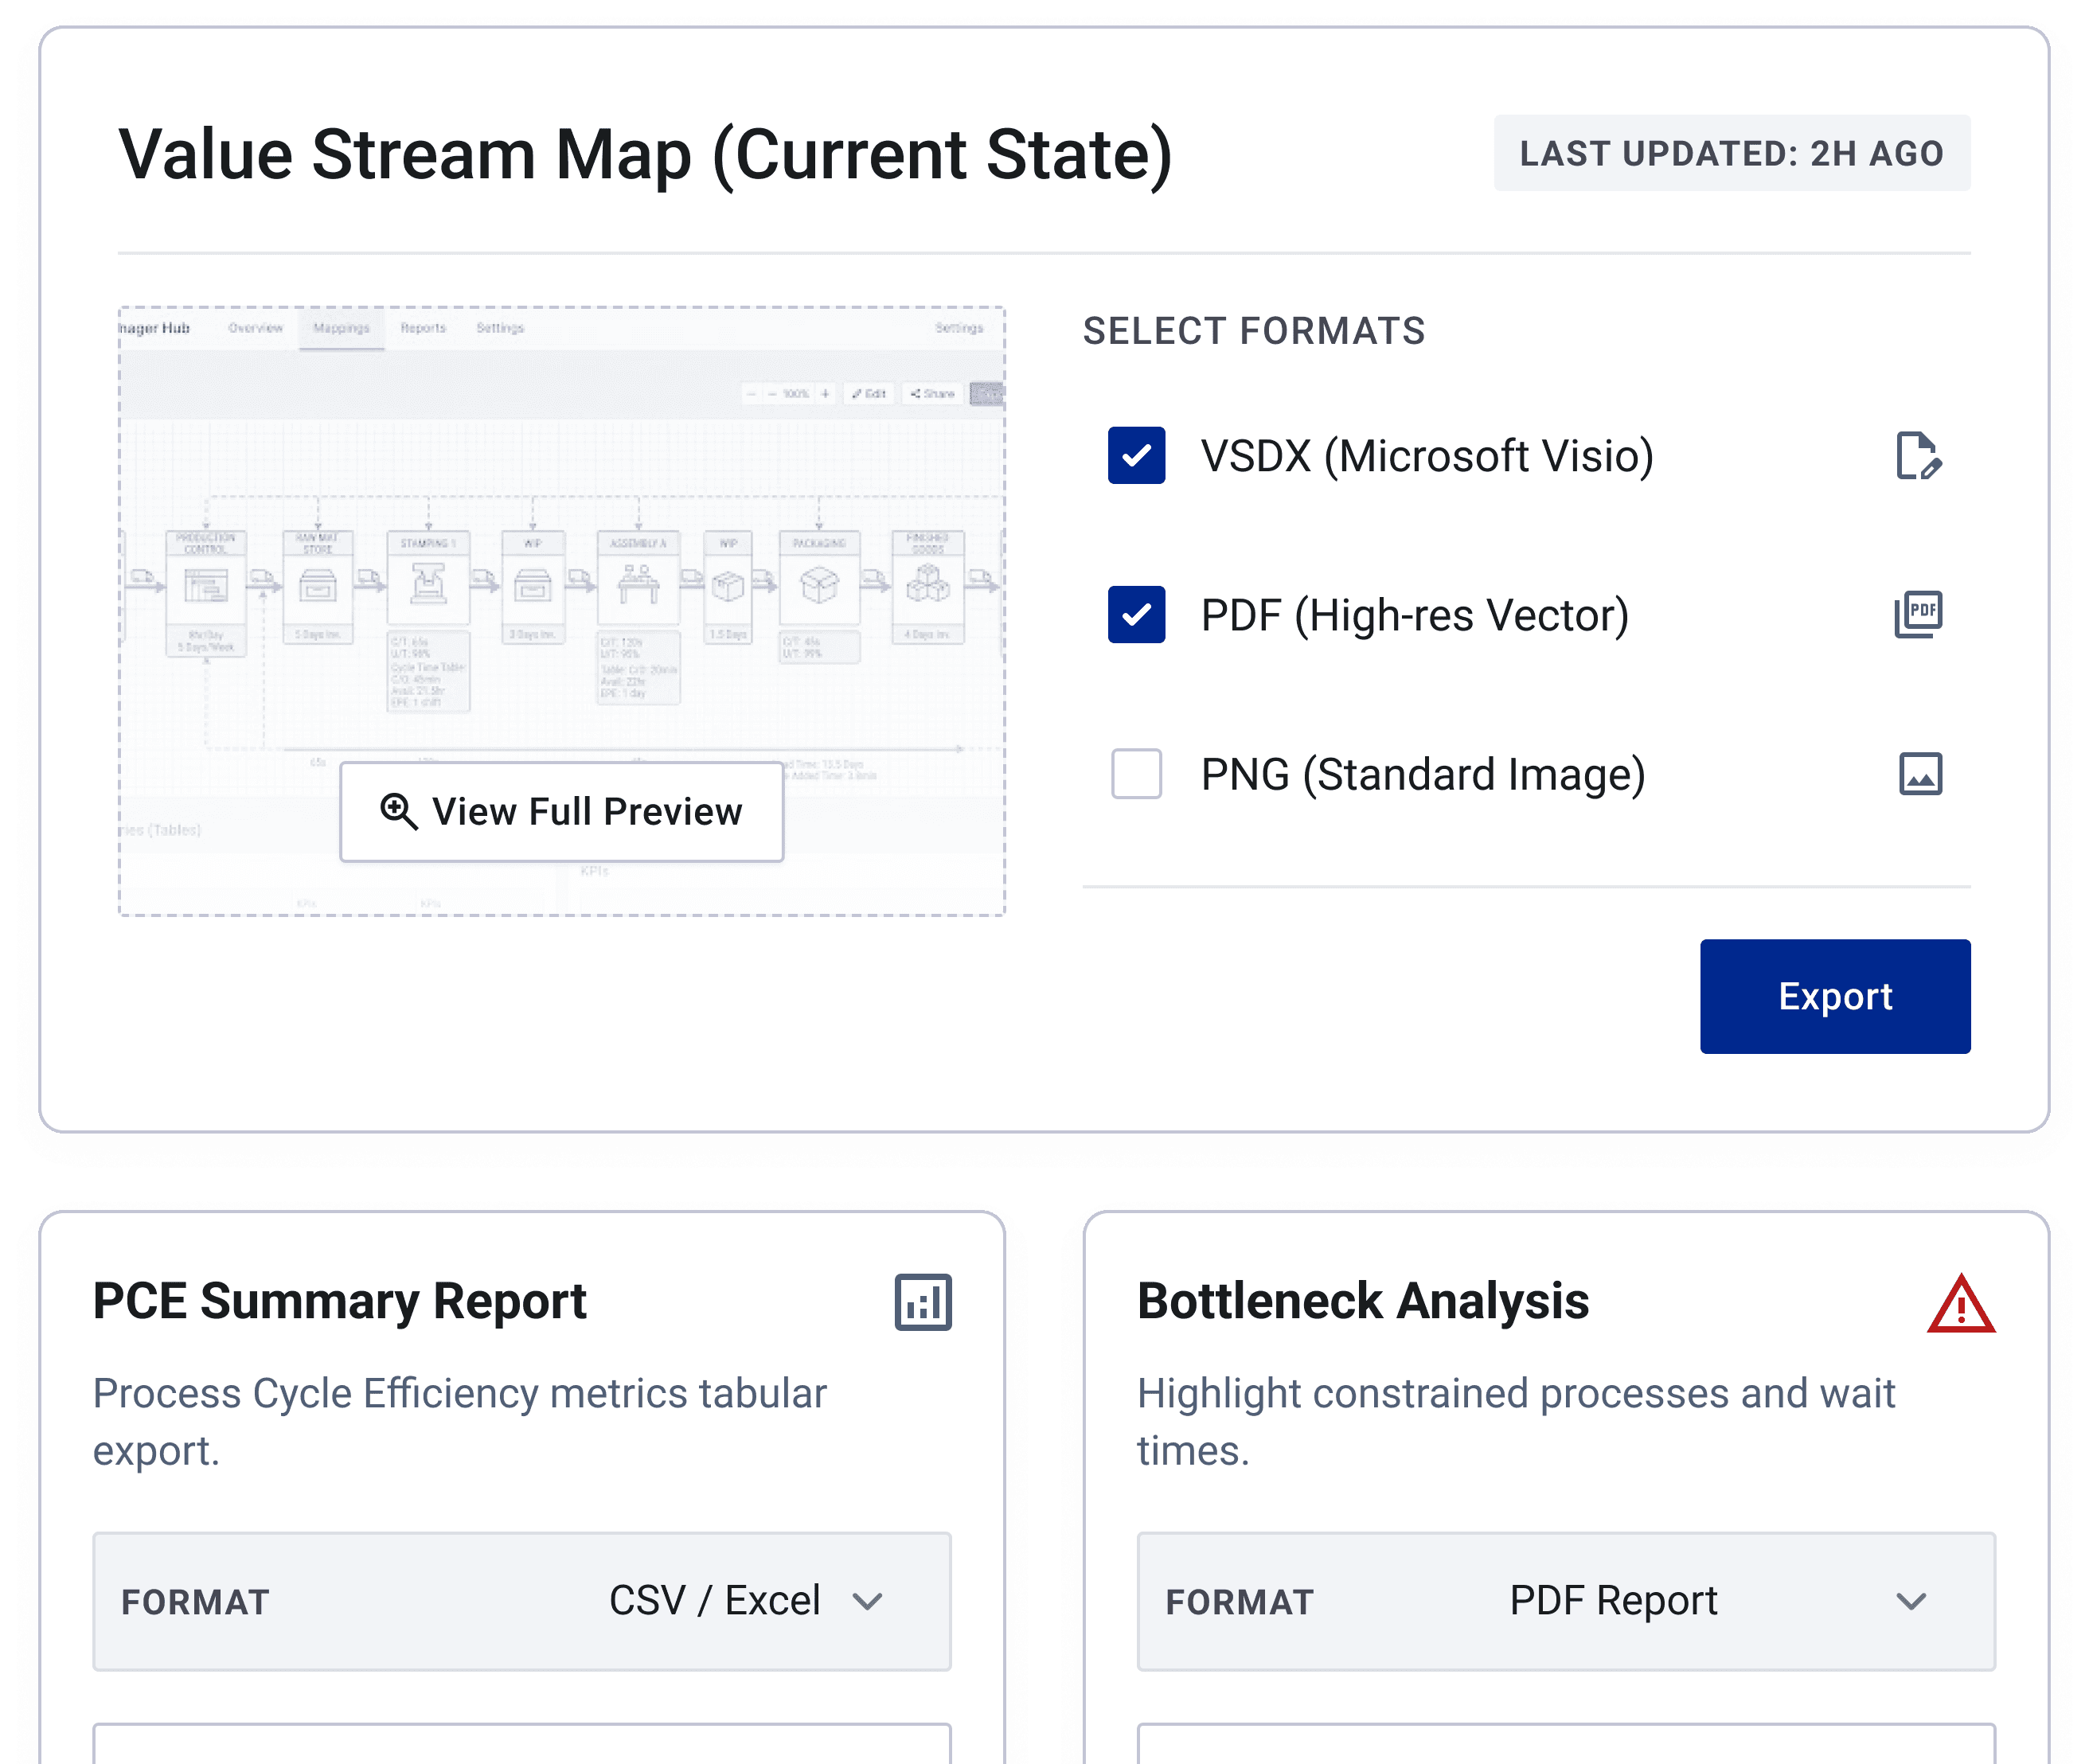
Fine-tune any box directly on the map, then export the finished value stream to PNG, PDF, or VSDX for reports, reviews, or further editing in Visio.
Direct in-map editing of boxes and data
Export to PNG, PDF, or VSDX
Visio-compatible output for downstream editing
Why It Matters
Traditional value stream mapping means walking the floor with a clipboard, hand-drawing boxes from memory, and redrawing the map every time a process changes. LeanSuite generates each box from filmed observation, keeps the data current with a simple re-shoot, and lets you branch future-state kaizen bursts in the same map.
Truth, Not Memory
Every box is backed by timestamped video.
Always Live
Re-shoot to refresh — no markers required.
Future-State Ready
Run simulated future-state in the same tool.
FAQs