Skip to content
LeanSuite

Reducing COPQ: Stop Sorting Bad Parts. Start Eliminating Them.

Reduce the cost of poor quality (COPQ) by fixing the defects that cost most: LeanSuite's QA Matrix puts a dollar cost and a priority on each defect and shows engineering what to fix first.

By clicking "Schedule Demo," you agree to the use of your data in accordance with LeanSuite's Privacy Notice, including for marketing purposes.

Watch

A short story from the plant floor

· 4:00

Your 98 Percent Yield Is Hiding a Second Factory

A plant can report 98 percent final yield and run 82 percent first pass yield. That gap is 16 percent of capacity spent fixing things twice, and it's on no report leadership reads. In this episode the crew chases it from the huddle board to the rework bench. We define first pass yield precisely, show why a reworked unit is not a first pass, and multiply…

Press play to load the player from YouTube, or watch it on YouTube.
The Hidden Drain

The cost of poor quality you can't see

Buried in paper NCRs and spreadsheets, engineers work on the loudest problems, not the most expensive ones.

The reactive trap

  • Hidden Financial Impact

    You know you had 50 defects, but not what they cost.

  • Misaligned Priorities

    Engineers fix a minor nuisance while a margin-killer goes unnoticed.

  • Repeat Offenses

    Defects get scrapped, the root cause stays, and they come back.

The LeanSuite edge

  • Financial Prioritization

    The system automatically converts defect counts into hard dollar losses.

  • Data-Driven Focus

    A live Pareto chart shows your CI team which defects cost the most.

  • Closed-Loop Execution

    Highest-cost defects are pushed directly into DMAIC or Root Cause Kaizen workflows.

Schedule Demo

HOW IT WORKS

Three modules, one quality loop

Issue Management logs each defect where it is found, the QA Matrix costs and ranks it, and Kaizen & Projects runs the root-cause project.

Issue Management
QA Matrix
Kaizen & Projects

Issue Management

Real-Time Defect Tracking

Log defects at the line

Operators log each defect at the line by part number and failure code.

  • Scan the QR code on the machine and the form opens with location, department and shift filled in

  • Defects are logged as they happen, not tallied on paper

  • No end-of-shift typing into Excel

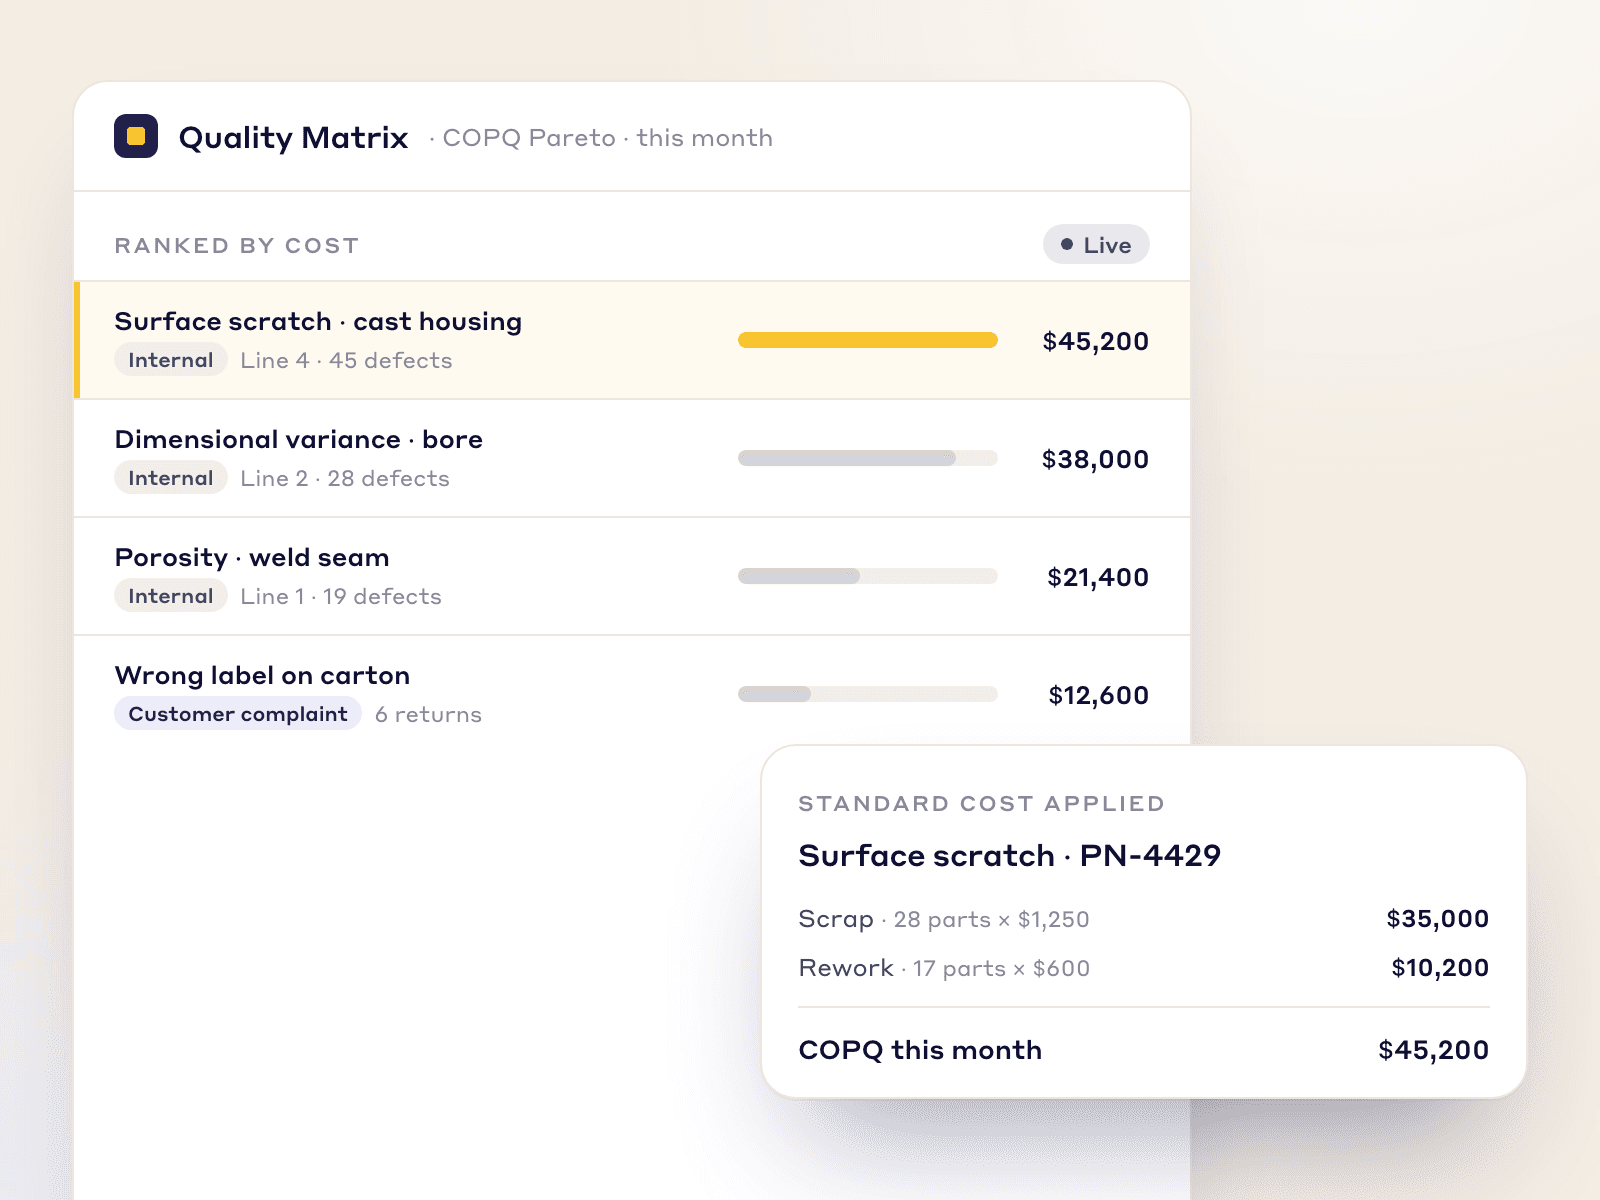
Quality Matrix COPQ Pareto ranking defects by cost, with the scrap and rework cost behind the top defect

QA Matrix

Financial Impact & Prioritization

A live COPQ Pareto, ranked by cost

The QA Matrix combines internal defects and customer complaints, applies your standard costs and ranks each defect AA, A, B or C by where it was caught, severity, cost and recurrence.

  • Internal defects and customer complaints in one list

  • Your standard costs turn defect counts into dollars

  • A live Pareto of your cost of poor quality (COPQ)

  • The most expensive issue always sits at the top

Kaizen & Projects

Root Cause & Continuous Improvement

Launch the fix from the top offender

Launch a Kaizen or CAPA from the costliest defect, with the AI RCA Agent to find its root cause.

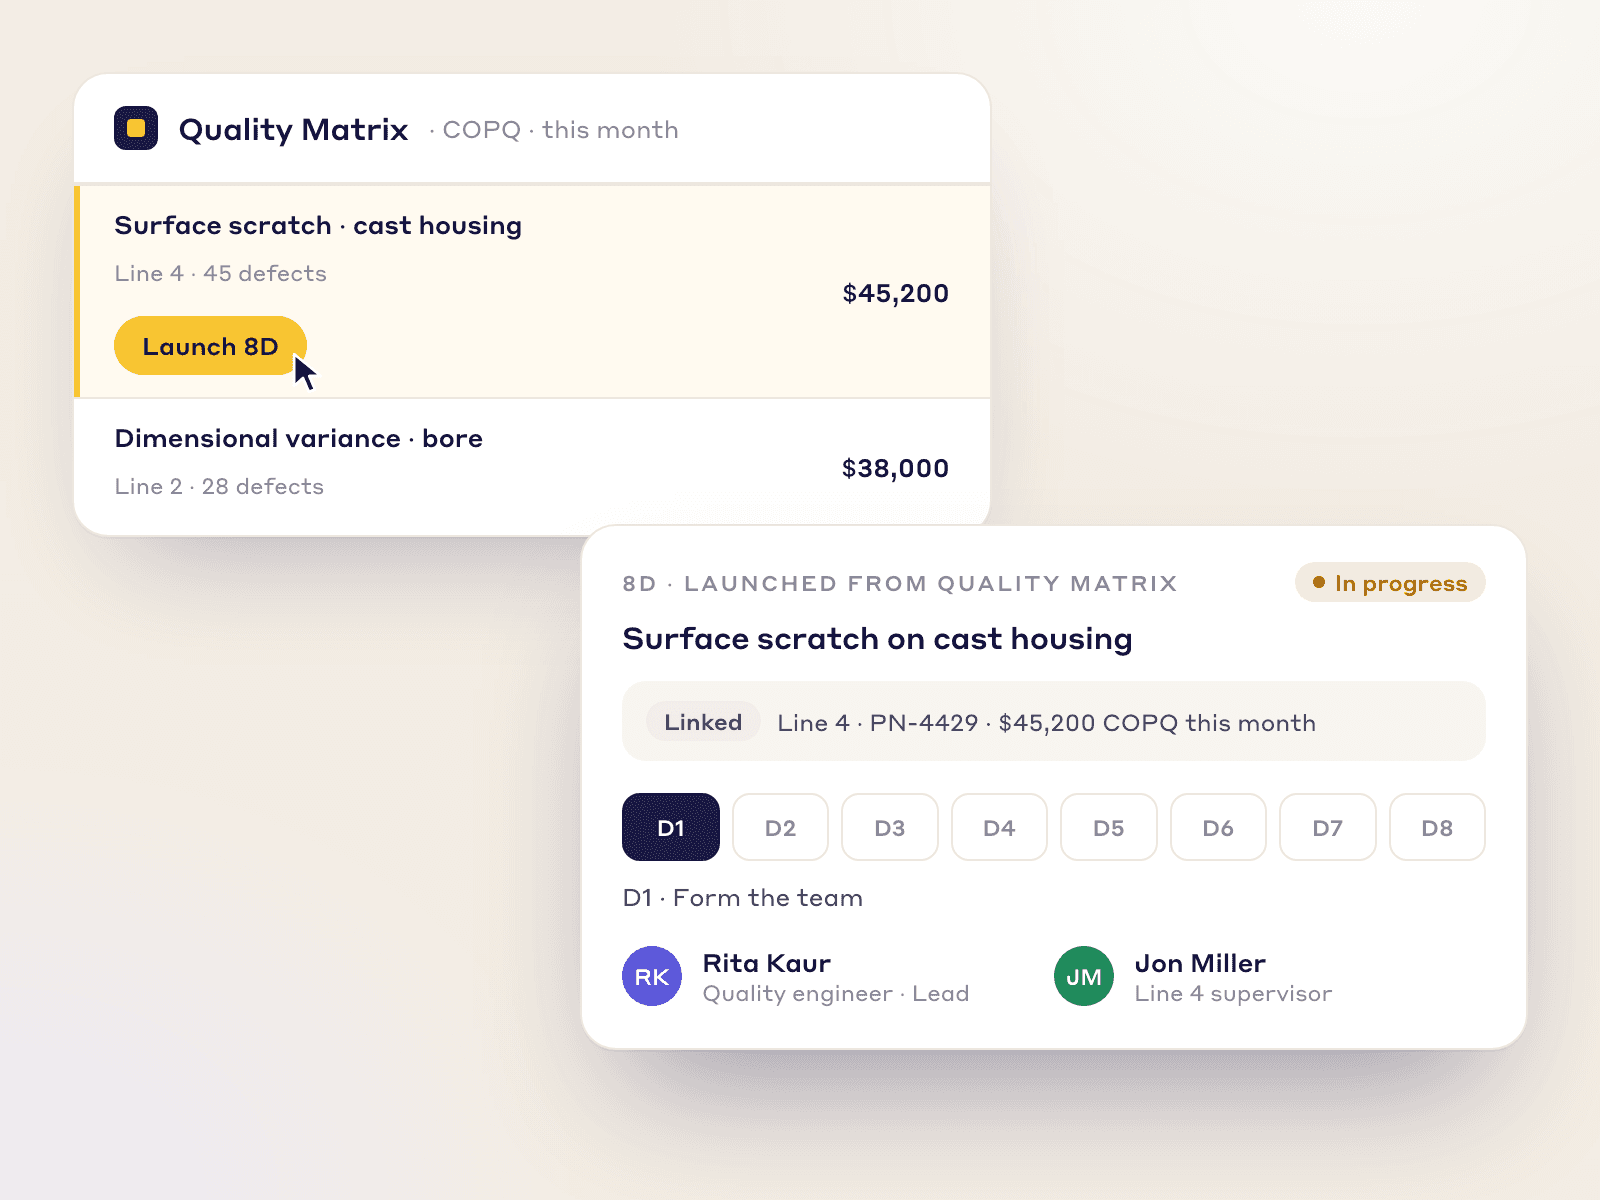
  • Launch a project in one click from the top cost offenders

  • 8D or A3 structure, with the team assigned at launch

  • Each project stays linked to the defect data behind it

  • Work on root causes, not firefighting

An 8D project launched from the top defect on the COPQ Pareto, with its team assigned
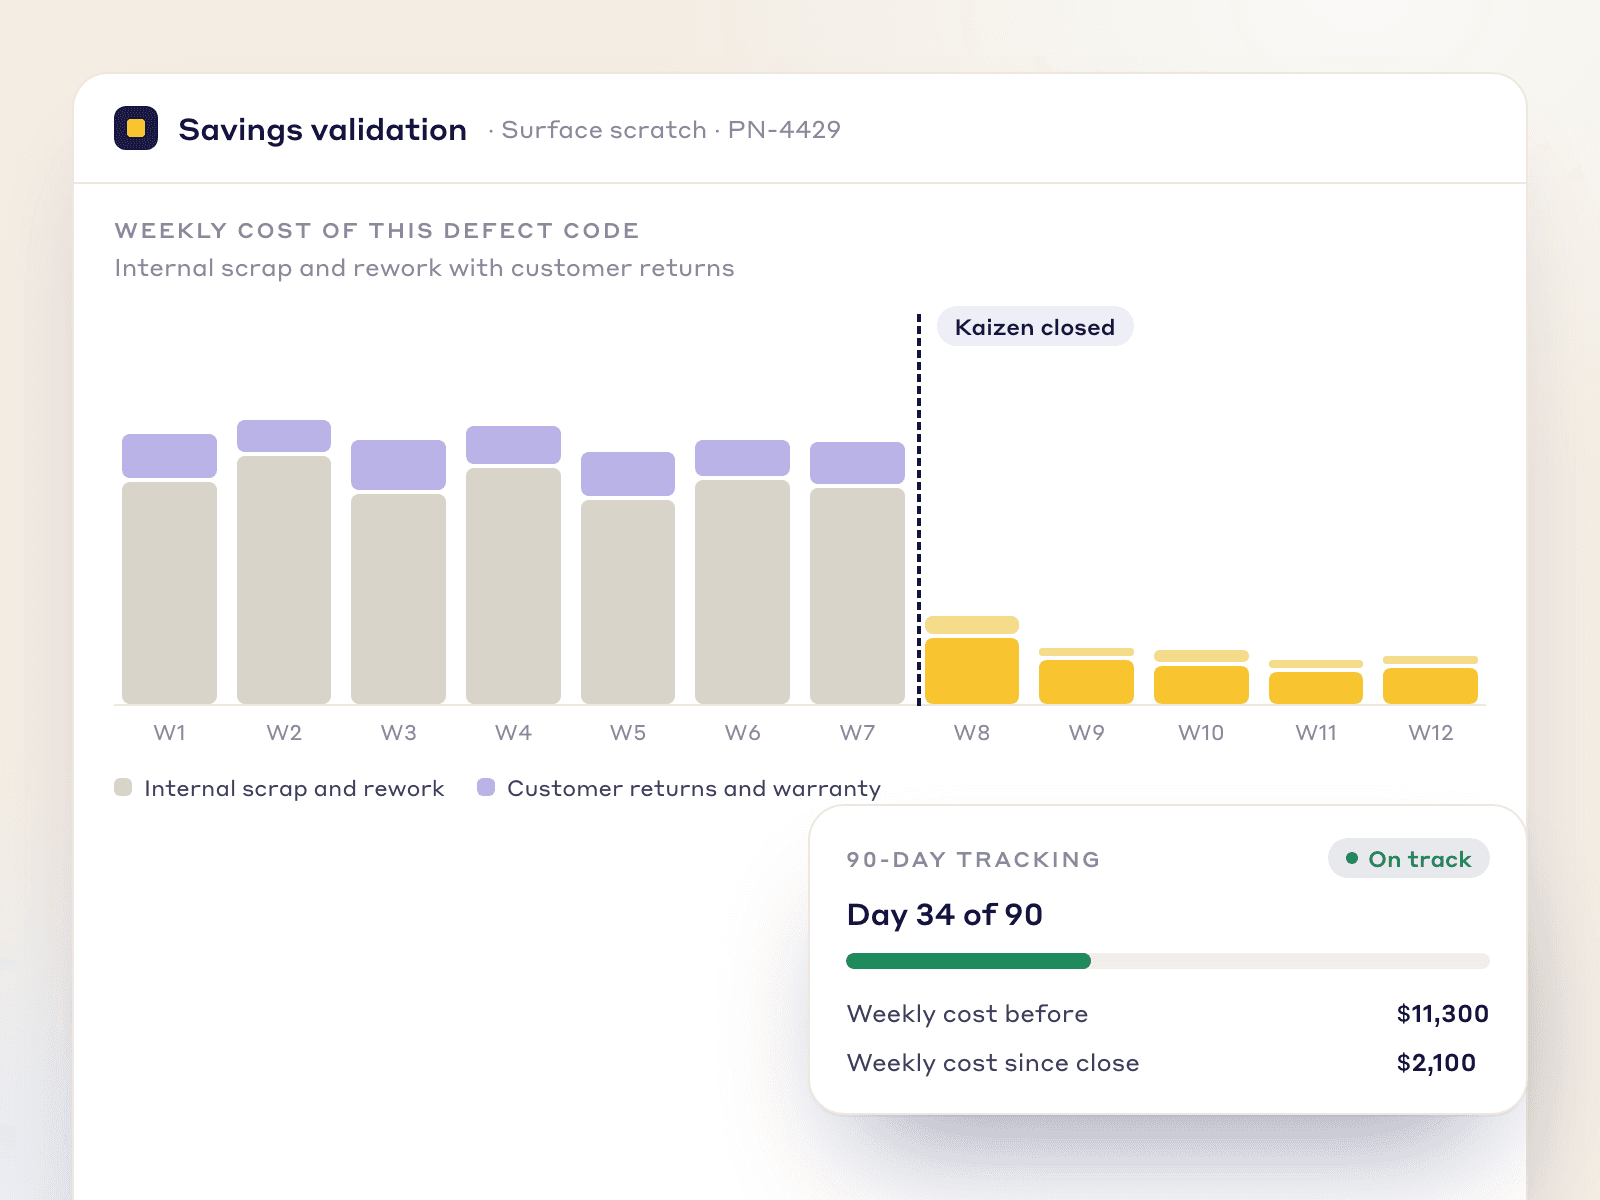
Savings validation for one defect code: weekly scrap and customer-return cost before and after the Kaizen closed

Financial Alignment

Connect the Shop Floor to the Bottom Line

LeanSuite links the defects operators log to the P&L.

Combine Internal & External Data

See in-process scrap next to warranty claims and customer returns on one dashboard.

Validate the Savings

After a Kaizen project closes, LeanSuite tracks that defect code for 90 days and reports the dollar savings of the fix.

IATF, ISO AND AS9100 READY

Built for zero-defect environments.

LeanSuite is designed to support IATF 16949, ISO 9001 and AS9100 work, with the auditable digital trail external auditors ask for.

  • SOC 2 Type 1 report

  • First module live in under a week

  • Unlimited users per facility

  • 99.5% monthly uptime commitment

FAQs

Frequently Asked Questions

  1. COPQ is everything a plant spends because work wasn't done right the first time: scrap, rework, sorting, returns, warranty claims and the labor behind them.

  2. Defects are logged at the line, the QA Matrix costs and ranks them, and the costliest become Kaizen or CAPA projects.

  3. The QA Matrix is LeanSuite's loss tree for quality problems: it ranks defects by product category and group, so the biggest rise to the top. You can import defect data and map the columns once.

  4. You set standard costs by part number during onboarding, and each logged defect is multiplied by its cost.

  5. Yes. Internal defects are logged at the line; customer returns and warranty claims can be entered manually or imported via API from your customer portal, into the same COPQ dashboard.

  6. Templates for 8D, A3, 5-Why, Fishbone, 4M1D and DMAIC, custom templates, and the AI RCA Agent, which drafts a 5 Whys, 4M1D and fishbone.

  7. After a project closes, LeanSuite monitors the defect code for 90 days and reports the dollar reduction.

Run it in LeanSuite

Ready to Stop the Hidden COPQ Drain?

See how LeanSuite's QA Matrix turns defect data into a dollar-ranked action plan.