

Hidden Bottlenecks
One slow station drags throughput for the entire line.
AI line balancing from video: film your line, get a Yamazumi chart against takt, and test rebalancing scenarios before you change anything.
By clicking "Schedule Demo," you agree to the use of your data in accordance with LeanSuite's Privacy Notice, including for marketing purposes.
The Challenge
Why line balancing is hard to keep up with by hand.
One slow station drags throughput for the entire line.
Building one in Excel is a half-day exercise per scenario.
Demand shifts but staffing stays the same.
How it works
From video upload to a balanced line recommendation in three steps.
Record every station on the line, from the start of each cycle to the end.
AI splits the work into elements, assigns them to each operator and charts them against takt.
Move elements between stations in a simulation and see the new balance before changing the line.
Features
Built for industrial engineers, CI leads and supervisors. No AI expertise required.
Feature 01
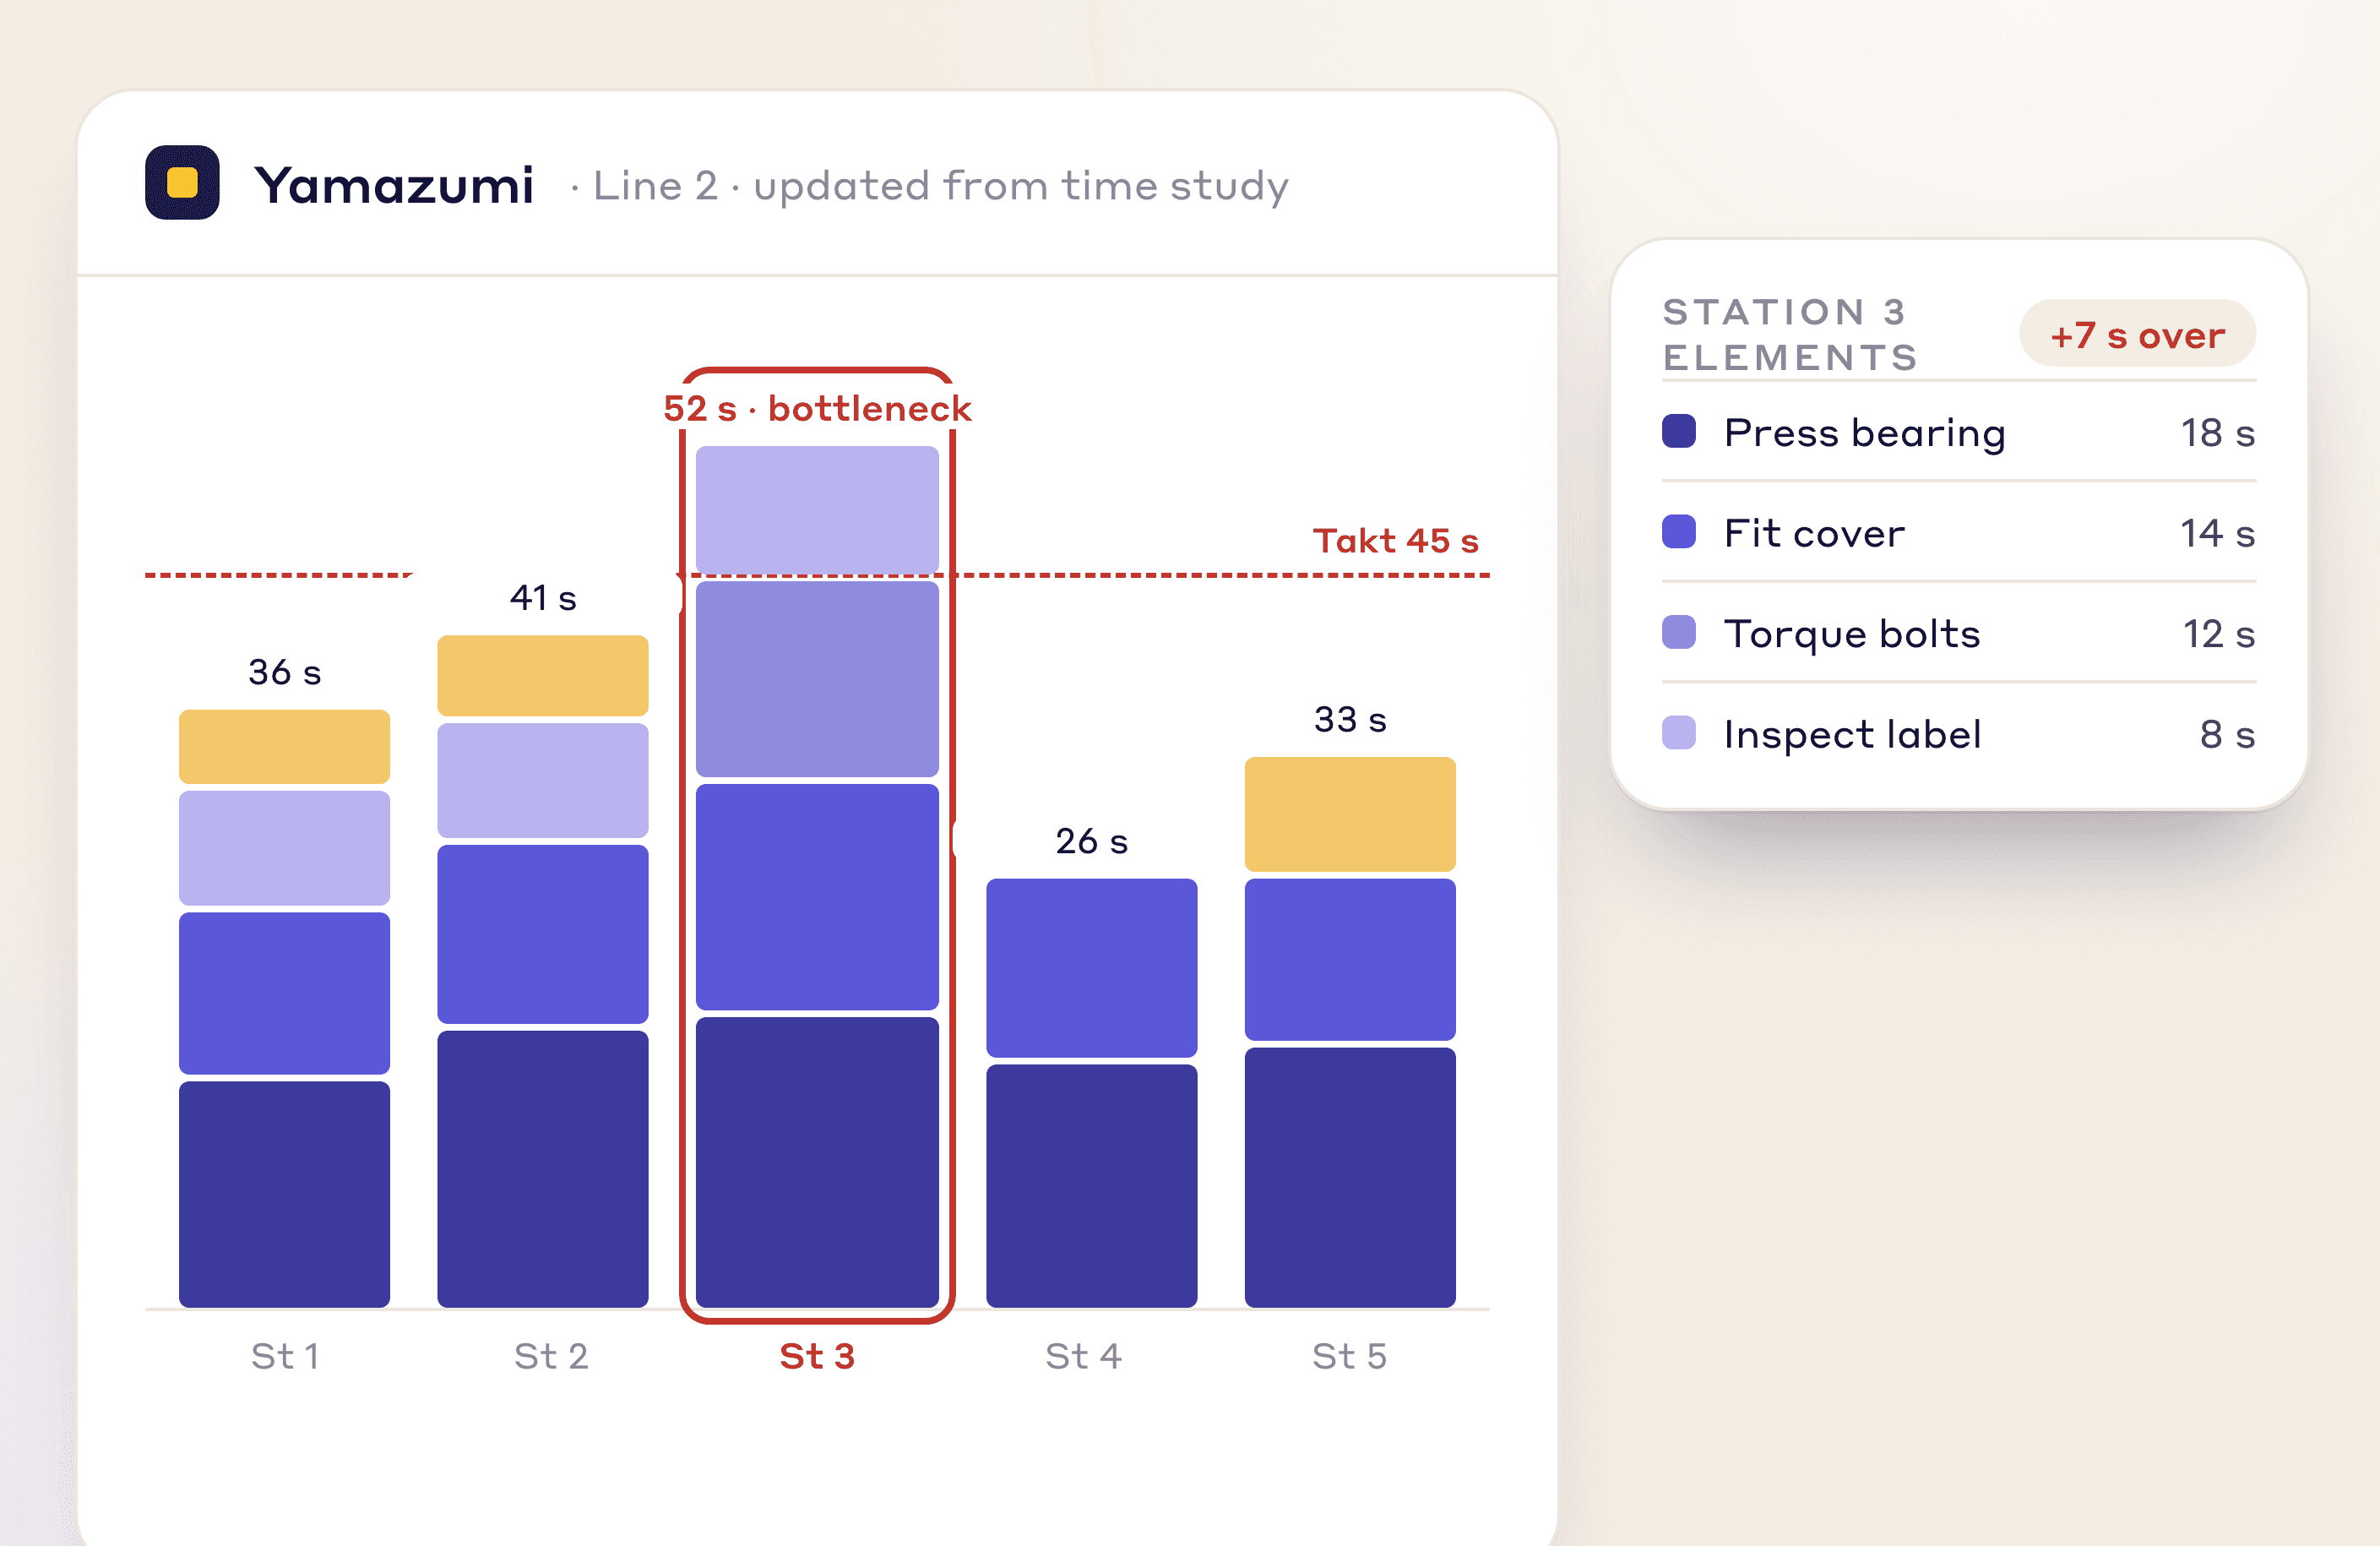
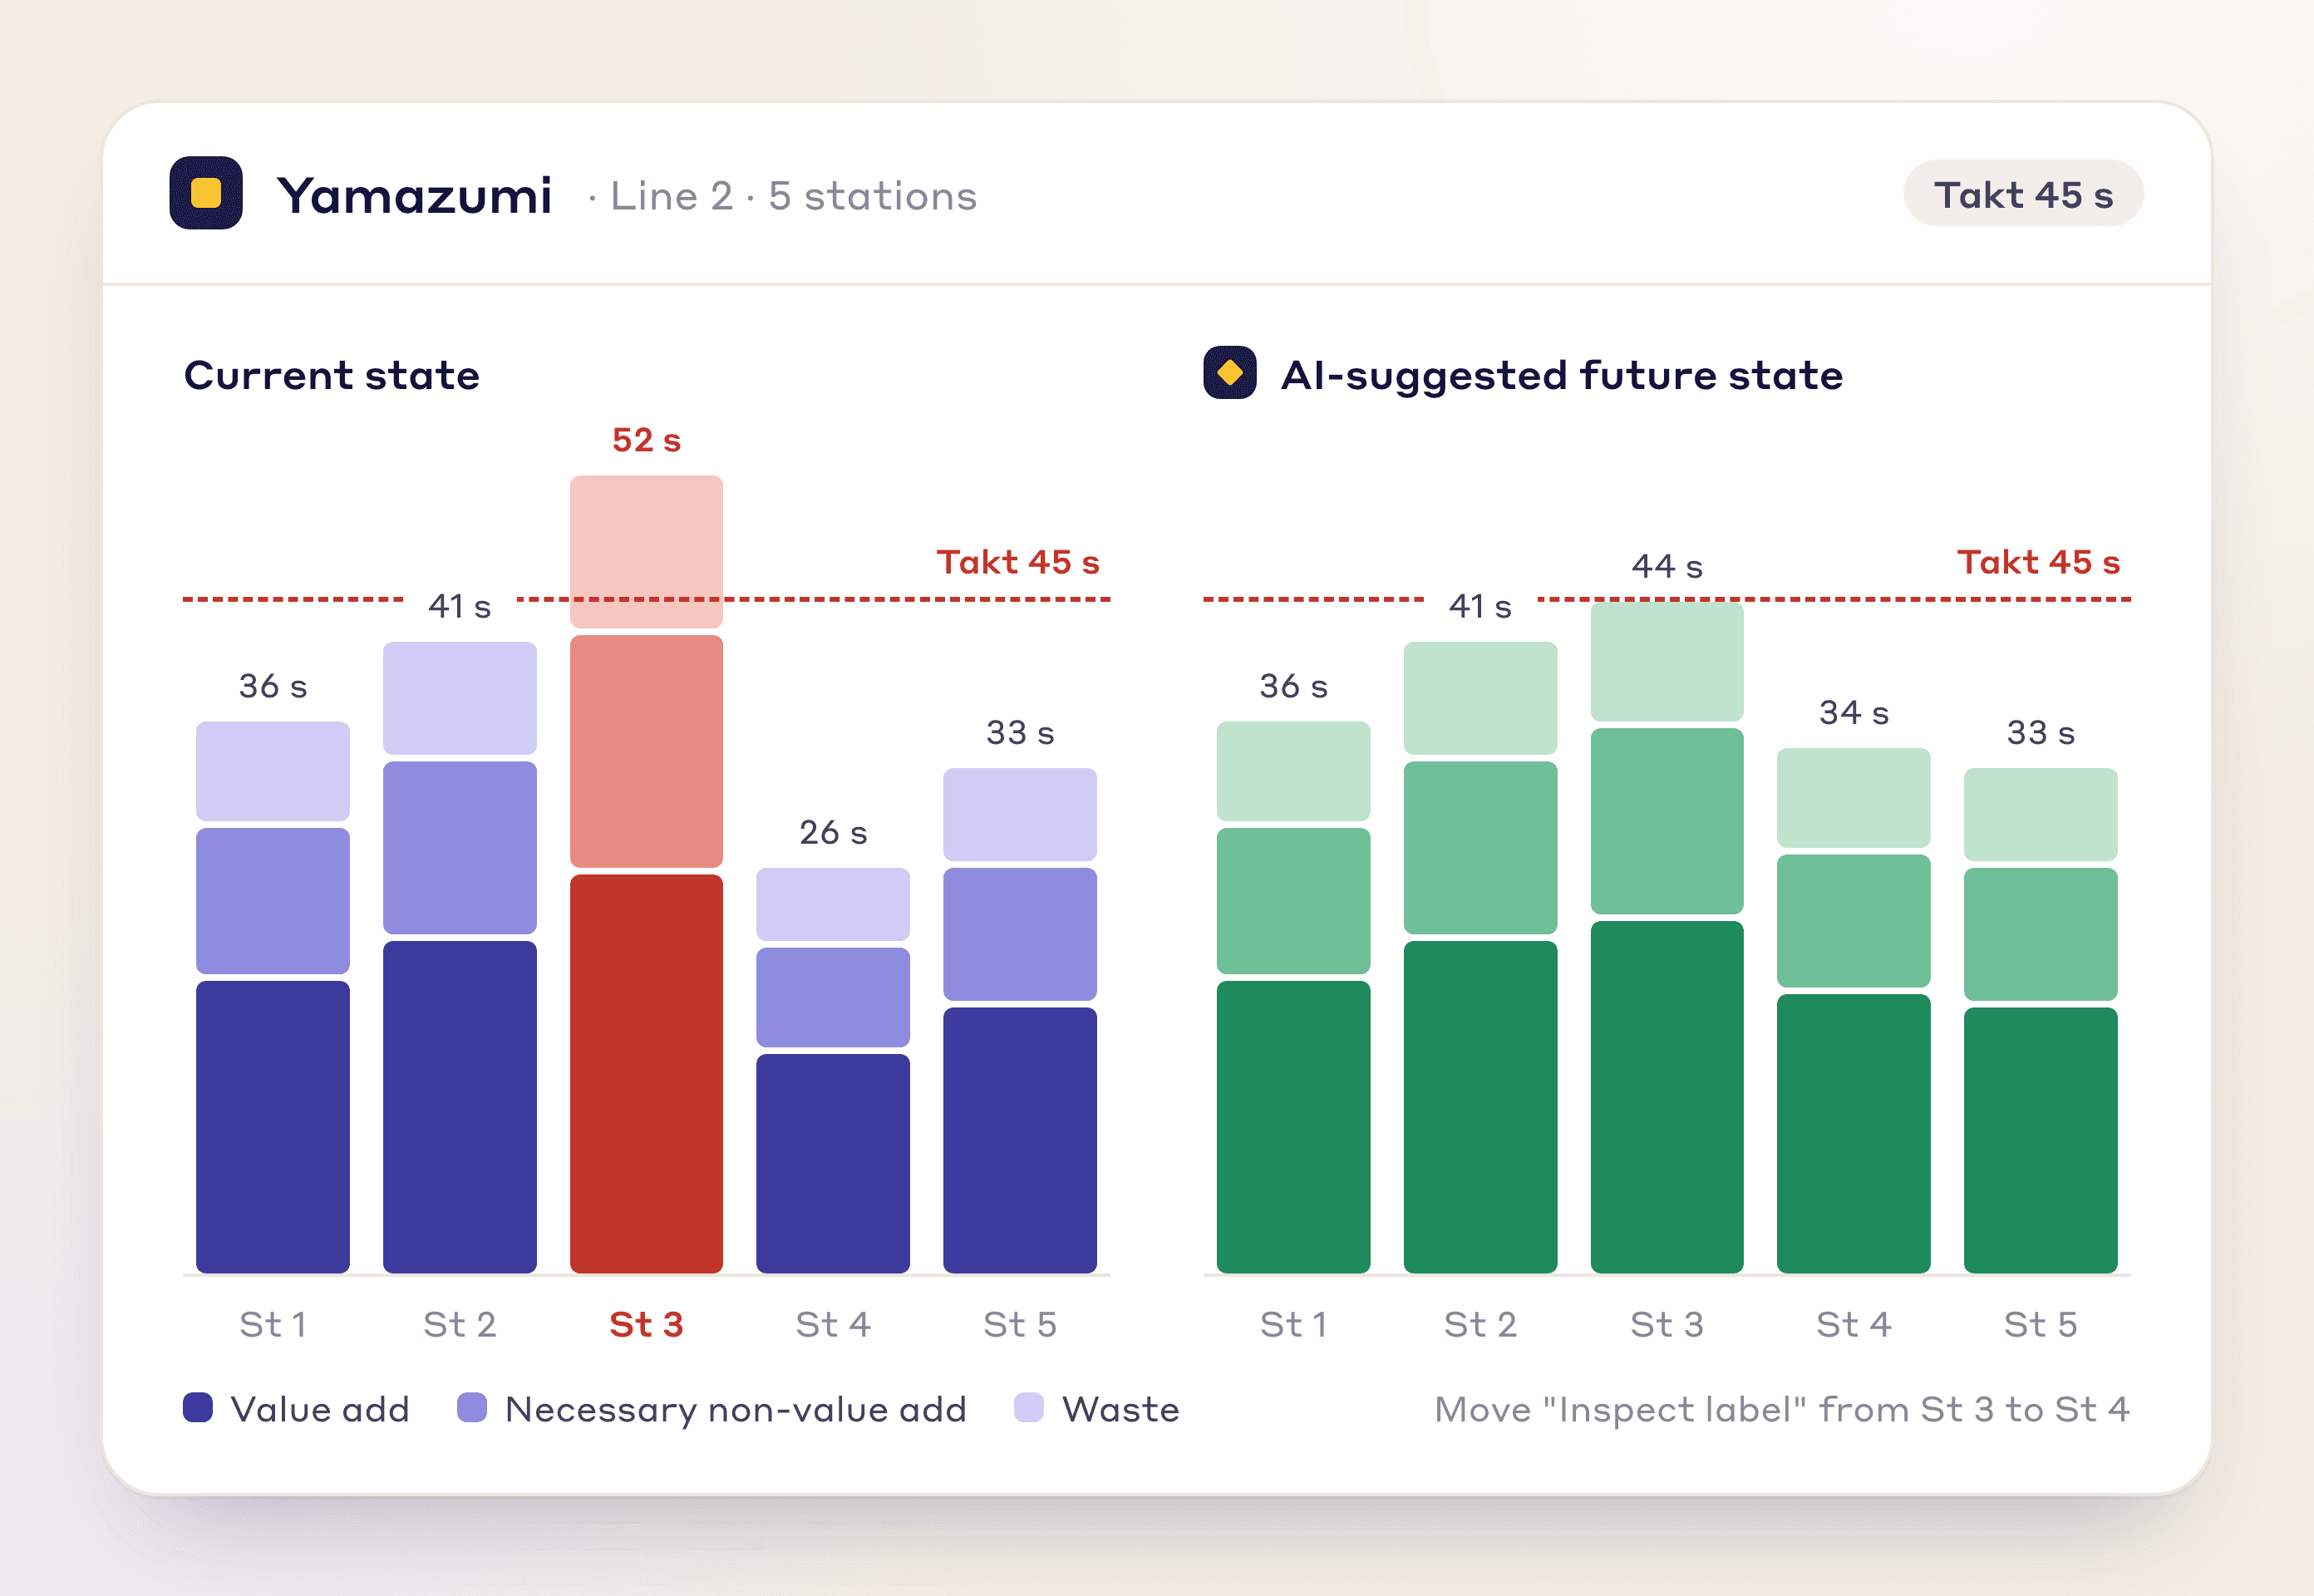
Each station's cycle time becomes a stacked bar of elements, split into value-added, semi-value-added and non-value-added time.
Auto-generated stacked bars per station
Element-level color coding tied to time study data
Instant imbalance flags against Takt time
Feature 02
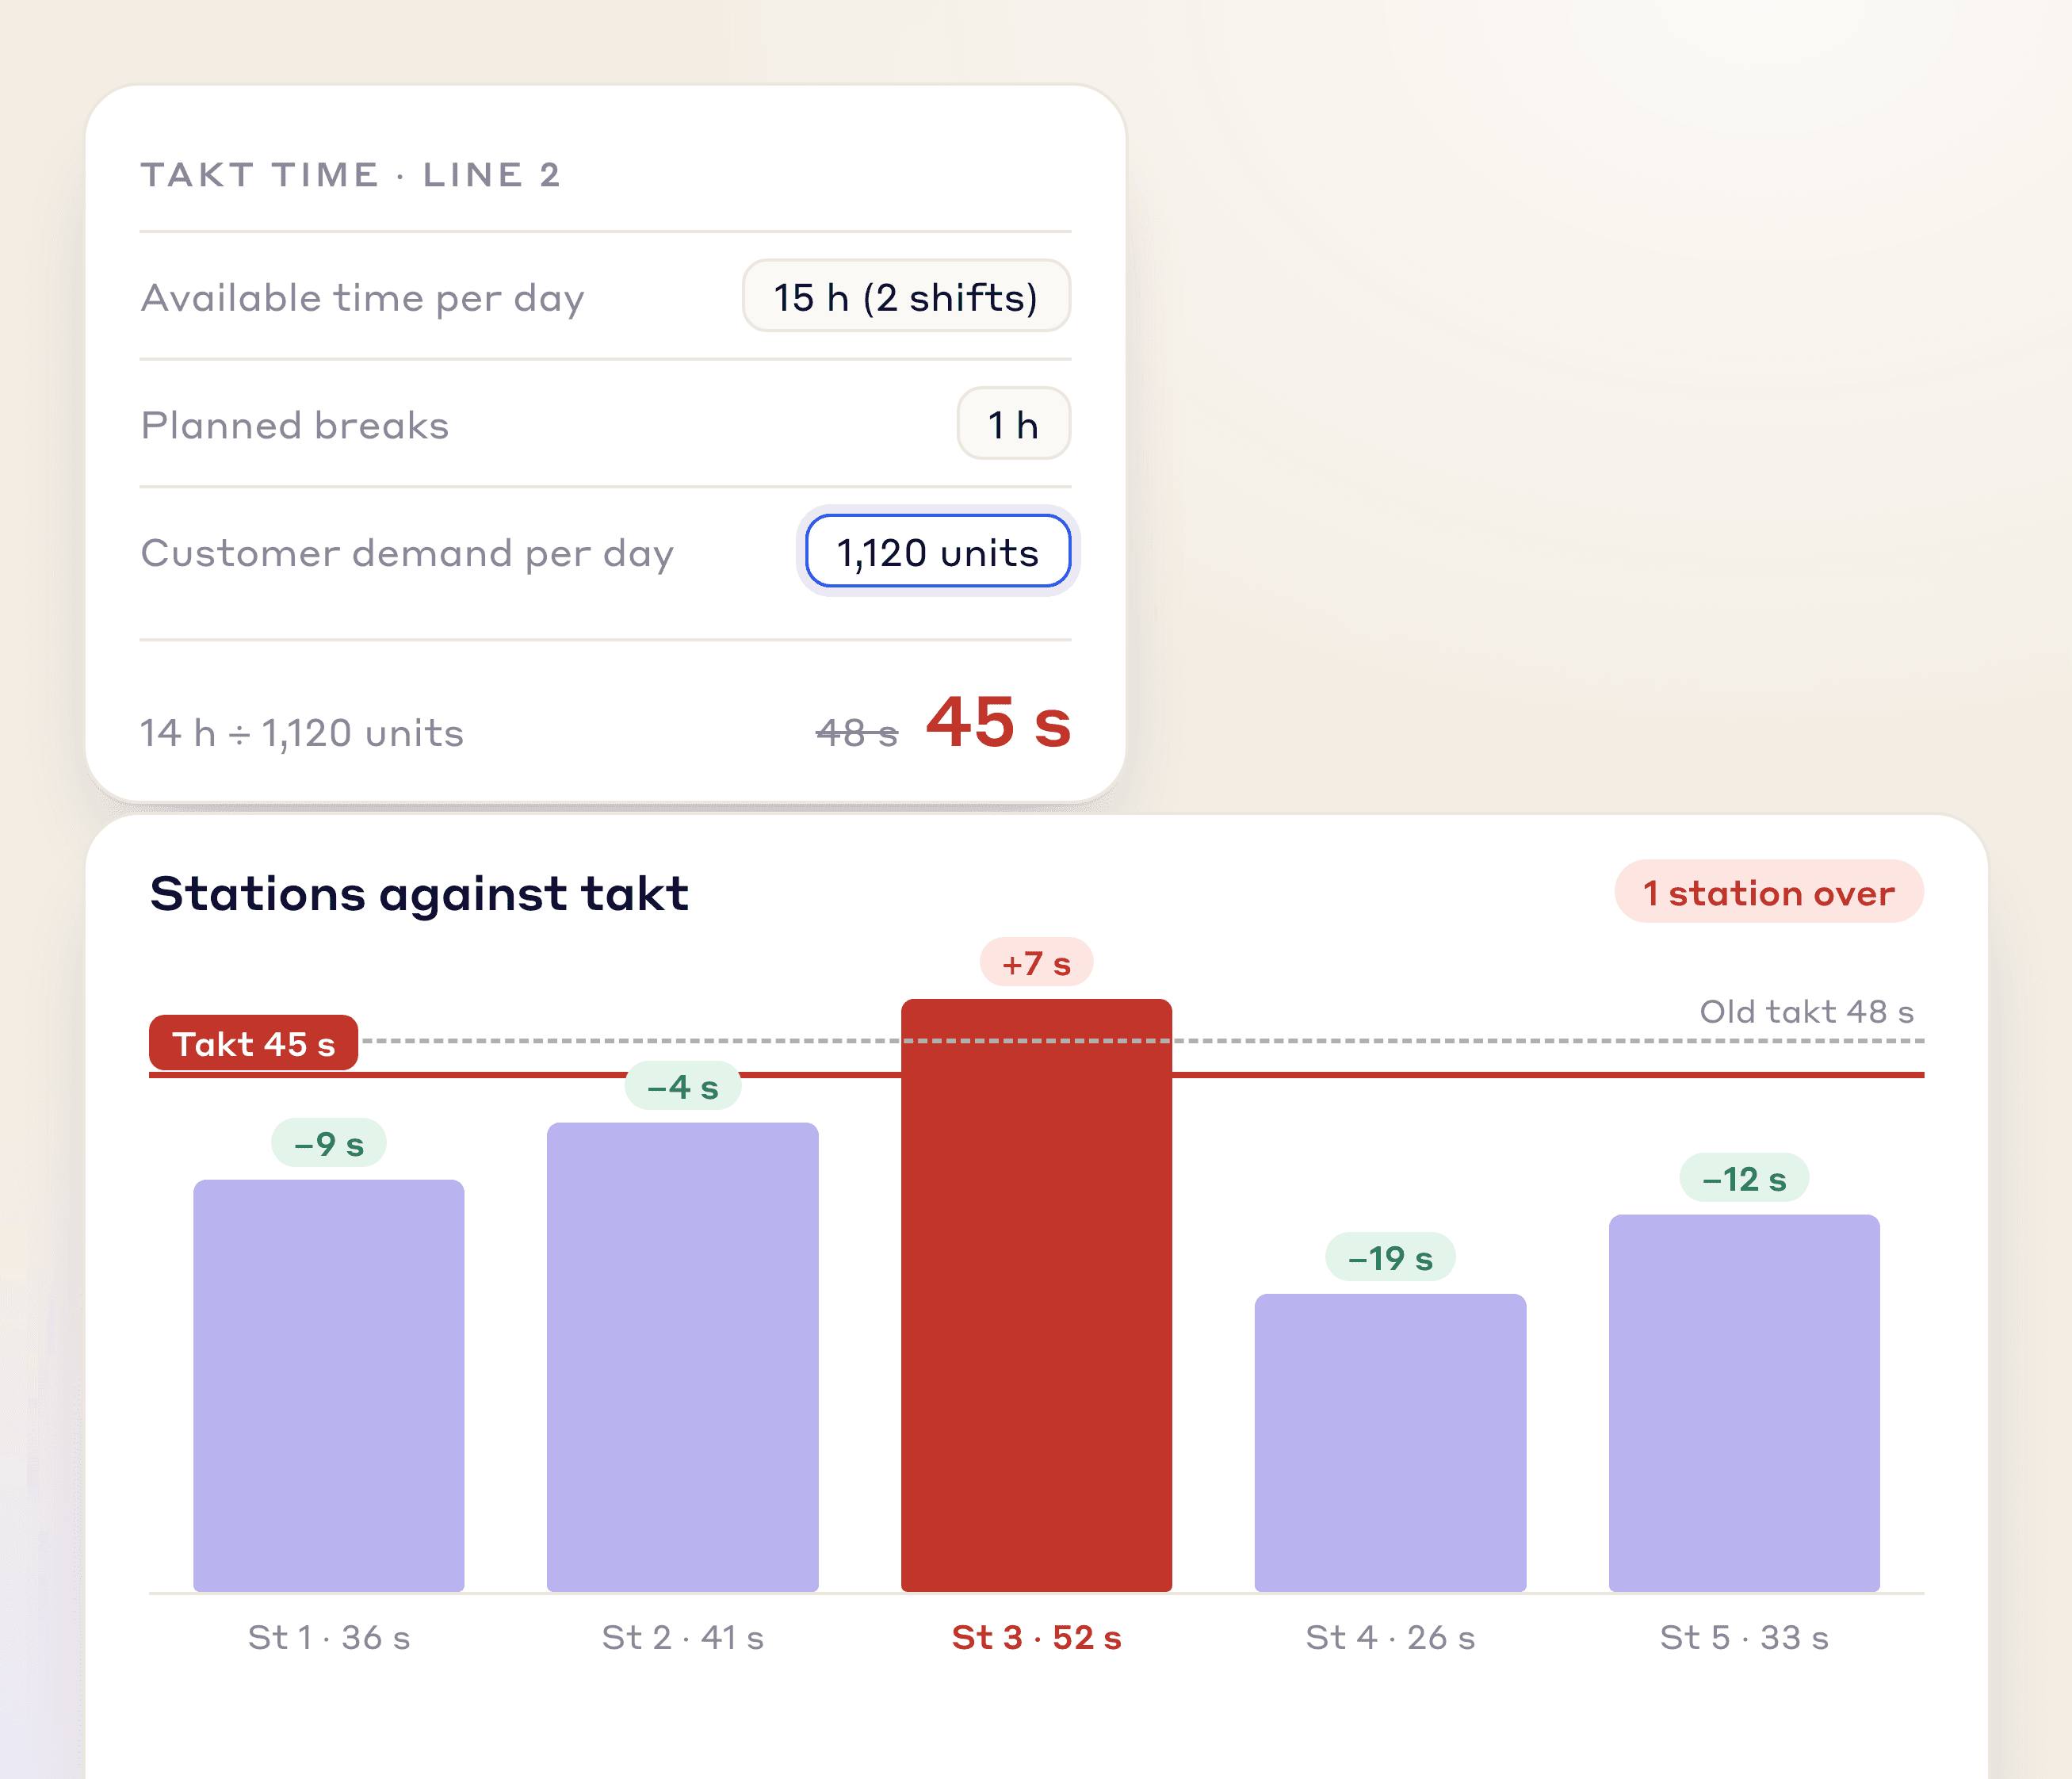
A takt line sits over every Yamazumi and recalculates when demand or shift pattern changes.
Real-time Takt recalculation on demand changes
Overlay updates across all stations simultaneously
Instant over/under-Takt visibility
Feature 03
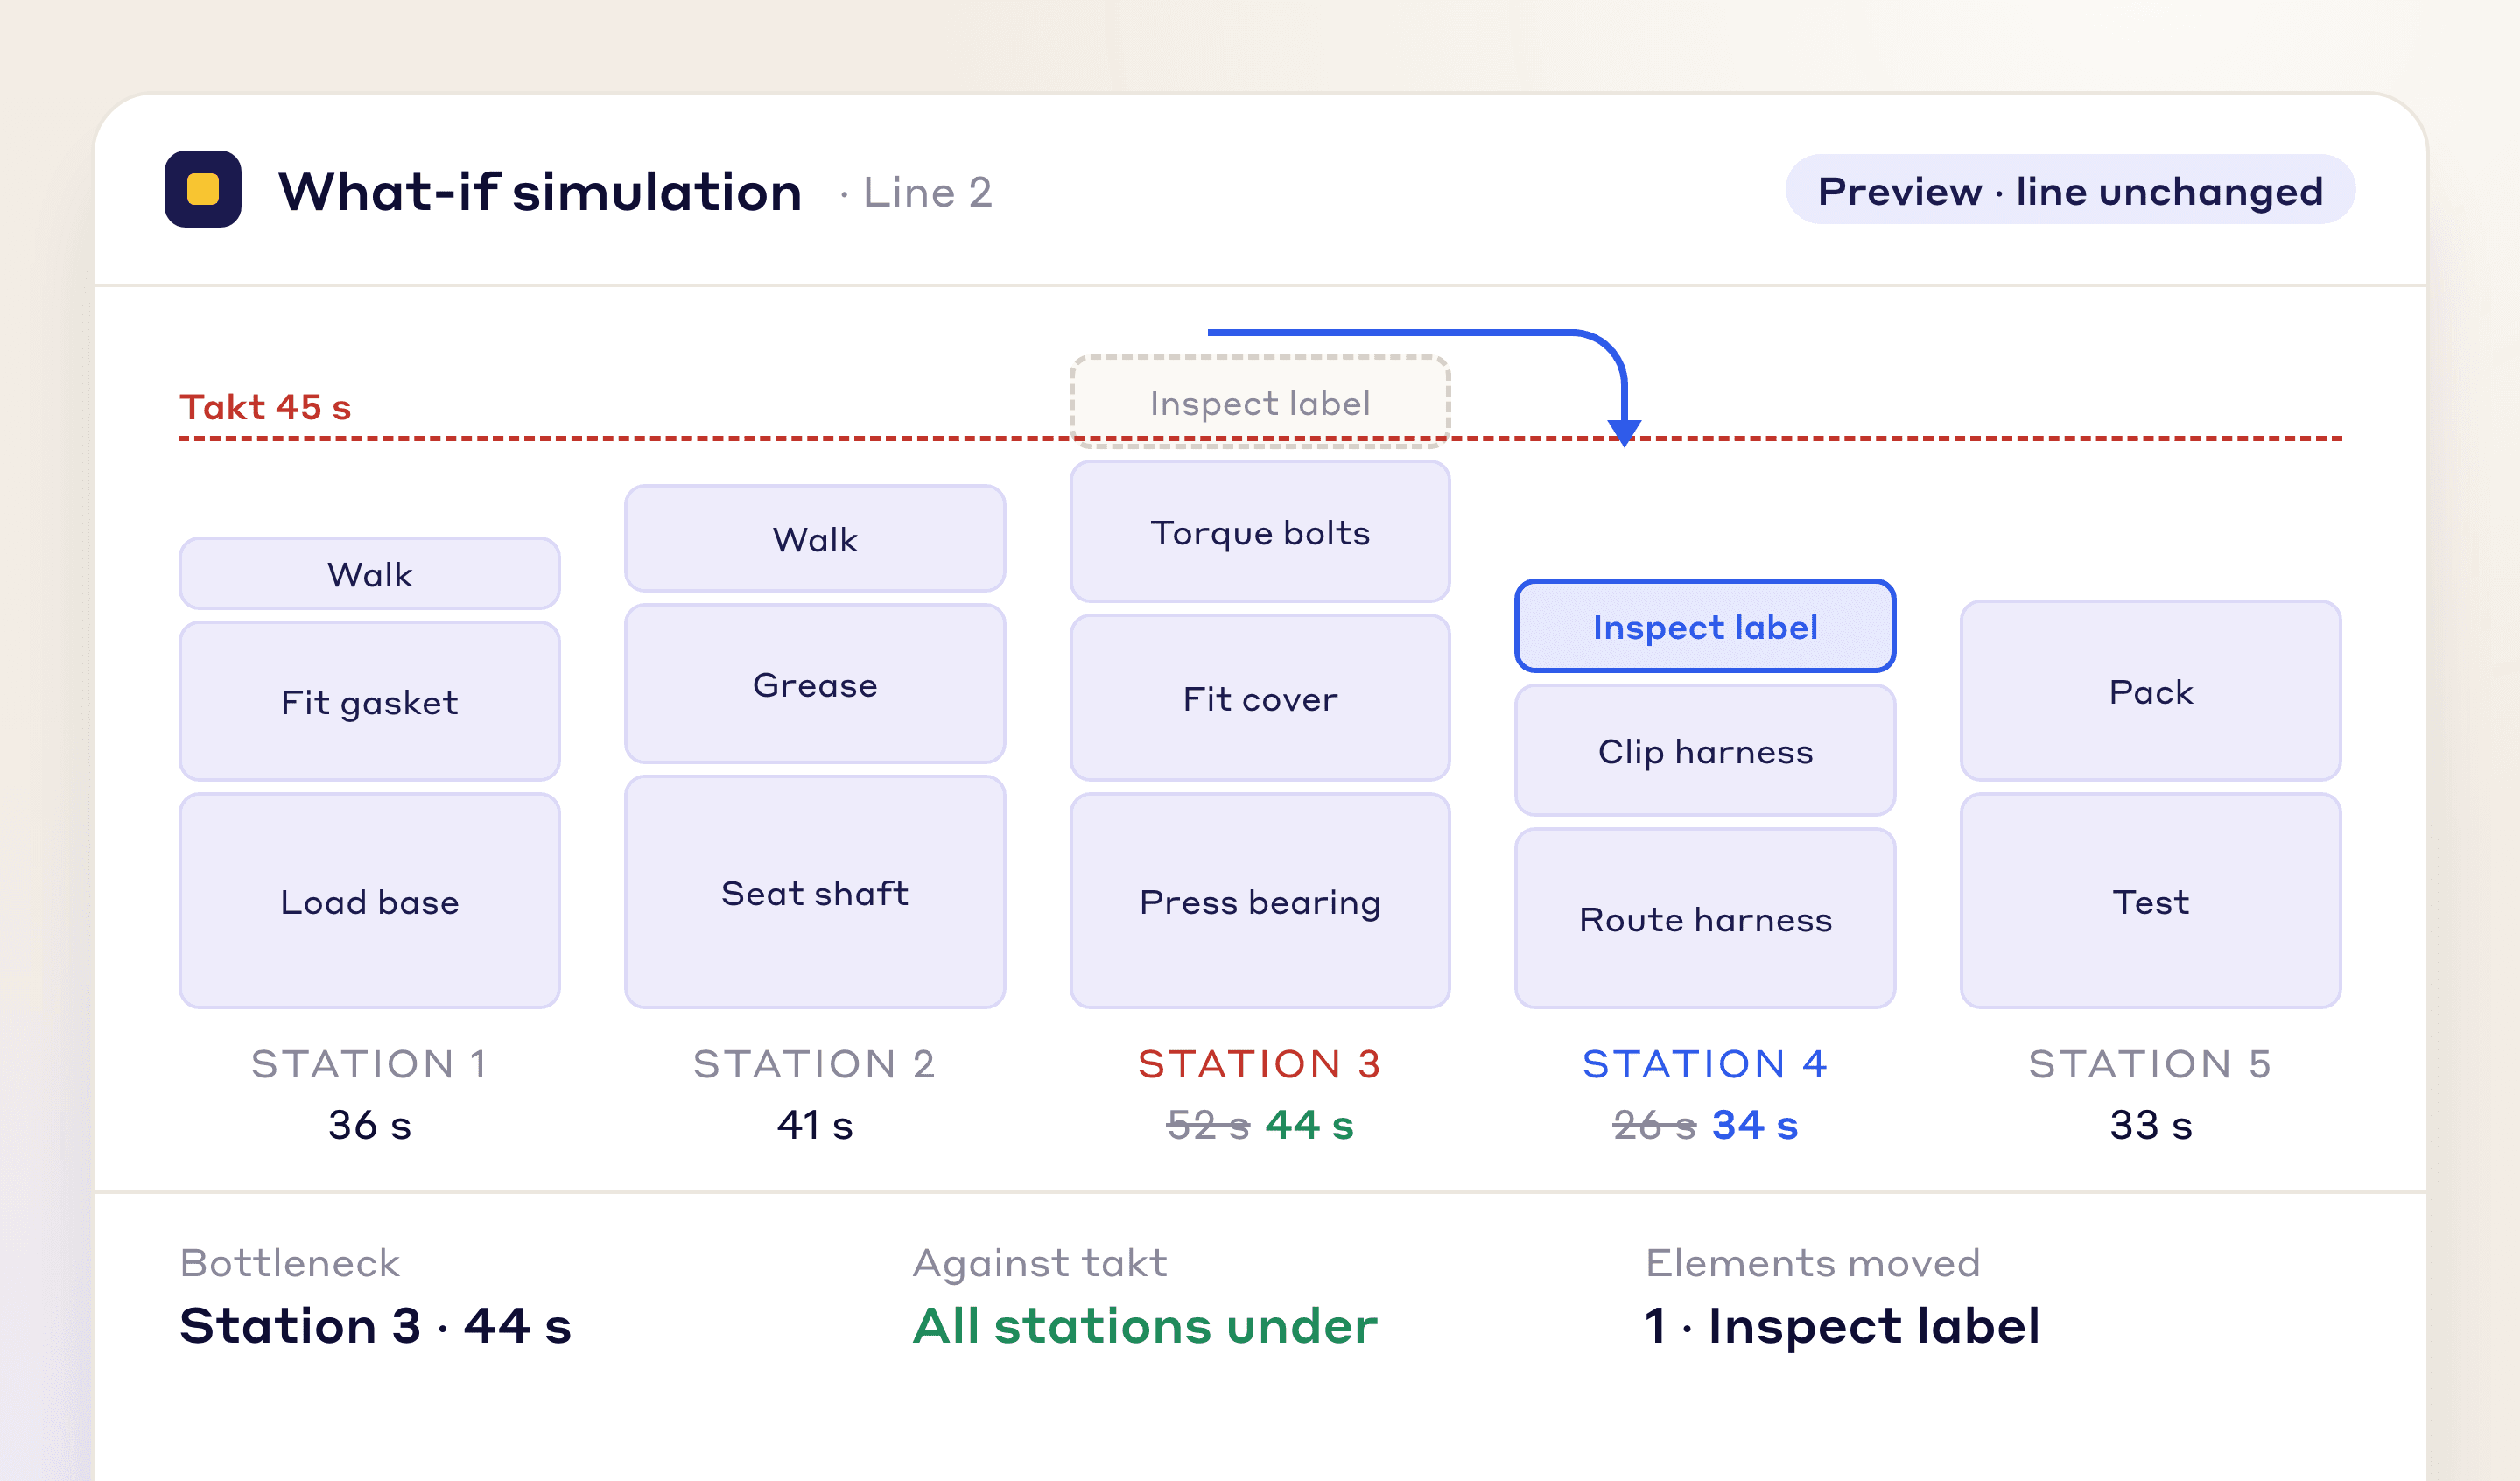
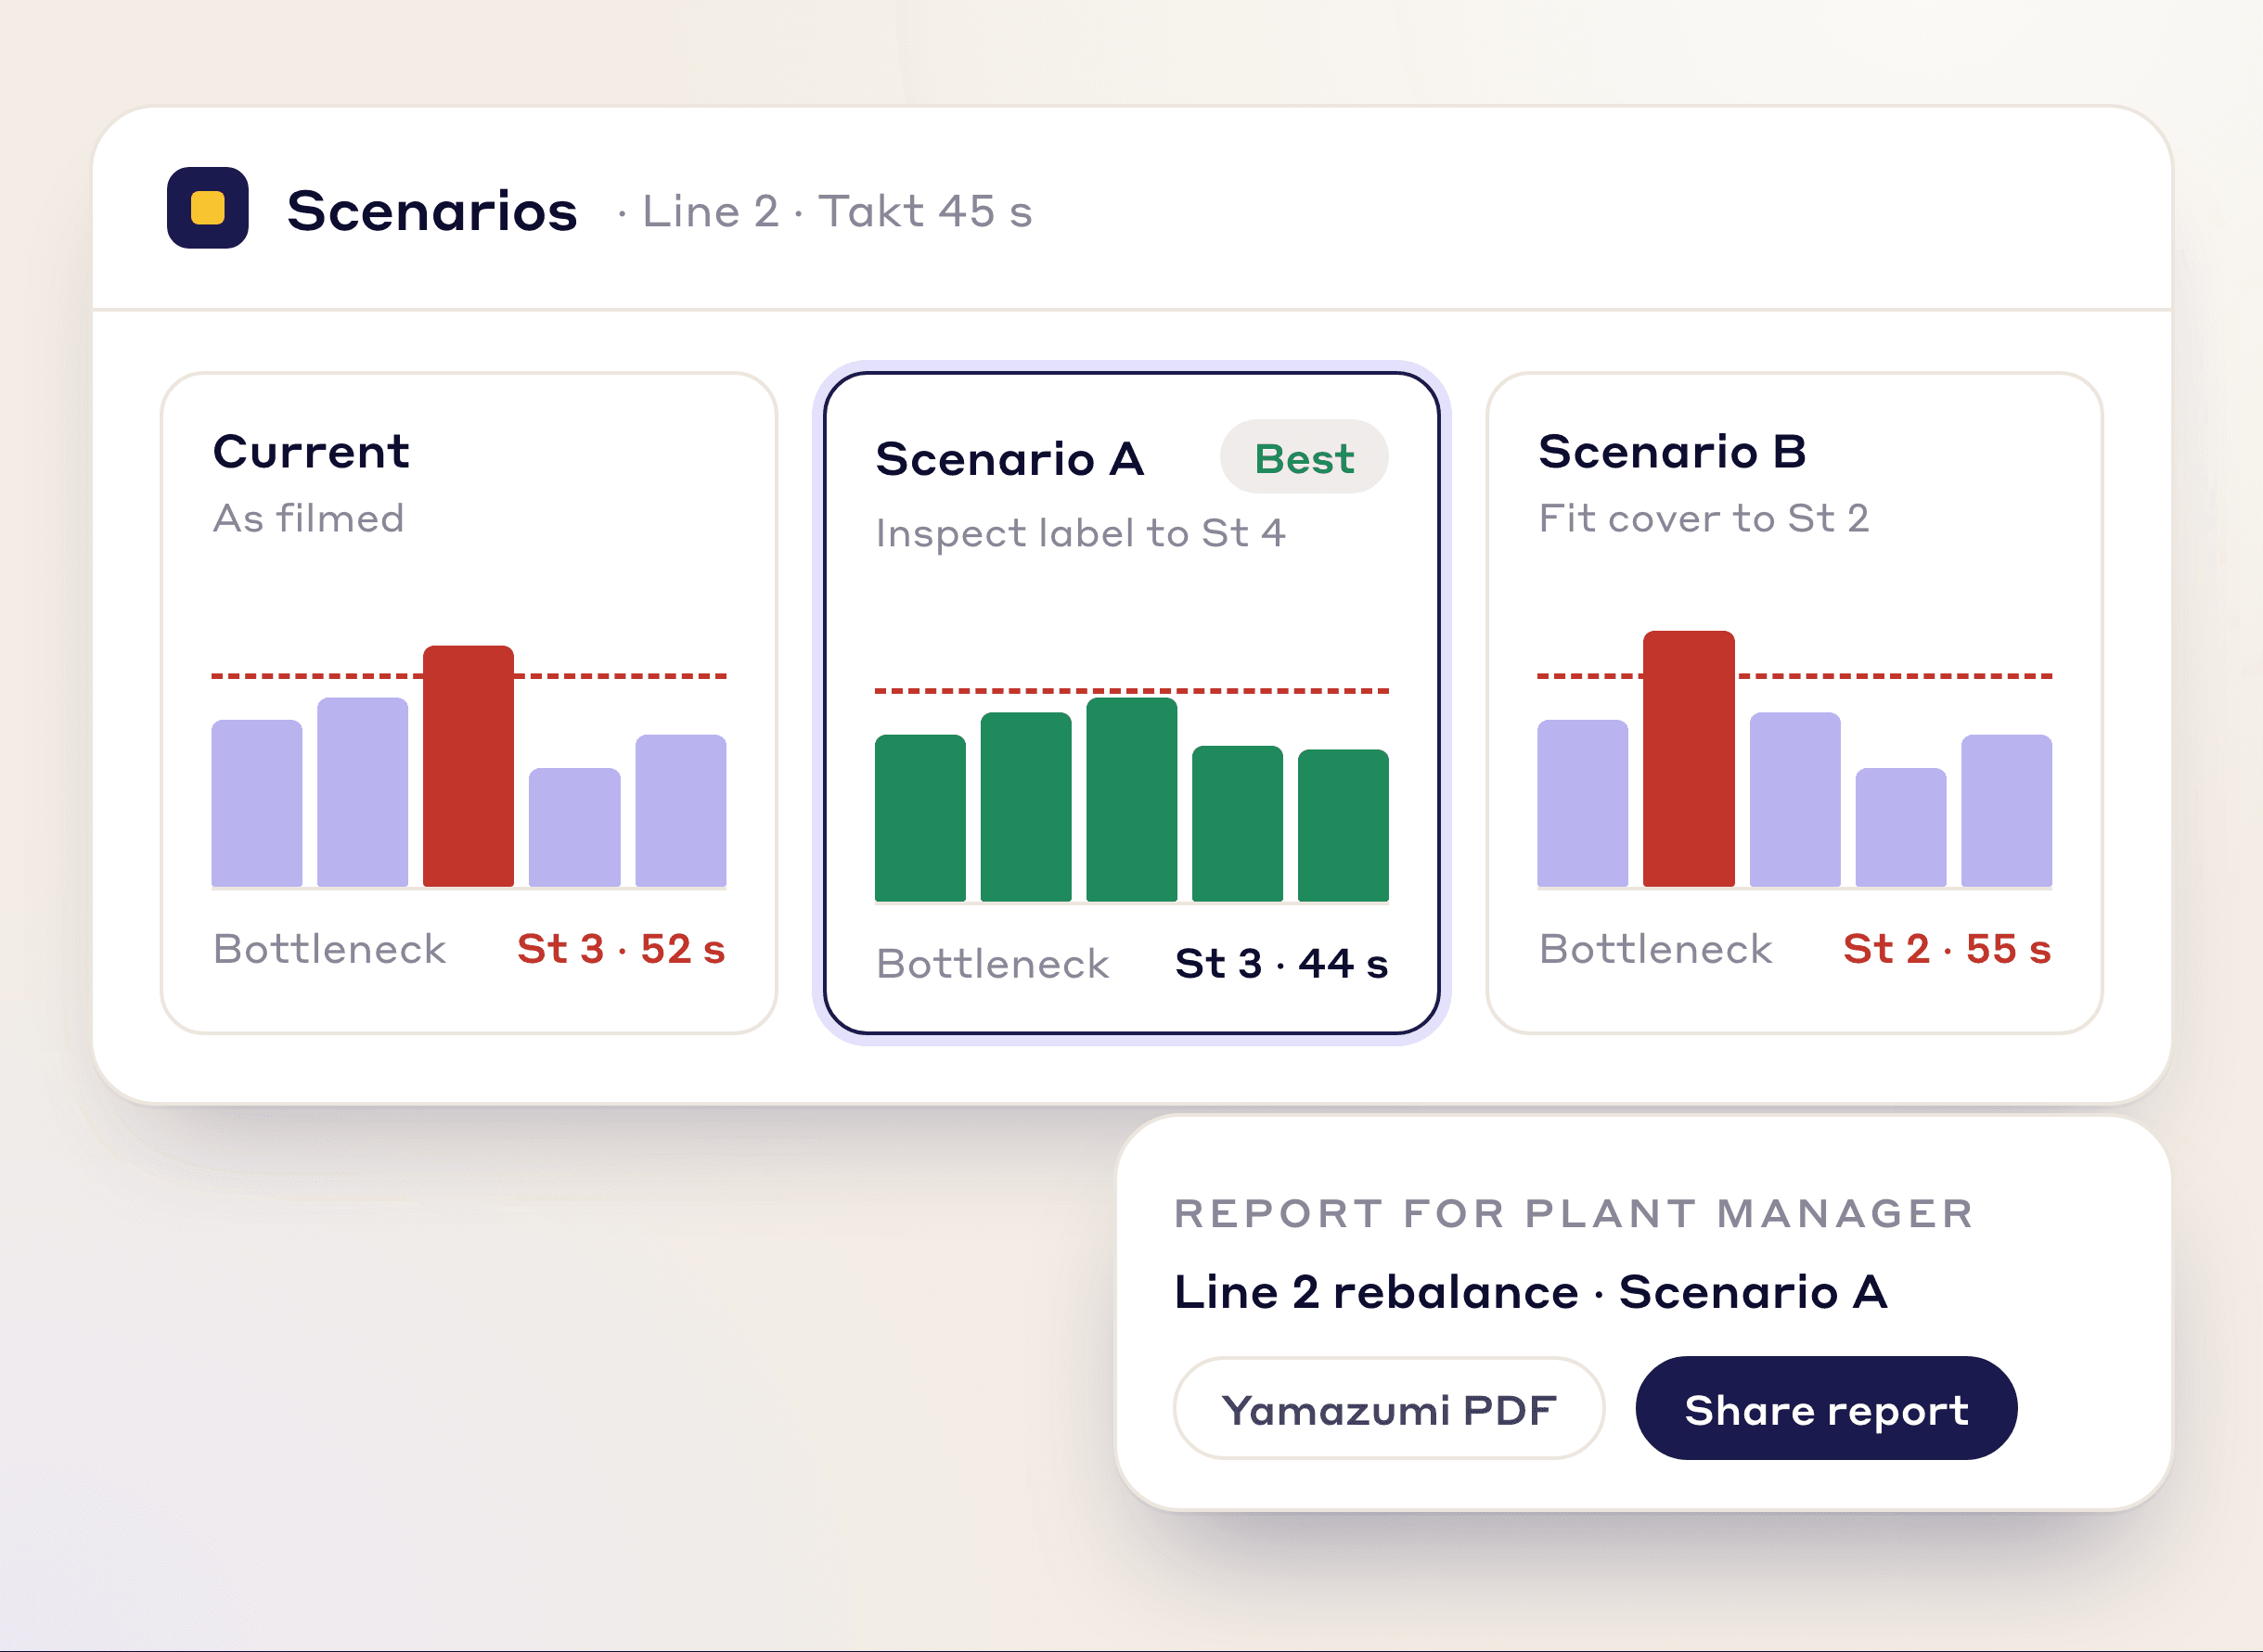
Drag an element to another operator or station and the balance redraws. Save each idea as a scenario with the minutes and cost it saves.
Drag-and-drop element reassignment
Real-time balance and Takt impact
Saved scenarios with minutes and cost saved
Before-and-after study comparison
Feature 04
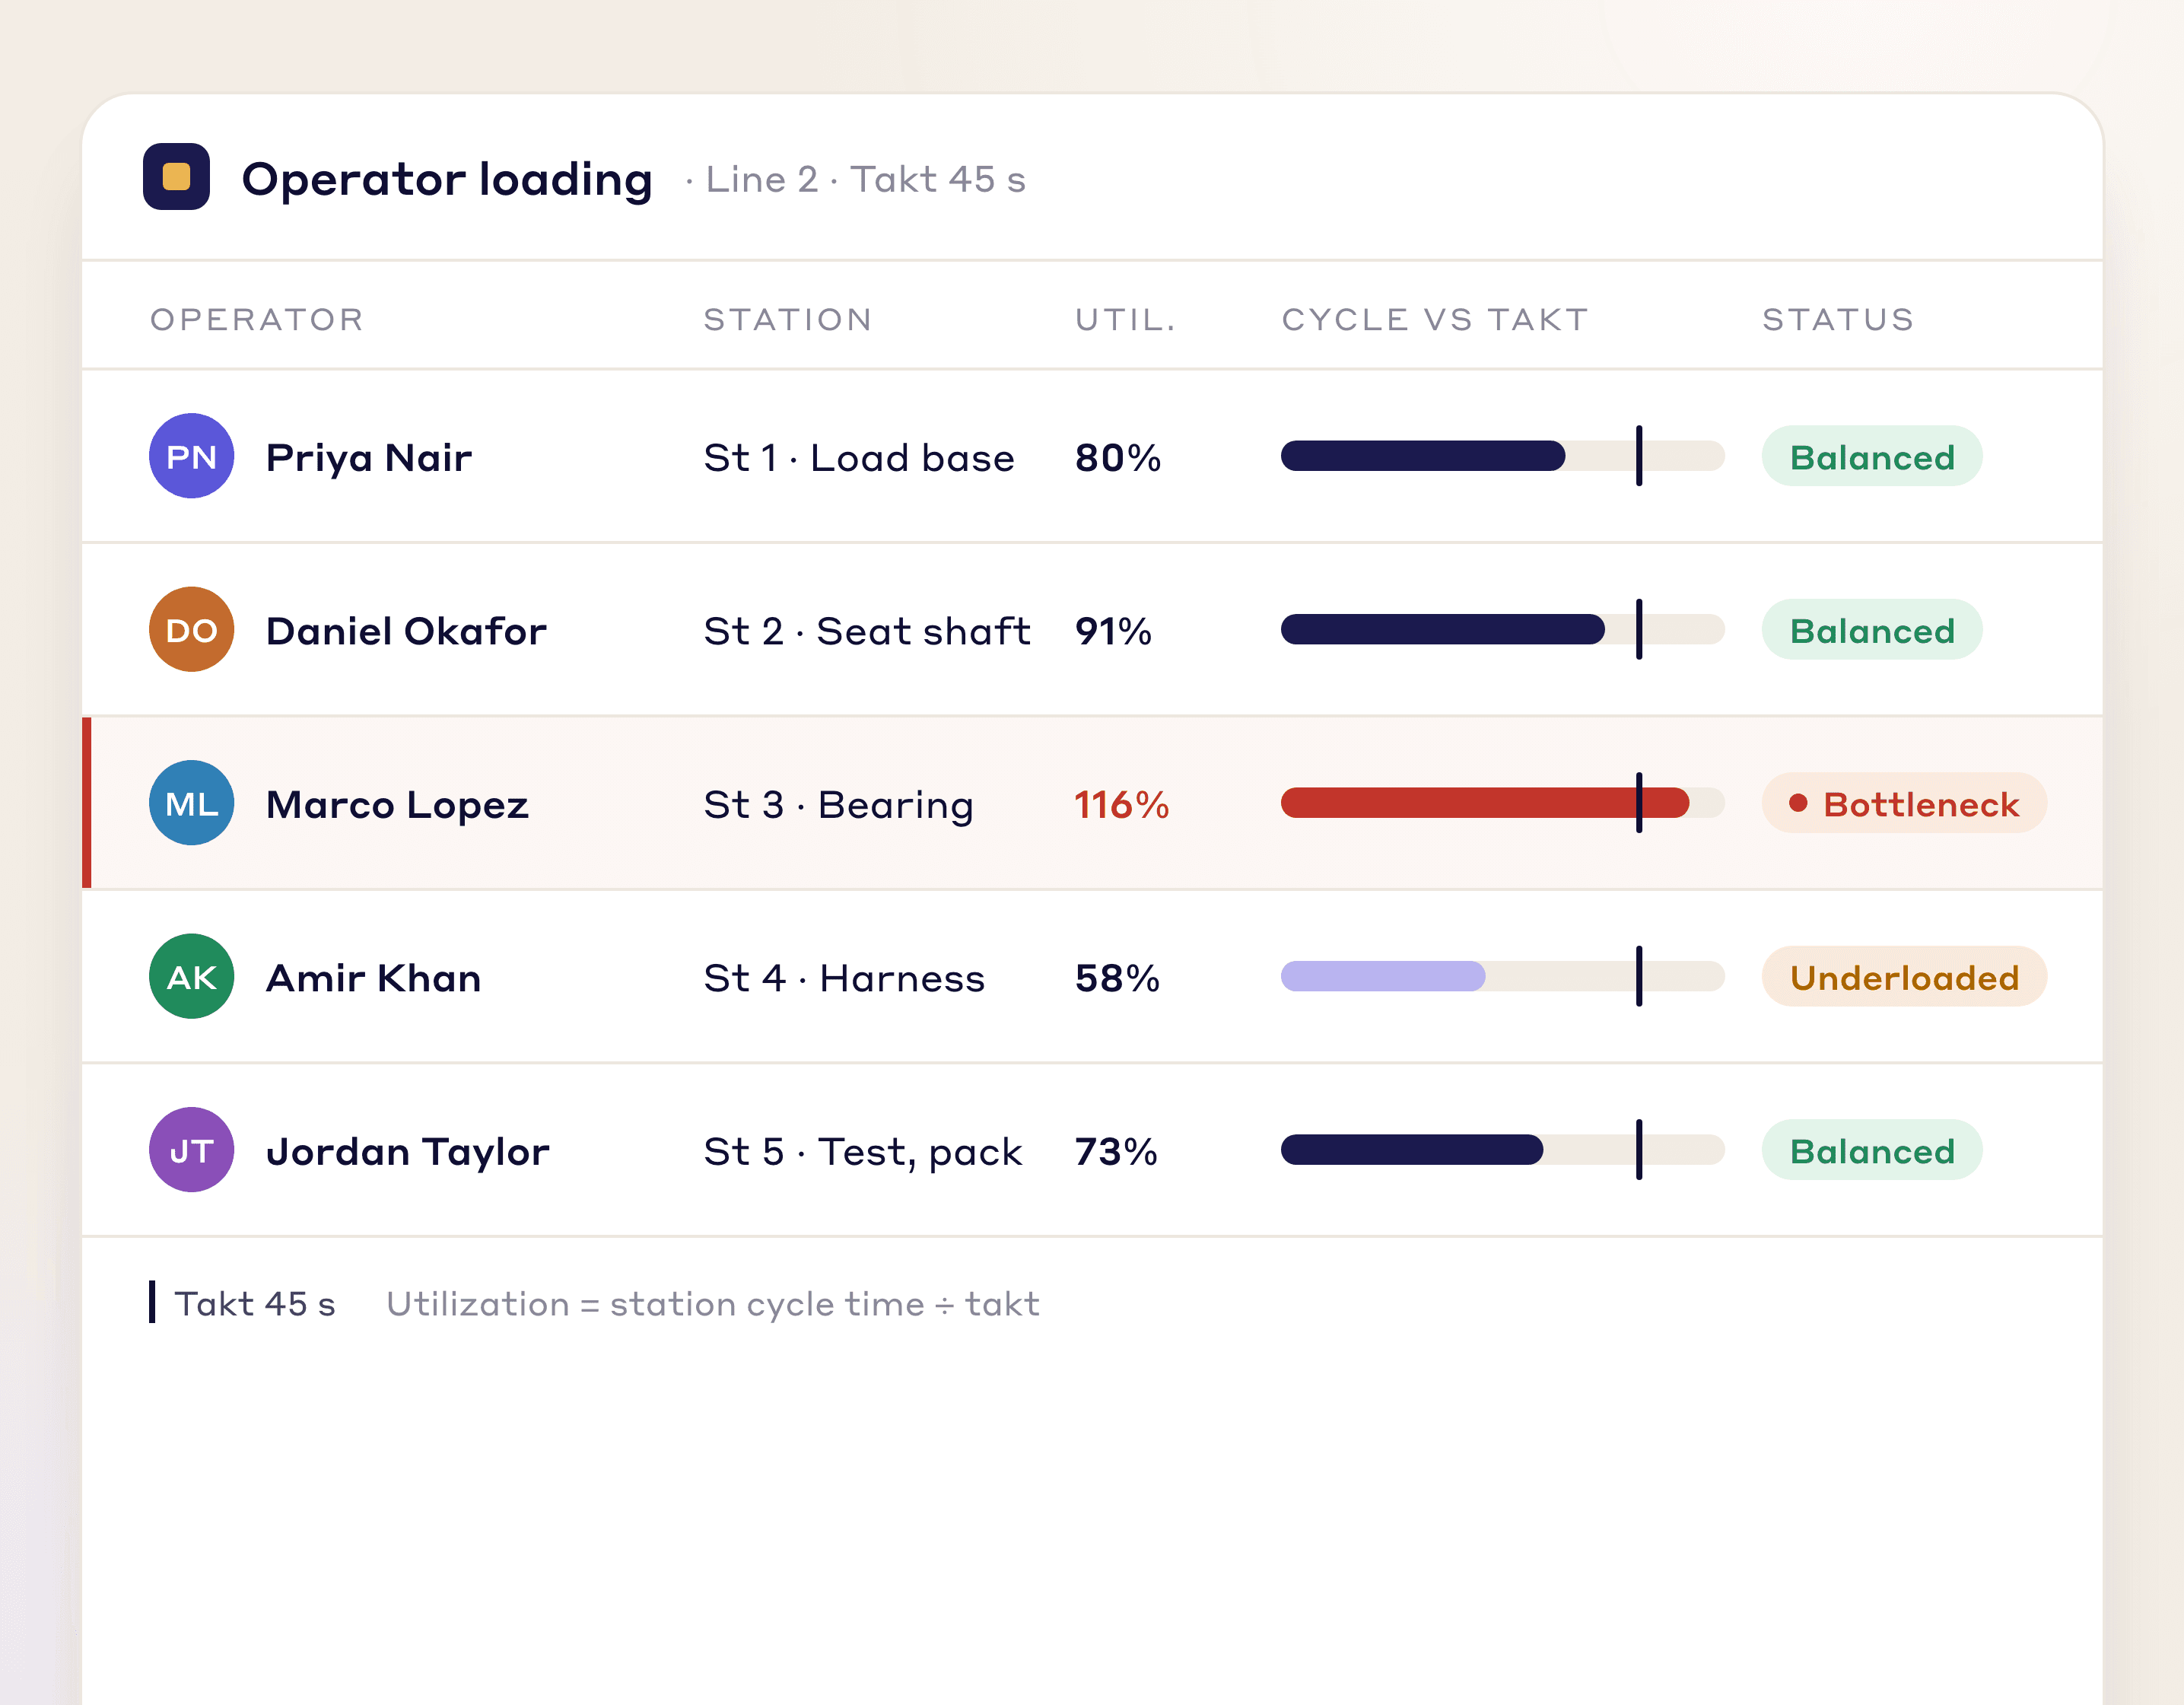
Each operator's utilization against takt, with bottlenecks and idle time in one view.
Per-operator utilization %
Operator vs. station comparison view
Bottleneck and idle-time detection
Feature 05
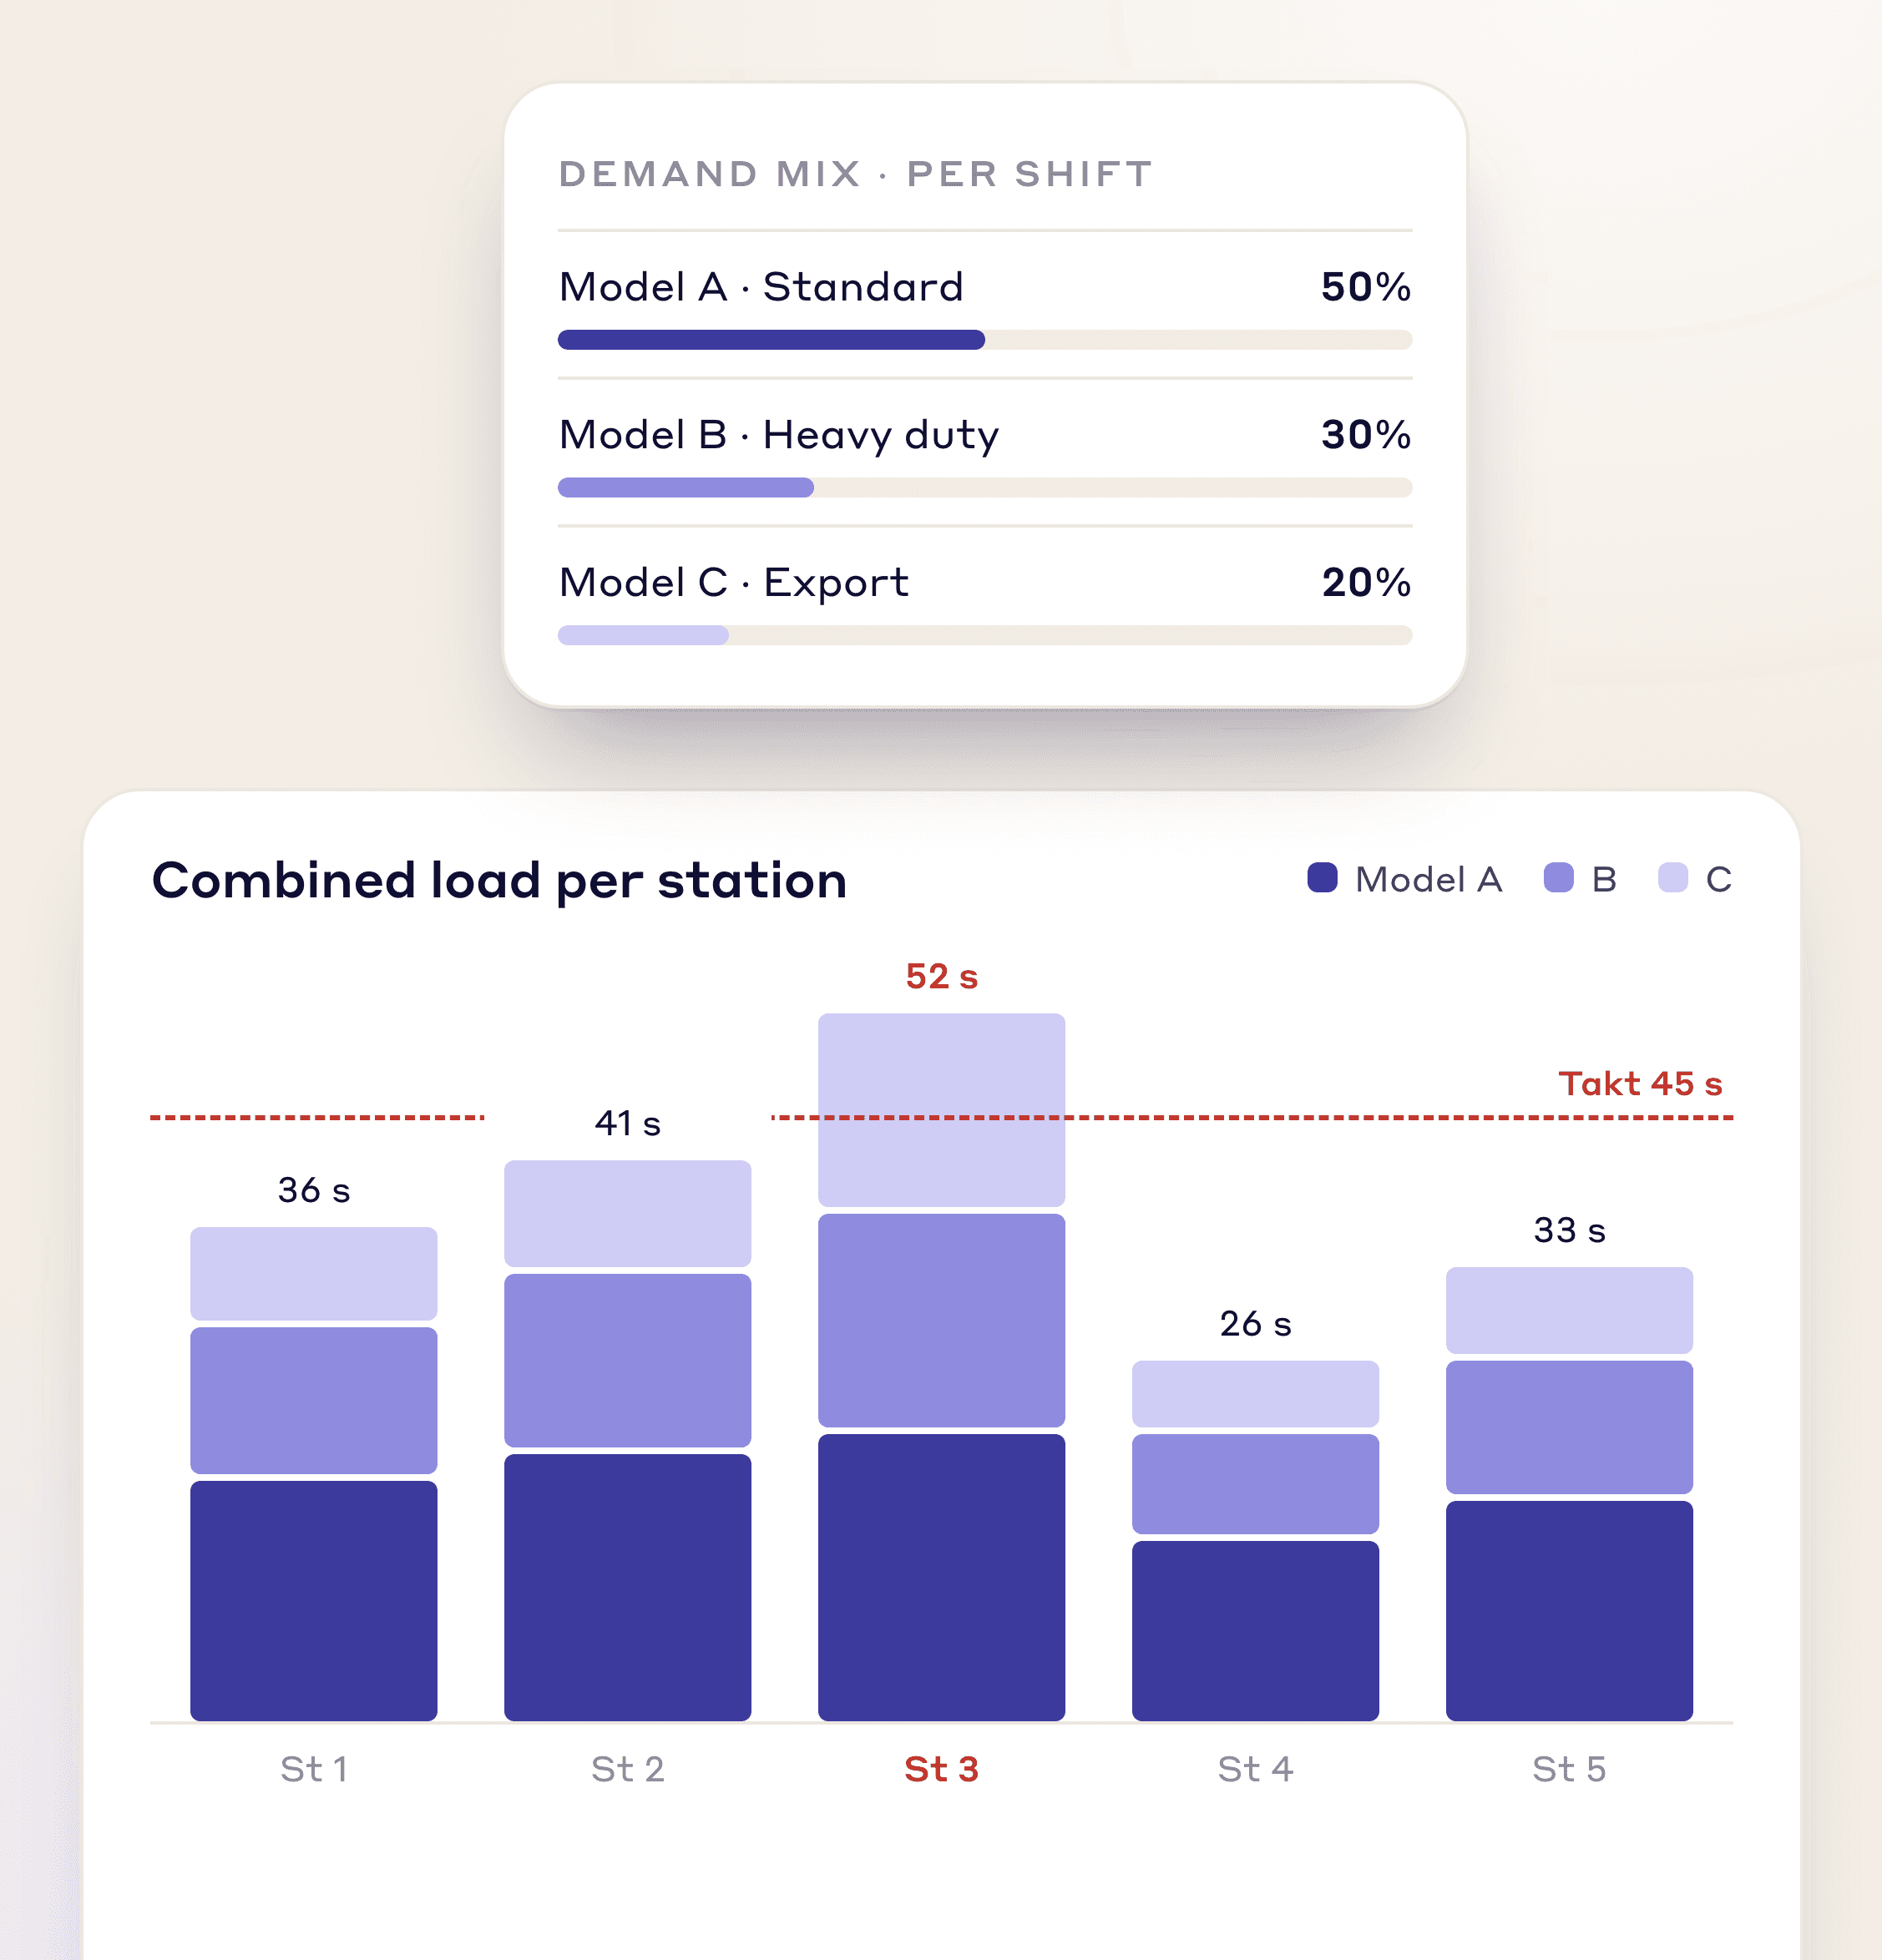
Balance multi-product lines by the real demand mix and see each station's combined load.
Weighted demand-mix balancing
Multi-product line support
Combined station load across models
Feature 06
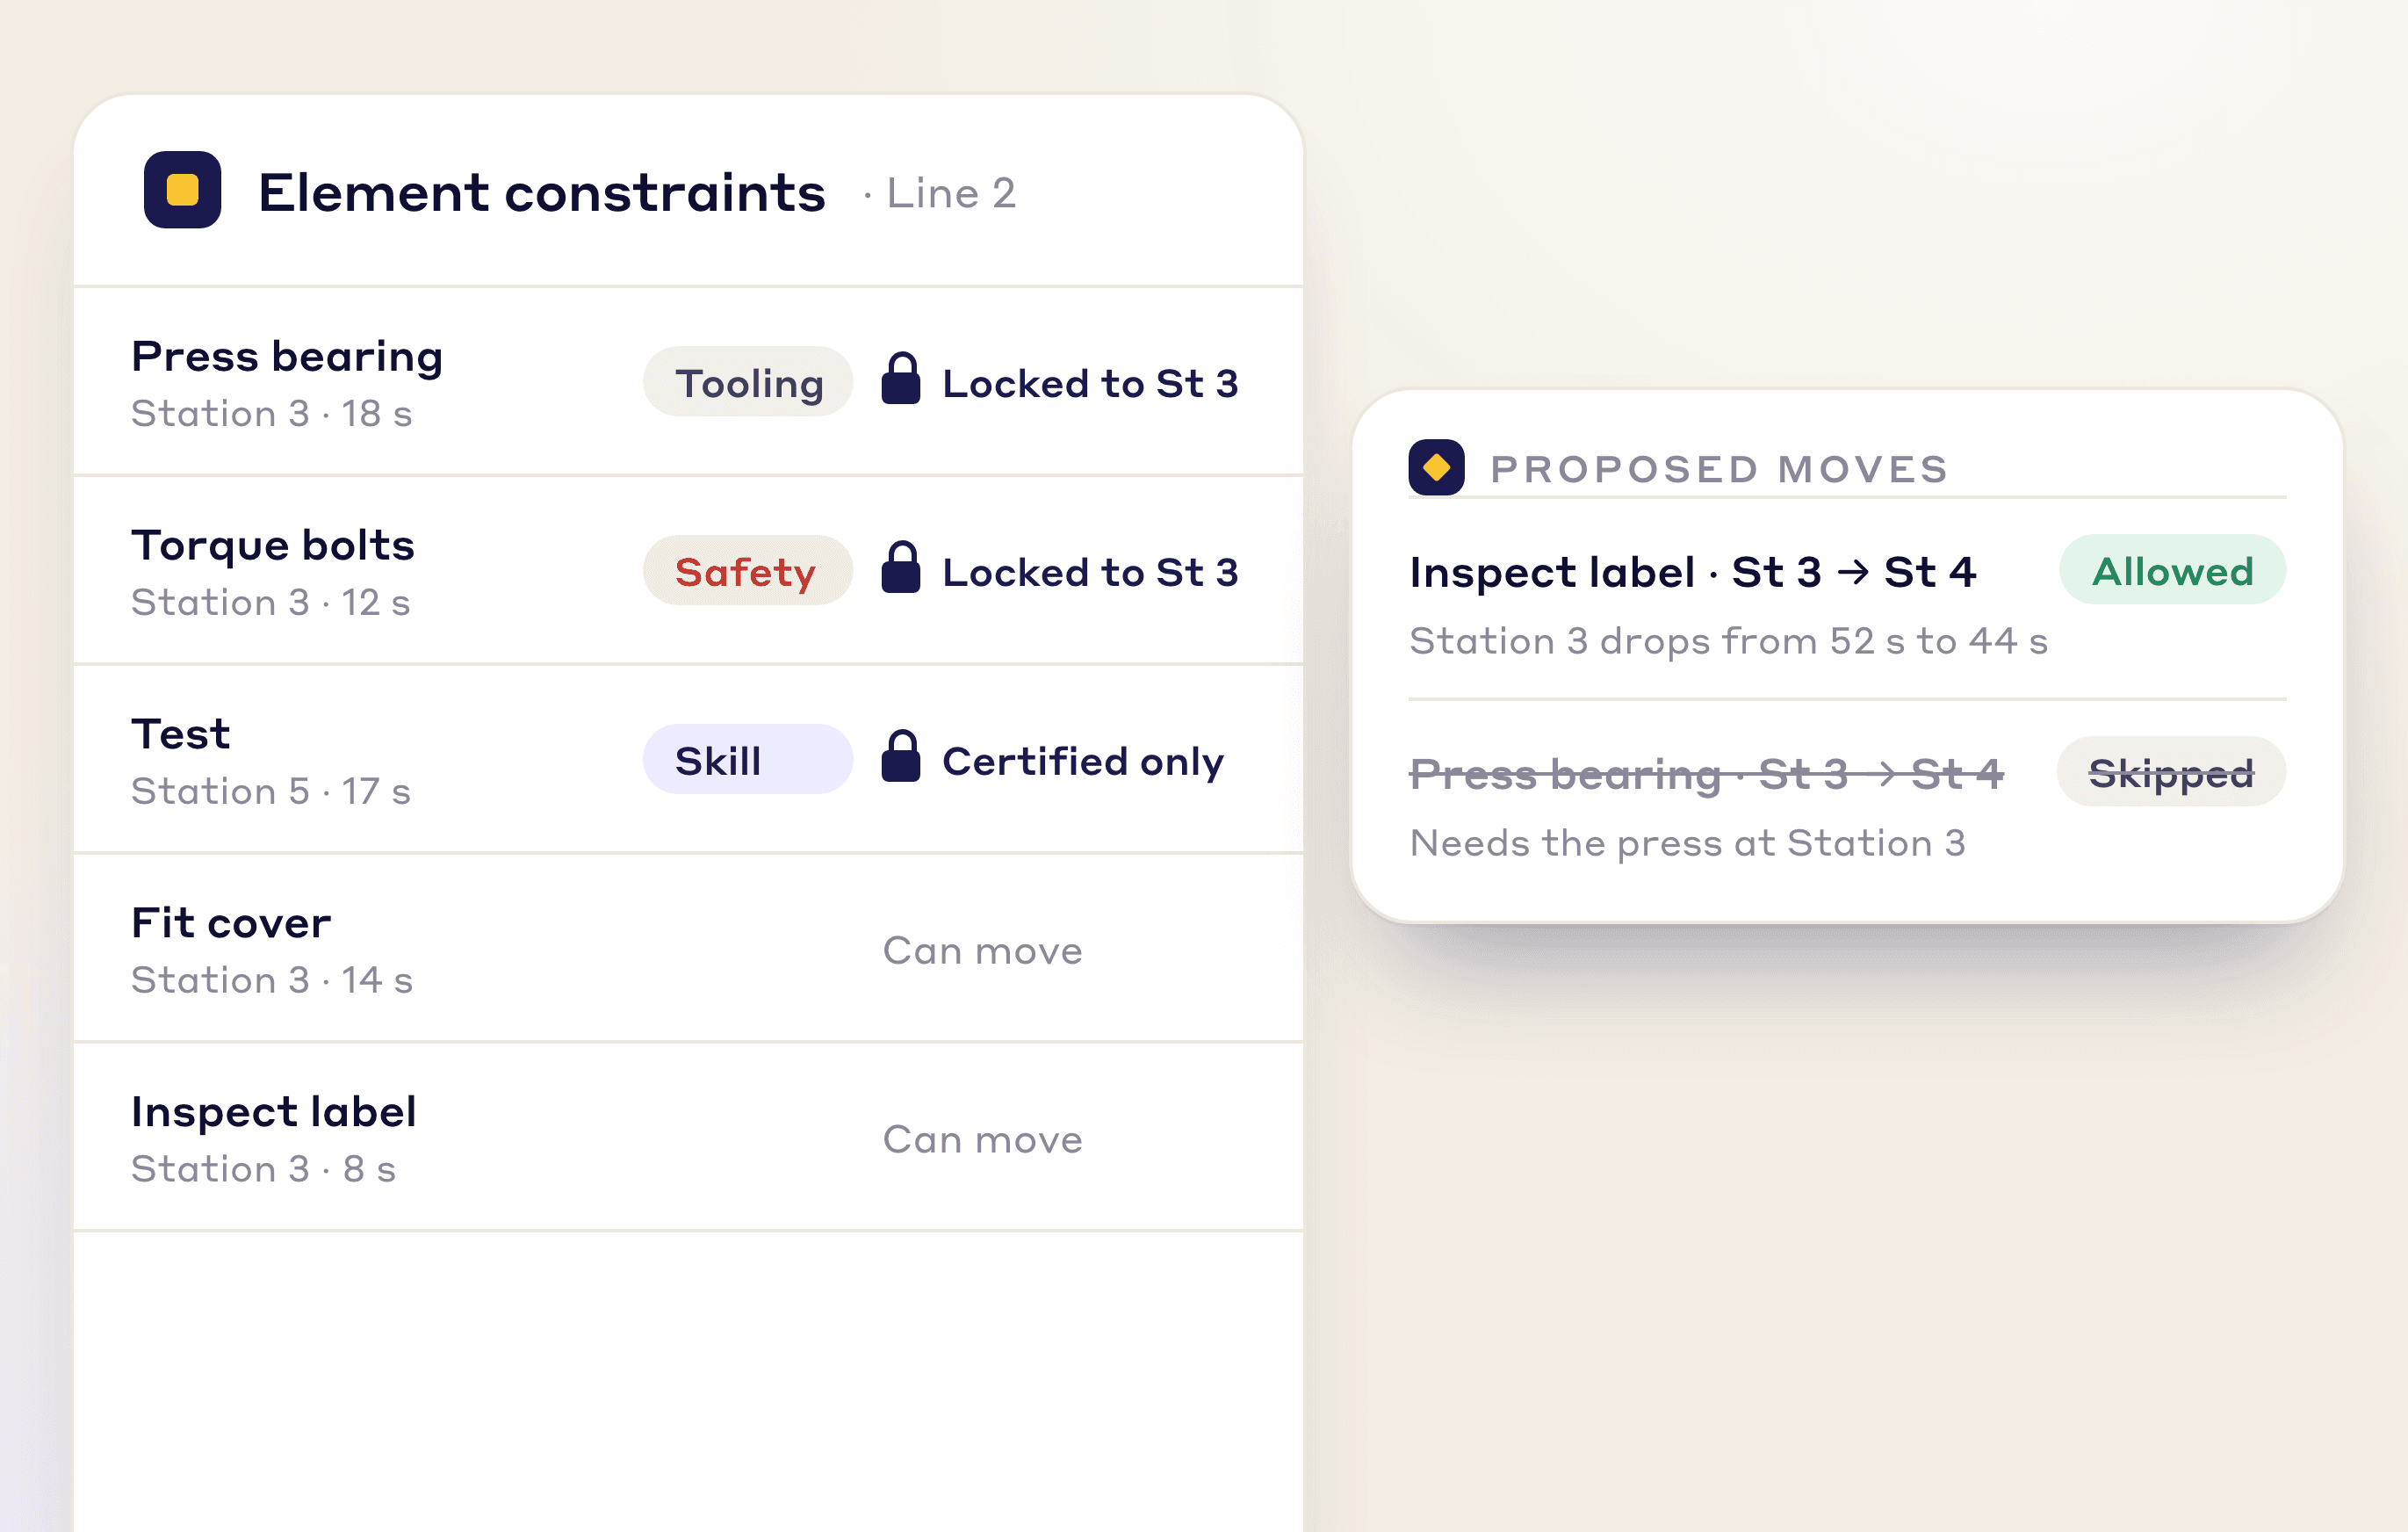
Lock elements to a station for safety, tooling or skill, so proposed moves are realistic.
Element-to-station locking
Safety, tooling, and skill constraints respected
Realistic rebalancing suggestions only
From video
The AI time study does the timing; you do the balancing.
Record the stations on a phone, tablet or fixed camera. No special hardware required.
Drop the video into LeanSuite, pick line balancing and tag the line.
The AI times each operator's elements and charts every station against takt.
Drag tasks between operators to flatten the Yamazumi and save each scenario with the minutes and cost it saves.
Why It Matters
No hand-built Yamazumi charts or changes tested on the floor: rebalance by dragging elements, and turn findings into Kaizens in one click.
Higher Throughput
See the gain in the Yamazumi before anything changes on the floor.
Faster Re-balancing
What-if scenarios without touching the floor.
Standard Output
Yamazumi charts every plant manager can read.
FAQs
Line balancing spreads work across stations so each one's cycle time sits at or just under takt, with no bottleneck and no operators left waiting.
Upload a video and the AI time study breaks each operator's work into elements, charted as a Yamazumi against takt. Drag elements between operators and compare scenarios before changing the line.
Yes. Compare studies by operator or for the whole line, and compare scenarios by minutes and cost saved.
Yes. Findings suggest what to eliminate, combine, rearrange or simplify, and each can become a Kaizen in one click.
Up to 24 stations per line in a single analysis, more on request.
Yes. Adjust takt or the shift pattern and the Yamazumi re-simulates in under a second.
Yes. Weight elements by product mix and balance for the real production schedule.
Yes. Pin elements that must stay put because of tooling, safety or skill constraints.
FREE RESOURCES
Not ready for software yet? Start with these free resources.
Bring one video of your line and see the Yamazumi, scenarios and findings it produces.