
Ranked by minutes
I got breakdown, and generally people work on that. But that is not necessarily the right approach.
Downtime by minutes
Your downtime report ranks losses by minutes, so the team spends the month at the tail end of the Pareto. LeanSuite takes those same minutes and works out the real cost of downtime in manufacturing, line by line.
By clicking "Schedule Demo," you agree to the use of your data in accordance with LeanSuite's Privacy Notice, including for marketing purposes.
TRUSTED BY INNOVATIVE LEADERS

















Same losses, two Paretos
Cost matrix is able to give you the right visibility into if two lines are down for 10 minutes, which out of those same 10 minute downtime is costing you way more versus the other one.
I got breakdown, and generally people work on that. But that is not necessarily the right approach.
The system actually tells you that one hour line, you don't need to work on it, you need to work on the 10 minute downtime first, because you had 15 people waiting on that line. If line one has 10 people working on it and it was down for 10 minutes, and line two had one person working on it and was down for 10 minutes, the system will point you towards line one, because that's costing you most right now.
Sound familiar?
In terms of minutes it looks like, oh, this was the biggest problem. But it actually isn't. If we just simply go by number of minutes and say, okay, these are my top losses, that data isn't necessarily always correct. The other problem that's down for a lesser amount of time is actually costing you more money because of all the resultant and all the other cost buckets.
Wrong end of the Pareto
Usually companies focus on the time. This line was down for 10 minutes, this line was down for an hour, so let's work on the hour.
Resultant losses counted twice
Line two shows up as its own problem when line one is what actually stopped it.
Headcount left out
The report has no idea how many people were standing idle behind that stop.
Cost buckets per line
You can build your entire line profile, so you can define all your labour costs, everything for each line, so that it can help you build the right prioritization properly, all based on cost. One line down for 10 minutes versus another line down for 10 minutes could be costing you a totally different amount of money.
Causal versus resultant
The system will actually see whether that line went down after another line, and where the actual cause is coming from inside the process. So you are fixing that problem and not the resultant, but you're fixing the actual root cause.
Loss tree against your target
The system helps you build a real time B matrix. You don't have to keep updating it, you just provide all the correlations once, and it keeps it live, so you don't have to keep doing it every six months. Those projects actually build a glide path for you visually, showing you how much you're achieving right now and how much is the gap on the top month over month.
Read your own Pareto
If you're working on the projects at the very end of the Pareto, that means you're not getting the best ROI from it.
How it works
Your downtime report ranks losses by minutes, so the team spends the month at the tail end of the Pareto. LeanSuite takes those same minutes and works out the real cost of downtime in manufacturing, line by line.
Step 1
We can connect with your MES data and we can get all your information into a loss tree format. We can take the data feed from MES or through a manual input. As long as you have your raw data, which is your downtime, minor stops, breakdowns, everything, the system will build top losses for you.
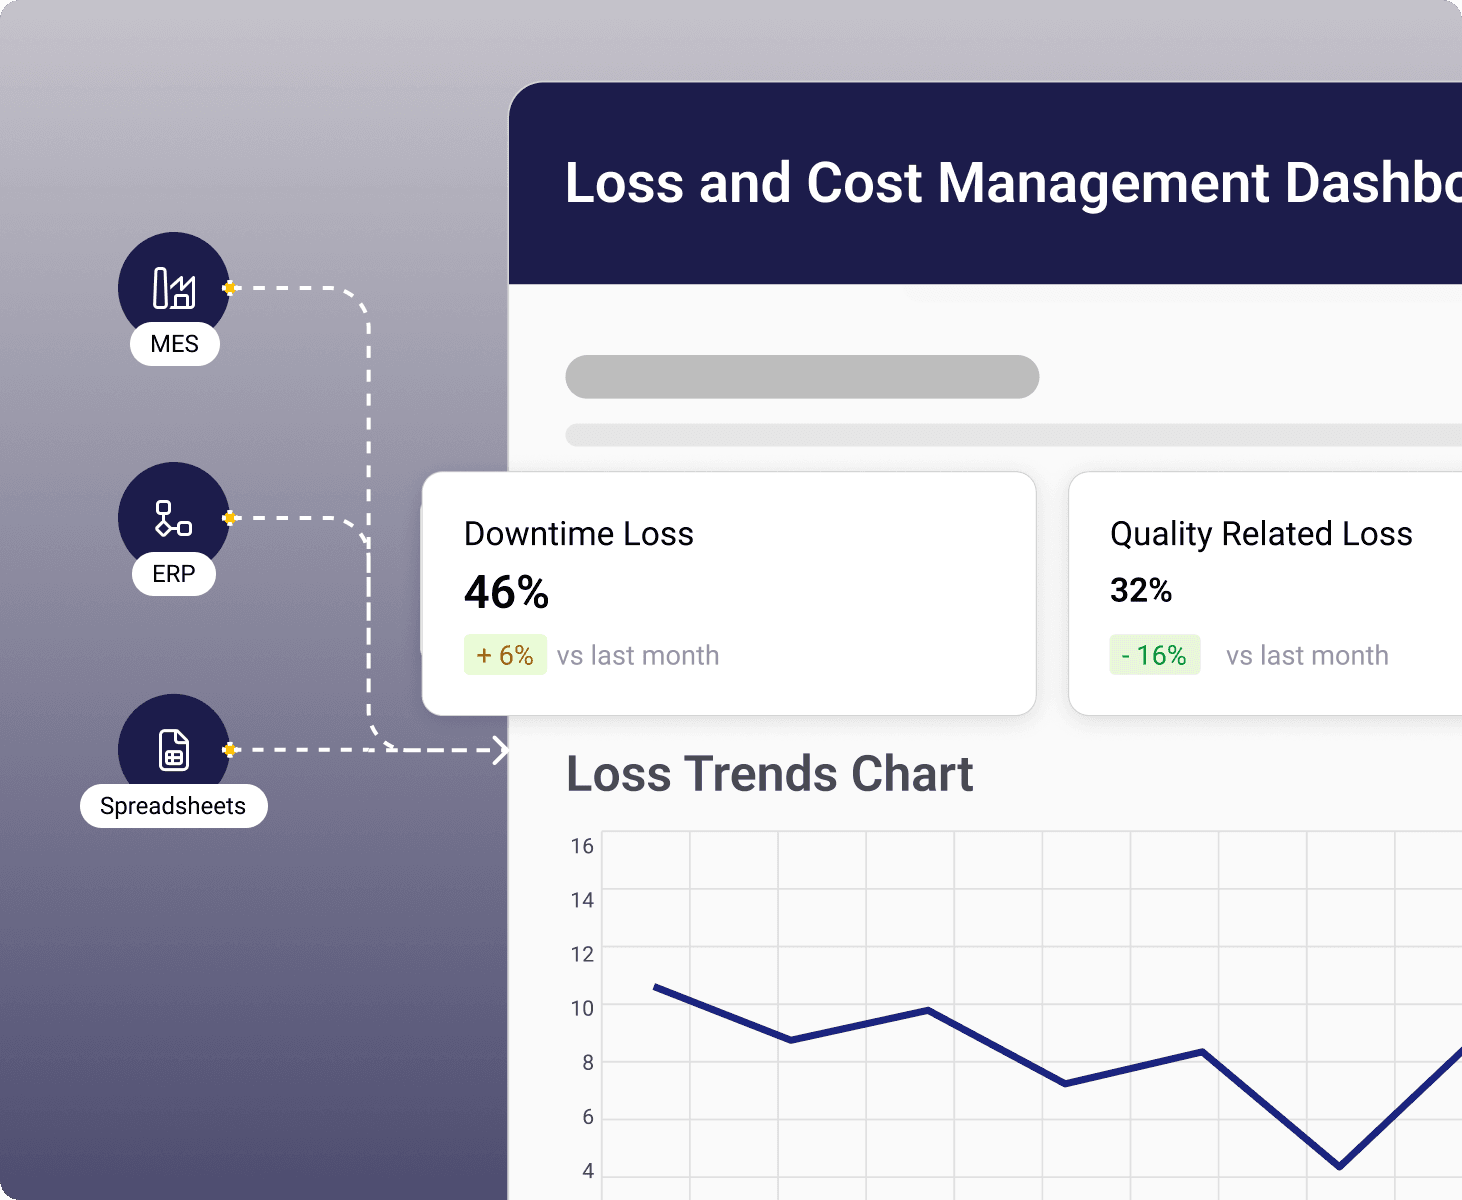
Step 2
We apply certain mapping. What are some of the causal losses, what are some of the resultant losses. Let's say raw data is coming from the MES that line three had a breakdown for one hour. The system is going to analyse whether that breakdown has any other resultant loss anywhere else, and the downtime coming from the other line is going to be allocated back to line three, because that is the cause. So that when you fix line three, it's going to fix all the other related problems as well, because you're dealing with the root cause.
Step 3
We apply what the different cost buckets are for each line, and then from there we convert those downtime minutes into the actual losses. We take that information and we process it, putting a cost layer on top of it.
Step 4
By taking in all the raw data, it will automatically build that this is your top project that you should be working on, because this is costing you the most money. From your top losses you can initiate a Kaizen right from there. It helps you identify the right team, because the system also tells you the right people that you should be putting on your team based on two things. One, the knowledge that they have, and secondly the availability that they have. So it tracks workload as well.
Before the loss tree
If one line goes down and the other line goes down at the same time for the same amount of minutes, one could be costing you more compared to the other line, because one line could have ten people working on it and the other could have only two people working on it.
Someone rebuilds it from the downtime export each month, so the ranking lands after the month it describes. The assumptions live in that person's head and leave when they do.
The column appears, but a stop that was only triggered by another line is still counted as its own loss. The total looks bigger and the top of the list does not move.

From our co-founder
“One line down for 10 minutes versus another line down for 10 minutes could be costing you a totally different amount of money.”
Where to go next
If the longest stop isn't the most expensive one, you need the cost attached to the stop and the short ones counted. These three pages cover both.
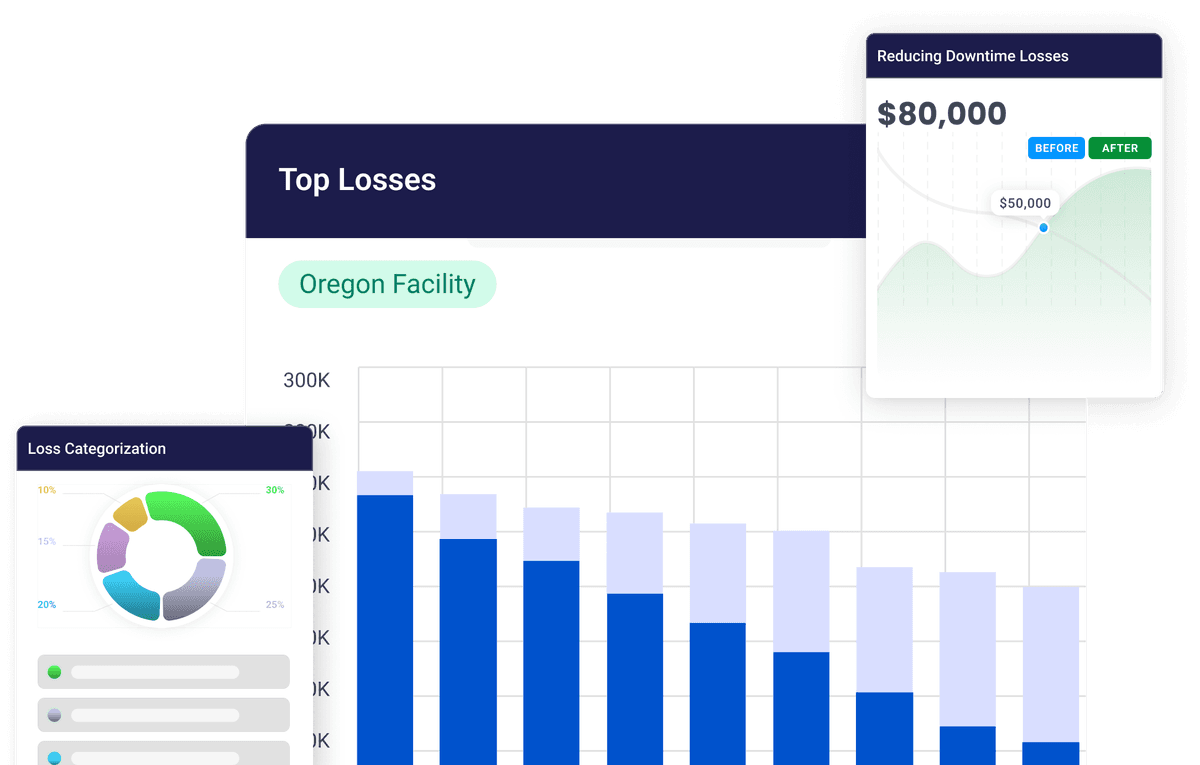
Gives you the financial visibility to find and quantify losses from downtime, quality, and waste. That's how a short stop with a full crew standing shows up bigger than the long one.
See how it works →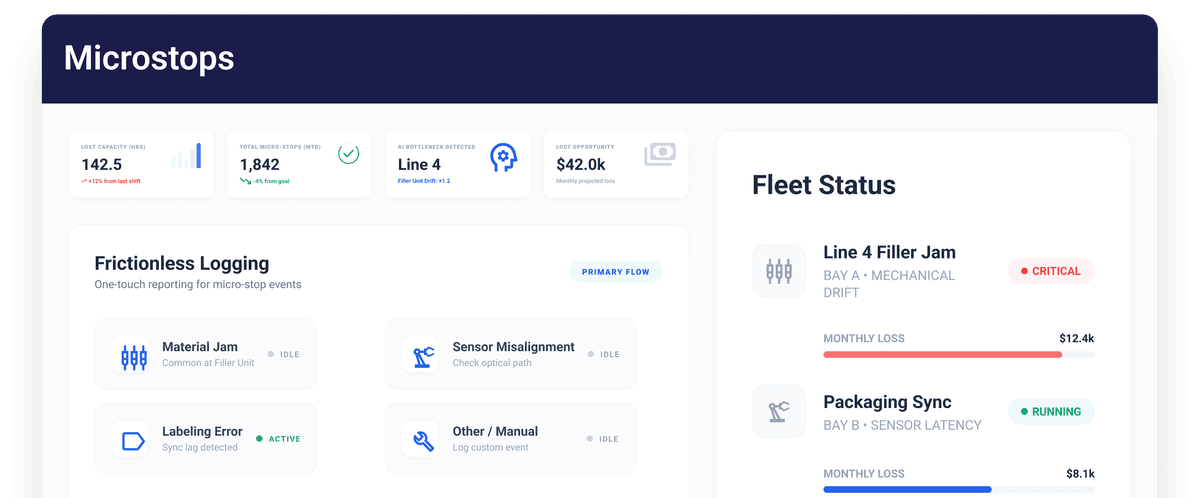
Operators log brief jams on the floor instead of them going unrecorded. AI groups the logs so you see which bottleneck costs the most and fix that first.
See how it works →
Visibility into your manufacturing costs so you can cut spending rather than guess at it. Use it once you know which losses are real.
See how it works →Bring last month's downtime report to the call and we'll walk through what it looks like once the minutes are converted into losses on your lines.