Skip to content

Free kit: playbook, model and deck

Updated

Get your improvement budget approved: the CI business case kit

This kit helps a plant manager or CI lead win money for an improvement programme, tooling or software from a CFO or plant leadership. It is three files that work together. The 16-page playbook explains how finance judges a request: payback, NPV, IRR, hurdle rates, hard against soft savings, and what gets refused. It shows the formulas and a worked example for costing downtime, scrap, rework, overtime, inventory and injuries. The Excel model takes your own numbers and returns payback, 3-year NPV at your discount rate, a best, base and worst case, and a list of what finance will challenge. The six-slide deck is the editable template for the meeting. Nothing in the files depends on any product. The example plant is made up and labelled as such, and every number in it is worked on the page.

Who it is for: Plant managers, CI and lean leads, operations managers and the consultants who help them ask for money.

Free to use: print it, copy it and edit it for your team. Enter your name and work email once to download.

Cover of the CI business case kit playbookThe title Get your improvement budget approved, a line saying what the sixteen pages cover, and a small diagram of a one-time cost at year zero followed by three years of savings.
16-page playbookExcel model, live formulas6-slide deck templateWorked exampleCFO objectionsOne-page case

What is in the kit

Three files that do one job

The playbook explains how the decision is made. The model does the arithmetic on your numbers. The deck carries the ask into the room. Nothing in them depends on any product.

The playbook

PDF · Letter, 16 pages: how finance thinks, the formulas, a worked example, CFO objections, the one-page case

  • How finance reads a request: payback, NPV, IRR, ROI and the hurdle rate, in plain words
  • Hard against soft savings, with a test you can apply to any line
  • What finance will not accept, and what to put in its place
  • Formulas and a worked example for downtime, scrap and rework, overtime, inventory carrying cost and injury cost
  • The base case built end to end, then payback, NPV and IRR done by hand
  • Best, base and worst cases and the risks that move them
  • Ten CFO objections with honest answers
  • The one-page business case, field by field
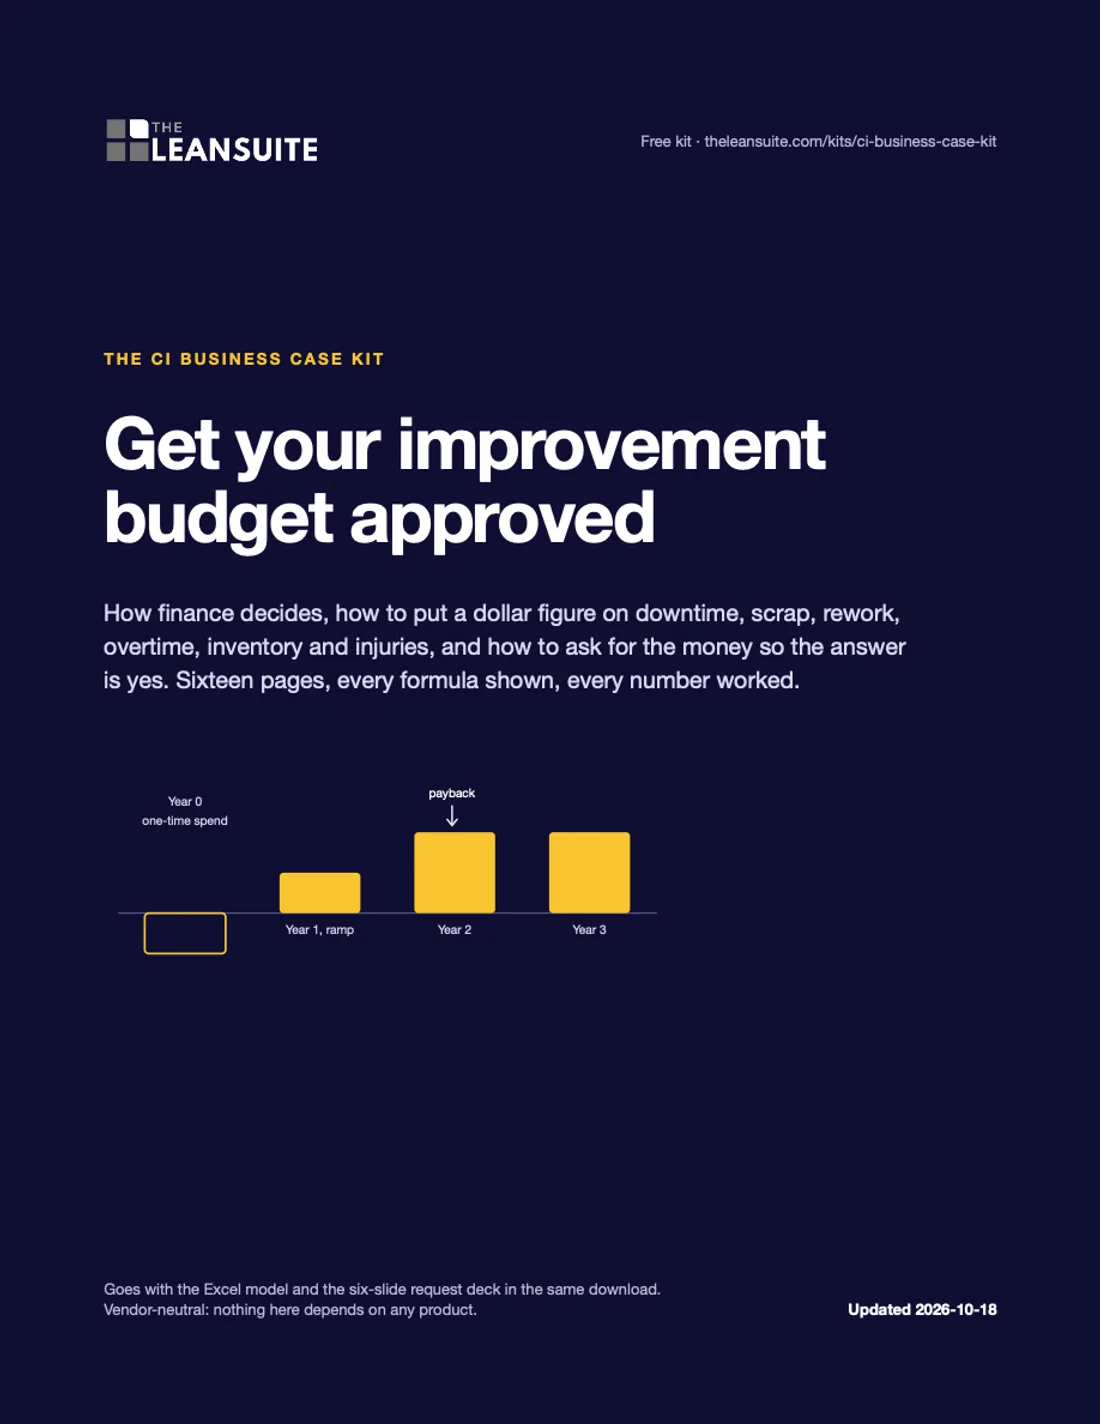
  • Page 1 of the playbook: the coverPage 1: cover
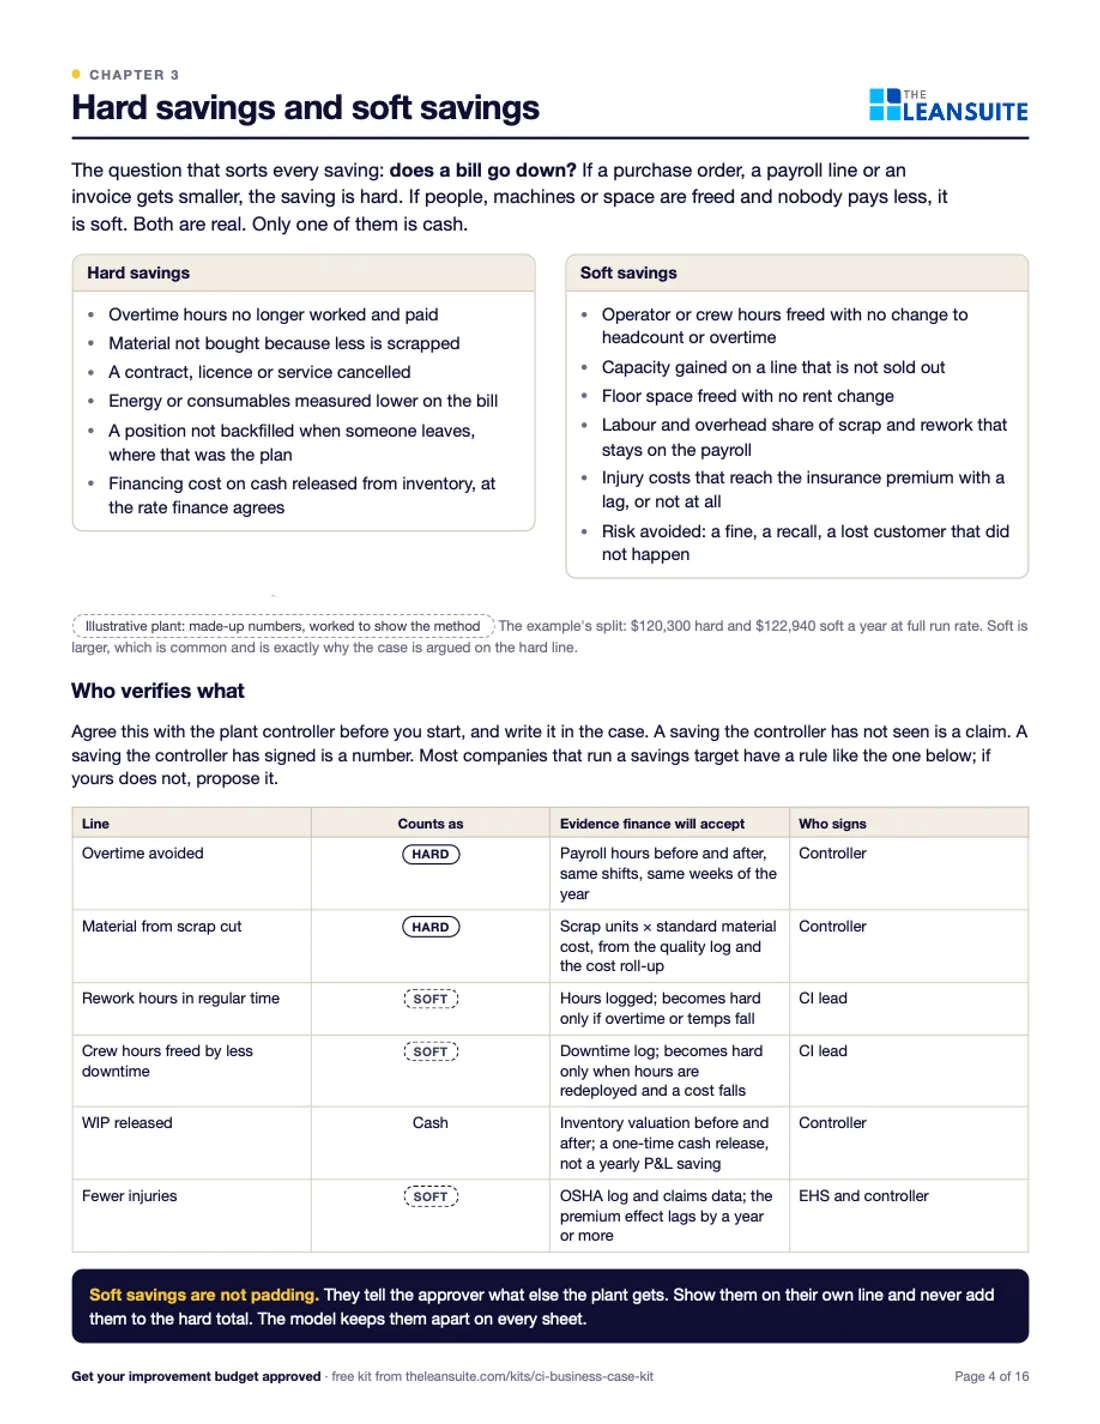
  • Page 4 of the playbook: Hard savings and soft savingsPage 4: Hard savings and soft savings
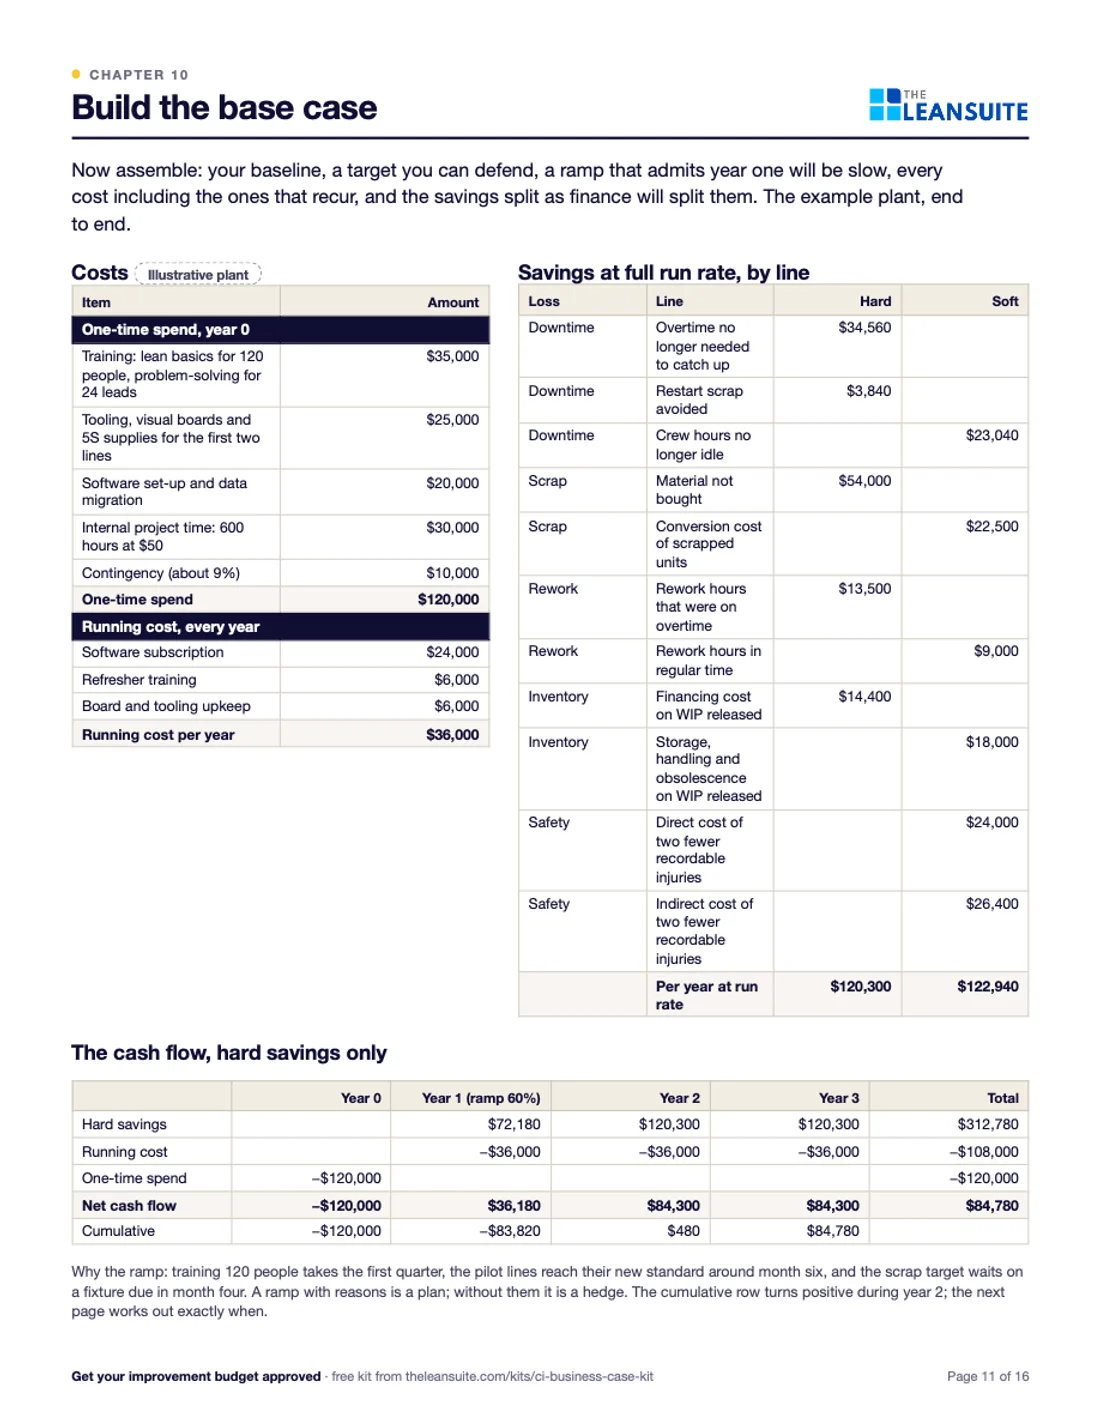
  • Page 11 of the playbook: Build the base casePage 11: Build the base case
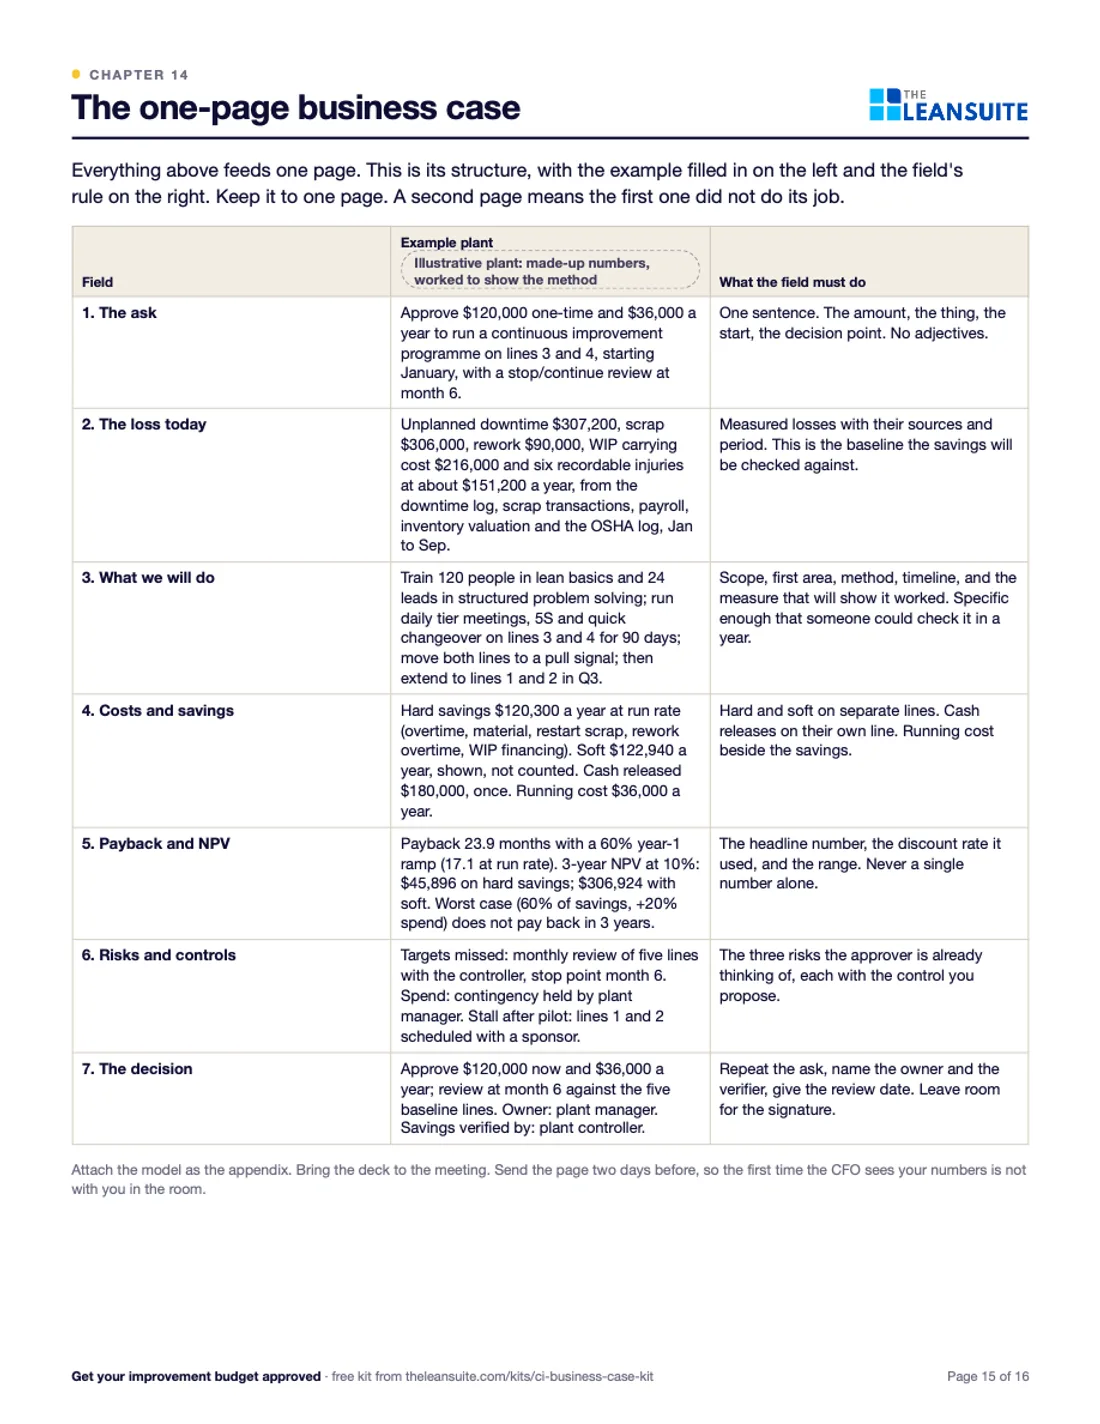
  • Page 15 of the playbook: The one-page business casePage 15: The one-page business case
All sixteen pages
  1. 2How to use this kit. The three files, the order to use them in, and the one-page case you are building towards.
  2. 3How finance thinks. Payback, NPV, IRR, ROI and the hurdle rate: what each one answers, its formula and what it misses.
  3. 4Hard savings and soft savings. The test: does a bill go down? A table of common CI savings sorted into hard and soft, and who verifies them.
  4. 5What finance will not accept. Idle time as cash, no baseline, double counting, benefits past the asset's life, forgotten running costs, borrowed benchmarks.
  5. 6Quantify downtime. Cost per hour from idle crew, catch-up overtime and restart scrap, then per event and per year. Worked example.
  6. 7Quantify scrap and rework. Material, conversion and salvage per scrapped unit; rework hours at the rate they were really paid. Worked example.
  7. 8Quantify overtime. The premium is the saving. The FLSA minimum, how to find your plant's real rate, and the double-counting trap.
  8. 9Quantify inventory carrying cost. Financing, storage, handling and obsolescence as a yearly rate on stock held; cash released against cost avoided.
  9. 10Quantify the cost of injuries. Direct and indirect cost, the OSHA $afety Pays method, and why safety savings usually stay on the soft line.
  10. 11Build the base case. Baseline, target, ramp, running cost: the example plant's five losses turned into three years of cash flow.
  11. 12Payback, NPV and IRR by hand. The example's discount factors, year by year, so you can check the model and explain it in the room.
  12. 13Sensitivity and risk. Best, base and worst, which assumptions move the answer most, and how to present a range without losing the room.
  13. 14What the CFO will say. Ten objections you will hear and the honest answer to each.
  14. 15The one-page business case. The single page that goes in front of the decision, field by field, with the example filled in.
  15. 16Before you send it. A fourteen-point self-check, the sources behind this playbook and what to do if the answer is no.

Page 1 is the cover.
The model

Excel (.xlsx) · opens in Excel, Numbers and Google Sheets

  • An Inputs sheet for your own costs, losses, targets, ramp and discount rate
  • Savings worked line by line, hard and soft kept apart
  • Cash flow by year, simple and ramped payback, 3-year NPV, IRR and ROI, all live formulas
  • Best, base and worst cases in one table
  • A Flags sheet that lists what finance will challenge in your numbers
  • The worked example on its own sheet, clearly labelled illustrative
  • Formula cells locked, input cells open, no macros
Read me
How the model works, the colour code for inputs and formulas, and where the example lives.
Inputs
Your rates, each loss's baseline and target, one-time and running costs, ramp, years and discount rate.
Savings
Each loss worked into hard and soft lines, with the formula shown beside the result.
Cash flow
Year 0 to year 3 on hard savings and on all savings; simple payback, ramped payback, NPV, IRR, ROI.
Sensitivity
Best, base and worst cases side by side, with the factors you can change.
Flags
What finance will challenge in your numbers, and why.
Example
The playbook's illustrative plant, every cell labelled illustrative, to see the model working.
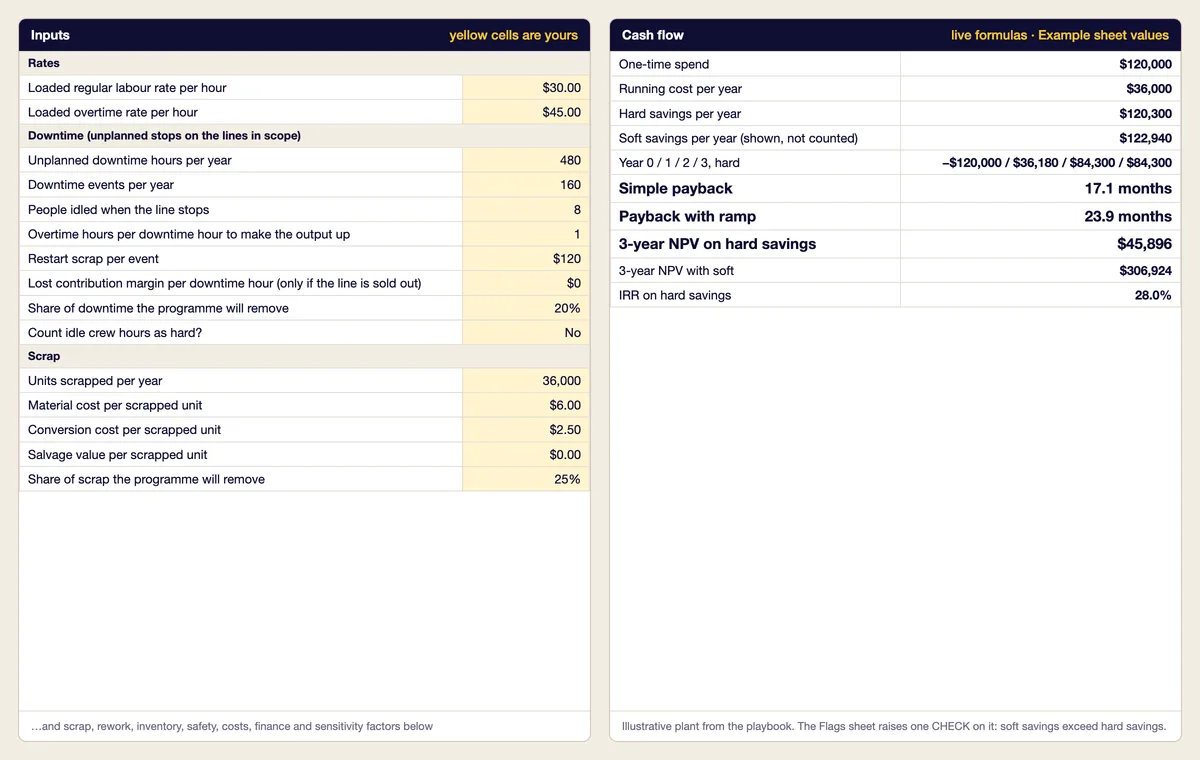
The model's Inputs sheet, yellow input cells, beside its Cash flow sheet with payback, NPV, IRR and the yearly cash flow
The Inputs and Cash flow sheets with the example plant's numbers (illustrative).

The request deck

PowerPoint (.pptx) · 16:9, 6 editable slides: the ask, the loss, the plan, costs and savings, payback and NPV, risks and decision

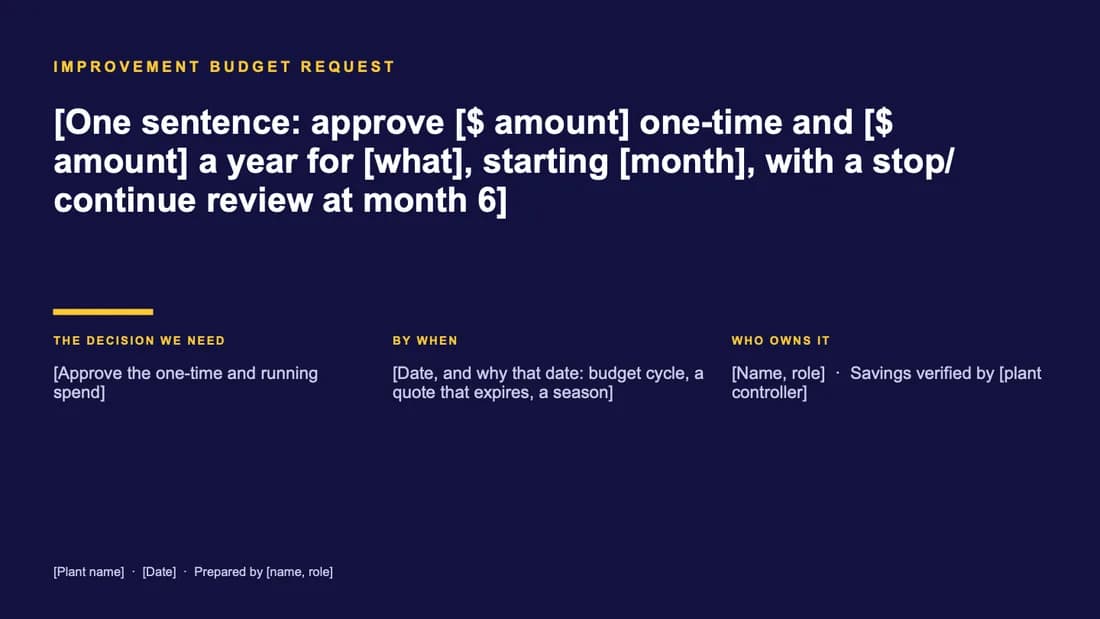
  1. Slide 1 of the request deck: The ask

    1. The ask. One sentence: what you want, how much, and the decision you need by when.

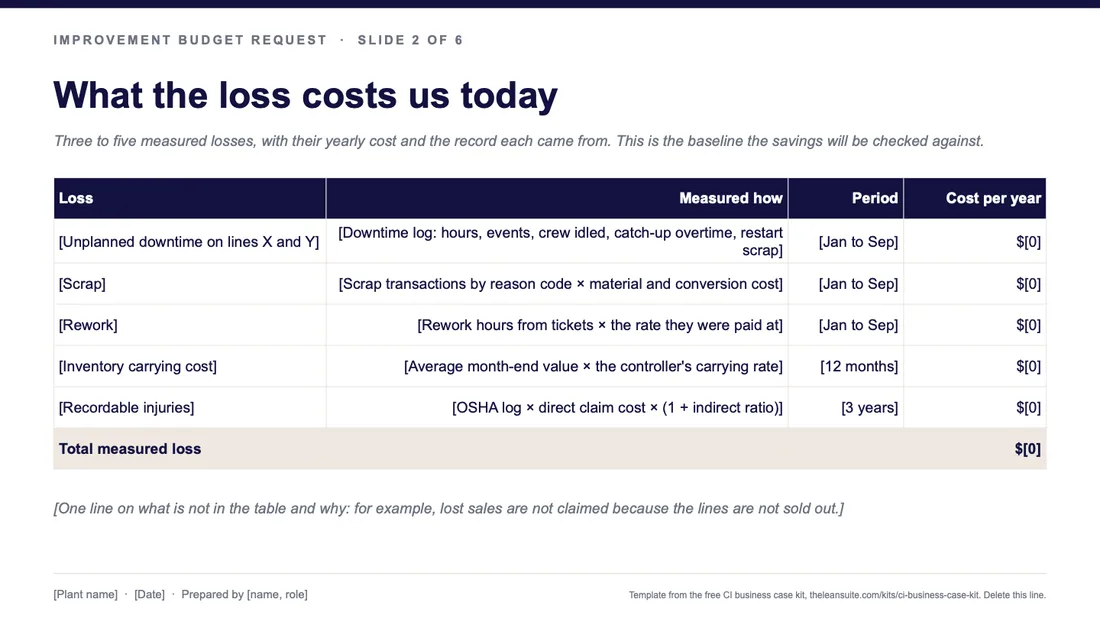
  2. Slide 2 of the request deck: What the loss costs us today

    2. What the loss costs us today. Three to five measured losses with their yearly cost and where the numbers came from.

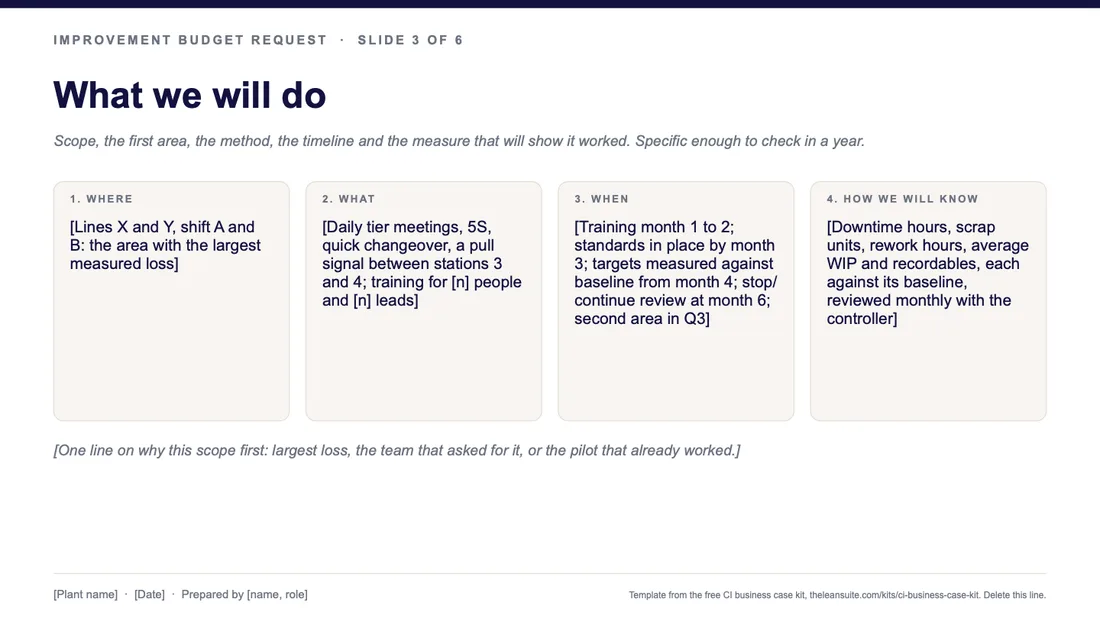
  3. Slide 3 of the request deck: What we will do

    3. What we will do. Scope, the first area, the 90-day plan and the measure that will show it worked.

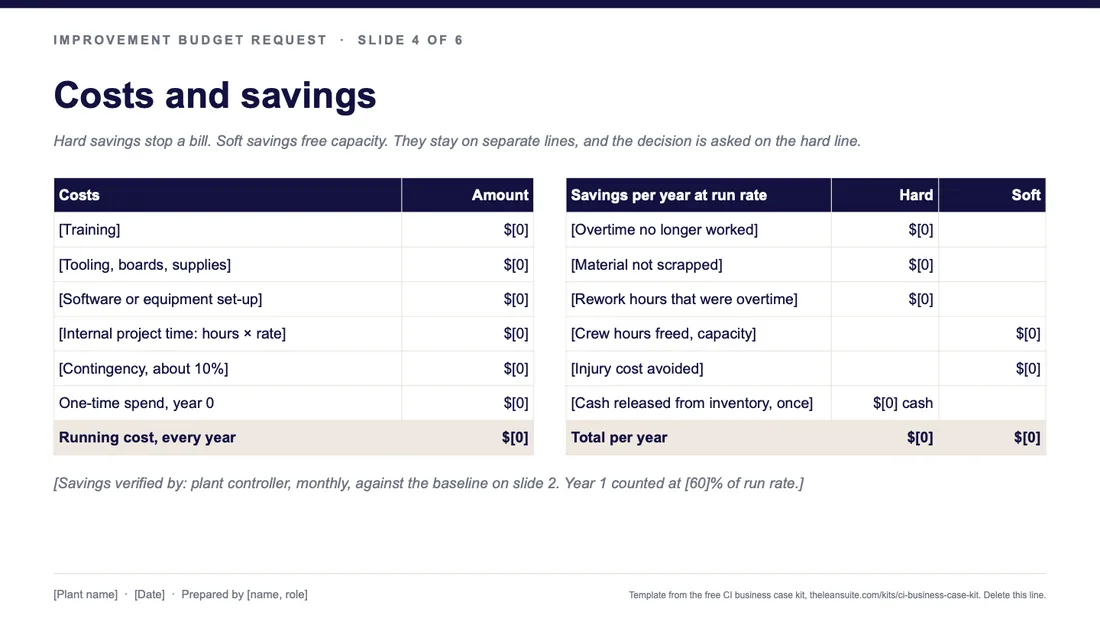
  4. Slide 4 of the request deck: Costs and savings

    4. Costs and savings. One-time and running costs; hard savings and soft savings on separate lines.

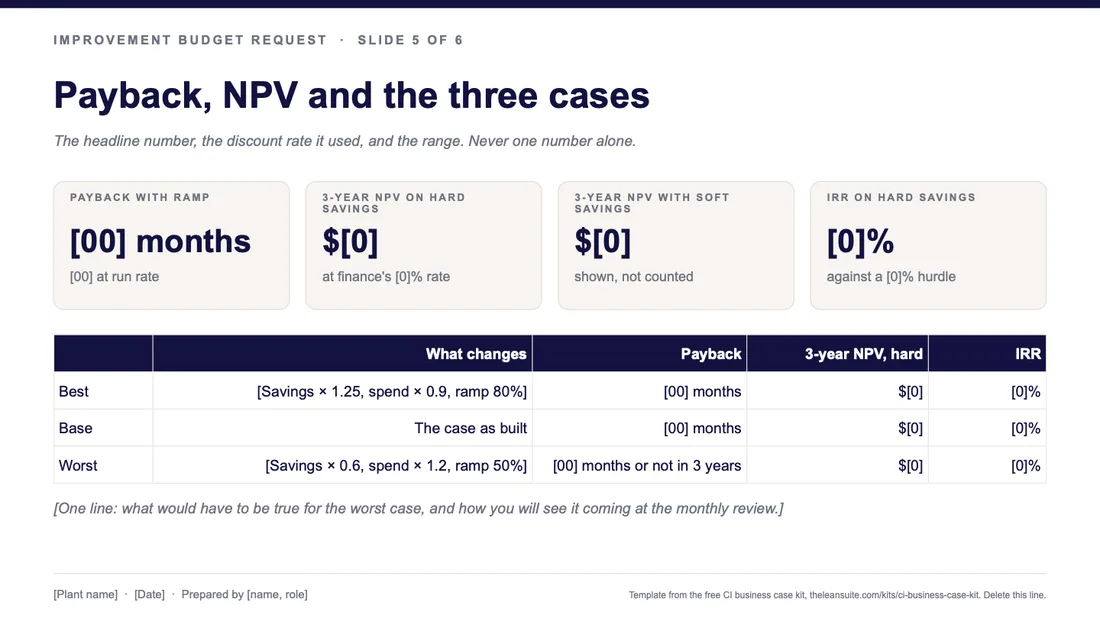
  5. Slide 5 of the request deck: Payback, NPV and the three cases

    5. Payback, NPV and the three cases. Payback in months, NPV at finance's rate, best, base and worst.

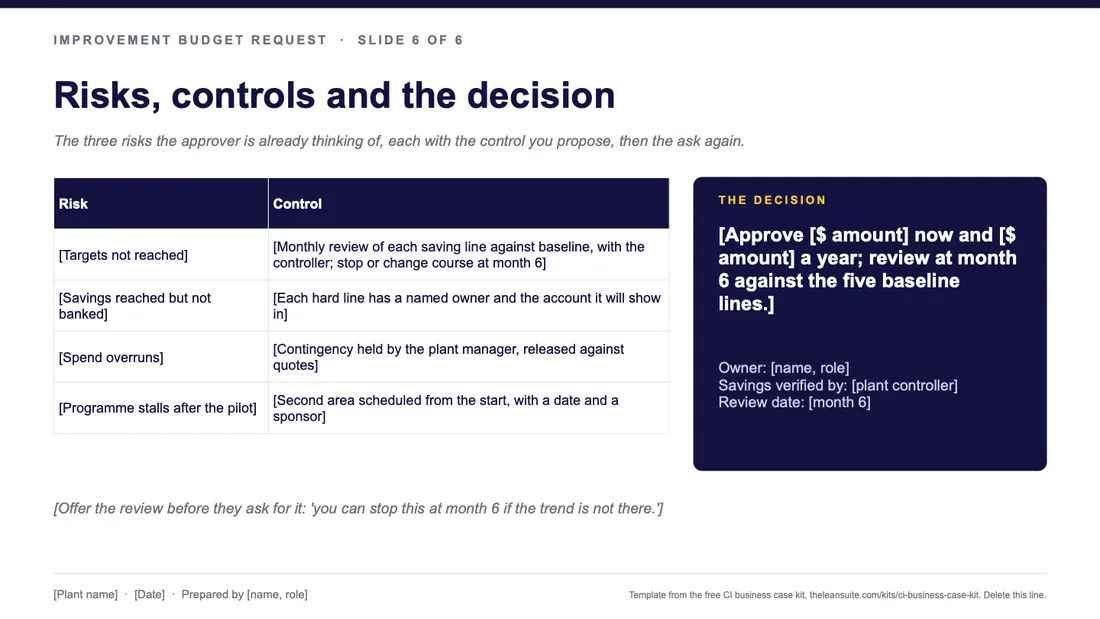
  6. Slide 6 of the request deck: Risks, controls and the decision

    6. Risks, controls and the decision. What could go wrong, what you will do about it, and the decision you are asking for.

Before you start

A two-minute payback check

Six numbers tell you whether the case is worth building before you open the model. It starts with the playbook's example plant; put your own figures in. No sign-up, nothing saved.

Training, tooling, set-up, internal time, contingency

Subscriptions, upkeep, refresher training

Bills that go down: overtime, material, scrap

Capacity freed, costs avoided; shown, not counted

Ask for it. Do not guess.

Most programmes take months to reach run rate

Nothing is saved and no sign-up is needed. The numbers travel only in the address of this page, so a shared link reopens the same case.

Payback with the ramp
23.9 months
17.1 months at steady state
3-year NPV, hard savings
$45,896
at 10% discount rate
NPV with soft savings
$306,924
shown beside the hard figure, never added to it
IRR, hard savings
28.0%
3-year ROI 71%, undiscounted

Net cash flow, hard savings only

  • Year 0-$120,000
  • Year 1$36,180
  • Year 2$84,300
  • Year 3$84,300

What finance will challenge

  • CheckSoft savings exceed hard savings. Finance decides on the hard line; make it stand on its own.

Same arithmetic as the Excel model in the kit. Payback interpolates inside the year the cumulative cash turns positive; NPV discounts years 1 to 3 at the rate above and adds year 0 undiscounted, as Excel's NPV function expects. Terms: payback, NPV, hard and soft savings.

How to use the kit

  1. 1

    Read the playbook first

    Two chapters matter most on day one: how finance thinks, and hard against soft savings. The rest you use as you build.

  2. 2

    Pull three months of your own data

    Downtime hours and events, scrap units, rework hours, overtime hours, average WIP, recordable injuries, and the rates finance uses for labour and capital.

  3. 3

    Fill the Inputs sheet

    Only the yellow cells. The Savings, Cash flow and Sensitivity sheets update themselves. Read the Flags sheet before anyone else does.

  4. 4

    Write the one-page case

    Chapter 14 gives the fields. Keep it to a page: the ask, the loss, the plan, the numbers, the risks, the decision.

  5. 5

    Fill the six slides

    Replace every bracketed placeholder. Delete what you cannot source. The deck is for the meeting; the page is what gets approved.

What finance will say

Five objections, and the honest answer

The playbook has ten. These are the five you will hear first.

  • “Those savings are not real money.”

    Split the lines. Hard savings stop a bill: overtime, material, scrap, a contract. Soft savings free capacity. Ask for the decision on the hard line alone and show soft savings beside it.

  • “You have no baseline.”

    Bring at least three months of your own logs for each loss: downtime hours, scrap units, overtime hours, WIP value, recordables. One good month proves nothing.

  • “Year one will not look like that.”

    Agree. Show a ramp. The kit's example reaches 60% of the run rate in year one and full rate after. Put the ramp in the model and say what drives it.

  • “What did you leave out of the cost?”

    Running costs, internal time and a contingency. The example carries a subscription, refresher training, upkeep, 600 hours of internal time and 9% contingency.

  • “Why should I believe the target?”

    Tie it to a pilot result or to the gap between your best week and your average week. A target with no source is a wish.

Download the kit

Free to use: print it, copy it and edit it for your team. Enter your name and work email once to download.

After the yes: keep the promised number and the reported number the same

In LeanSuite every Kaizen, CapEx or engineering project records its hard and soft savings and cost avoidance in one place, so the number you promised finance and the number you report are the same number.

See it in a 45-minute demo

FAQ

The CI business case kit: common questions

  1. No. The playbook, the model and the deck work for any improvement budget: a programme, tooling, training, consulting time or software from any vendor. LeanSuite is named once, on this page, as the company that wrote it.

  2. Payback is how long the net savings take to repay the one-time spend. NPV discounts every year's net cash flow at finance's rate and subtracts the spend, so it values the whole period and the time value of money. The kit's example pays back in 24 months with a first-year ramp and has a 3-year NPV of about $45,900 at 10%.

  3. The one your finance team uses for capital decisions, sometimes called the hurdle rate or cost of capital. Ask for it. The model's cell is open so you can enter theirs; the example uses 10% only to show the arithmetic.

  4. Because a CFO will. Hours freed with nobody paid less do not reduce spending. The model shows NPV with soft savings as a second figure so the full picture is visible, and asks for the decision on the hard line.

  5. They are made up to show the method and are labelled illustrative on every page and sheet. The only outside figures the kit uses are the FLSA overtime minimum of 1.5 times the regular rate and OSHA's $afety Pays indirect-cost ratios, both cited where they appear.

Pass it on

We want LeanSuite to be the best place on the internet for lean help. If this was useful, send it to someone on your team or in your network who needs it.