

Quick reference poster
Updated · Free to print and share
Little's Law poster: WIP, throughput and lead time
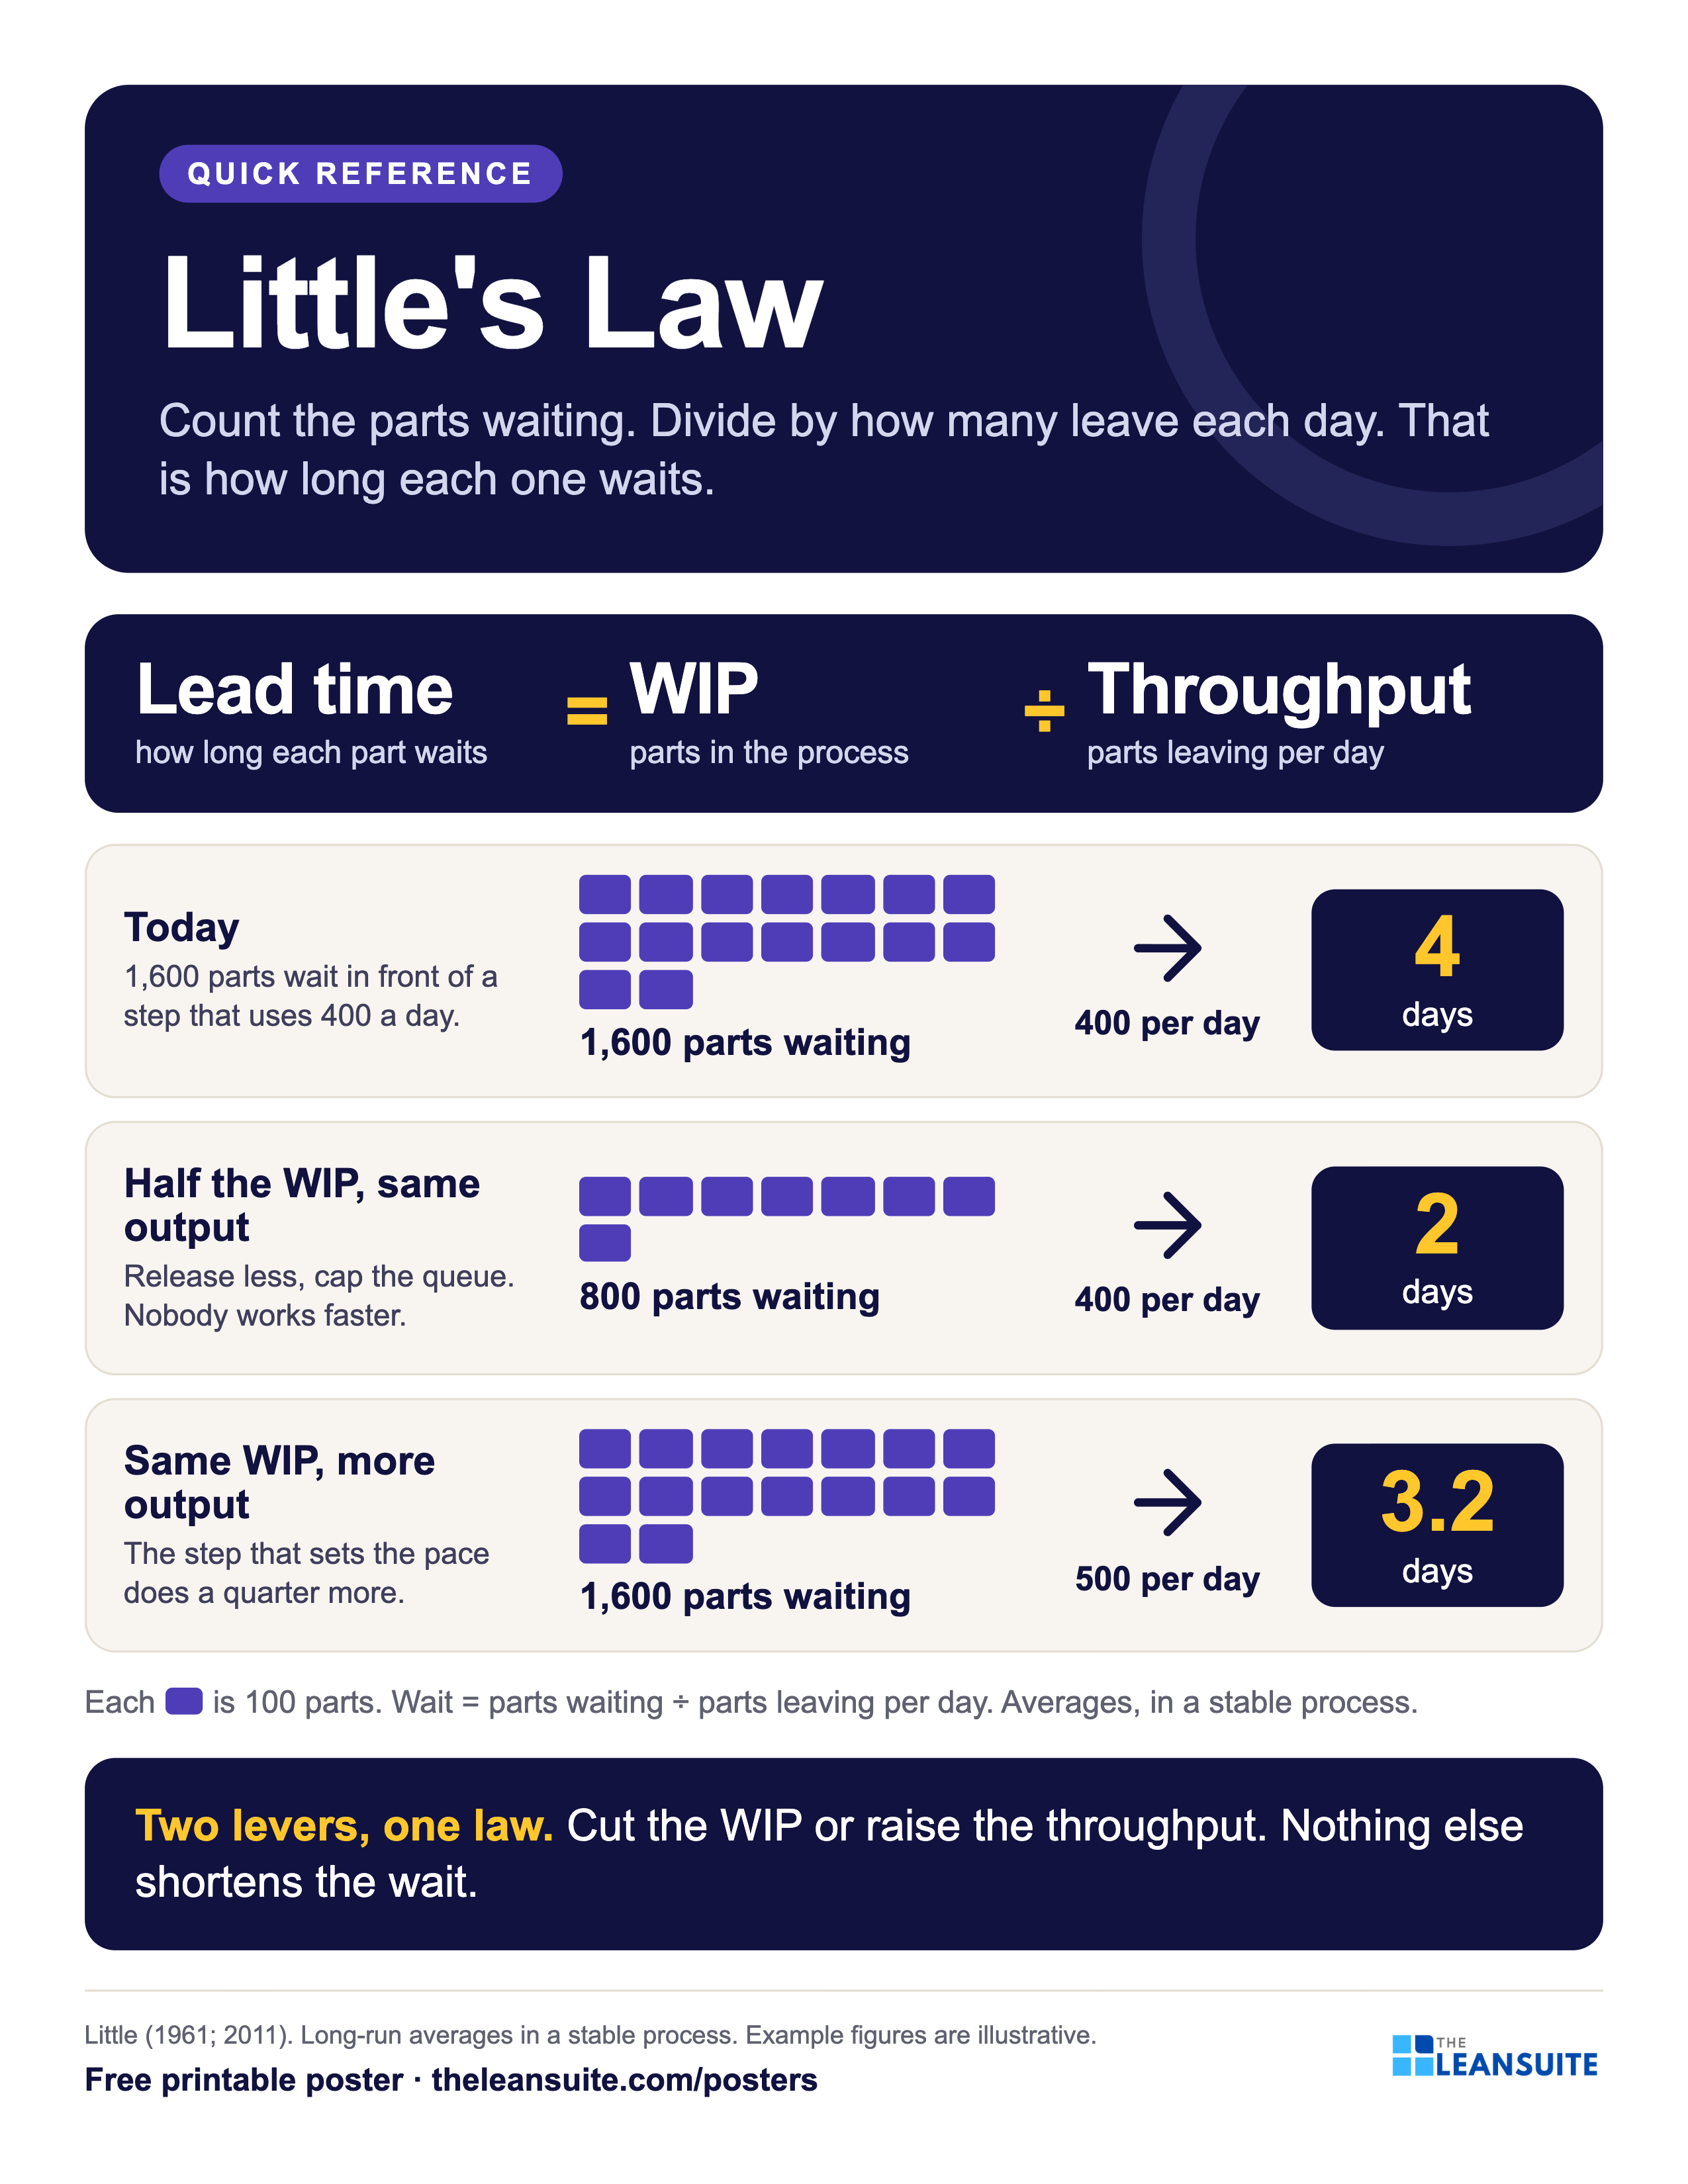
Little's Law says that, on average and in a stable process, the time a part spends in a process equals the number of parts in it divided by the rate they leave: lead time = WIP ÷ throughput. John D. C. Little proved it in 1961; value stream mappers use it every day to turn counted inventory into days. This poster draws the law as a queue of parts and works three cases: 1,600 parts ahead of a step that uses 400 a day wait 4 days; halve the WIP and they wait 2; raise the throughput by a quarter and they wait 3.2.
Download the poster
The PNG is free to download now. The print-ready vector PDFs open after a short form, once.
Free to print and share with your team. Enter your name and work email once to download.
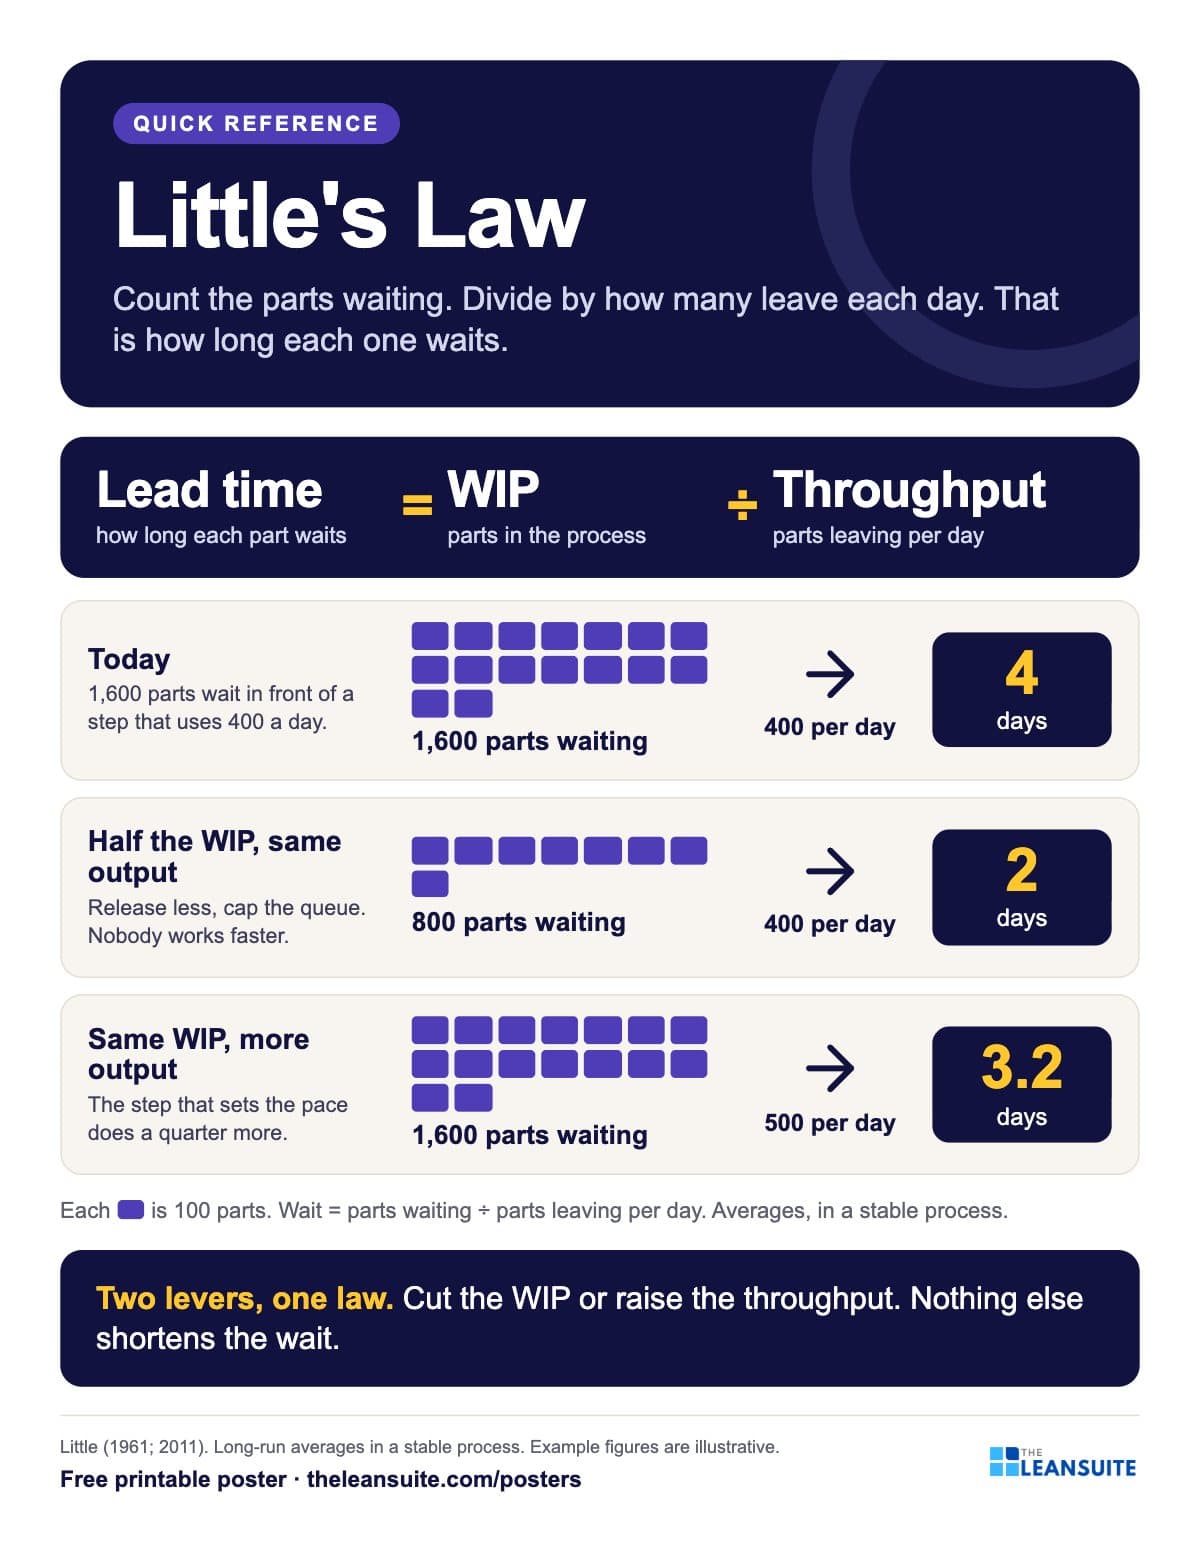 A queue of parts entering and leaving a step, the formula lead time equals WIP divided by throughput, and three worked cases.
The words on the poster
Little's Law
Count the parts waiting. Divide by how many leave each day. That is how long each one waits.
Lead time = WIP ÷ throughput
- Today: 1,600 parts ÷ 400 per day = 4 days 1,600 parts wait in front of a step that uses 400 a day.
- Half the WIP, same output: 800 parts ÷ 400 per day = 2 days Release less, cap the queue. Nobody works faster.
- Same WIP, more output: 1,600 parts ÷ 500 per day = 3.2 days The step that sets the pace does a quarter more.
- Two levers, one law. Cut the WIP or raise the throughput. Nothing else shortens the wait.
Little (1961; 2011). Long-run averages in a stable process. Example figures are illustrative.
On the floor
How to use it
- 1
Pin it by the value stream map, where every inventory triangle becomes days with this one division.
- 2
When WIP piles up, ask the two questions the law allows: can we release less, or can the bottleneck do more?
- 3
Use it to explain why a FIFO lane or a kanban cap shortens lead time without anyone working faster.
- 4
Pair it with the free lead time worksheet and FIFO lane sizing sheet.
Which size to print
- 24 x 36 in or A2: a main wall or team board, read from a few metres away.
- 18 x 24 in or A3: a station or notice board. The A3 file also fits 11 x 17 in paper.
- Letter or A4: a clipboard, binder or handout, on any office printer.
Every PDF is vector, so it stays sharp at full size. Nothing runs to the edge of the page, so no bleed is needed.
Sources and notes
The law holds for long-run averages in a stable system, one where what goes in comes out. It says nothing about a single part on a single day. Example figures are illustrative.
- J. D. C. Little, A proof for the queuing formula: L = λW. Operations Research 9(3), 1961, pp. 383-387.
- J. D. C. Little, Little's Law as viewed on its 50th anniversary. Operations Research 59(3), 2011, pp. 536-549.
Templates, decks and guides to go with it
- Lead time worksheetProduction lead time from the inventory waiting at each step, value-added time and process cycle efficiency, plus an order traced from order to delivery.
- FIFO lane sizing sheetThe maximum for a FIFO lane from the stop it must cover, in whole containers, with length, refill and wait checks for up to eight lanes.
- Kanban sizing calculatorHow many kanban cards each loop needs, per part, with the change from today's cards and what the loop holds in days.
- Topic: Value stream mapping and flowEvery guide we have on the subject, sorted.
A poster reminds. A routine makes it stick.
See how plants run their audits, improvements and follow-ups in LeanSuite, on a call built around your own problem.
Book a 45-minute demo