

Quick reference poster
Updated · Free to print and share
Takt time, cycle time and lead time poster
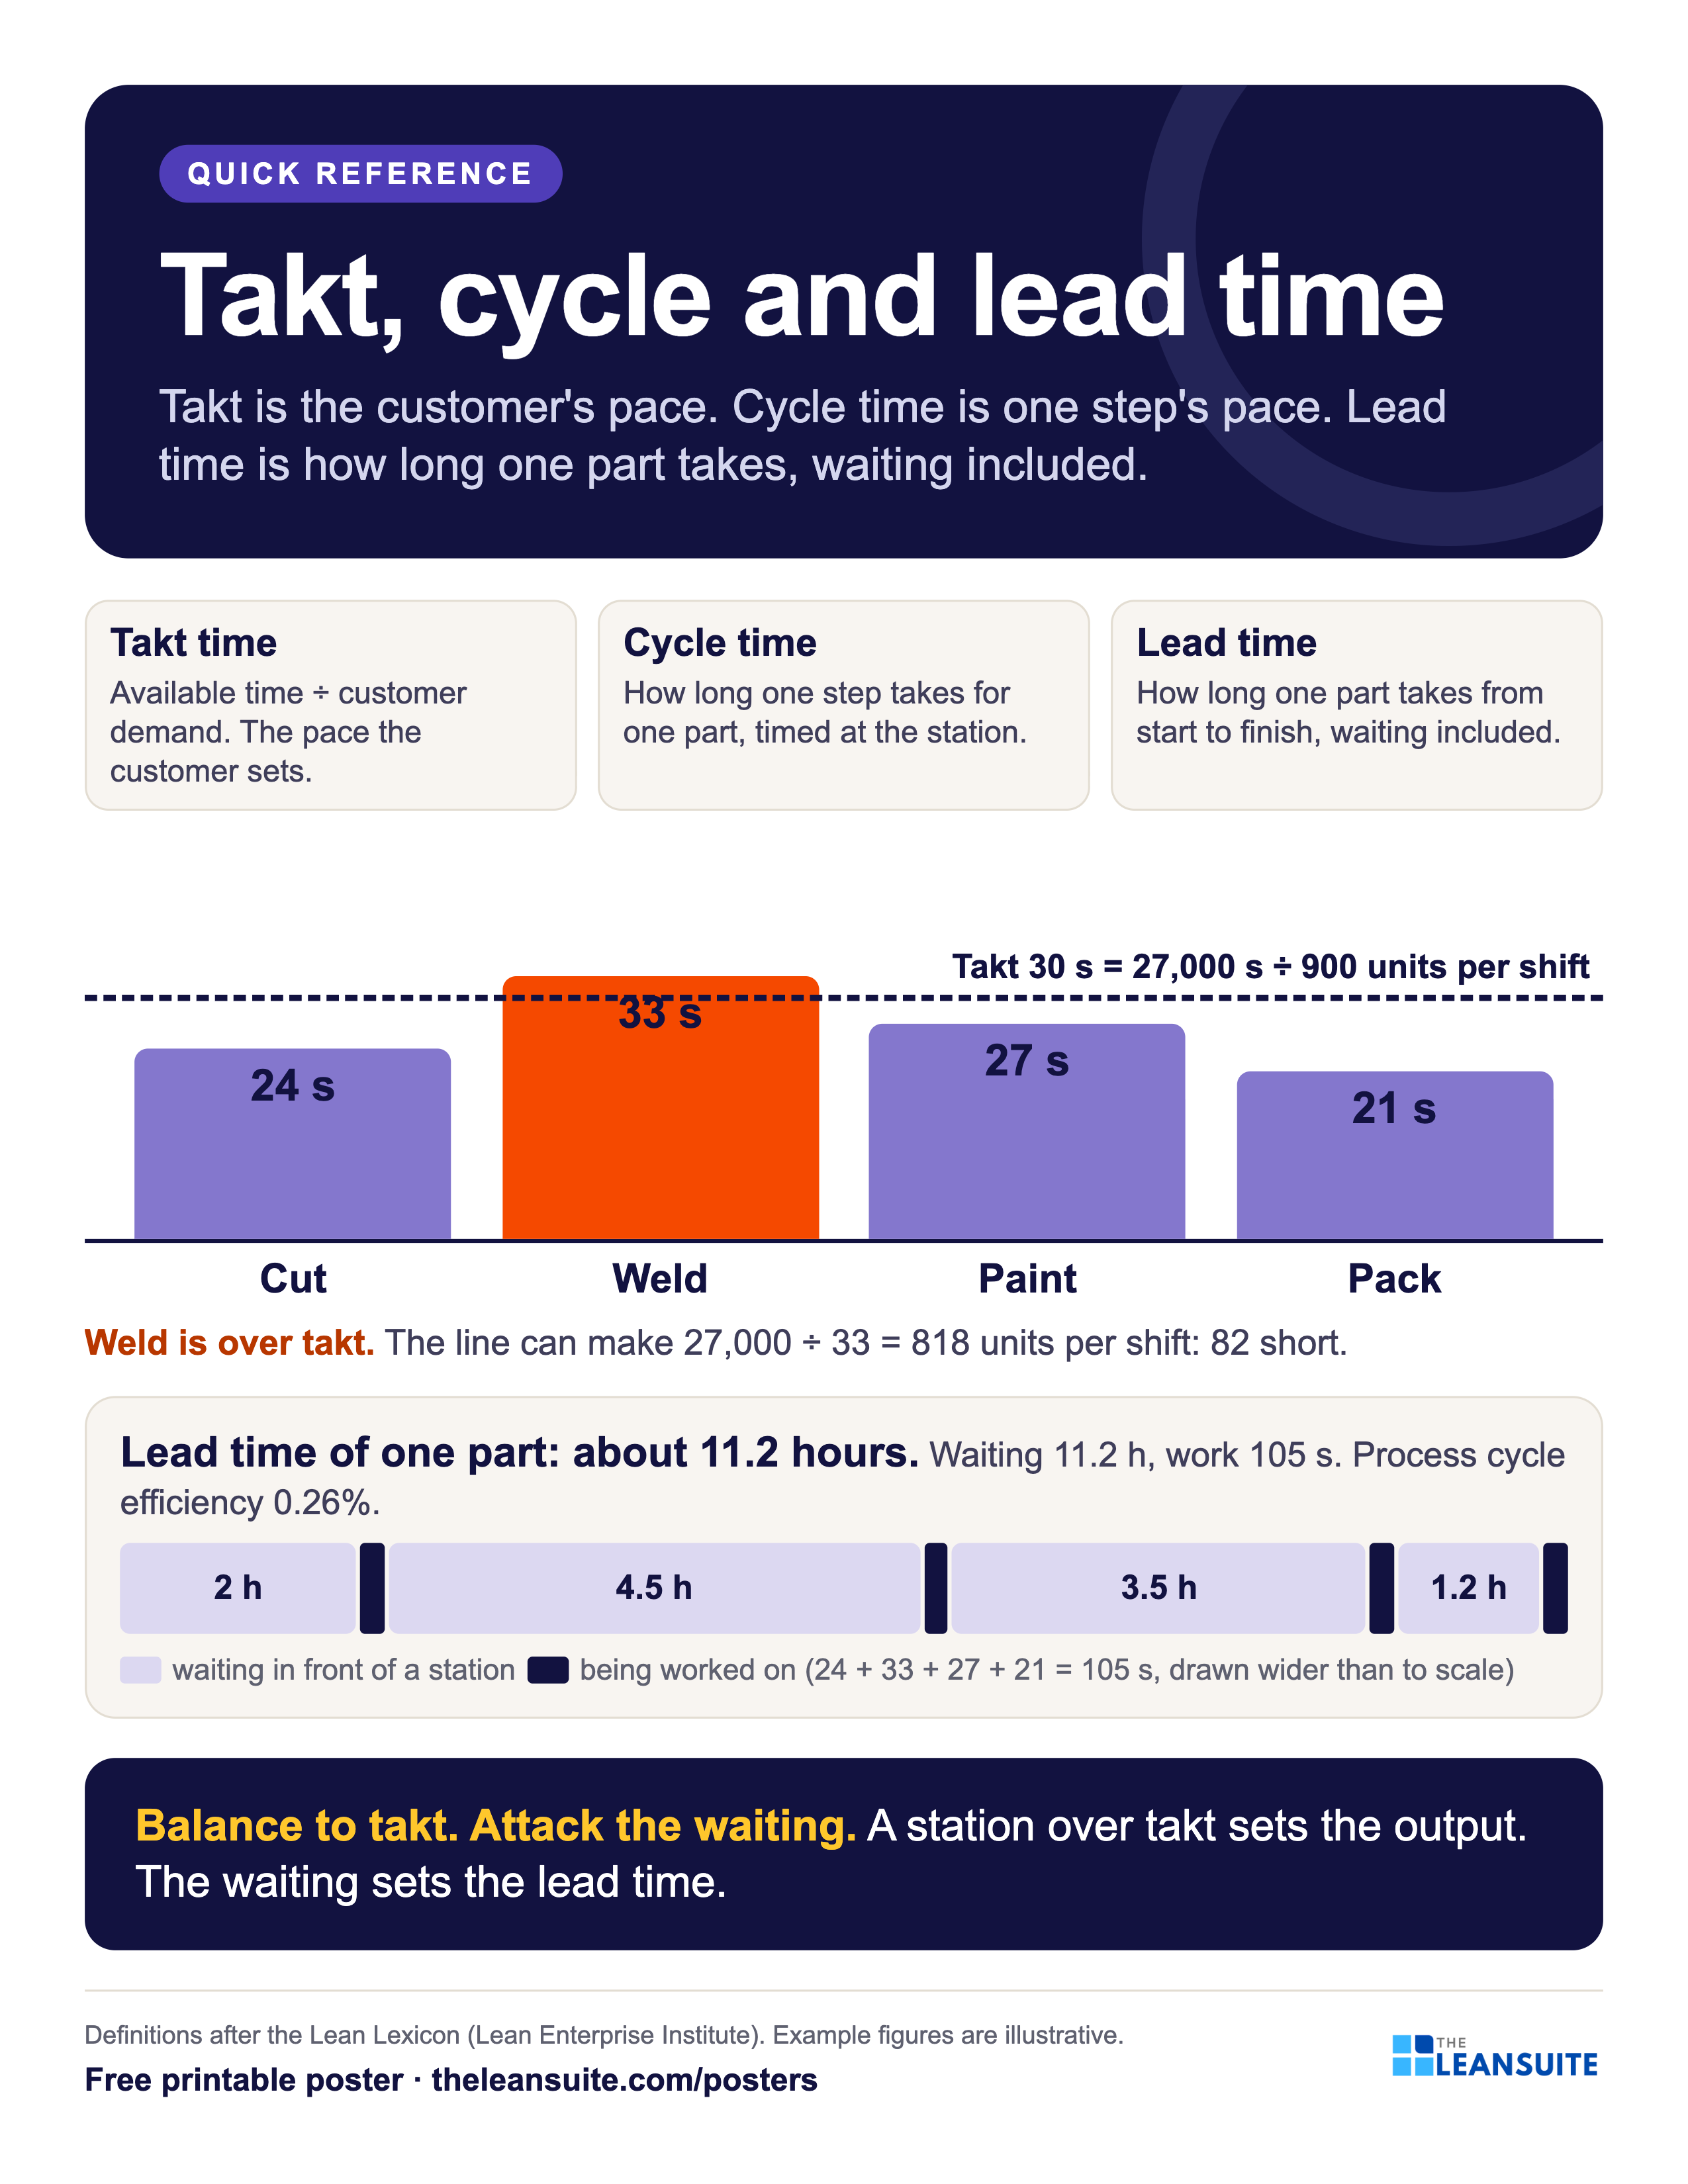
Takt time is available production time divided by customer demand: the pace the customer sets. Cycle time is how long one step takes for one part, as timed at the station. Lead time is how long one part takes from the start of the process to the end, waiting included. The three get mixed up daily, and the mix-up hides both the bottleneck and the waiting. This poster puts them on one line with a four-station example: a 30-second takt, one station at 33 seconds that cannot keep up, and a part that is worked on for 105 seconds and waits 11 hours.
Download the poster
The PNG is free to download now. The print-ready vector PDFs open after a short form, once.
Free to print and share with your team. Enter your name and work email once to download.
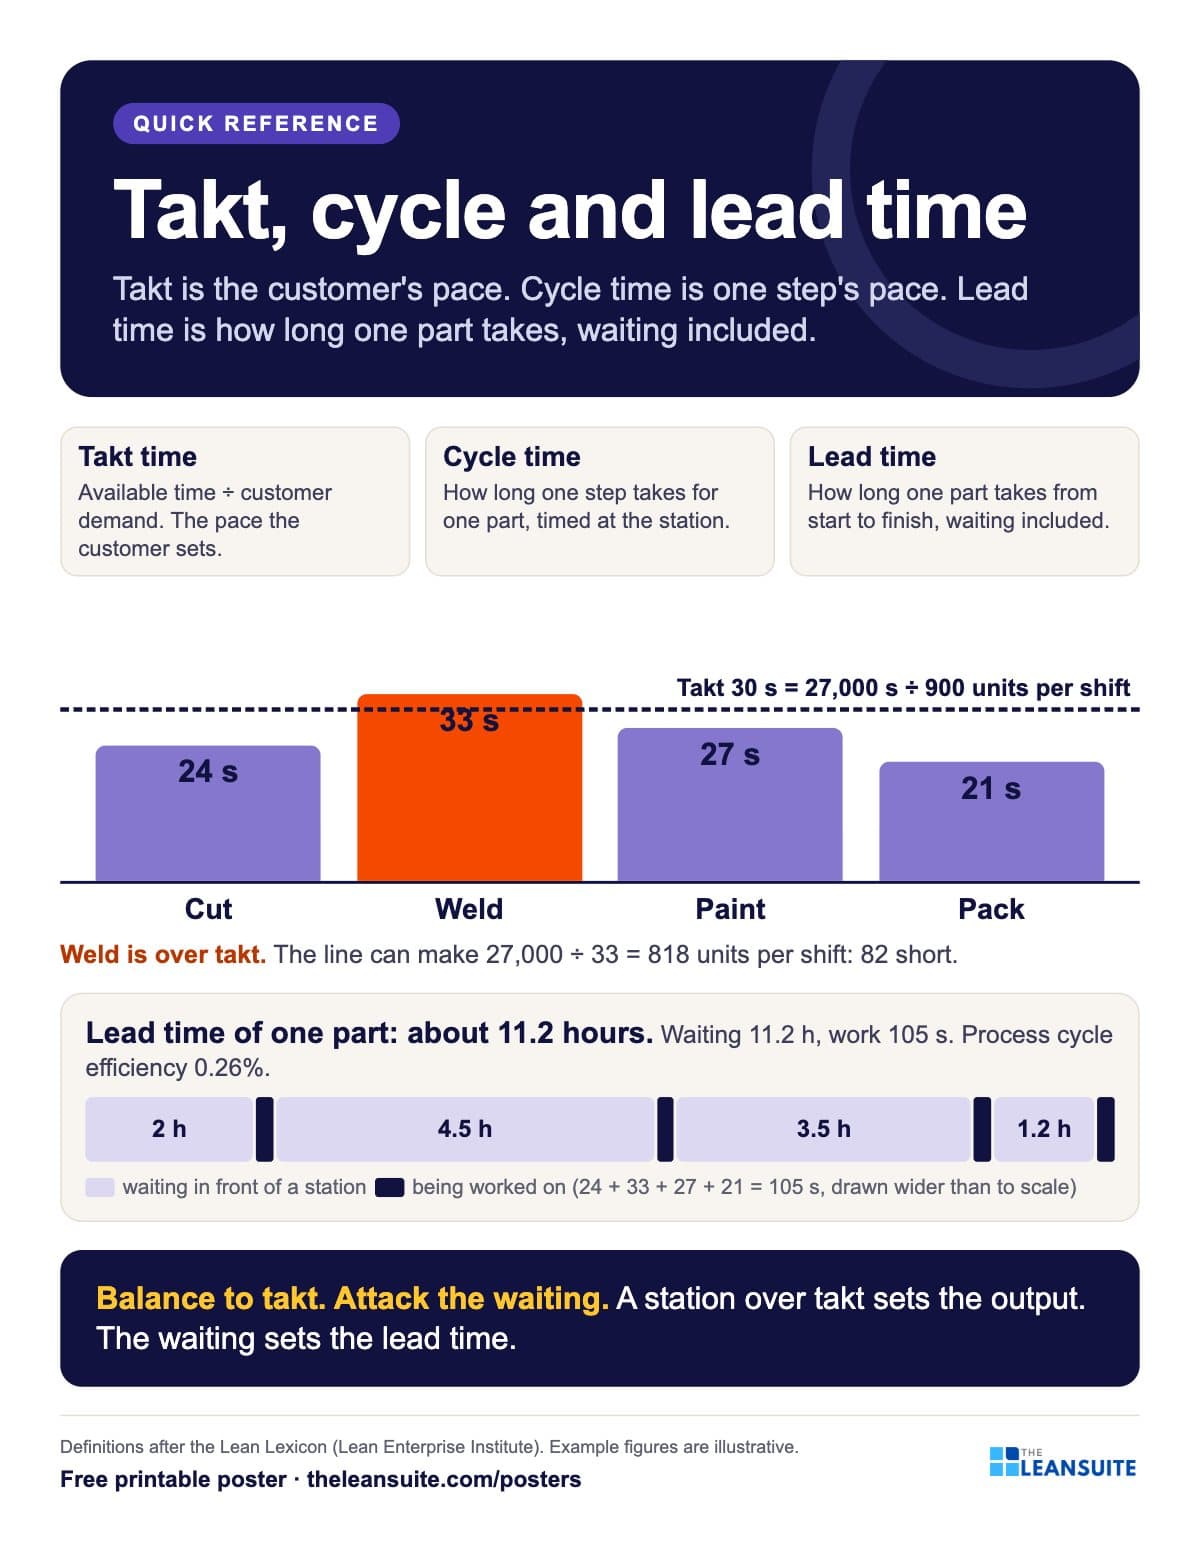 A takt line over four station cycle-time bars, one bar over the line, and below it a long lead-time bar that is almost all waiting.
The words on the poster
Takt, cycle and lead time
Takt is the customer's pace. Cycle time is one step's pace. Lead time is how long one part takes, waiting included.
Three clocks
- Takt time 30 s Available time ÷ customer demand = 27,000 s ÷ 900 units per shift.
- Cycle time, per station Cut 24 s, Weld 33 s, Paint 27 s, Pack 21 s. Weld is over takt: the line makes 818 units per shift, 82 short.
- Lead time of one part: about 11.2 hours Waiting 2 h + 4.5 h + 3.5 h + 1.2 h = 11.2 h, plus 105 s of work. Process cycle efficiency 0.26%.
- Balance to takt. Attack the waiting. A station over takt sets the output. The waiting sets the lead time.
Definitions after the Lean Lexicon (Lean Enterprise Institute). Example figures are illustrative.
On the floor
How to use it
- 1
Pin it where line balancing is discussed: every station's cycle time has to sit under the takt line.
- 2
When someone says cycle time and means lead time, point at the line.
- 3
Use the example to show why the big lead-time wins are in the waiting, not in the work.
- 4
Pair it with the free time study sheet, Yamazumi chart and lead time worksheet.
Which size to print
- 24 x 36 in or A2: a main wall or team board, read from a few metres away.
- 18 x 24 in or A3: a station or notice board. The A3 file also fits 11 x 17 in paper.
- Letter or A4: a clipboard, binder or handout, on any office printer.
Every PDF is vector, so it stays sharp at full size. Nothing runs to the edge of the page, so no bleed is needed.
Sources and notes
Example figures are illustrative. The waits are given in hours, as a team would read them off a value stream map: parts counted in front of each station, divided by the rate they are used.
Templates, decks and guides to go with it
- Time study sheetTime each element over 10 cycles and work out the average, lowest repeatable and standard time. Excel does the sums.
- Process capacity sheet templateEach machine in a part's routing with manual, auto and tool change time, its capacity per shift, and the step that limits the cell against demand.
- Lead time worksheetProduction lead time from the inventory waiting at each step, value-added time and process cycle efficiency, plus an order traced from order to delivery.
- Standard work combination tableOne operator's manual, machine, walk and wait time on a time chart against takt, with machine cycles and a process capacity sheet.
- Topic: Value stream mapping and flowEvery guide we have on the subject, sorted.
- Topic: Standard work, SOPs and trainingEvery guide we have on the subject, sorted.
A poster reminds. A routine makes it stick.
See how plants run their audits, improvements and follow-ups in LeanSuite, on a call built around your own problem.
Book a 45-minute demo