

Quick reference poster
Updated · Free to print and share
OEE and the six big losses poster
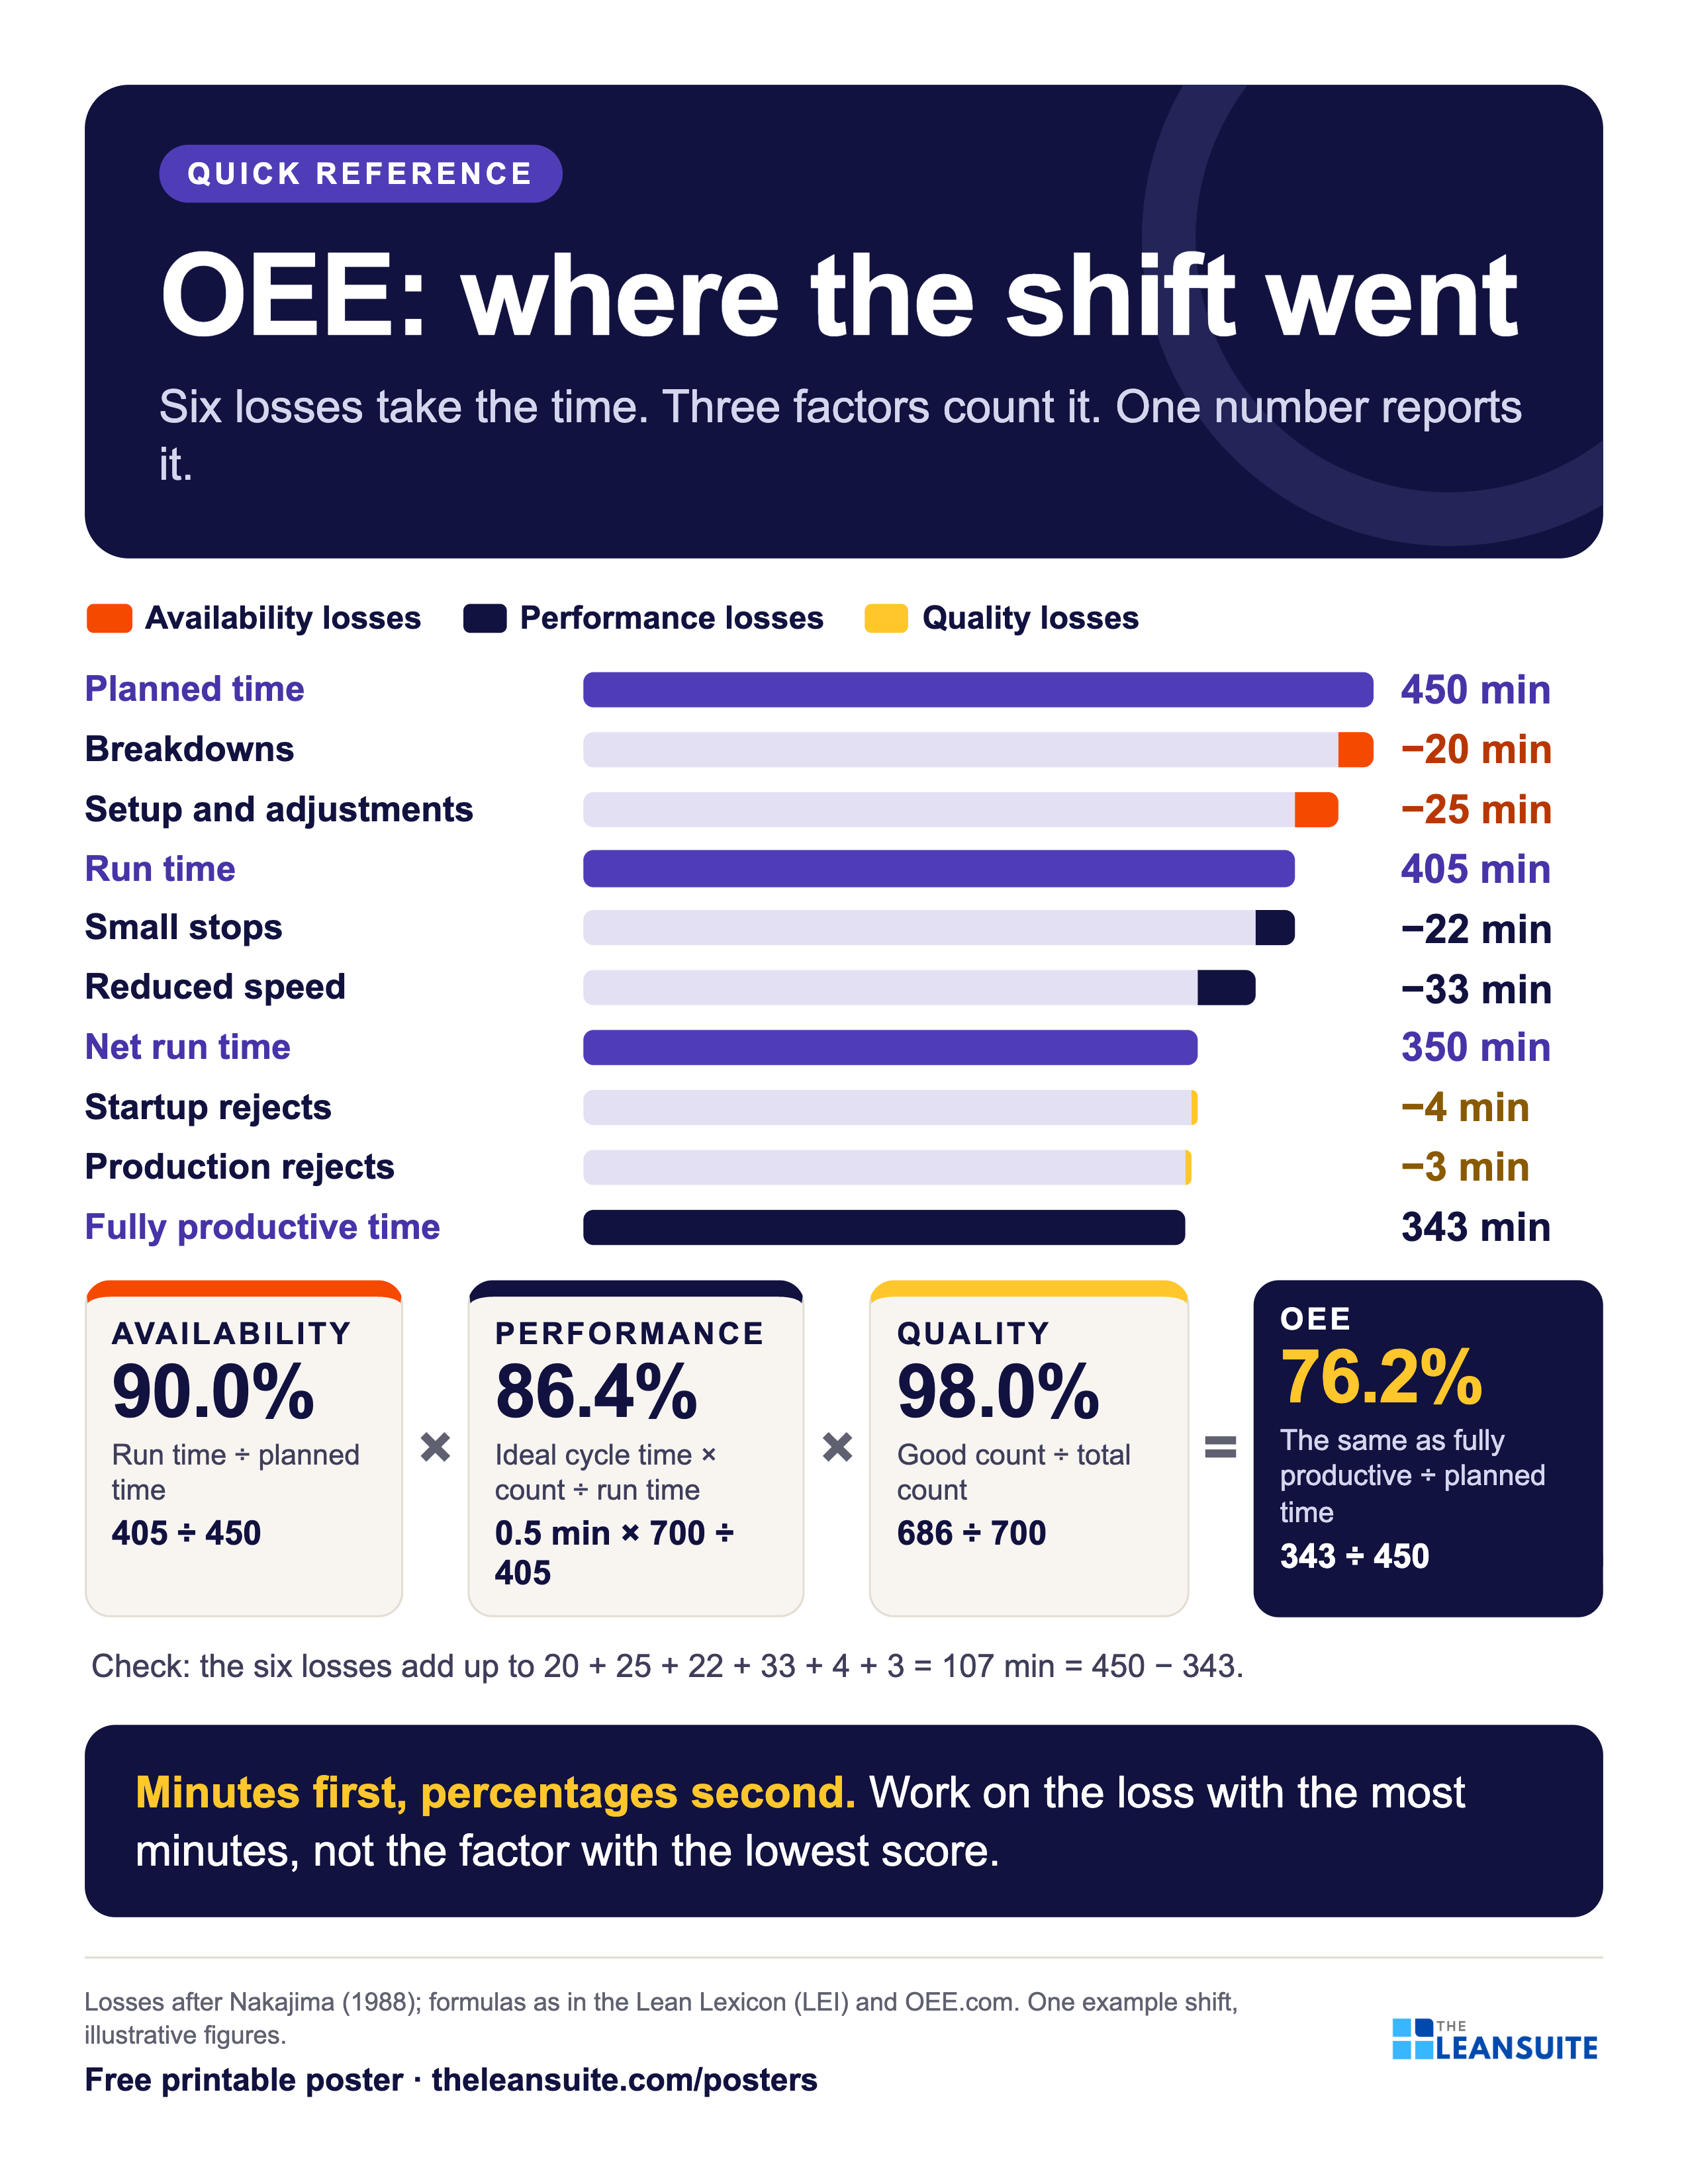
Overall equipment effectiveness (OEE) is the share of a machine's planned production time that is truly productive: availability × performance × quality. The six big losses, named by Seiichi Nakajima in his TPM work, are where that time goes: breakdowns and setups cut availability, small stops and reduced speed cut performance, startup and production rejects cut quality. This poster follows one shift from 450 planned minutes down to 343 fully productive minutes, so a team sees each loss in minutes before it sees a percentage.
Download the poster
The PNG is free to download now. The print-ready vector PDFs open after a short form, once.
Free to print and share with your team. Enter your name and work email once to download.
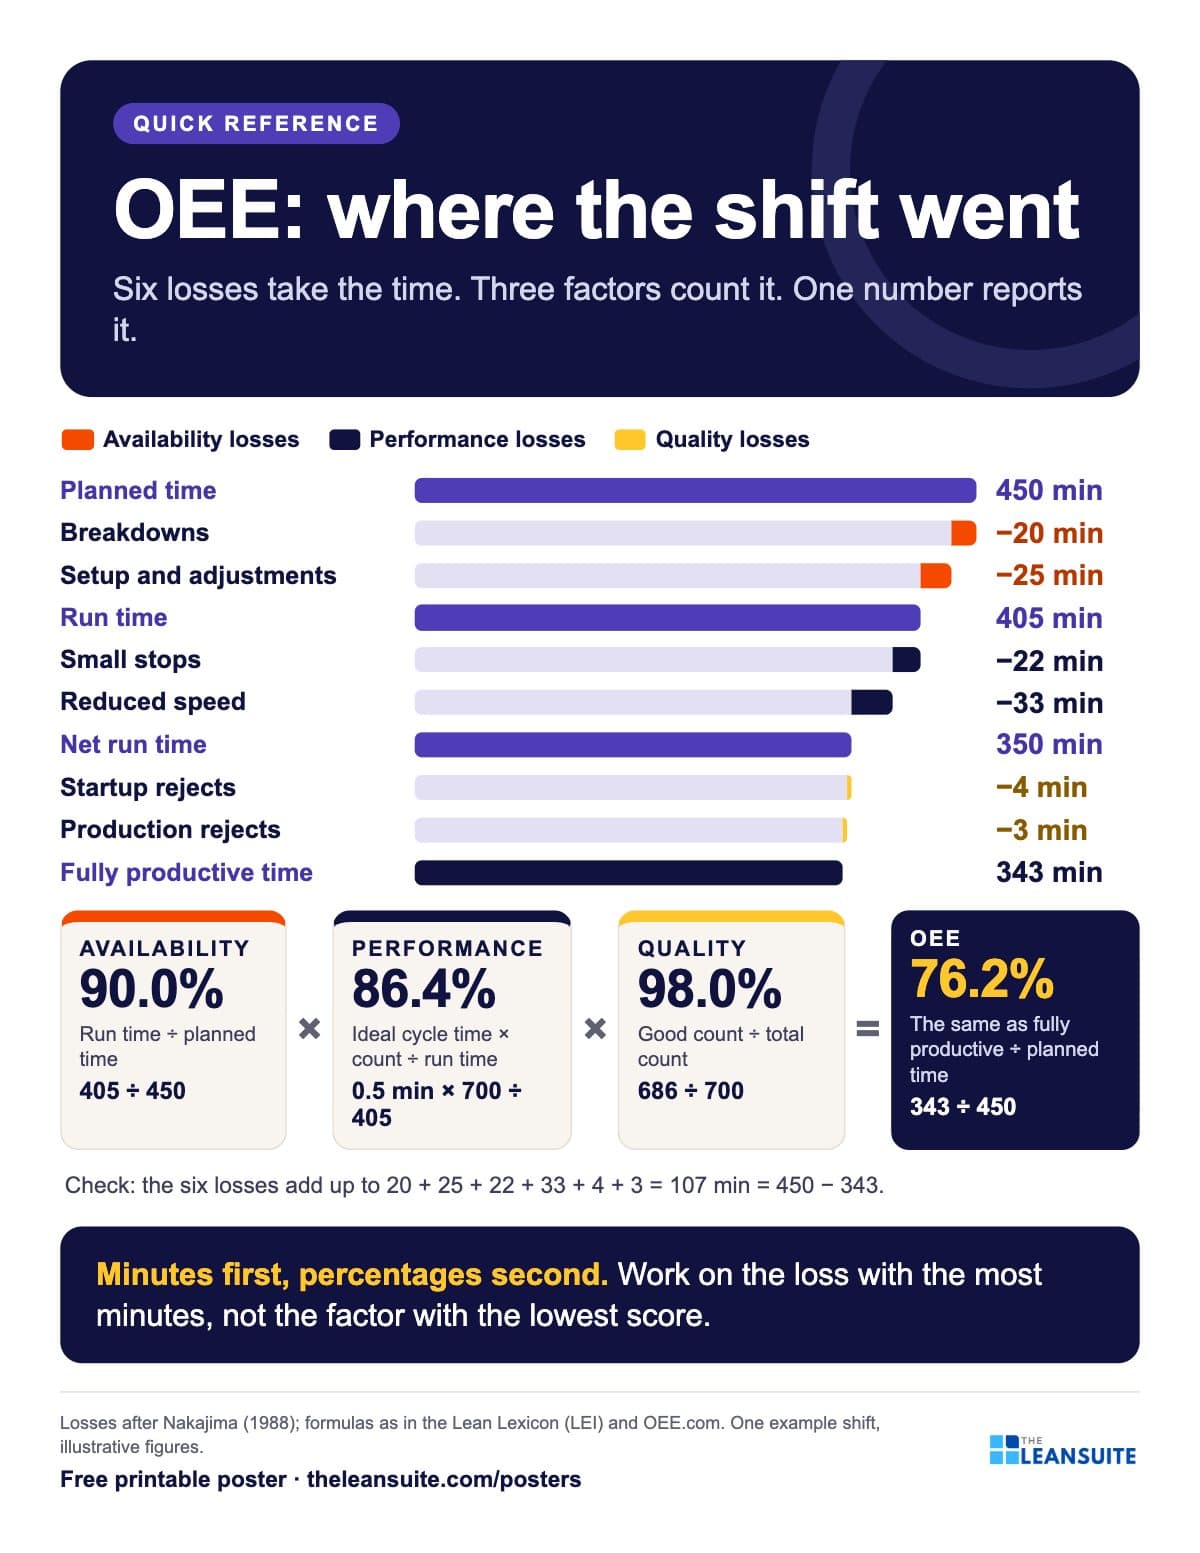 A bar of planned time cut down by six named losses to fully productive time, with availability, performance, quality and OEE worked out for one shift.
The words on the poster
OEE: where the shift went
Six losses take the time. Three factors count it. One number reports it.
One shift: 450 planned minutes
- Breakdowns: 20 min (availability) Unplanned stops: a failure, a jam that needs maintenance.
- Setup and adjustments: 25 min (availability) Changeovers, planned adjustments, cleaning.
- Small stops: 22 min (performance) Short stops the operator clears: a misfeed, a sensor.
- Reduced speed: 33 min (performance) Running below the ideal cycle time: worn parts, poor feed.
- Startup rejects: 4 min (quality) Rejects after a setup or restart, until it runs stable.
- Production rejects: 3 min (quality) Rejects in steady running: scrap and rework.
Worked out
- Availability 90.0% Run time ÷ planned time = 405 ÷ 450.
- Performance 86.4% (Ideal cycle time × total count) ÷ run time = (0.5 min × 700) ÷ 405 = 350 ÷ 405.
- Quality 98.0% Good count ÷ total count = 686 ÷ 700.
- OEE 76.2% 90.0% × 86.4% × 98.0%, the same as fully productive time ÷ planned time = 343 ÷ 450.
- Check The six losses add up to 107 minutes = 450 − 343.
- Minutes first, percentages second. Work on the loss with the most minutes, not the factor with the lowest score.
Losses after Nakajima (1988); formulas as in the Lean Lexicon (LEI) and OEE.com. One example shift, illustrative figures.
On the floor
How to use it
- 1
Pin it by the OEE board, so a number like 76% is read as 107 lost minutes with names on them.
- 2
In the daily meeting, ask which of the six losses took the most minutes yesterday, and work on that one.
- 3
Use the worked shift to teach new team members how A, P and Q are calculated before they fill in a tracking sheet.
- 4
Pair it with the free six big losses worksheet and OEE tracking sheet, which use the same shift.
Which size to print
- 24 x 36 in or A2: a main wall or team board, read from a few metres away.
- 18 x 24 in or A3: a station or notice board. The A3 file also fits 11 x 17 in paper.
- Letter or A4: a clipboard, binder or handout, on any office printer.
Every PDF is vector, so it stays sharp at full size. Nothing runs to the edge of the page, so no bleed is needed.
Sources and notes
The shift on the poster is a worked example with illustrative figures, the same shift as in the six big losses worksheet. Plants count small stops and reduced speed differently; the poster follows the usual convention of timing small stops and working out reduced speed as what is left of the run time.
- Seiichi Nakajima, Introduction to TPM: Total Productive Maintenance (Productivity Press, 1988): the six big losses.
- Lean Enterprise Institute, Lean Lexicon: overall equipment effectiveness.
- OEE.com (Vorne): calculating OEE, and the six big losses.
Templates, decks and guides to go with it
- TPM training presentation: the 8 pillarsFree training deck: What TPM is, the six big losses, OEE and the 8 pillars, in 19 slides with a loss-spotting activity.
- Six big losses worksheetWhere a machine's planned time goes: the six big losses in minutes, ranked, with A, P, Q and OEE worked out.
- OEE tracking sheetOne row per shift for a week. The Excel version works out availability, performance, quality and OEE and charts the week.
- Equipment downtime log (MTTR and MTBF)A breakdown and downtime log, with MTTR, MTBF and downtime by machine and cause worked out in Excel.
- Downtime reason codes template26 starter codes mapped to the six big losses, a log with drop-downs, a Pareto by code and by loss, and a code card for the line.
- Topic: TPM and maintenanceEvery guide we have on the subject, sorted.
A poster reminds. A routine makes it stick.
See how plants run their audits, improvements and follow-ups in LeanSuite, on a call built around your own problem.
Book a 45-minute demo