

Quick reference posters
Last updated · Free to print and share
Lean quick-reference poster pack
Six printable posters for the shop floor, each one diagram with one worked example. Definitions follow the Lean Lexicon. Every number is worked in the open, from a 450-minute shift to 76.2% OEE. Readable from two metres, prints in black and white.
Download the pack
All six posters in one vector PDF, one page each, 1.5 MB at A3. Opens after a short form, once. Each poster's PNG below needs no form.
Free to use: print it, copy it and edit it for your team. Enter your name and work email once to download.
The six posters
Picture first, words second. One worked example each.
The 8 wastes and 5S posters already live in the lean series, so this pack takes the measures and methods a wall usually lacks: the ones with arithmetic in them, and the ones that decide which method to use.
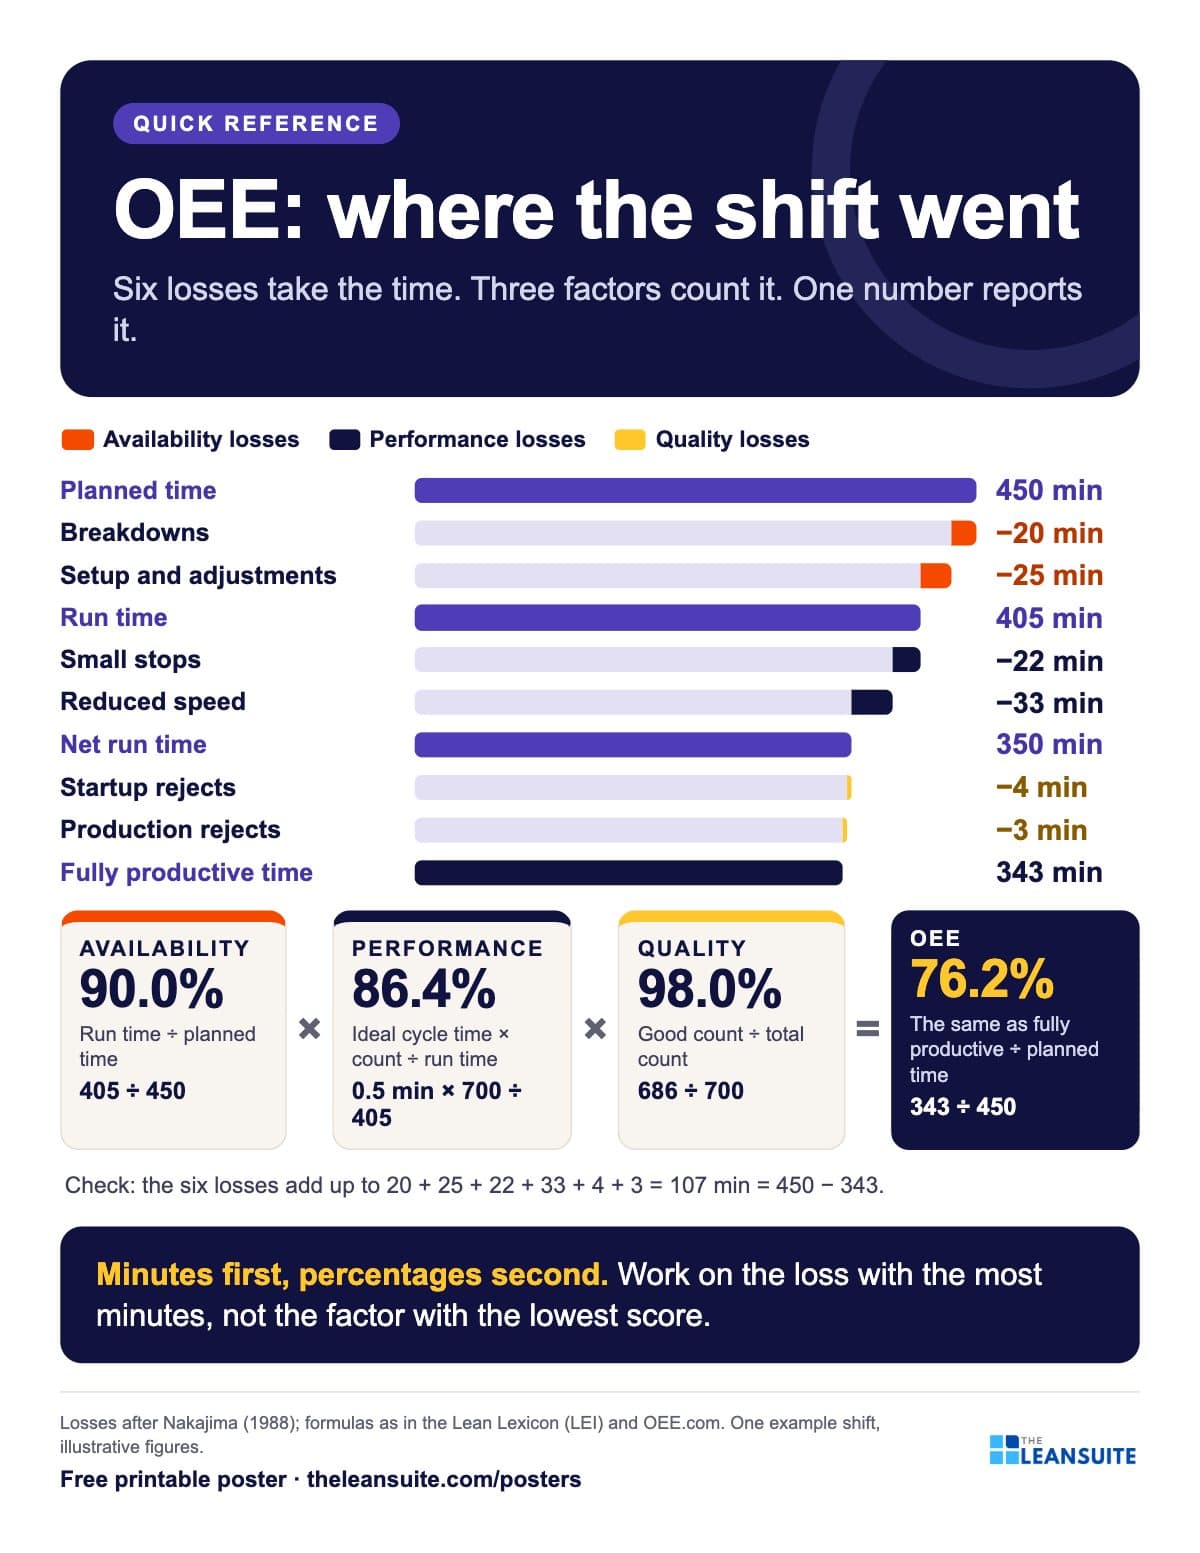
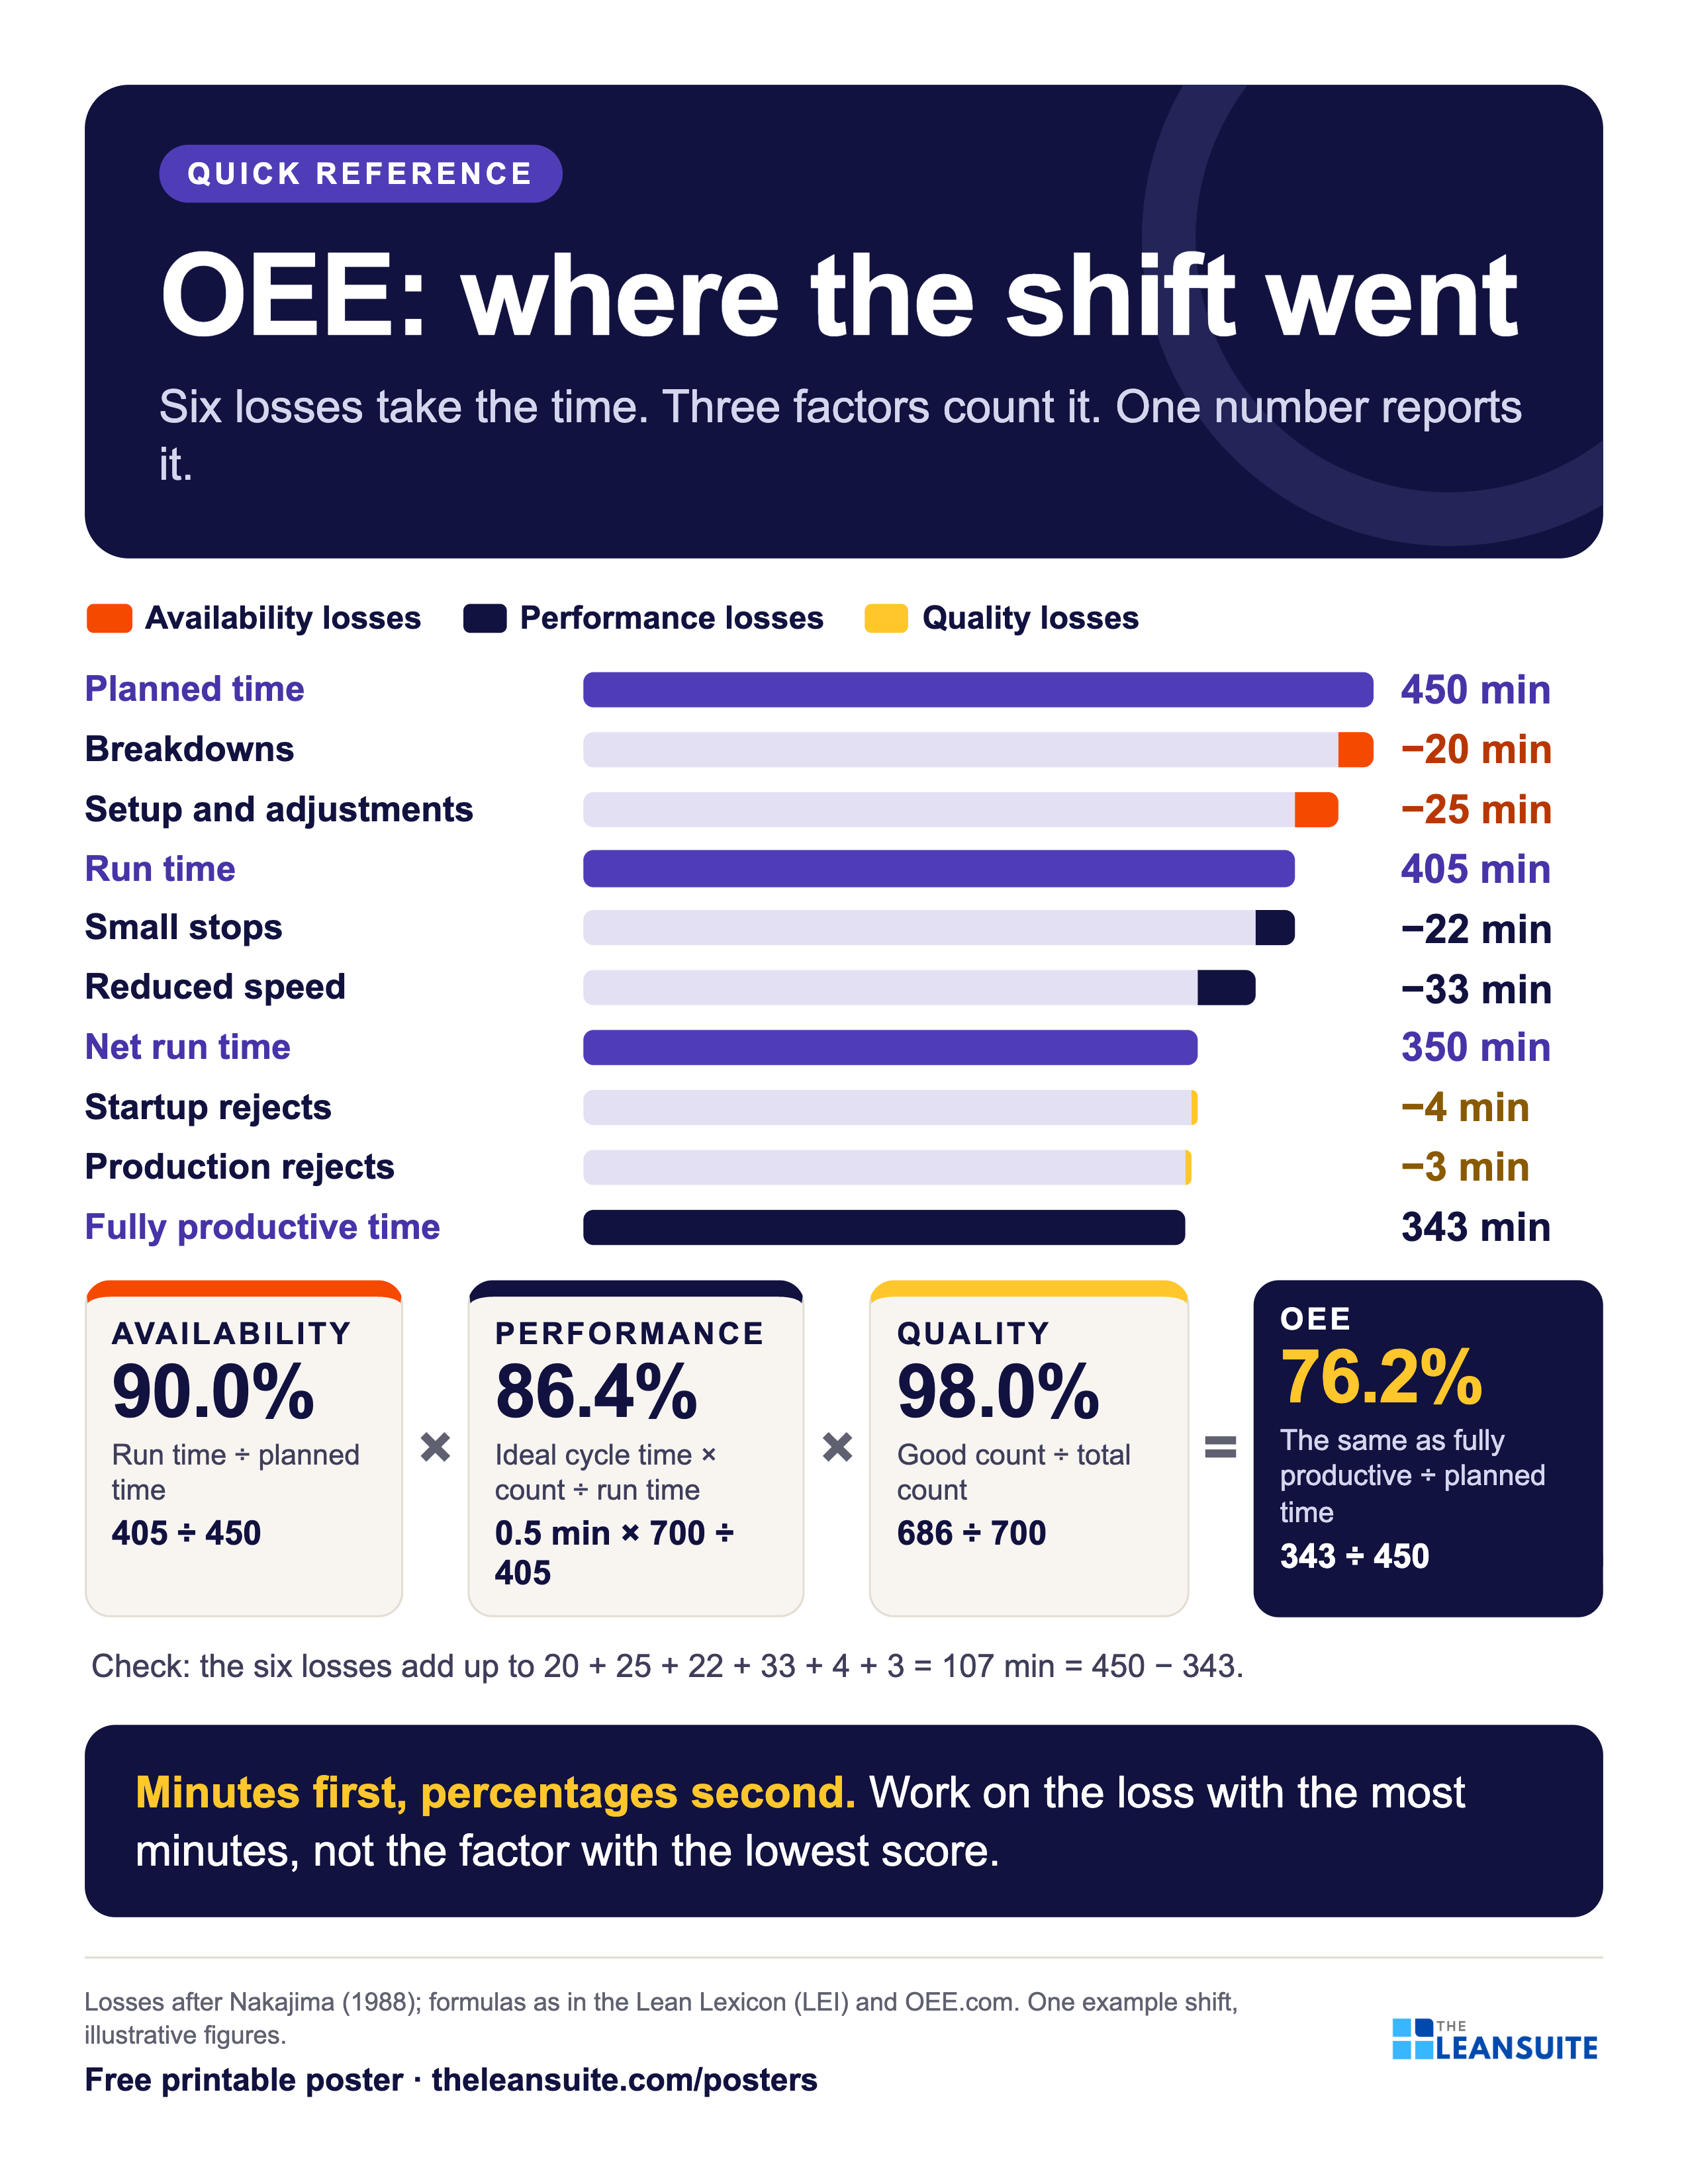
Poster 1 of 6, Letter preview. Losses after Nakajima (1988); formulas as in the Lean Lexicon (LEI) and OEE.com. One example shift, illustrative figures. OEE: where the shift went
Overall equipment effectiveness (OEE) is the share of a machine's planned production time that is truly productive: availability × performance × quality. The six big losses, named by Seiichi Nakajima in his TPM work, are where that time goes: breakdowns and setups cut availability, small stops and reduced speed cut performance, startup and production rejects cut quality. This poster follows one shift from 450 planned minutes down to 343 fully productive minutes, so a team sees each loss in minutes before it sees a percentage.
On the poster
OEE 76.2%
90.0% × 86.4% × 98.0%, the same as fully productive time ÷ planned time = 343 ÷ 450.
Download this poster as PNG (300 dpi)2550 x 3300 px, prints at 8.5 x 11 in · 486 KB · no formThe poster's own page: how to use it, sources, related templatesFree to print and share with your team. Enter your name and work email once to download.
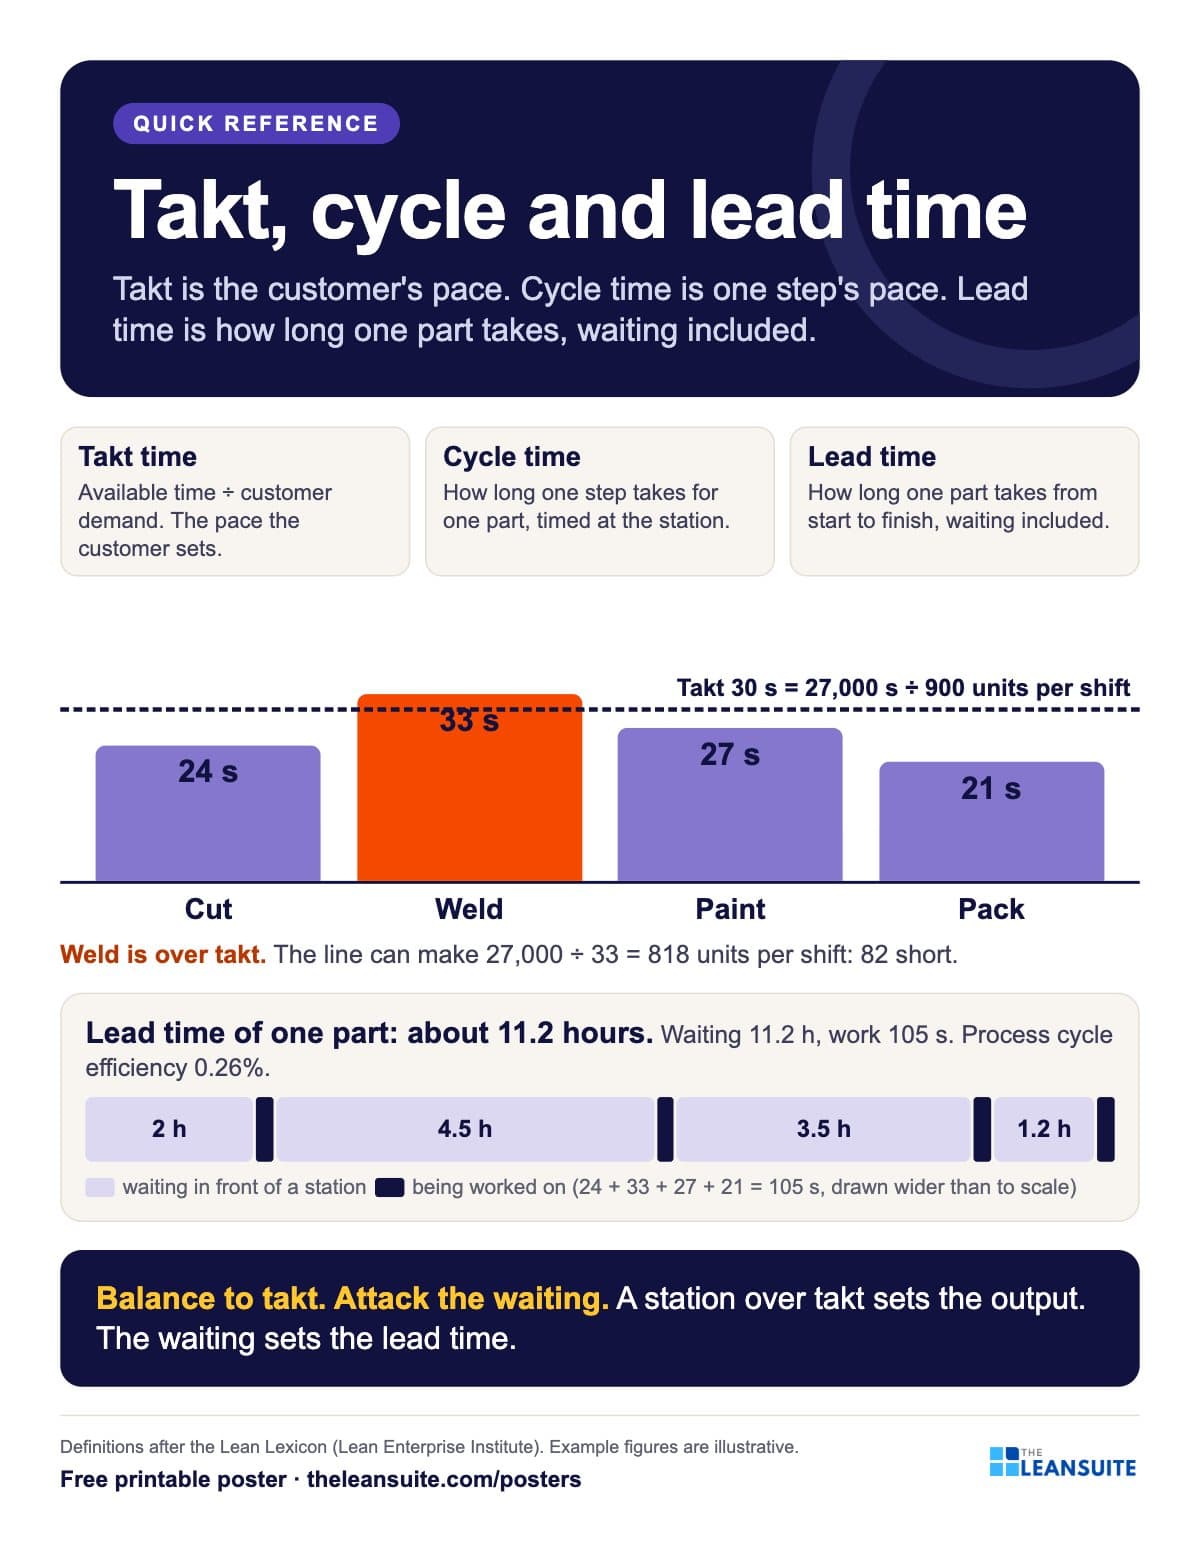
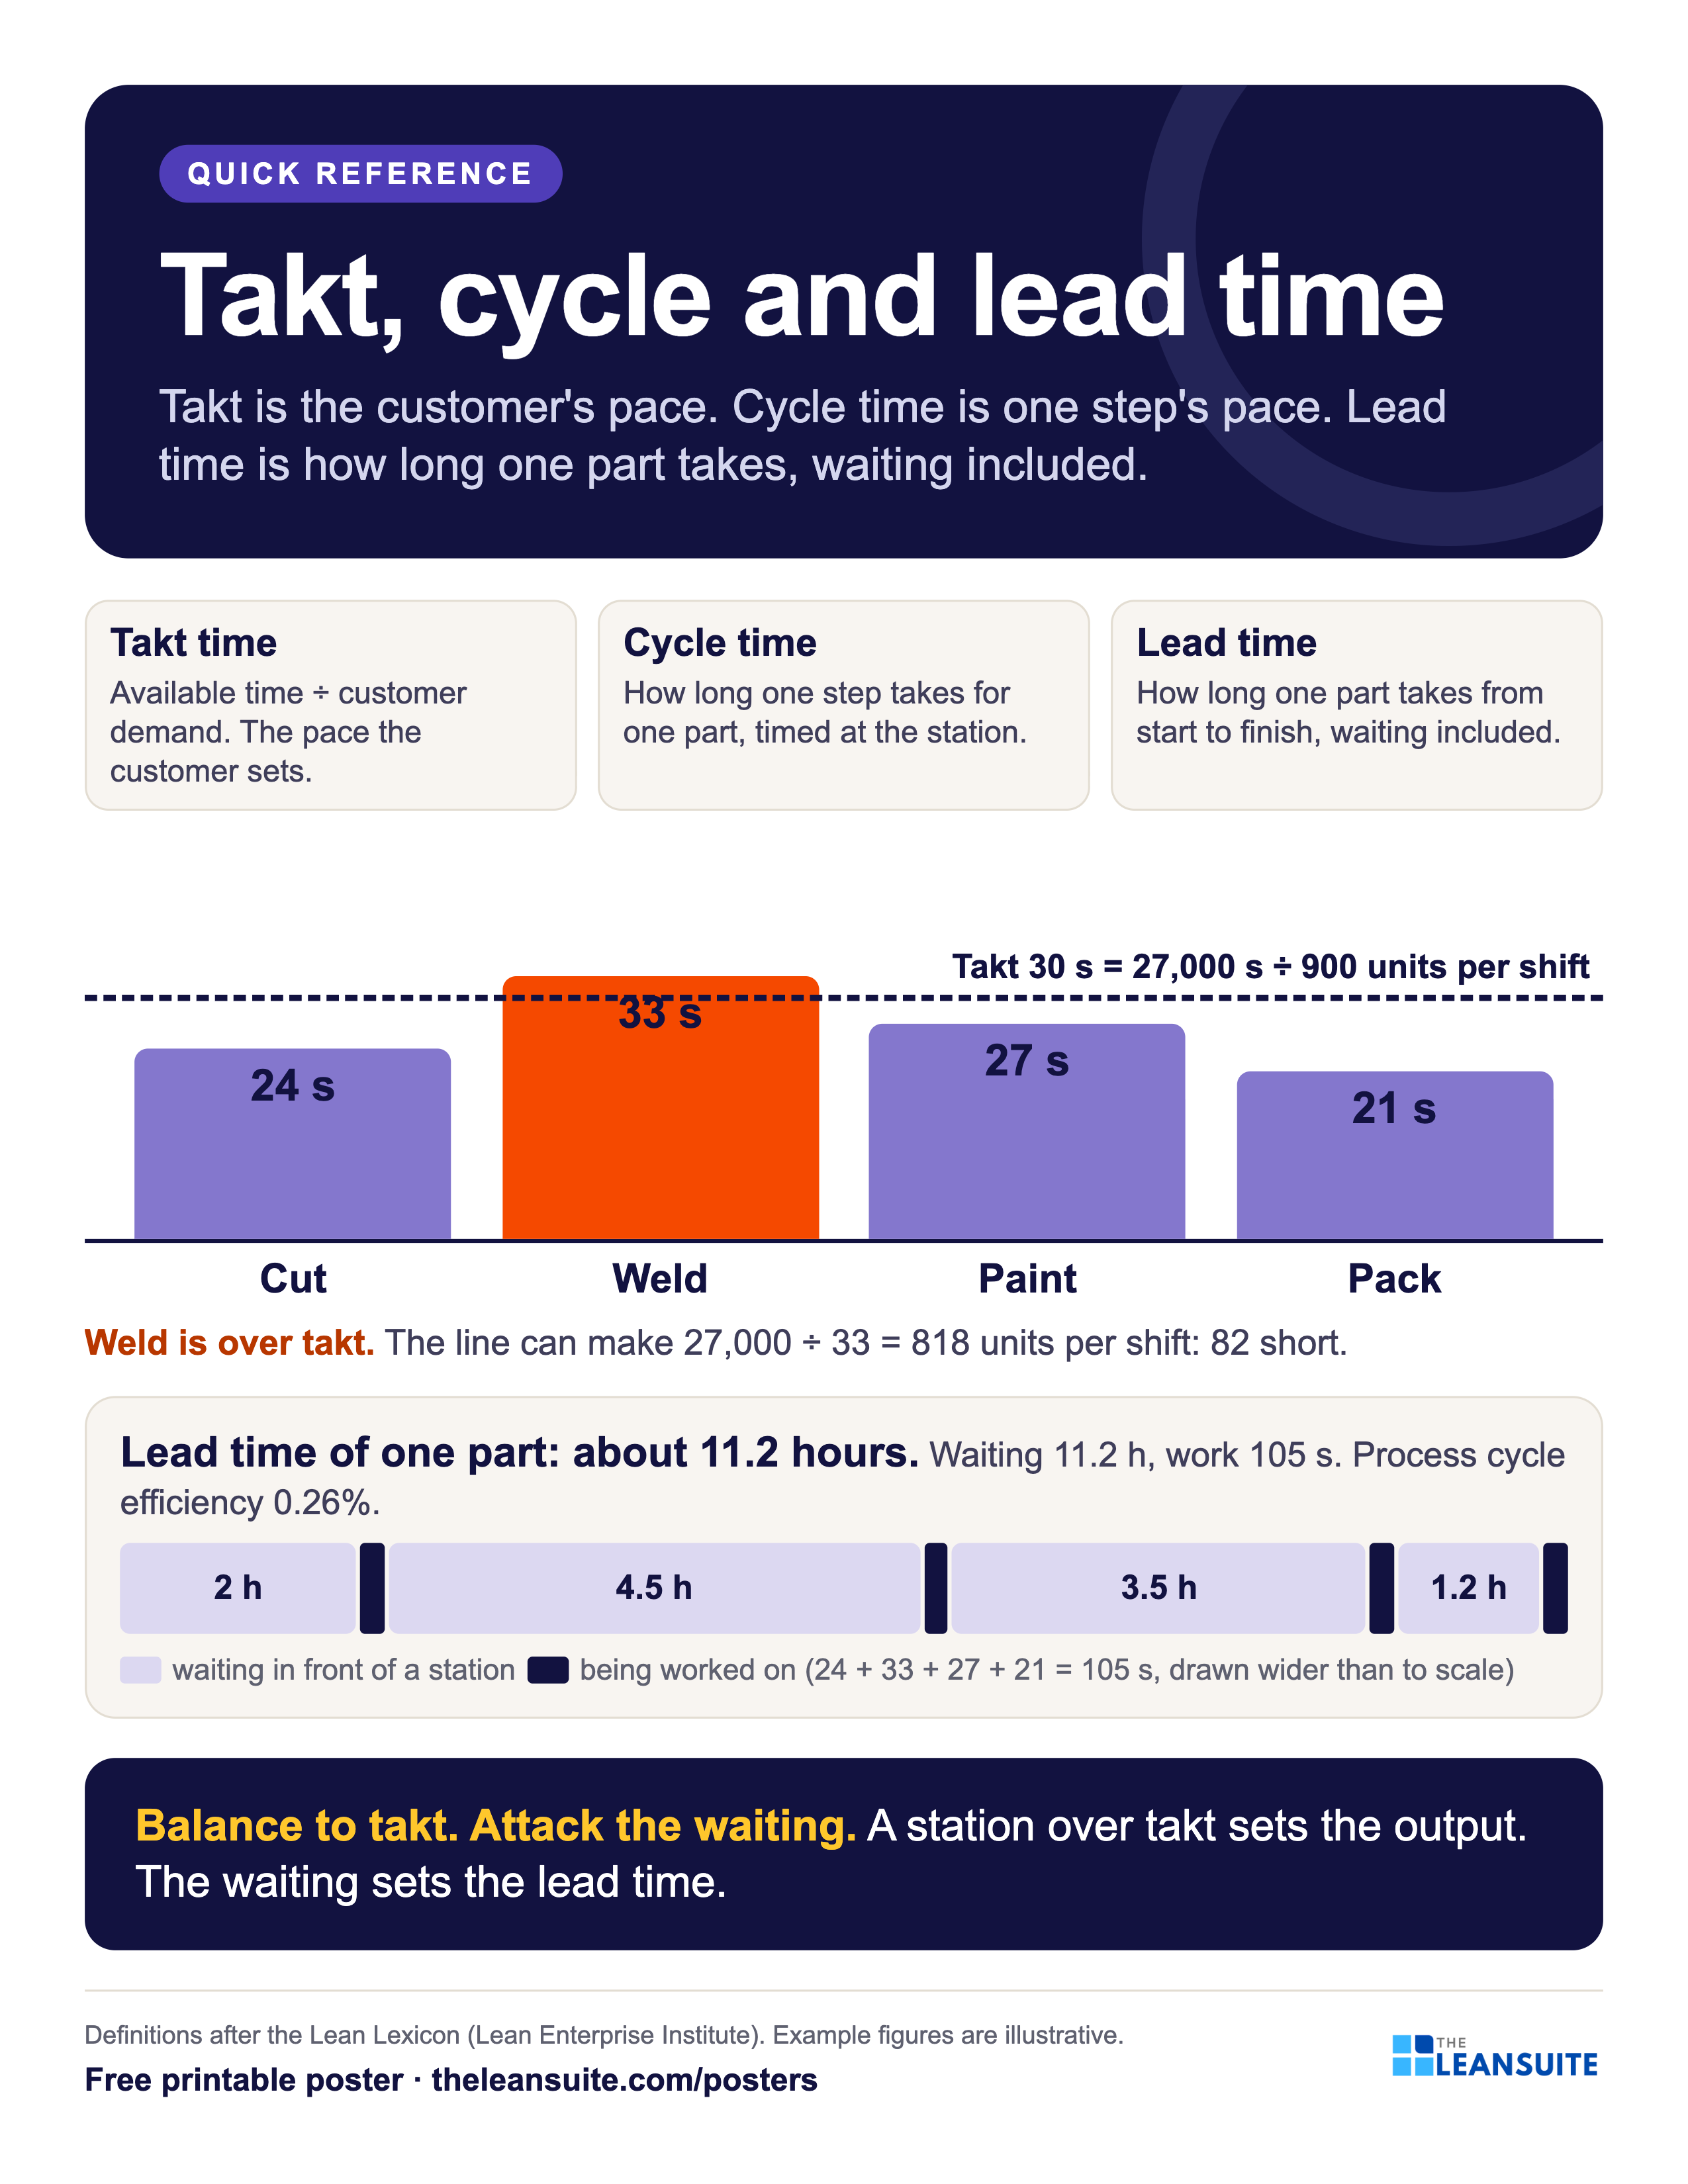
Poster 2 of 6, Letter preview. Definitions after the Lean Lexicon (Lean Enterprise Institute). Example figures are illustrative. Takt, cycle and lead time
Takt time is available production time divided by customer demand: the pace the customer sets. Cycle time is how long one step takes for one part, as timed at the station. Lead time is how long one part takes from the start of the process to the end, waiting included. The three get mixed up daily, and the mix-up hides both the bottleneck and the waiting. This poster puts them on one line with a four-station example: a 30-second takt, one station at 33 seconds that cannot keep up, and a part that is worked on for 105 seconds and waits 11 hours.
On the poster
Lead time of one part: about 11.2 hours
Waiting 2 h + 4.5 h + 3.5 h + 1.2 h = 11.2 h, plus 105 s of work. Process cycle efficiency 0.26%.
Download this poster as PNG (300 dpi)2550 x 3300 px, prints at 8.5 x 11 in · 447 KB · no formThe poster's own page: how to use it, sources, related templatesFree to print and share with your team. Enter your name and work email once to download.
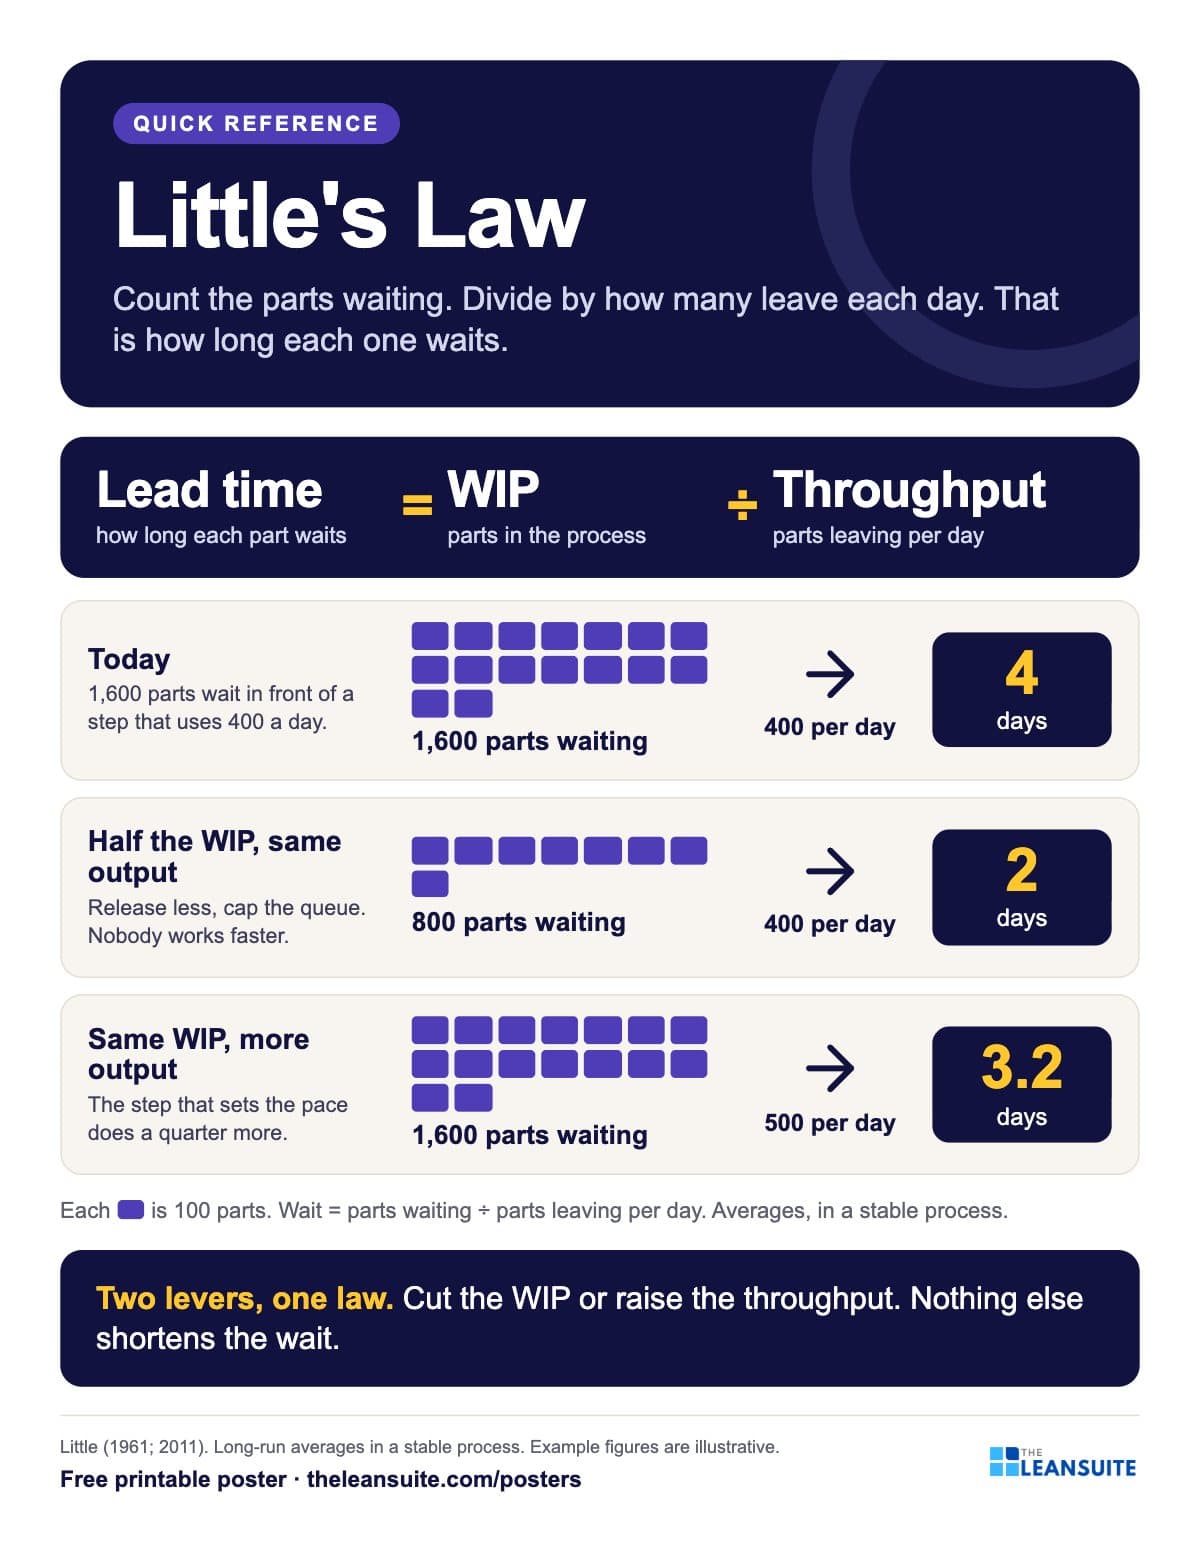
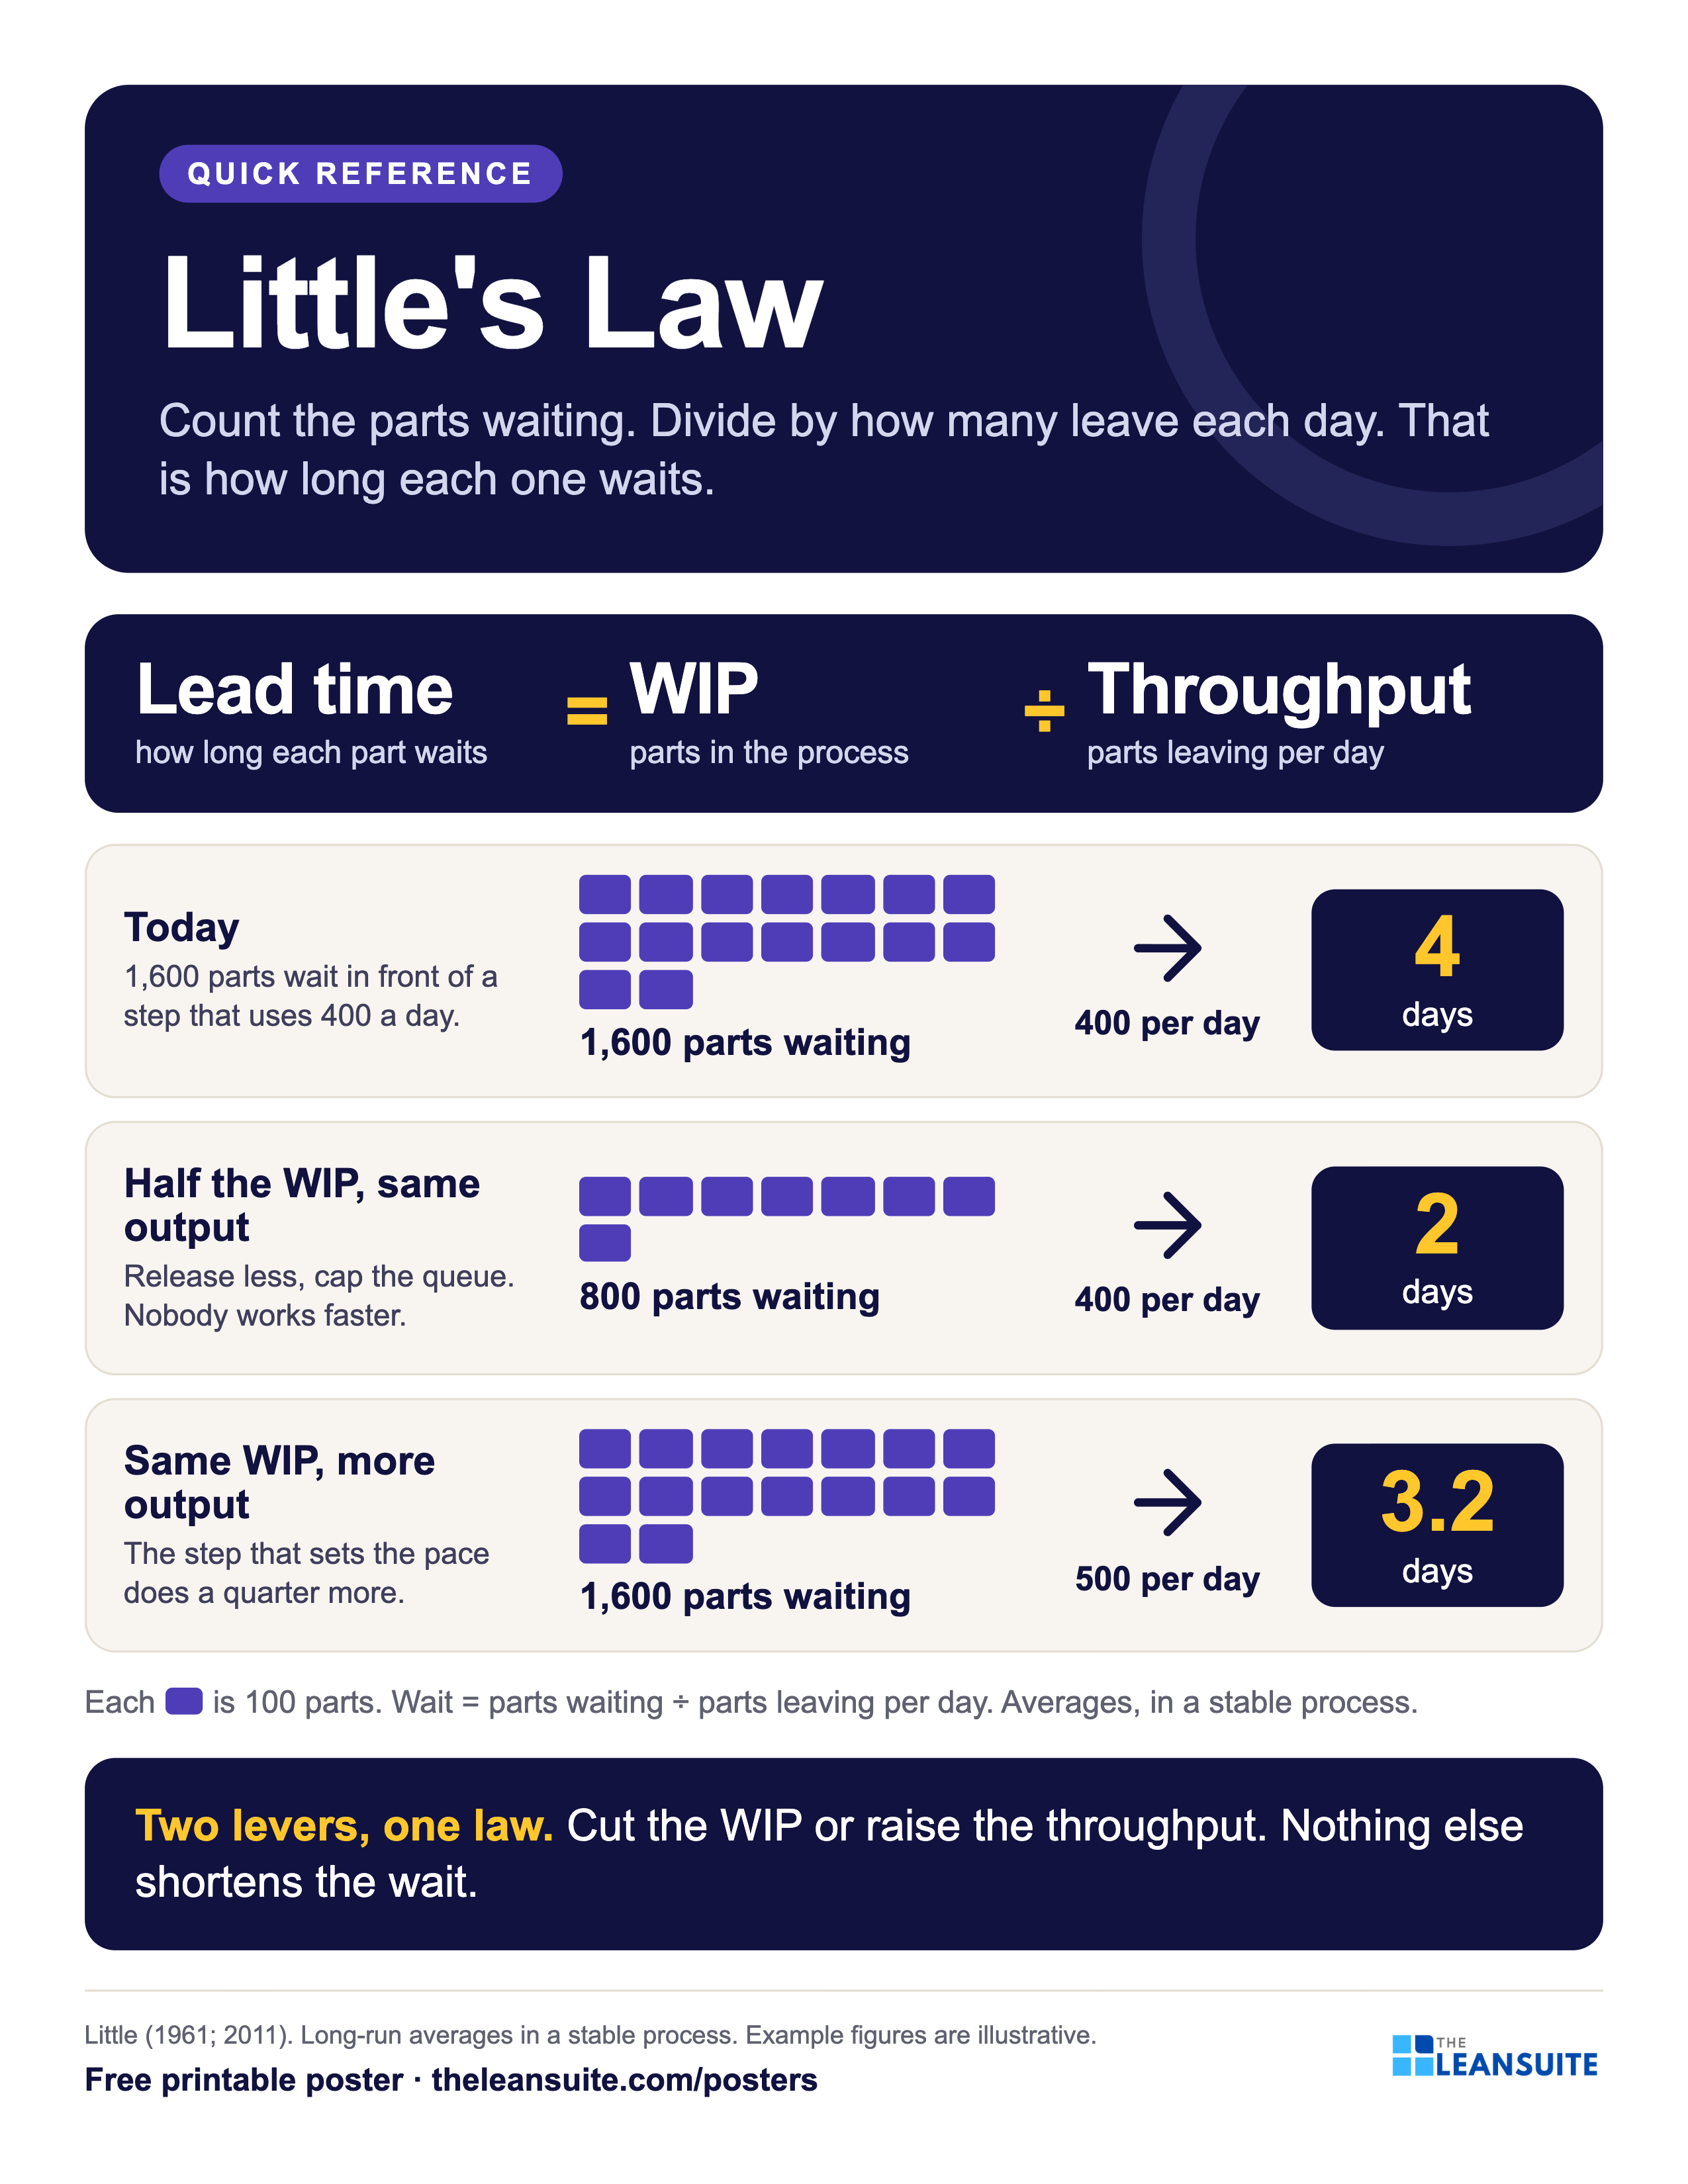
Poster 3 of 6, Letter preview. Little (1961; 2011). Long-run averages in a stable process. Example figures are illustrative. Little's Law
Little's Law says that, on average and in a stable process, the time a part spends in a process equals the number of parts in it divided by the rate they leave: lead time = WIP ÷ throughput. John D. C. Little proved it in 1961; value stream mappers use it every day to turn counted inventory into days. This poster draws the law as a queue of parts and works three cases: 1,600 parts ahead of a step that uses 400 a day wait 4 days; halve the WIP and they wait 2; raise the throughput by a quarter and they wait 3.2.
On the poster
Today: 1,600 parts ÷ 400 per day = 4 days
1,600 parts wait in front of a step that uses 400 a day.
Download this poster as PNG (300 dpi)2550 x 3300 px, prints at 8.5 x 11 in · 459 KB · no formThe poster's own page: how to use it, sources, related templatesFree to print and share with your team. Enter your name and work email once to download.
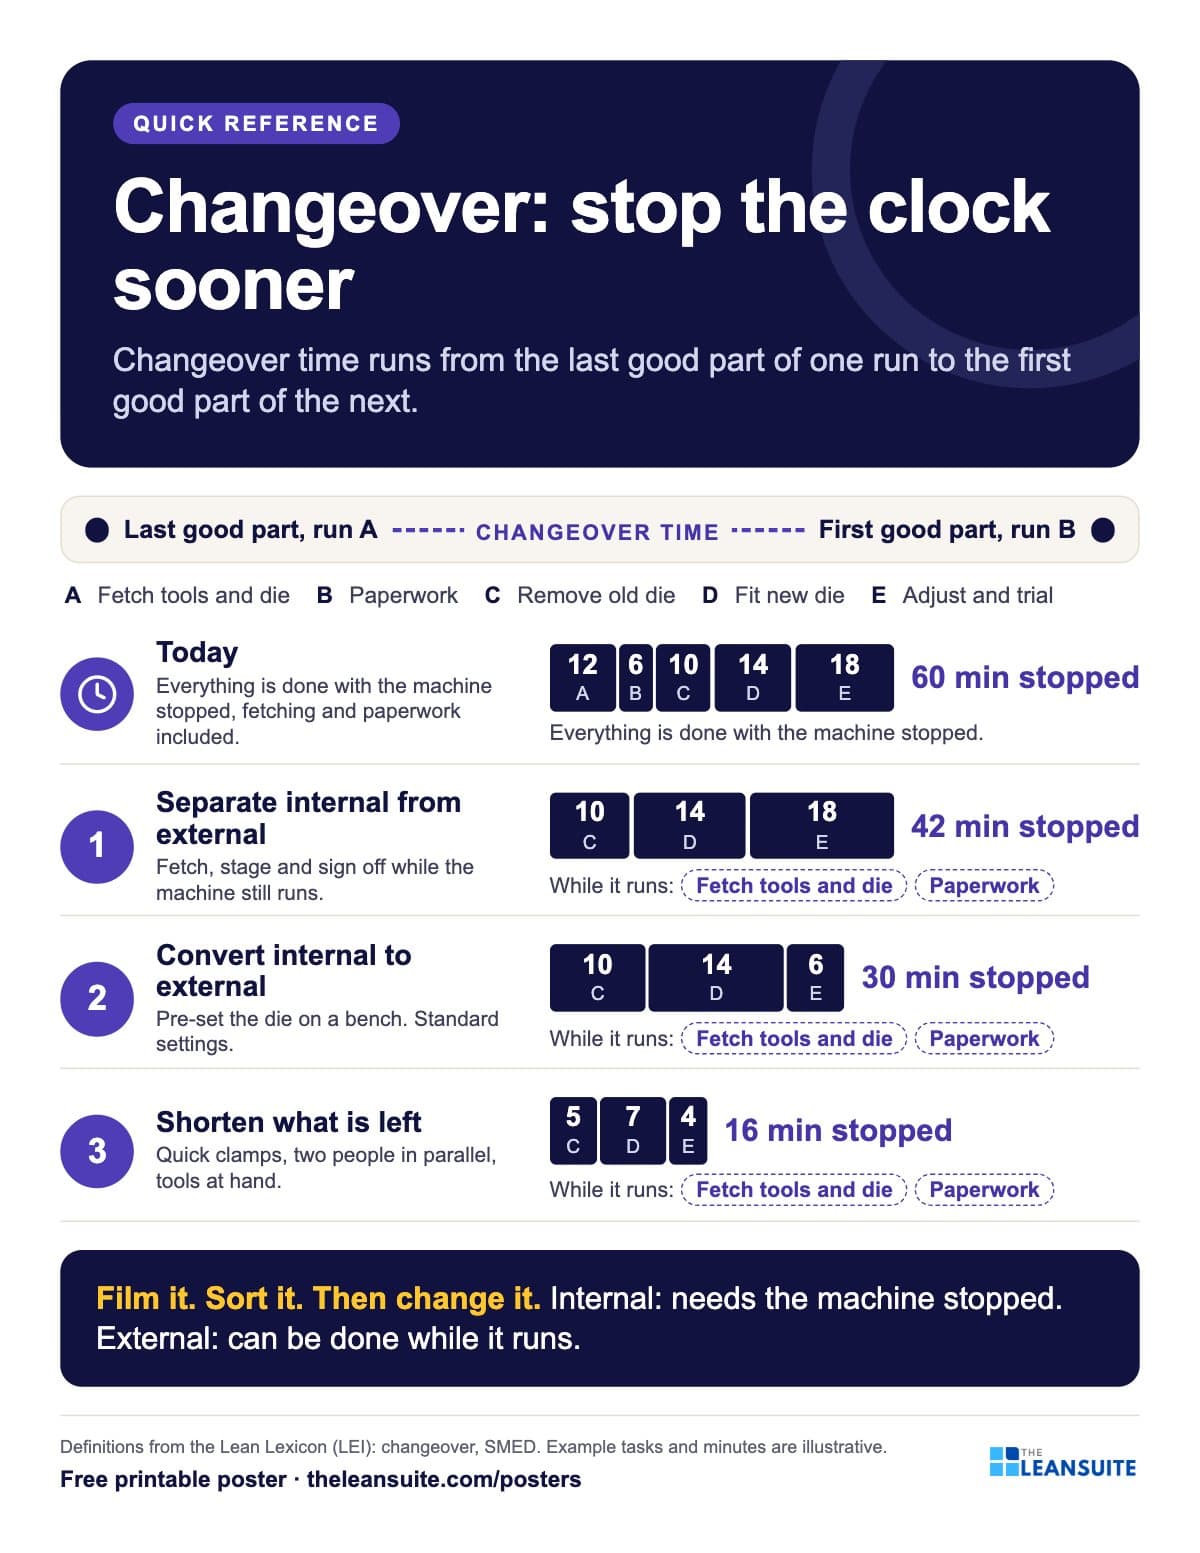
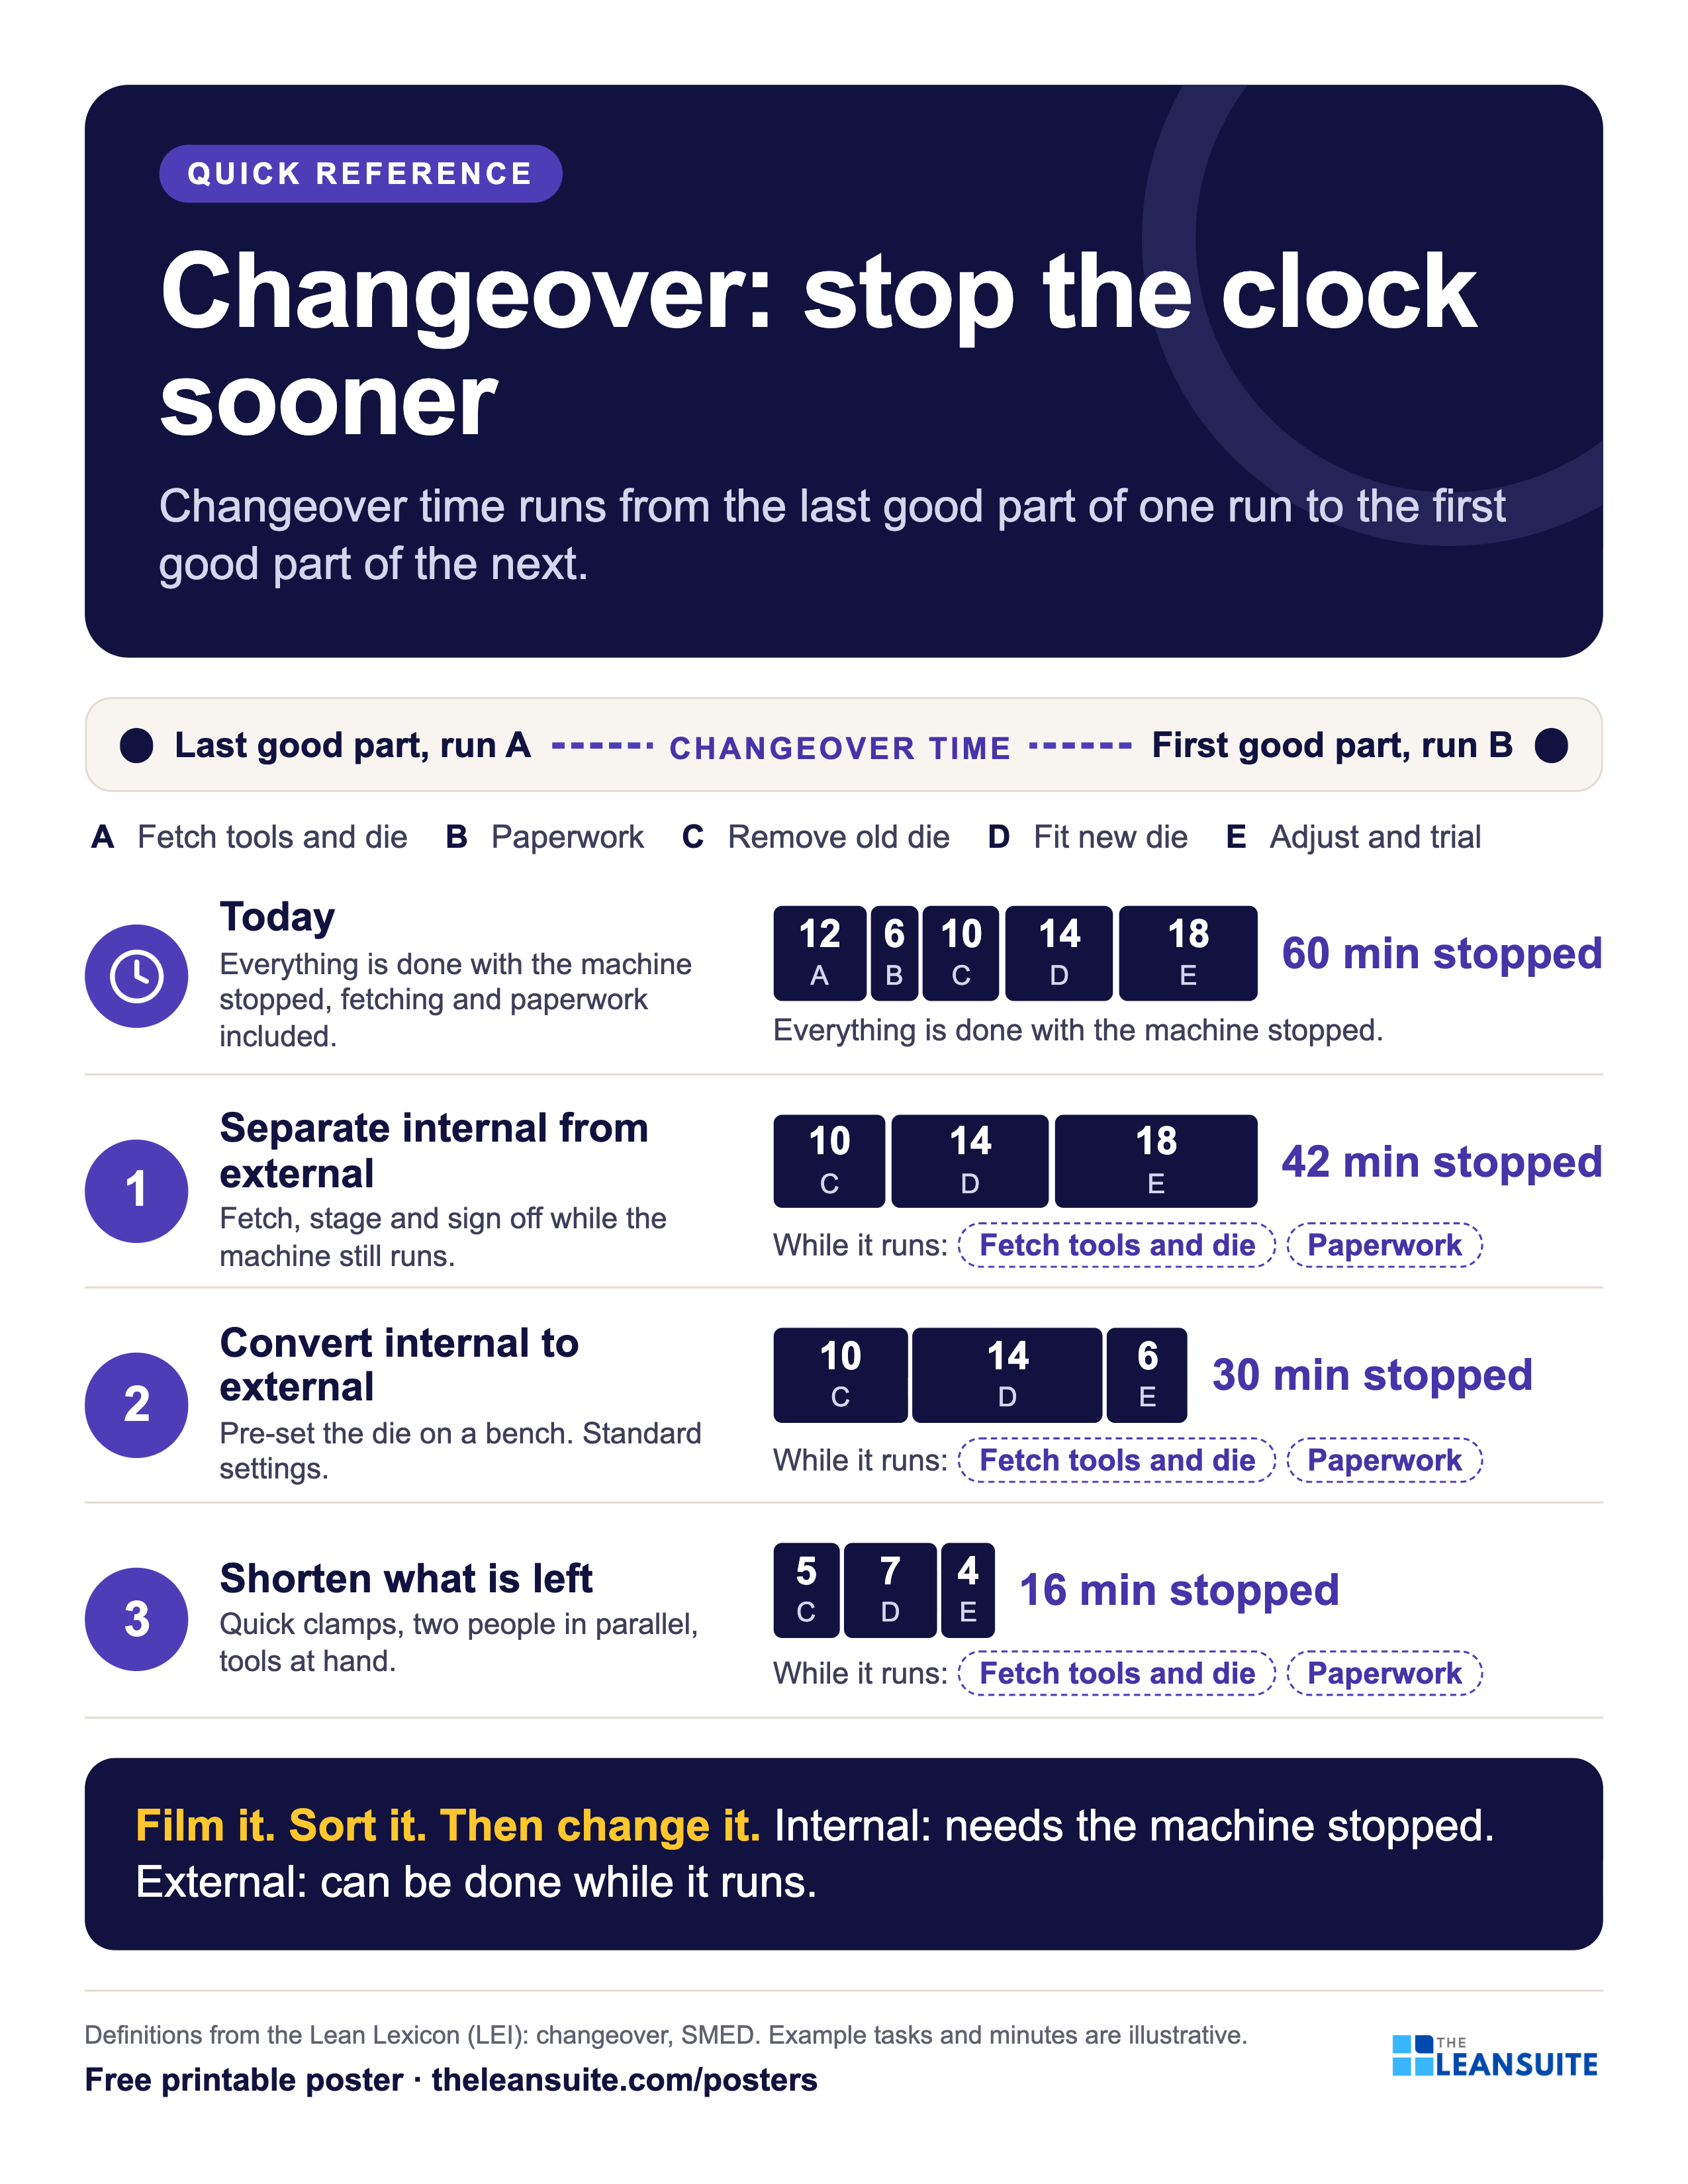
Poster 4 of 6, Letter preview. Definitions from the Lean Lexicon (LEI): changeover, SMED. Example tasks and minutes are illustrative. Changeover: stop the clock sooner
Changeover time runs from the last good part of one run to the first good part of the next, and single minute exchange of die (SMED) is the method for cutting it. Shigeo Shingo's insight was to separate internal work, which needs the machine stopped, from external work that can be done while it runs, then move work from internal to external, then shorten what remains. This poster shows one changeover worked through the three moves: five tasks, 60 stopped minutes, and the stopped time falling to 42, 30 and 16 minutes as each move is made.
On the poster
Shorten what is left: 16 min stopped
Quick clamps, two people in parallel, tools at hand. Remove old die 5, Fit new die 7, Adjust and trial 4; while running: fetch tools and die, paperwork.
Download this poster as PNG (300 dpi)2550 x 3300 px, prints at 8.5 x 11 in · 572 KB · no formThe poster's own page: how to use it, sources, related templatesFree to print and share with your team. Enter your name and work email once to download.
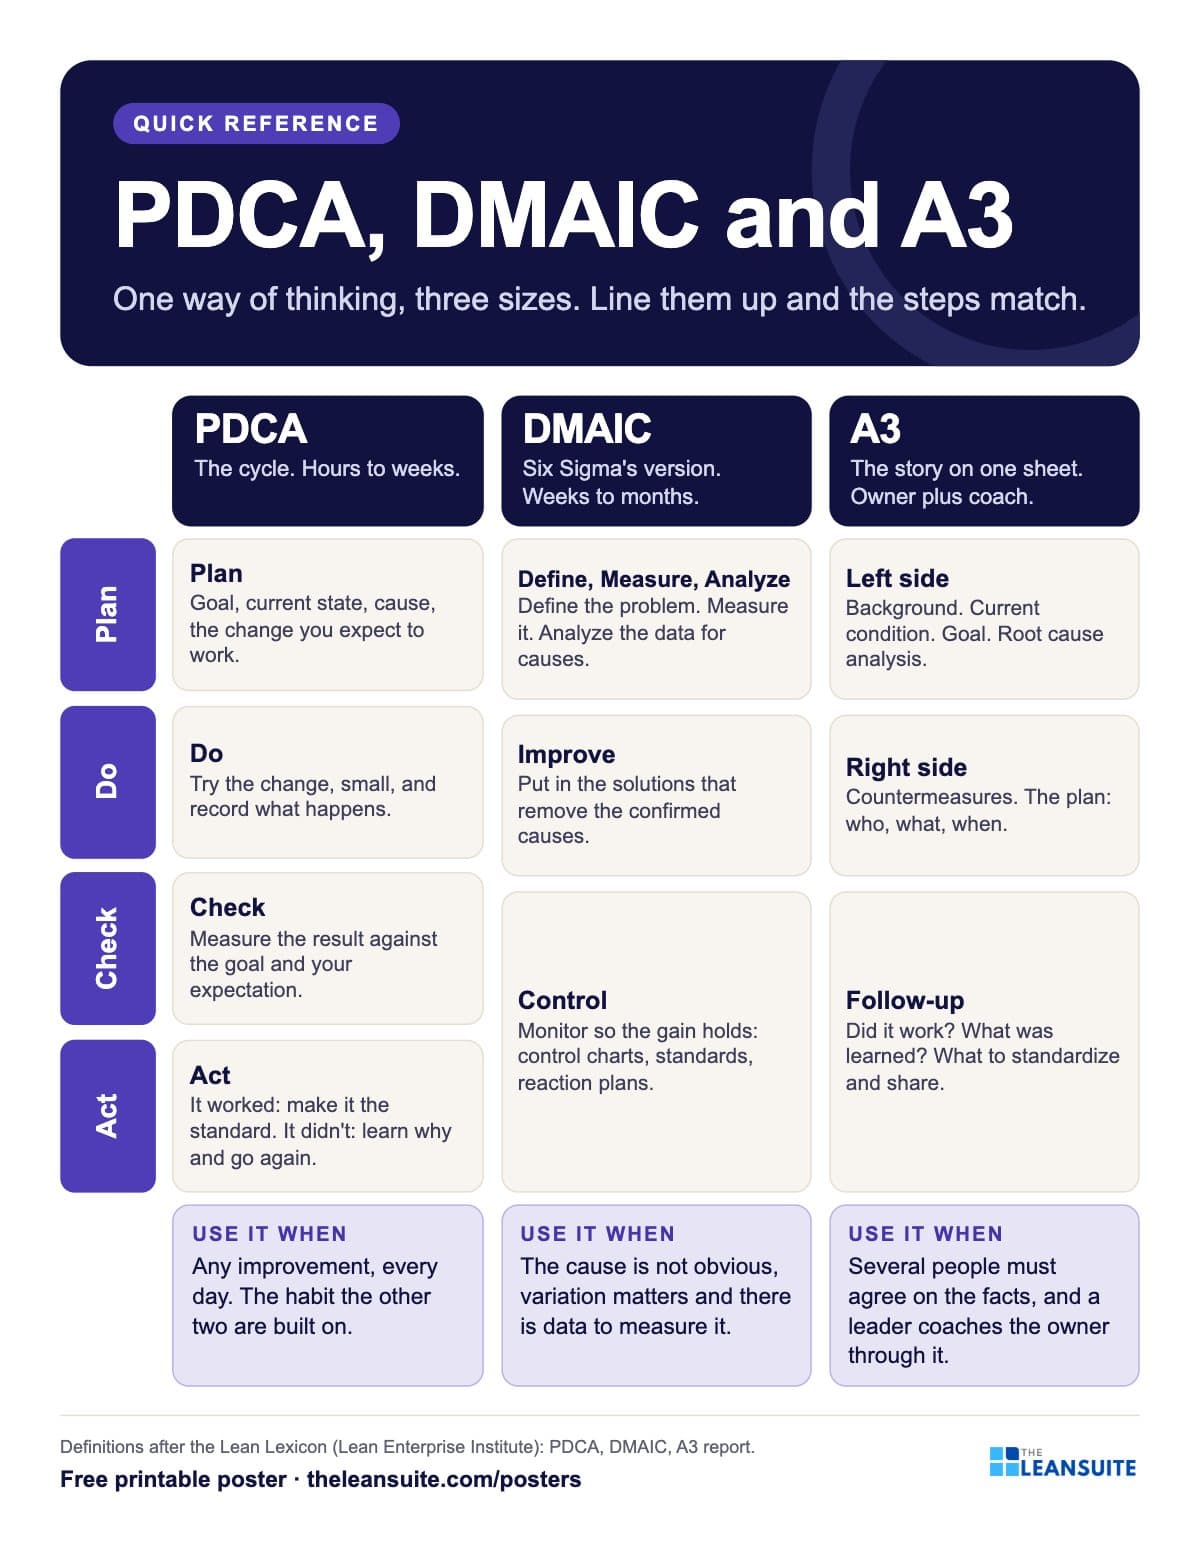
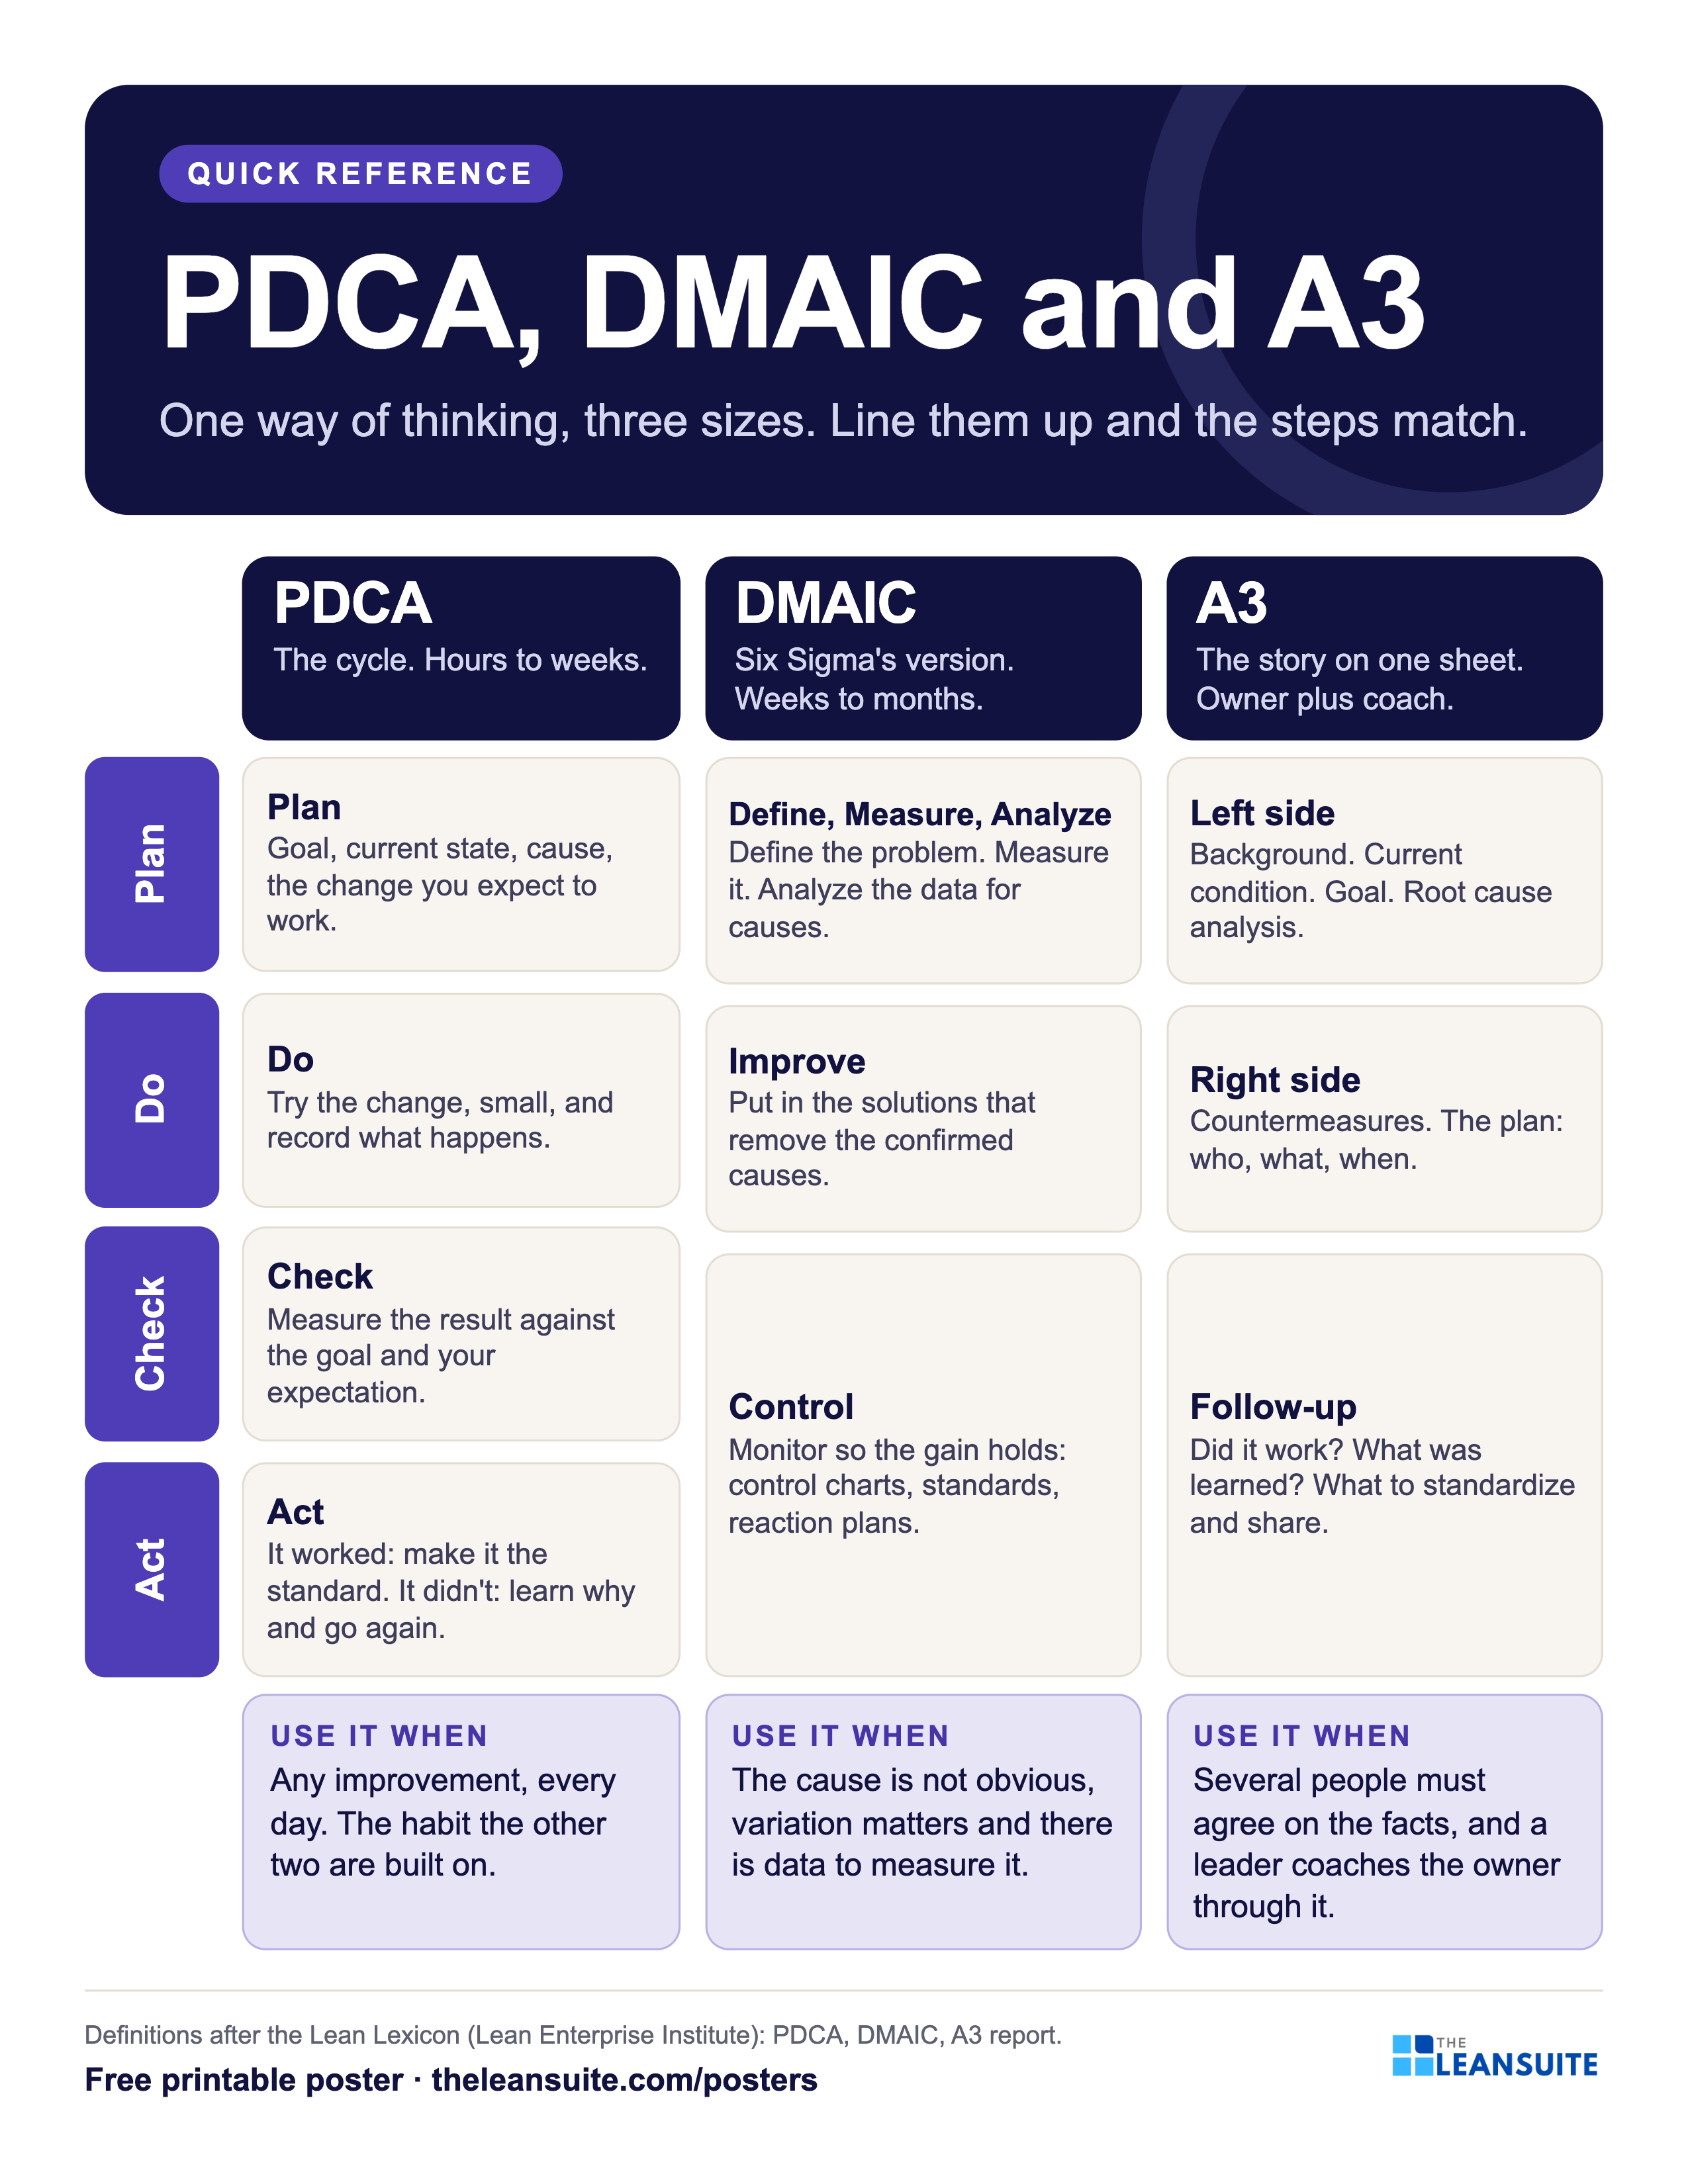
Poster 5 of 6, Letter preview. Definitions after the Lean Lexicon (Lean Enterprise Institute): PDCA, DMAIC, A3 report. PDCA, DMAIC and A3
PDCA, DMAIC and the A3 report are the same way of thinking at three sizes. PDCA is the four-step improvement cycle: plan a change, do it, check the result, act on what you learned. DMAIC is Six Sigma's five-phase version for problems that hide in data and variation. The A3 report puts the whole story of one problem on one sheet so that several people can agree on the facts and a leader can coach the owner. This poster lines the three up step by step and gives a plain rule for when each fits, so a team stops running a six-month project on a one-hour fix.
On the poster
Use it when
PDCA: Any improvement, every day. The habit the other two are built on. DMAIC: The cause is not obvious, variation matters and there is data to measure it. A3: Several people must agree on the facts, and a leader coaches the owner through it.
Download this poster as PNG (300 dpi)2550 x 3300 px, prints at 8.5 x 11 in · 559 KB · no formThe poster's own page: how to use it, sources, related templatesFree to print and share with your team. Enter your name and work email once to download.
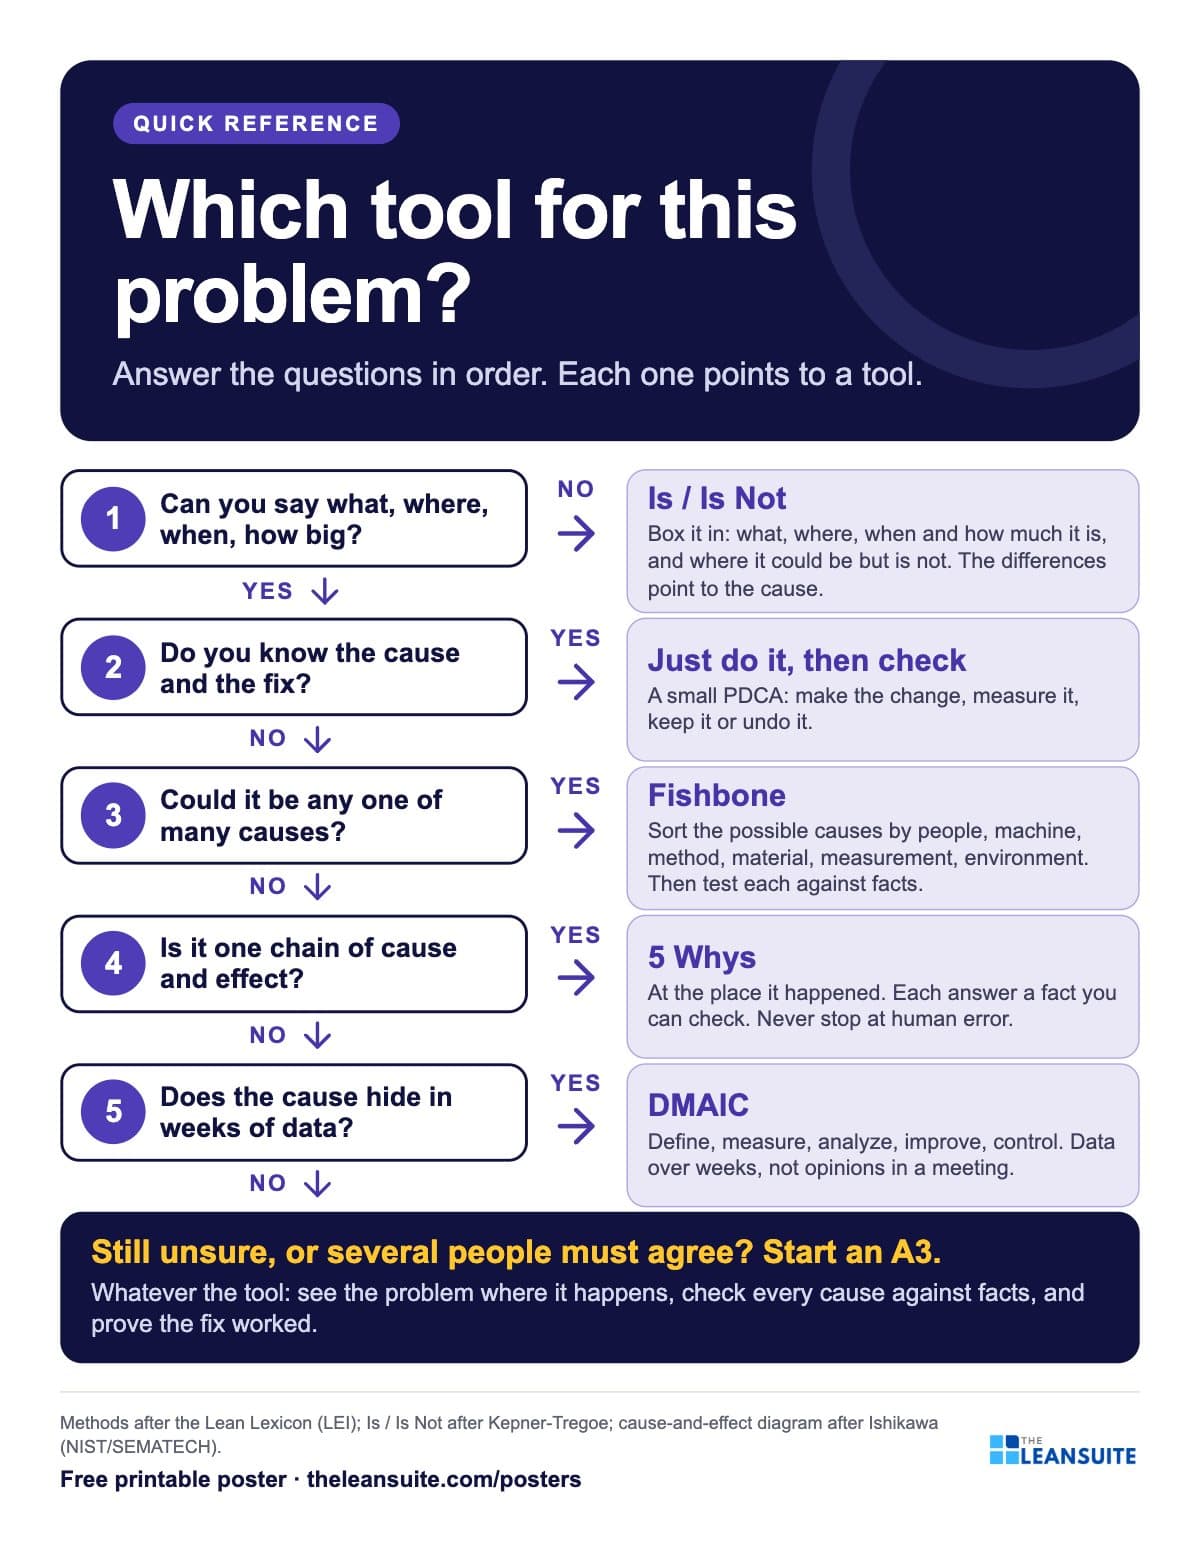
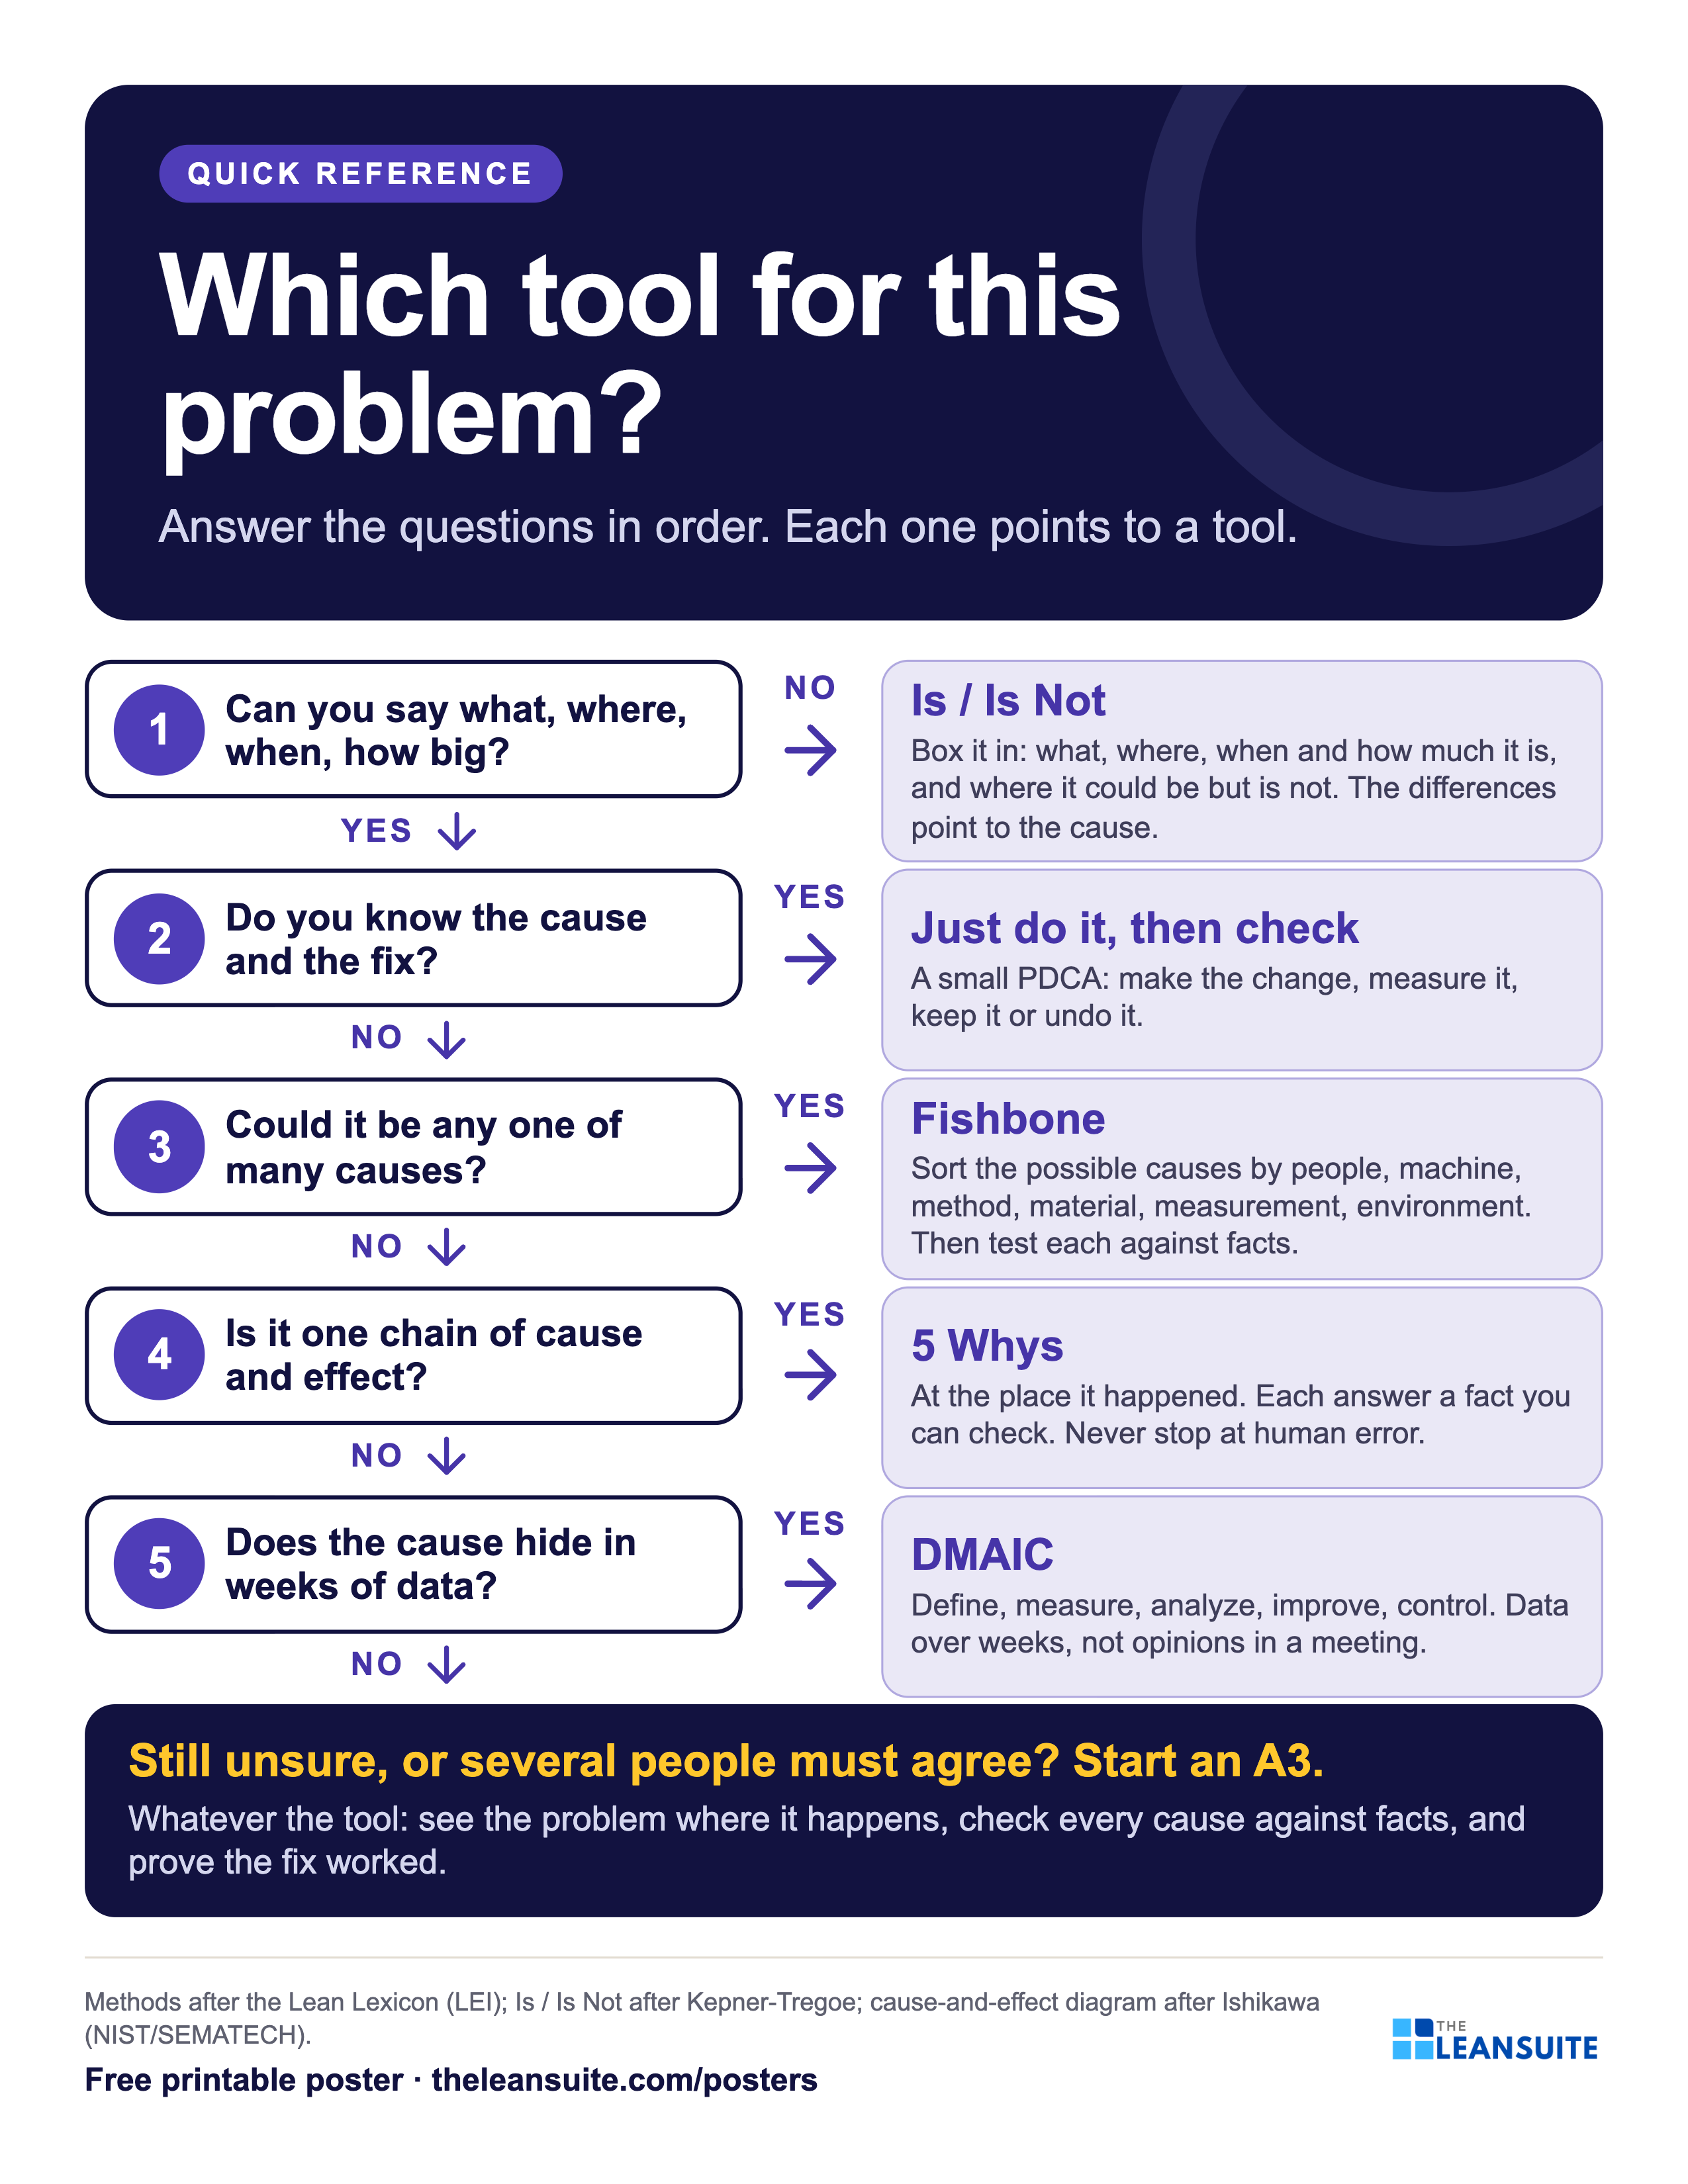
Poster 6 of 6, Letter preview. Methods after the Lean Lexicon (LEI); Is / Is Not after Kepner-Tregoe; cause-and-effect diagram after Ishikawa (NIST/SEMATECH). Which tool for this problem?
Most problem-solving tools fail because they were the wrong size for the problem: a 5 Whys on a variation problem with several causes guesses, and a DMAIC project on an obvious fix wastes months. This poster is a path of five questions a team answers in order: is the problem described, is the cause known, could it be any of many causes, is it one chain of cause and effect, does the cause hide in data. Each answer points to one tool, from Is/Is Not and fishbone to 5 Whys, DMAIC and the A3, with one line on what that tool does.
On the poster
Still unsure, or several people must agree? Start an A3.
Whatever the tool: see the problem where it happens, check every cause against facts, and prove the fix worked.
Download this poster as PNG (300 dpi)2550 x 3300 px, prints at 8.5 x 11 in · 581 KB · no formThe poster's own page: how to use it, sources, related templatesFree to print and share with your team. Enter your name and work email once to download.
On the floor
How to use the pack
- 1
Print the pack at A3 for the team board and at Letter or A4 for binders and handouts. The larger sizes are on each poster's own page.
- 2
Start the daily meeting at one poster: which of the six losses took the most minutes yesterday, which station is over takt, how many parts are waiting.
- 3
Use the worked shift to teach the arithmetic once, then let people check their own numbers against it.
- 4
Pick the problem-solving tool from the path poster before anyone opens a template.
Printing
- A3: 297 x 420 mm, also fits 11 x 17 in.
- Letter: 8.5 x 11 in, any office printer.
- A4: 210 x 297 mm, any office printer.
- Vector PDF, no bleed needed, reads in black and white. Larger sizes (A2, 18 x 24 in, 24 x 36 in) are on each poster's page.
How it was checked
Wording from the Lean Lexicon, numbers worked in code
Takt time is available production time divided by customer demand. Cycle time is the time to complete one part at one step, as timed. Lead time is the time one piece takes through the whole process. Changeover time runs from the last good part of one run to the first good part of the next. Those are the Lean Enterprise Institute's definitions, and the posters keep to them. Every figure on a poster is calculated from its inputs when the poster is built, and a test checks the arithmetic: the six losses add up to planned time less fully productive time, the station over takt sets the output, WIP divided by throughput gives the days.
Sources
- Seiichi Nakajima, Introduction to TPM: Total Productive Maintenance (Productivity Press, 1988): the six big losses.
- Lean Enterprise Institute, Lean Lexicon: overall equipment effectiveness.
- OEE.com (Vorne): calculating OEE, and the six big losses.
- Lean Enterprise Institute, Lean Lexicon: takt time.
- Lean Lexicon: cycle time, with production lead time and value-creating time.
- J. D. C. Little, A proof for the queuing formula: L = λW. Operations Research 9(3), 1961, pp. 383-387.
- J. D. C. Little, Little's Law as viewed on its 50th anniversary. Operations Research 59(3), 2011, pp. 536-549.
- Lean Enterprise Institute, Lean Lexicon: changeover.
- Lean Lexicon: single minute exchange of die.
- Lean Enterprise Institute, Lean Lexicon: plan, do, check, act (PDCA).
- Lean Lexicon: DMAIC.
- Lean Lexicon: A3 report.
- Lean Enterprise Institute, Lean Lexicon: PDCA, DMAIC and A3 report (see the PDCA, DMAIC and A3 poster).
- Kepner-Tregoe: Is / Is Not, the four dimensions (what, where, when, extent) and distinctions.
- NIST/SEMATECH e-Handbook of Statistical Methods, glossary: cause-effect (Ishikawa, fish-bone) diagram.
Templates and tools that go with the pack
All free posters- Six big losses worksheetThe same shift in Excel: every loss in minutes, ranked, with A, P, Q and OEE.
- OEE calculatorYour own shift: planned time, stops, counts, and the three factors.
- Takt time calculatorAvailable time and demand in, takt out, with the stations against it.
- Cycle time, throughput time and lead timeOne part worked through, waiting included.
- Process improvement method selectorEight questions about one problem and the method that fits.
- SMED changeover worksheetSort every task into internal or external and time the stop.
FAQs
About the pack
No. Each poster carries one worked example with illustrative figures, so the arithmetic can be followed from input to answer. The formulas and definitions follow the Lean Lexicon (Lean Enterprise Institute) and the other sources named on each poster; the figures are there to show the method, not to benchmark your plant.
Yes. The fills differ in lightness as well as colour, so bars, chunks and bands still read on a mono printer. The PDFs are vector, so text stays sharp at any size, and nothing runs to the edge of the page.
Yes. Each poster below has its own page with a free 300 dpi PNG that needs no form, and print PDFs from Letter up to 24 x 36 in behind the same short form as the pack. The form is asked once per browser.
A poster reminds. A routine makes it stick.
See how plants run their audits, improvements and follow-ups in LeanSuite, on a call built around your own problem.
Book a 45-minute demo