




Process capability, most commonly expressed through the Cp and Cpk indices, is the numeric measure of whether a process is genuinely capable of consistently producing output within the customer's actual specification limits, distinct entirely from whether it's merely statistically stable. A process can be perfectly "in control," showing only common-cause variation as covered in statistical process control, and still be incapable of reliably meeting specification, because control and capability answer two genuinely different questions. This blog closes out the cluster by covering exactly what Cp and Cpk actually measure, how each one is calculated, and why the difference between them matters so enormously in day-to-day practice.
The Question Cp and Cpk Are Built to Answer
Cp and Cpk both compare a process's natural variation, its spread, against the width of the customer's specification limits, but each answers a genuinely different version of the underlying question being asked. Cp asks: if this process were perfectly centered between the upper and lower specification limits, would its natural spread fit comfortably within them? Cpk asks the more practically important question: given where this process is actually centered right now, not hypothetically, how much of its spread actually falls within specification?
Key Insight: Cp measures potential capability assuming perfect centering. Cpk measures actual capability given the process's real, current position. A process can have an excellent Cp and a poor Cpk simultaneously, and that gap is usually the single most useful diagnostic signal these two numbers provide together.
How Cp Is Calculated and What It Means
Cp is calculated as the width of the customer's specification range divided by the width of the process's natural spread, typically defined precisely as six standard deviations of the process. A Cp of 1.0 means the process's natural spread exactly matches the specification width, leaving no margin for the process to drift even slightly off-center without producing out-of-specification parts. A Cp of 2.0 means the process's natural spread is only half as wide as the specification range, leaving considerable margin.
Because Cp only compares spread to specification width, it says nothing about where the process is actually centered. A process could have an excellent Cp of 2.0 and still be producing entirely out-of-specification output if it's badly off-center, which is exactly the blind spot Cpk exists to close.
Key Insight: Cp only measures spread against specification width; a high Cp says nothing about centering, so it can mask a process producing out-of-specification parts.
How Cpk Is Calculated and What It Means
Cpk accounts for centering by calculating capability separately toward both the upper and lower specification limits and then reporting the smaller, more restrictive of the two resulting values. This means Cpk captures both how tightly the process varies and how close its current average sits to whichever specification limit it's nearer to. A process perfectly centered between its limits will have Cp and Cpk values that are equal; any off-centering pulls Cpk below Cp, and the size of that gap quantifies how much centering, rather than spread, is limiting the process's actual real-world capability.
A commonly cited benchmark is a minimum Cpk of 1.33, though the specific threshold considered genuinely acceptable varies considerably by industry, part criticality, and customer requirements, with safety-critical automotive or aerospace applications often requiring considerably higher values than typical general manufacturing.
Key Insight: Cpk reports the more restrictive of the two specification-limit calculations, so it's the number that actually reflects the process's real-world capability, not just its theoretical potential.
Why the Gap Between Cp and Cpk Matters
The relationship between a process's Cp and Cpk values is diagnostically useful on its own, independent of either number's absolute value, because the gap between them points toward a specific type of corrective action:
- Cp and Cpk close together, both low. The process's natural spread is too wide relative to specification, regardless of centering. This calls for a variation-reduction effort, the kind of work covered in statistical process control and control charts, addressing the sources of common-cause variation itself.
- Cp and Cpk close together, both acceptable. The process is both tight enough and well-centered; little corrective action is needed beyond ongoing monitoring.
- A large gap, with Cp acceptable but Cpk poor. The process has enough inherent precision to meet specification but is currently off-center. This calls for a simpler, often faster fix: recentering the process, adjusting a setpoint or target, rather than the harder work of reducing variation itself.
Vertical axis: Cp, from Poor at the bottom to Acceptable at the top. Horizontal axis: Cpk, from Poor on the left to Acceptable on the right.
- Top left (Acceptable Cp, Poor Cpk):
Off-center
Recenter: adjust the setpoint or target. Usually cheaper and faster.
- Top right (Acceptable Cp, Acceptable Cpk):
Tight and centered
Little to do beyond ongoing monitoring.
- Bottom left (Poor Cp, Poor Cpk):
Spread too wide
Reduce variation at its sources.
- Bottom right (Poor Cp, Acceptable Cpk):
Cannot happen
Cpk never exceeds Cp.
This distinction has real practical value, since recentering a process is typically far cheaper and faster than reducing its underlying variation, and a team that misdiagnoses a centering problem as a variation problem can spend considerable effort on the wrong fix.
Key Insight: The Cp-Cpk gap itself is diagnostic; reading the two numbers together points to whether the real fix is recentering or the harder work of reducing variation.
Prerequisites Before Calculating Capability
A capability study only produces a genuinely meaningful number when a handful of prerequisites are actually met in full, and skipping any of them produces a Cp or Cpk value that looks precise but doesn't reflect reality:
- The process must be statistically stable, confirmed through the control chart methods covered in control charts, since capability indices calculated from an unstable process, one still showing special-cause variation, don't represent a meaningful, repeatable state.
- The measurement system must be validated, the same requirement covered in DMAIC's Measure phase, since capability calculated from unreliable data inherits that unreliability directly into the final index.
- Enough data must be collected to represent the process's true variation, rather than calculating capability from too small or too narrow a sample that happens to look tighter than the process's genuine long-term behavior.
- The data should reasonably approximate a normal distribution, since the standard Cp and Cpk formulas assume this; a process with a genuinely non-normal distribution needs an adapted calculation method to avoid a misleading result.
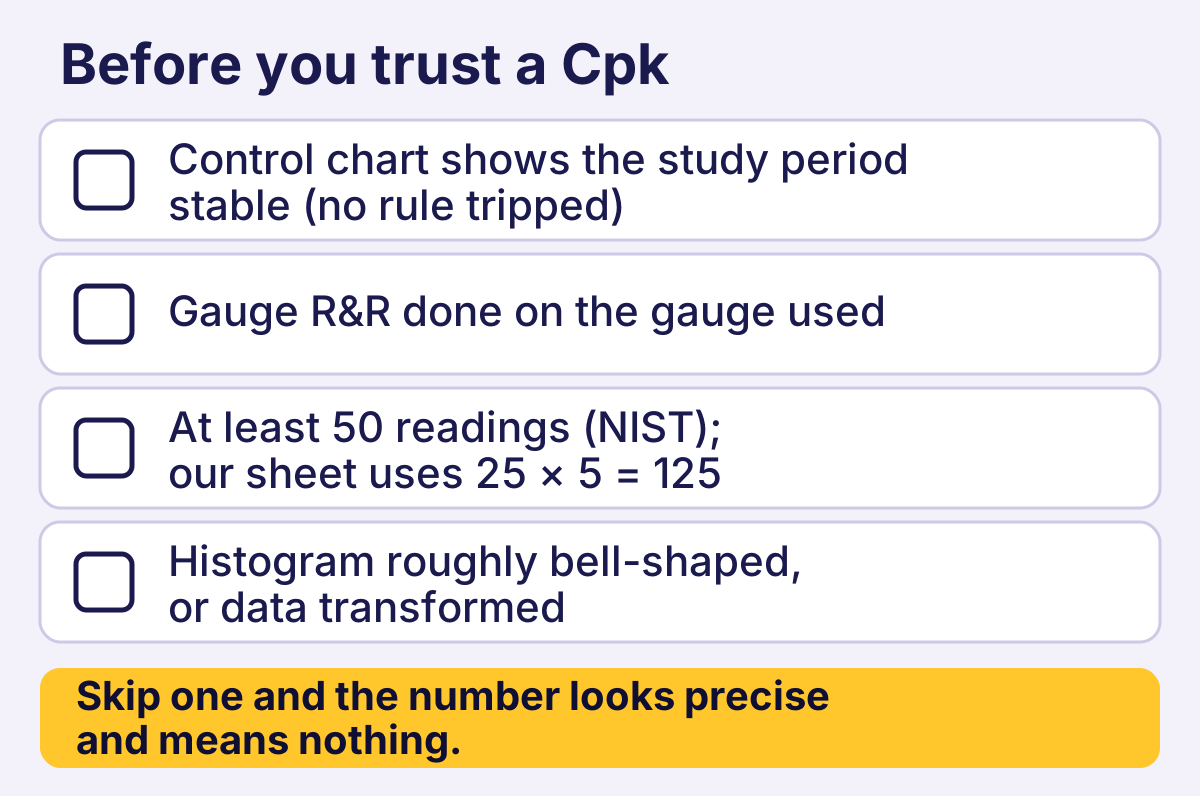
Text version of this figure
A card titled Before you trust a Cpk with four unticked boxes. 1: Control chart shows the study period stable (no rule tripped). 2: Gauge R&R done on the gauge used. 3: At least 50 readings (NIST); our sheet uses 25 × 5 = 125. 4: Histogram roughly bell-shaped, or data transformed. Footer, in gold: Skip one and the number looks precise and means nothing.
Good to Know: A capability study run on a process that hasn't yet been confirmed stable through a control chart isn't technically invalid, but the resulting Cp or Cpk number describes a moving target rather than a genuine, repeatable capability. This is why control charts and this blog are sequenced together in this cluster: confirming stability comes first, and capability is calculated only once that stability is established.
Key Insight: A capability number that skips its prerequisites, stability, validated measurement, enough data, a normal distribution, looks precise but describes a moving target rather than a genuine, repeatable state.
Common Misunderstandings About Process Capability
A handful of recurring, well-documented misunderstandings lead teams to draw the wrong overall conclusion from an otherwise correctly run capability study:
- Treating a high Cp alone as proof the process is fine. Without checking Cpk, a high Cp can mask a serious off-centering problem that's already producing defective parts.
- Assuming capability, once measured, stays valid indefinitely. A process's capability can degrade over time as tooling wears or materials shift, which is why capability is typically reassessed periodically or after any significant process change, not calculated once and never revisited.
- Confusing process capability with process performance indices (Pp and Ppk). Pp and Ppk are calculated similarly but use overall variation rather than the within-subgroup variation Cp and Cpk use, capturing long-term performance including shifts and drifts that short-term capability indices exclude by design.
- Chasing a higher Cpk number without regard to cost. Beyond a certain point, further reducing variation or improving centering carries diminishing returns relative to the cost involved, and a process that comfortably exceeds the customer's actual requirement doesn't necessarily need continued investment purely to raise the index further.
Key Insight: A high Cp checked without Cpk, or a capability number never reassessed after it's first measured, are two versions of the same mistake: trusting a single number without confirming what it actually still reflects.
A Worked Example
Consider a process cutting a shaft to a target length with a specification of 100 millimeters plus or minus 0.3 millimeters, giving a total specification width of 0.6 millimeters. Baseline data, collected after confirming the process is statistically stable, shows a standard deviation of 0.05 millimeters.
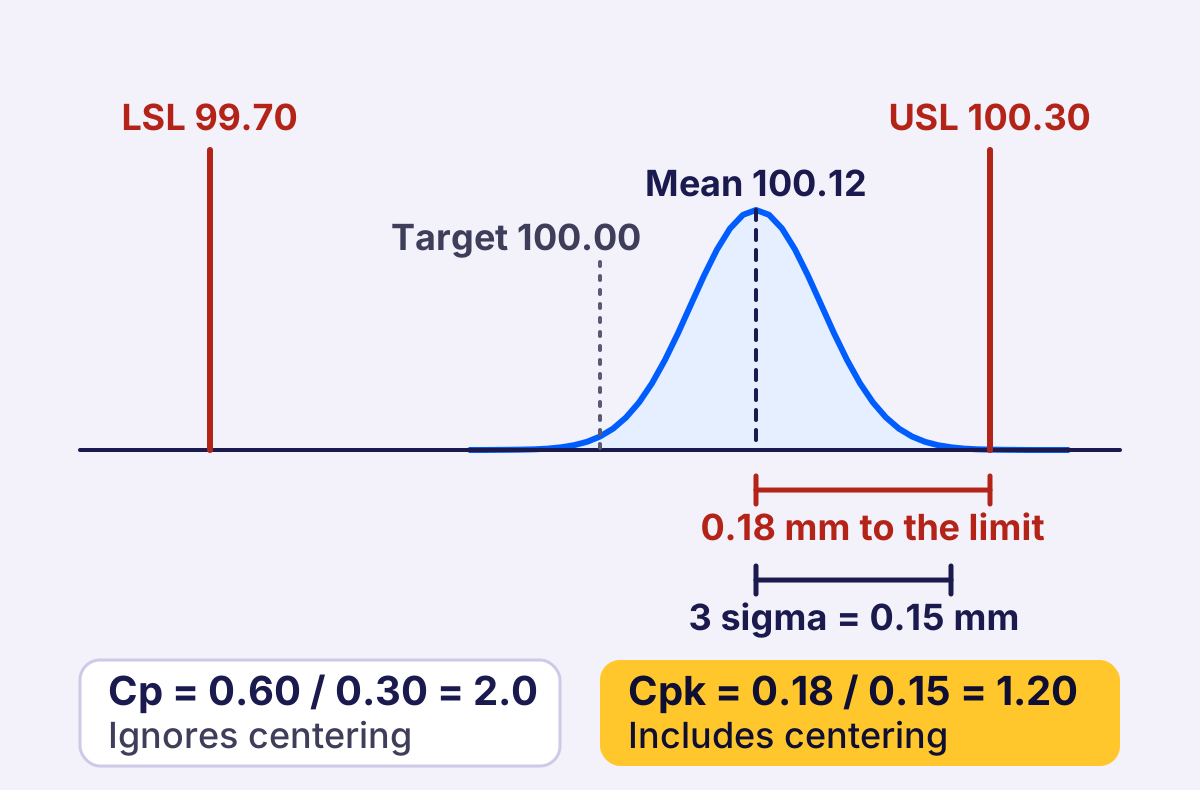
Text version of this figure
A bell curve for a process with sigma 0.05 mm sits between a lower spec limit, LSL 99.70, and an upper spec limit, USL 100.30. A dotted line marks Target 100.00, the centre of the tolerance. The mean is 100.12, so the curve is off center toward the upper limit. A bracket marks 0.18 mm to the limit, from the mean to USL 100.30, and a shorter bracket marks 3 sigma = 0.15 mm. Cp = 0.60 / 0.30 = 2.0 and ignores centering. Cpk = 0.18 / 0.15 = 1.20 and includes centering.
- Calculating Cp: the natural spread, six standard deviations, equals 0.30 millimeters. Dividing the specification width of 0.6 by this natural spread of 0.30 gives a Cp of 2.0, suggesting excellent potential capability if the process were perfectly centered.
- Checking the actual centering: the process average turns out to be running at 100.12 millimeters, not the target of 100.00, meaning it's sitting closer to the upper specification limit of 100.3 than to the center.
- Calculating Cpk: accounting for this off-centering, the distance from the process average to the nearer specification limit, 100.3, is 0.18 millimeters. Three standard deviations is 0.15 millimeters, so Cpk = 0.18 / 0.15 = 1.20. That is well below the Cp of 2.0, revealing that despite excellent potential capability, the process's actual real-world capability is meaningfully weaker because of where it's currently centered.
The corrective action this example points toward is straightforward and comparatively cheap: recenter the process closer to the 100.00 millimeter target, which should bring Cpk much closer to the Cp of 2.0 without requiring any reduction in the process's underlying variation at all. This is exactly the kind of diagnostic value the Cp-Cpk gap provides, and why capability studies report both numbers together rather than either one alone.
Key Insight: A large Cp-Cpk gap points toward a cheap fix, recentering, rather than the more expensive work of reducing variation; reading the two numbers together reveals which problem actually needs solving.
Conducting a Capability Study Step by Step
Running a proper capability study follows a defined sequence, building on the prerequisites covered above rather than skipping straight to a calculation:
- Confirm process stability first, using the control chart methods from the prior blog in this cluster, since a capability number calculated from an unstable process describes a moving target rather than a genuine, repeatable state.
- Collect a sufficient sample, typically at least twenty-five to thirty subgroups or, depending on the methodology used, at least one hundred individual data points, to represent the process's true long-term variation rather than a narrow snapshot.
- Check the distribution shape, confirming the data reasonably approximates a normal distribution before applying the standard Cp and Cpk formulas, since a skewed or otherwise non-normal distribution can produce a misleading result under the standard calculation.
- Calculate both Cp and Cpk, not Cpk alone, since the gap between the two is itself diagnostically meaningful, as the worked example above illustrates.
- Document the specification limits used, confirming they reflect the customer's actual current requirement rather than an outdated or informally remembered value, since capability calculated against the wrong specification produces a number that answers the wrong question entirely.
- 1
Confirm process stability
Use control charts first: an unstable process gives a moving target - 2
Collect a sufficient sample
Typically at least twenty-five to thirty subgroups, or at least one hundred individual points - 3
Check the distribution shape
Roughly normal before applying the standard formulas - 4
Calculate both Cp and Cpk
Not Cpk alone: the gap between them is diagnostic - 5
Document the specification limits
The customer's actual current requirement, not an outdated or remembered value
Key Insight: Skipping straight to a Cp/Cpk calculation without confirming stability, sample size, and distribution shape first is what turns a legitimate statistical tool into a misleading number.
Capability's Place Within the Broader Improvement Cycle
Process capability analysis typically appears at more than one point across a DMAIC project, each with a slightly different purpose. During Measure, an initial capability calculation establishes the baseline, quantifying numerically how far the current process sits from meeting the customer's requirement before any improvement work begins. During Improve, capability is recalculated after a proposed fix has been piloted, providing statistical confirmation that the change actually moved the process closer to, or past, an acceptable capability threshold rather than relying on a subjective sense that things "look better."
During Control, periodic capability checks, alongside the ongoing control chart monitoring covered in the previous blog, confirm the improvement is holding over time rather than eroding back toward its prior, less capable state. This makes capability analysis a recurring checkpoint across a project's life, not a single calculation performed once at the very beginning and forgotten.
Key Insight: Capability isn't a single number calculated at project kickoff; it's recalculated at Measure, Improve, and Control, each time answering a different question about the process's current state.
- 1Measure
Set the baseline
How far the process sits from the customer's requirement before any work. - 2Improve
Confirm the fix
Recalculate after piloting a fix, instead of judging by feel. - 3Control
Check it holds
Periodic checks, alongside control charts, show whether the gain is eroding.
Within the Lean System
Connection to Lean Principles
Process capability puts a number on whether "good enough consistency" is actually good enough for the customer, tying statistical performance directly back to the voice of the customer rather than treating stability as valuable on its own terms.
Connection to Lean Tools
Capability analysis depends on the stability confirmed by statistical process control and control charts, and closes out the toolset this cluster built up from Lean Six Sigma through DMAIC: capability is typically the final check in Improve and the ongoing metric tracked in Control.
Connection to Continuous Improvement
A capability study isn't a one-time report; recalculating Cp and Cpk after every significant change is what confirms an improvement actually held, closing the loop that DMAIC's Control phase depends on.
Frequently Asked Questions
What's considered a good Cpk value?
A Cpk of 1.33 is a commonly cited general benchmark, though requirements vary considerably by industry and part criticality. Safety-critical applications often require 1.67 or higher, while general manufacturing contexts sometimes accept somewhat lower values by mutual agreement with the customer worked out well in advance.
Can Cpk be higher than Cp?
No, never. Cpk can equal Cp at best, when the process is perfectly centered, but can never exceed it, since any off-centering can only reduce capability relative to the theoretical maximum Cp represents under those ideal, fully centered manufacturing conditions alone, mathematically speaking every time.
How is process capability different from a control chart?
A control chart, covered in control charts, monitors whether a process is behaving consistently over time. Capability analysis asks a related but separate question, whether that consistent behavior actually falls within what the customer's own written specification actually requires of the finished part itself in practice.
How often should process capability be recalculated?
There's no single universal interval, but capability is typically reassessed periodically and always after any significant process change, tooling replacement, or material change, since any of these can meaningfully and quietly shift the process's own underlying variation or centering over time, unnoticed by nearly anyone.
What should a team do if Cpk is poor, but Cp is good?
This pattern typically points toward a centering problem rather than a variation problem, calling for a quick adjustment to the process's target or setpoint rather than the more involved, time-consuming work of reducing the underlying process variation itself entirely from scratch each and every single time.
Is a Cpk of exactly 1.0 acceptable?
A Cpk of 1.0 means the process's natural spread just fits within specification when centered at its current average, leaving essentially no margin for further drift. Most quality systems consider this the bare minimum, not a comfortable, sustainable target to actually aim for over time.
Does a low Cpk always mean defective parts are already being produced?
Not necessarily, no. A low Cpk indicates a higher statistical risk of producing out-of-specification parts, but it doesn't guarantee that any specific part sampled so far has actually already failed inspection out on the production line itself today, in the current operating reality just yet.
Free for this topic: 8D report template, Poka-yoke worksheet, First pass yield (FPY) calculator
Want our lean manufacturing guides first in Google? Add us as a preferred source.
Add LeanSuite as a preferred source on Google (opens in a new tab)


