



DMAIC is the five-phase structure that Six Sigma projects follow: Define, Measure, Analyze, Improve, Control. Each phase ends at a gate review, and the next phase does not start until the current one has produced what the next one needs: a measurable problem, a measurement system you trust, a verified root cause, a tested fix, and a control plan someone owns.
This guide is for plant CI leaders and Green Belts. It gives the gate questions for each phase, the tool that produces each deliverable, the usual ways projects go wrong, and one weld-defect project taken from charter to control chart with the arithmetic shown. For a plain definition of the five phases, read the DMAIC process guide. This page is about running one.

Where DMAIC comes from
Six Sigma began at Motorola in 1986, introduced by engineer Bill Smith. Fellow Motorola engineer Mikel Harry is credited as a co-creator. DMAIC is the project cycle at the center of it. Sources differ on exactly when the five-phase wording was fixed, so treat any single date for the acronym itself with caution. What is not in dispute is that it grew out of Motorola's program, and that General Electric and other large manufacturers spread it through the 1990s.
DMAIC is also not tied to Six Sigma. It works as a frame for any improvement effort on an existing process that has measurable output, including Lean Six Sigma projects.
When DMAIC fits, and when something smaller or different does
Use DMAIC when the process exists, the problem repeats, the cause is not known, and the gain is worth weeks of measurement and analysis. Do not charter one for a problem you can name and fix in a week.
- DMAIC. Use it when: An existing process has a chronic, measurable problem and the cause is unknown. Notes: Data-heavy and slower. Led by a trained Green or Black Belt in most plants.
- DMADV. Use it when: You are designing a new product or process, or the existing one cannot reach the target even when optimized. Notes: Define, Measure, Analyze, Design, Verify. The first three phases match DMAIC.
- PDCA. Use it when: The problem is small, the likely cause is known, and you can test a change within days. Notes: Simple enough to run daily at every level. DMAIC teams often use PDCA to pilot the fix.
- A3. Use it when: One owner needs to work a problem and report it on a single page. Notes: A way of thinking and reporting. A DMAIC project can be summarized on an A3.
- 8D. Use it when: A customer complaint or escape needs containment first and a permanent fix after. Notes: D3 is interim containment, a step DMAIC does not have.
- Kaizen event. Use it when: The waste is visible and a team can change the process in a few days. Notes: No statistical study needed.
Sources for this table: Wikipedia on Six Sigma (DMADV phases and purpose), Wikipedia on 8D (D3 containment), Wikipedia on A3, and iSixSigma's PDCA versus DMAIC comparison. See the source list at the end.
The tools at each phase
Every deliverable has a standard tool. This is the short version; the phase sections below explain when to use each.
- 1Define
A measurable problem
Gate: can it be stated as a number with a baseline, a target and a date? - 2Measure
A measurement system you trust
Gate: do inspectors agree with each other and with a known standard? - 3Analyze
A verified root cause
Gate: for each cause kept, what data shows it moves the result? - 4Improve
A tested fix
Gate: does each solution trace to a verified cause? - 5Control
A control plan someone owns
Gate: who owns the chart, and what happens when a point goes out?
- Define. Deliverable: Signed scope and goal. Tools: DMAIC project charter, SIPOC, voice of the customer turned into CTQs (critical to quality requirements)
- Measure. Deliverable: Trusted data and a baseline. Tools: Process map, check sheet, measurement system analysis (gauge R&R for measured data, attribute agreement for pass/fail), baseline capability (Cp and Cpk or DPMO), Pareto chart
- Analyze. Deliverable: Verified root causes. Tools: Fishbone, 5 Whys, stratification, hypothesis tests, regression, control charts
- Improve. Deliverable: A tested fix. Tools: Brainstorming ranked by impact and effort, poka-yoke, design of experiments where inputs interact, FMEA, PDCA pilot.
- Control. Deliverable: A result that holds. Tools: Control plan, control chart, updated standard work, response plan.
The worked example: weld porosity on a bracket line
The figures below are illustrative. They are built to add up, they are not from a real plant, and they are here to show the arithmetic and the order of work.
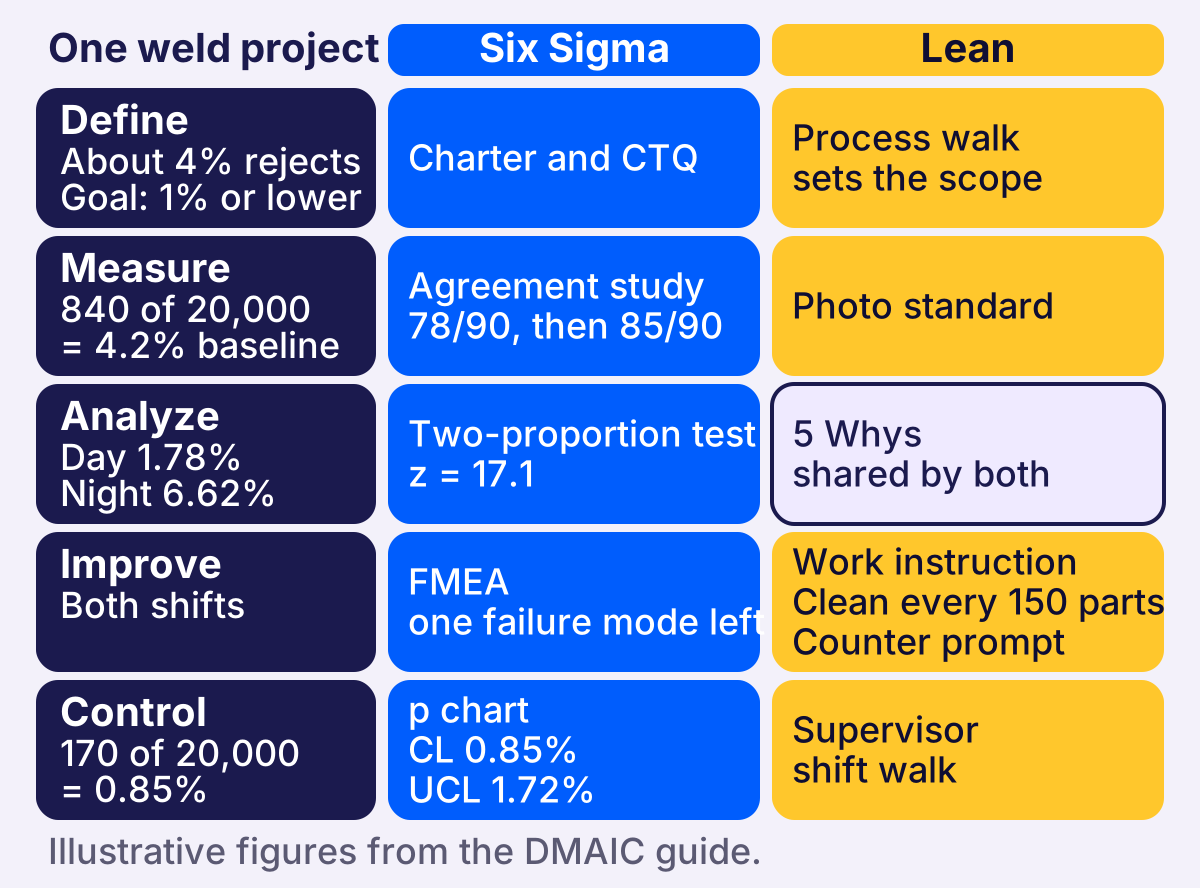
Text version of this figure
Left of the column heads: One weld project. Two column heads: Six Sigma in blue, Lean in gold. Five rows, one per DMAIC phase. Define: About 4% rejects, Goal: 1% or lower; Six Sigma, Charter and CTQ; Lean, Process walk sets the scope. Measure: 840 of 20,000 = 4.2% baseline; Six Sigma, Agreement study 78/90, then 85/90; Lean, Photo standard. Analyze: Day 1.78%, Night 6.62%; Six Sigma, Two-proportion test z = 17.1; 5 Whys, shared by both, drawn in lavender. Improve: Both shifts; Six Sigma, FMEA, one failure mode left; Lean, Work instruction, Clean every 150 parts, Counter prompt. Control: 170 of 20,000 = 0.85%; Six Sigma, p chart, CL 0.85%, UCL 1.72%; Lean, Supervisor shift walk. Footer: Illustrative figures from the DMAIC guide.
The situation. A bracket line welds a structural joint on a robotic cell. The rejection log suggests roughly 4 percent of brackets fail inspection for porosity. The cell runs two shifts and produces 1,000 brackets a day, 500 per shift. Each bracket has 5 inspected weld joints.
The timeline. The goal date was set after the baseline window was sized, which is the check that catches the mistake of promising a result sooner than the data can arrive.
- 1 to 2. Phase: Define. What happens: Charter signed, SIPOC, CTQ agreed.
- 3 to 7. Phase: Measure. What happens: Week 3: inspection agreement study and fix. Weeks 4 to 7: 20 working days of baseline.
- 8 to 10. Phase: Analyze. What happens: Stratify, test, find the cause.
- 11 to 14. Phase: Improve. What happens: FMEA, 2-week pilot on one shift (weeks 12 to 13), rollout to both shifts in week 14.
- 15 to 20. Phase: Control. What happens: Weeks 15 to 16: standard work, training, control chart. Weeks 17 to 20: 20 working days of verification, then handover.
Total: 20 weeks. The goal is a reject rate of 1.0 percent or lower by the end of week 20, measured over the last 20 working days.
Define
Purpose. Agree on a problem worth a project, in numbers, with one owner.
Deliverables. A signed charter (problem statement, goal, scope in and out, team, timeline, sponsor), a SIPOC, and the customer requirement translated into a CTQ.
Gate questions.
- Can the problem be stated as a number with a baseline, a target and a date?
- Is the scope small enough for one team to finish?
- Is there a named process owner, and has the sponsor signed?
- Which customer requirement does the metric protect?
- Is DMAIC the right tool, meaning the cause is unknown and the data can be collected?
In the weld project. Problem: first-pass porosity rejects on the example bracket line run at about 4 percent per the rejection log, which has not been validated yet. Goal: 1.0 percent or lower by week 20. In scope: the weld cell, its inspection, and its consumables. Out of scope: bracket design and the paint line. CTQ: no porosity in the structural weld, per the customer drawing.
Common mistakes.
- A goal with no baseline, such as "improve weld quality".
- A scope of "the whole plant".
- A target date earlier than the Measure phase can deliver data.
- No process owner, which leaves nobody to accept the result at the end.
Measure
Purpose. Trust the data first, then take the baseline.
Deliverables. A data collection plan (what is counted, how it is defined, who collects, how often, how many), a validated measurement system, a baseline in the same unit as the target, and a detailed process map.
Gate questions.
- Do inspectors agree with each other and with a known standard?
- Does the baseline cover normal variation, meaning shifts, material lots and operators?
- Was the process stable during the baseline?
- Is the baseline in the same unit as the goal?
Tools. For measured data, a gauge R&R study checks repeatability and reproducibility. For pass or fail judgments, an attribute agreement study does the same job. Then baseline capability. For measured characteristics, the capability indices from the NIST/SEMATECH handbook are:
- Cp = (USL - LSL) / 6 sigma
- Cpk = the smaller of (USL - mean) / 3 sigma and (mean - LSL) / 3 sigma
NIST notes these assume a stable, normally distributed process and a sample of about 50 values or more. For example, a weld leg length specified at 5.0 mm plus or minus 0.5 mm (LSL 4.5, USL 5.5) with a mean of 5.2 mm and a standard deviation of 0.1 mm gives Cp = 1.0 / 0.6 = 1.67 and Cpk = min(0.3 / 0.3, 0.7 / 0.3) = 1.00. Cp says the spread would fit the tolerance comfortably. Cpk says the process is off-center. For pass or fail data, use the defect rate and DPMO instead, as below. The process capability calculator checks the indices.
In the weld project. Week 3: an agreement study on 30 parts whose true status was settled by sectioning, judged twice by 3 inspectors, so 90 judgments. 78 matched the standard, which works out to 86.7 percent against the team's own bar of 90 percent. The misses clustered on borderline surface pores. The team wrote a limit-sample photo standard, retrained, and repeated the study: 85 of 90, which is 94.4 percent. Only then did the baseline start.
Baseline, weeks 4 to 7: 20 working days, 20,000 brackets inspected, 840 rejected, each with one porosity defect.
- Reject rate: 840 / 20,000 = 4.2 percent.
- Opportunities: 20,000 x 5 joints = 100,000.
- DPMO: 840 / 100,000 x 1,000,000 = 8,400.
- Yield per opportunity: 1 - 0.0084 = 99.16 percent.
- Sigma level: the z value for 0.9916 is 2.39, and with the conventional 1.5 shift added it is 3.89.
The target of 1.0 percent is 200 rejects in 20,000 brackets, a DPMO of 2,000 and a sigma level of 4.38 on the same convention. Use the DPMO and sigma level calculator to check any of these.
Common mistakes.
- Skipping the measurement study. If inspectors cannot agree on a part, the baseline measures the inspectors.
- Taking the baseline in a quiet week.
- Mixing up defects and defective units, which gives two different percentages for the same data.
- Quoting Cpk on a process that was not stable during the study.
Cp = (USL - LSL) ÷ 6σ Cpk = smaller of (USL - mean) ÷ 3σ and (mean - LSL) ÷ 3σ
- USL, LSL
- Upper and lower specification limits
- σ
- Standard deviation of the process
- Cp vs Cpk
- Cp says the spread fits the tolerance; Cpk says whether it is centered
Worked example
- Limits (5.0 mm ± 0.5 mm)
- LSL 4.5, USL 5.5
- Mean and standard deviation
- 5.2 mm and 0.1 mm
- Cp
- 1.0 ÷ 0.6 = 1.67
- Cpk
- smaller of 0.3 ÷ 0.3 = 1.00 and 0.7 ÷ 0.3 = 2.33
- Cpk
- 1.00
The post's example. NIST notes these assume a stable, normally distributed process and a sample of about 50 values or more.
Analyze
Purpose. Find the few causes that drive the problem, and prove each one with data.
Deliverables. A list of candidate causes, the ones verified with data, and the size of each one's contribution to the problem.
Gate questions.
- For each cause kept, what data shows it moves the result?
- What was ruled out, and on what evidence?
- Could two things be mixed up, such as shift and equipment age?
- Does the cause explain the pattern in the data, not only the average?
Tools. Stratify the data first (by shift, machine, lot, operator, time). Use a fishbone to list candidates, 5 Whys to follow one chain to a cause that can be acted on, and a hypothesis test to confirm a difference is not chance: a two-proportion test for rates, a t-test or ANOVA for means, a chi-square test for counts across categories, regression when the input is continuous. A control chart separates special-cause variation, which has an identifiable source, from common-cause variation built into the process. Capability indices do not make that distinction.
In the weld project. Stratify by shift, 10,000 brackets each. Day: 178 rejects, 1.78 percent. Night: 662 rejects, 6.62 percent. Together 840 of 20,000, which is the 4.2 percent baseline.
The two-proportion test in the NIST handbook uses the pooled rate p = 840 / 20,000 = 0.042. Standard error = square root of (0.042 x 0.958 x (1/10,000 + 1/10,000)) = 0.00284. z = (0.0662 - 0.0178) / 0.00284 = 17.1. A z beyond 1.96 is significant at the 5 percent level, so the gap is not chance.
Shift is a label, not a cause. The fishbone, built with operators from both shifts, produced about 20 candidates. The team ran a 5 Whys on the one the cell data pointed to:
- Why porosity? Shielding gas coverage breaks at the weld.
- Why? Spatter builds up in the nozzle and restricts the gas flow.
- Why does it build up? The nozzle is cleaned once per shift on nights.
- Why? The cleaning step is in the day crew's break routine, and the work instruction was written when the cell ran one shift.
- Why was it never fixed? Nobody owned the work instruction after the second shift was added.
The data check: bracket counts and rejects by shift and by the number of parts welded since the last nozzle clean.
- 0 to 150. Day shift: 100 / 8,000 (1.25%) Night shift: 11 / 1,000 (1.1%) All: 111 / 9,000 (1.23%)
- 151 to 300. Day shift: 78 / 2,000 (3.9%) Night shift: 161 / 4,000 (4.0%) All: 239 / 6,000 (3.98%)
- Over 300. Day shift: none. Night shift: 490 / 5,000 (9.8%) All: 490 / 5,000 (9.8%)
- Total. Day shift: 178 / 10,000 (1.78%) Night shift: 662 / 10,000 (6.62%) All: 840 / 20,000 (4.2%)
Where both shifts had data, the rates match. The reject rate follows the age of the nozzle, not the crew. A chi-square test across the three rows of the right-hand column gives 587 with 2 degrees of freedom, far beyond any significance threshold. The root cause is a nozzle that is not cleaned within about 150 parts.
Common mistakes.
- Stopping at the first plausible cause, such as "the night crew is careless".
- Testing with no stratification, which hides the real driver.
- Treating a significant p-value as proof of cause when two factors move together.
- Running every tool in the book. Basic tools are fine when they answer the question.
- 0 to 150 parts1.23 percent of brackets rejected
- 151 to 300 parts3.98 percent of brackets rejected
- Over 300 parts9.8 percent of brackets rejected
The post's illustrative project, both shifts combined: 111 / 9,000 = 1.23%, 239 / 6,000 = 3.98%, 490 / 5,000 = 9.8%.
Improve
Purpose. Choose, test and prove a fix on a small scale before rolling it out.
Deliverables. Solutions linked to verified causes, an FMEA on the chosen fix, pilot results, an implementation plan, and a draft of the updated standard work.
Gate questions.
- Does each solution trace to a verified cause?
- What could go wrong with the fix itself?
- Did the pilot use the same measurement standard and the same definition as the baseline?
- Was the pilot long enough to include normal variation?
- Who does this at 3 a.m., and will they?
Tools. Brainstorm, then rank by impact and effort. Prefer error-proofing to reminders. Use design of experiments when several inputs interact and you must find their best settings, which this project did not need. Run an FMEA on the fix: rate severity, occurrence and detection for each way it could fail, then re-score after the controls are in. Pilot with a PDCA cycle.
In the weld project. The fix: clean or change the nozzle every 150 parts on both shifts, written into the work instruction. Spare nozzles and the cleaning tool are staged at the cell. The robot's cycle counter prompts the operator at 150 parts and the next cycle needs a confirmation, so the clean does not depend on memory. The FMEA flagged one failure mode: the operator confirms without cleaning. That one is covered by adding the nozzle check to the supervisor's shift walk.
Pilot, weeks 12 to 13, night cell only: 10 working days x 500 brackets = 5,000 brackets, 85 rejects, 1.7 percent against 6.62 percent on the same shift in the baseline. Pooled rate 747 / 15,000 = 0.0498, standard error 0.00377, z = (0.0662 - 0.017) / 0.00377 = 13.1. Same inspection standard as the baseline. Rolled out to both shifts in week 14.
Common mistakes.
- Choosing a fix before a cause is verified.
- A pilot measured with a different inspection standard than the baseline.
- Rolling out with no pilot.
- A fix that works only if an operator remembers.
Control
Purpose. Make the gain survive the handover, prove it against the baseline, and close the project.
Deliverables. Updated standard work and training, a control plan (what is measured, how often, who, the limits, and what to do when a limit is crossed), a live control chart, verified results against the baseline, and a signed handover to the process owner.
Gate questions.
- Is the result measured the same way as the baseline and the goal?
- Who owns the chart, and what happens when a point goes out?
- Did training cover both shifts?
- Which other lines could use the same fix?
Tools. The control plan and the control chart, plus standard work and any error-proofing from Improve. For pass or fail data use a p chart. The limits come from the data once the process is stable, not from the pre-project period. A run rule on one side of the center line is worth adding alongside the limit; the control chart guide explains the choices. Statistical process control basics covers the wider method.
In the weld project. Weeks 15 to 16: standard work, training and the p chart. Weeks 17 to 20: 20 working days, 20,000 brackets, 170 rejects.
- Reject rate: 170 / 20,000 = 0.85 percent. Day 70 / 10,000 = 0.70 percent, night 100 / 10,000 = 1.00 percent.
- Opportunities: 100,000. DPMO = 170 / 100,000 x 1,000,000 = 1,700.
- Yield per opportunity: 99.83 percent. z = 2.93, and with the 1.5 shift the sigma level is 4.43.
- Against baseline: (4.2 - 0.85) / 4.2 = a 79.8 percent reduction. At 5,000 brackets a week that is 5,000 x (0.042 - 0.0085) = 167.5, about 168 fewer rejects a week.
- Test of baseline against result: z = 21.4.
p chart, one point per day, n = 1,000: center line 0.85 percent. UCL = 0.0085 + 3 x square root of (0.0085 x 0.9915 / 1,000) = 0.0172, so 1.72 percent or 17.2 rejects. The lower limit calculates below zero, so it is zero. One day with 18 or more rejects triggers the response plan, which names who checks the nozzle count and the cleaning log first.
The goal was met, with a caveat the handover notes record: the night shift sits at 1.0 percent, exactly on the goal, so the process owner reviews the chart weekly for the first quarter. The process owner accepts the control plan in writing. The project closes.
Common mistakes.
- Ending Control with a training slide.
- A control chart nobody reviews.
- No response plan for an out-of-limit point.
- Calculating limits from the period before the improvement.
- Closing the project before the result has held for a full verification window.
If you run these projects in LeanSuite, CI Portfolio holds DMAIC, A3 and PDCA project templates, workflow rules for what must be filled in before a project moves on, and reminders for 30-60-90 day sustaining tasks.
- 840 rejects in 20,000 brackets = 4.2 percent
- DPMO 8,400
- Sigma level 3.89 with the 1.5 shift (2.39 without)
- 170 rejects in 20,000 brackets = 0.85 percent
- DPMO 1,700
- Sigma level 4.43 with the 1.5 shift (2.93 without)
- 79.8 percent fewer rejects
The post's illustrative project. 840 / 100,000 x 1,000,000 = 8,400; 170 / 100,000 x 1,000,000 = 1,700; (4.2 - 0.85) / 4.2 = 79.8%. The goal was 1.0 percent or lower.
What sigma level means here, stated plainly
The 3.89 and 4.43 figures include the conventional 1.5 sigma shift. Six Sigma tables assume a process drifts by 1.5 standard deviations over the long term, which is how "six sigma" came to mean 3.4 defects per million opportunities and not the roughly 1 per billion on each side that six standard deviations on a centered normal curve would give. Mikel Harry explained the shift, and critics such as the statistician Donald Wheeler have called it arbitrary. It is a convention, not a measured property of your process.
Without the shift, the baseline is 2.39 sigma and the result is 2.93. Report the defect rate and DPMO first. They are facts about your data. Use the sigma level only to compare against the usual tables, and say whether you included the shift.
Frequently Asked Questions
How long does a DMAIC project take?
Sources put DMAIC projects anywhere from weeks to years, so scope to what one team can finish. The project above runs 20 weeks. If Define cannot produce a scope that closes in about six months, split the project.
What is the difference between DMAIC and PDCA?
PDCA is a four-step cycle for small, quick, repeated improvement, and plants run it daily at every level. DMAIC is a five-phase project method for chronic problems with unknown causes, and it asks for a measurement study and statistical verification before a fix. DMAIC teams often use a PDCA cycle to pilot the fix.
When do I use DMADV instead of DMAIC?
Use DMADV when you are designing a new product or process, or when the existing process cannot reach the target even after optimizing. Its phases are Define, Measure, Analyze, Design and Verify. The first three match DMAIC, then you design a new solution and verify it, instead of improving and controlling the old one.
Do I have to report a sigma level?
No. Report the defect rate and DPMO, which come straight from your counts. A sigma level adds the 1.5 shift convention, so state whether you included it if you quote one.
Can DMAIC be used outside manufacturing?
Yes. It applies to any process with measurable, repeatable output, including administrative, service and transactional work. The unit and the defect definition change, and the five gates do not.
Sources
- Wikipedia, "Six Sigma": https://en.wikipedia.org/wiki/Six_Sigma (Motorola, Bill Smith, 1986; DMAIC and DMADV phases; the 1.5 sigma shift, 3.4 DPMO, Harry, Wheeler)
- EBSCO Research Starters, "DMAIC": https://www.ebsco.com/research-starters/social-sciences-and-humanities/dmaic-define-measure-analyze-improve-and-control (origin at Motorola in 1986 with Harry and Smith; project length from weeks to years; DMAIC for difficult or complex problems)
- iSixSigma, "What Is DMAIC?": https://www.isixsigma.com/dmaic-methodology/what-dmaic/ (phase purposes, data collection plan, CTQ)
- iSixSigma, "PDCA vs. DMAIC: What's the Difference?": https://www.isixsigma.com/methodology/pdca-vs-dmaic-whats-the-difference/ (when each fits)
- iSixSigma, "History of Six Sigma": https://www.isixsigma.com/new-to-six-sigma/history/history-six-sigma/ (Bill Smith credited with coining the term; Motorola in the 1980s)
- NIST/SEMATECH e-Handbook, "What is Process Capability?": https://www.itl.nist.gov/div898/handbook/pmc/section1/pmc16.htm (Cp and Cpk formulas, stability and sample size assumptions)
- NIST/SEMATECH e-Handbook, "Two processes, same proportion of defectives": https://www.itl.nist.gov/div898/handbook/prc/section3/prc33.htm (two-proportion z test)
- NIST/SEMATECH e-Handbook, "What are Control Charts?": https://www.itl.nist.gov/div898/handbook/pmc/section3/pmc31.htm (center line and control limits)
- Wikipedia, "DMAIC": https://en.wikipedia.org/wiki/DMAIC (tools and deliverables by phase; PDCA and FMEA in Improve; control plan)
- Wikipedia, "Eight disciplines problem solving": https://en.wikipedia.org/wiki/Eight_disciplines_problem_solving (developed at Ford; D3 interim containment)
- Wikipedia, "A3 problem solving": https://en.wikipedia.org/wiki/A3_problem_solving (first used at Toyota; single sheet)
- Wikipedia, "PDCA": https://en.wikipedia.org/wiki/PDCA (Shewhart and Deming)
Free for this topic: Kaizen event charter template, RACI matrix template, Kaizen savings calculator
Want our lean manufacturing guides first in Google? Add us as a preferred source.
Add LeanSuite as a preferred source on Google (opens in a new tab)


