



Statistical process control, usually shortened to SPC, is the use of statistical methods to monitor and understand a process's output over time, carefully distinguishing ordinary, expected variation from a genuine shift that actually needs investigation and correction. This foundational distinction sits underneath nearly every other tool covered across this cluster: the DMAIC method's Analyze phase depends on it, Control Charts are the primary visual tool for applying it, and Process Capability measures how a process's variation relates to specification limits. This blog covers SPC's foundational concept in depth, since misunderstanding it is one of the most common and costly mistakes in any manufacturing quality effort.
The Core Problem SPC Solves
Every real-world process produces output that varies at least slightly from one unit to the next, even when nothing has actually gone wrong or changed. A machine cutting parts to a target dimension won't produce two parts with the exact identical measurement; small, inherent fluctuations in material, temperature, or the machine itself produce a natural spread of results. The core problem SPC solves is telling the difference between that natural, expected spread and a genuine change in the process, a tool wearing out, a material batch shifting, an operator drifting from the standard method.
Without SPC in place, teams tend to fall predictably into one of two costly errors. The first is treating every fluctuation as a real problem, chasing normal variation as if each data point above or below average has a specific, findable cause, wasting enormous effort investigating noise. The second, often more damaging error, is the opposite: dismissing a genuine shift as "just normal variation" and letting a real problem run uncorrected because nobody applied a rigorous test to tell the two apart.
Key Insight: SPC's entire value rests on a single distinction: is this variation something inherent to how the process currently works, or is it a signal that something specific has actually changed? Getting that distinction right determines whether a team wastes effort or catches a real problem.

Common-Cause Variation: The Process's Natural Voice
Common-cause variation is the natural, inherent spread present in any genuinely stable process, caused by the combined effect of many small factors that are always present to some degree: minor material differences, normal wear, small environmental fluctuations, and the inherent limits of measurement itself. A process experiencing only common-cause variation is described as being "in statistical control," meaning its output is predictable within a known range, even though individual data points still vary.
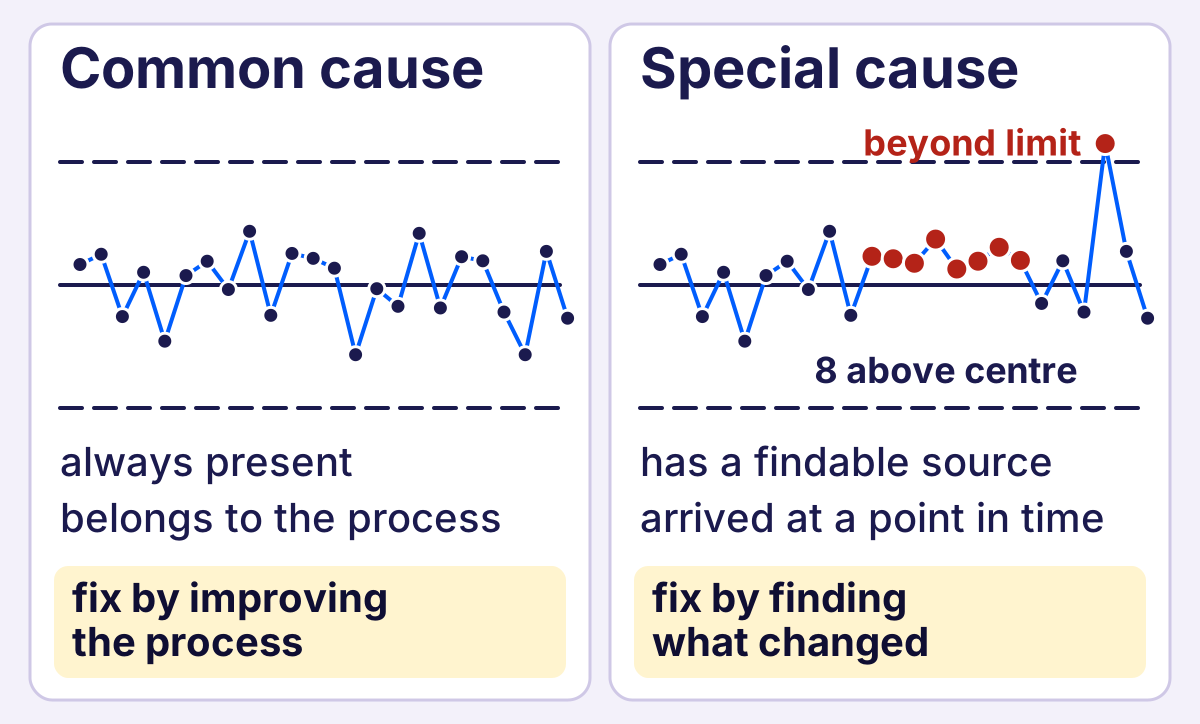
Text version of this figure
Two panels, each a run chart of 24 points with a centre line and two dashed limits. Left, Common cause: the points wobble evenly inside the limits. Text: always present; belongs to the process; in a gold box, fix by improving the process. Right, Special cause: the same chart with eight points in a row above the centre in red, labelled 8 above centre, and one point above the upper limit in red, labelled beyond limit. Text: has a findable source; arrived at a point in time; in a gold box, fix by finding what changed.
Common-cause variation matters because it sets the baseline against which any potential shift gets judged. A process's natural range of common-cause variation is typically established through the baseline data collection covered in the Measure phase of DMAIC, and that established baseline becomes the ongoing reference a team compares all future data against. Attempting to eliminate common-cause variation entirely is usually the wrong goal; a stable process reduces common-cause variation through deliberate process improvement, not by reacting to every individual data point.
Key Insight: Common-cause variation is the baseline every future judgment gets compared against; reacting to it as though it were a signal wastes effort on noise that's already expected.
Special-Cause Variation: A Genuine Signal
Special-cause variation is genuinely different in kind, not merely in degree. It reflects a specific, identifiable factor that isn't normally part of the process: a tool that's begun to wear beyond its usual range, a new material lot with different properties, an operator using an unapproved technique, or a machine malfunction. Special-cause variation is what SPC is specifically designed to detect, since it represents a genuine change worth investigating and, usually, correcting.
The practical distinction matters enormously for how a team responds. Common-cause variation calls for a broader process improvement effort, potentially a full DMAIC project, addressed at a systemic level. Special-cause variation calls for immediate, targeted investigation into what specifically changed, often resolved quickly once identified. Responding to common-cause variation as though it were special-cause, or vice versa, wastes effort and can even make a stable process less predictable through unnecessary, poorly targeted adjustments.
Key Insight: Common-cause and special-cause variation call for opposite responses, systemic improvement versus targeted investigation, so misreading which one you're looking at wastes effort or misses a real problem.
The Danger of Overreacting to Normal Variation
A specific, well-documented failure mode in quality management is overcorrection: an operator or supervisor who adjusts a machine every single time an individual measurement drifts even slightly from target, even when that drift falls comfortably well within the process's normal, expected common-cause range. This overcorrection, sometimes called tampering, actually increases variation rather than reducing it, since each unnecessary adjustment introduces a new disturbance into a process that was already behaving predictably and within its expected range. SPC's statistical rules exist specifically to prevent this kind of well-intentioned but genuinely counterproductive reaction, giving the operator a clear, data-based test to apply instead of relying on instinct at the moment.
Key Insight: Tampering, adjusting a stable process in reaction to normal variation, doesn't reduce variation; it adds a new disturbance to a process that was already behaving as expected.
How SPC Determines Whether Variation Is Special-Cause
SPC doesn't rely on gut feeling or subjective impression to make this distinction; it uses statistically derived control limits, calculated directly from a process's own baseline data, to define the range within which common-cause variation is genuinely expected to fall under normal, stable operation. A handful of well-established statistical rules then flag when a data pattern is unlikely enough to have occurred by common-cause variation alone, which signals that a special cause is probably present. These typically include:
- A single point falling outside the calculated control limits, the most straightforward signal that something has genuinely changed.
- A run of consecutive points on one side of the process average, which is statistically unlikely to occur by chance alone if the process were still behaving as it had at baseline.
- A clear trend across several consecutive points, rising or falling steadily, suggesting a gradual shift such as tool wear rather than a sudden change.
- Unusual patterns of alternation or clustering, which can indicate a measurement or sampling problem rather than a true process shift.
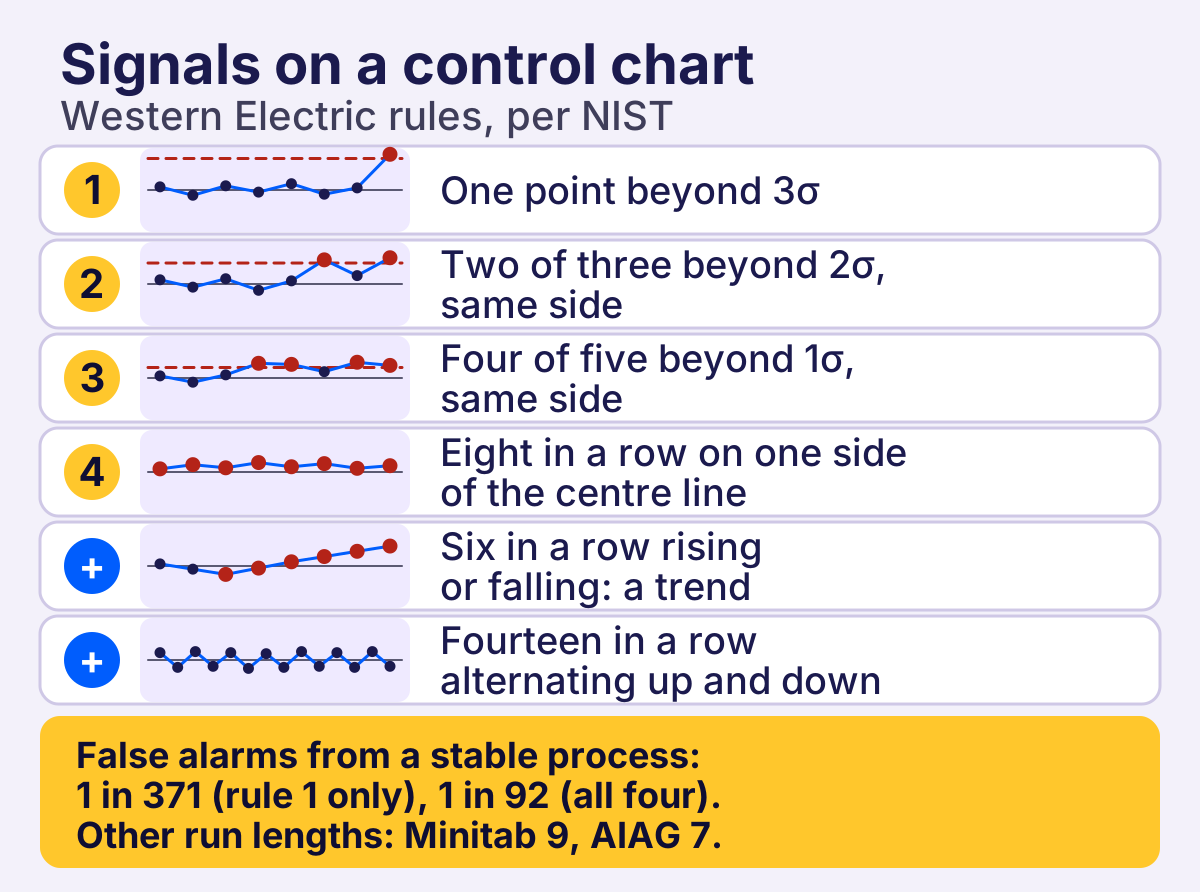
Text version of this figure
A card titled Signals on a control chart, with the line Western Electric rules, per NIST. Six rows, each with a small chart. Row 1: One point beyond 3σ. Row 2: Two of three beyond 2σ, same side. Row 3: Four of five beyond 1σ, same side. Row 4: Eight in a row on one side of the centre line. Two pattern rows marked with a plus: Six in a row rising or falling: a trend. Fourteen in a row alternating up and down. Footer: False alarms from a stable process: 1 in 371 (rule 1 only), 1 in 92 (all four). Other run lengths: Minitab 9, AIAG 7.
The specific visual tool used to apply these rules in practice, the control chart, is covered in depth in the next blog in this cluster.
Key Insight: SPC doesn't rely on gut feeling to call a shift real; statistically derived control limits and a defined set of pattern rules are what replace subjective impression with a repeatable test.
Setting Up SPC for a New Process or Measurement
Introducing SPC to a process that hasn't used it before follows a defined sequence rather than simply starting to plot data immediately:
- Select the right characteristic to monitor, one that's genuinely meaningful to quality or customer requirements, rather than monitoring something purely because it's easy to measure.
- Validate the measurement system, the same step covered in DMAIC's Measure phase, since SPC built on unreliable data produces unreliable conclusions regardless of how correctly the statistical rules are applied afterward.
- Collect enough baseline data to establish genuine control limits, typically twenty to twenty-five subgroups, rather than calculating limits from a handful of early data points that may not represent the process's true, stable behavior.
- Confirm the process is actually stable before finalizing control limits, since calculating limits from data that already contains an unaddressed special cause produces distorted, unreliable limits going forward.
- 1
Select the characteristic to monitor
One that matters to quality or customer requirements, not just one that is easy to measure - 2
Validate the measurement system
SPC built on unreliable data gives unreliable conclusions - 3
Collect baseline data
Typically twenty to twenty-five subgroups, not a handful of early points - 4
Confirm the process is stable
Limits calculated from data holding an unaddressed special cause are distorted - 5
Finalize the control limits
Now they can be trusted as the test for special-cause variation
Key Insight: Control limits are only as trustworthy as the baseline data and process stability behind them; skipping validation or confirming stability first produces limits that look statistical but aren't reliable.
SPC's Role Alongside Other Quality Tools
SPC is sometimes confused with quality control more broadly, but the two aren't the same thing. Traditional inspection-based quality control typically catches defects after they've already occurred, sorting good parts from bad ones at the end of a process. SPC is fundamentally preventive: it monitors the process itself, in real time, aiming to catch a shift before it produces defective output at all, which is a meaningfully different goal from inspection alone. This is also what distinguishes SPC's contribution within the combined Lean Six Sigma approach covered in this cluster's first blog: it's the ongoing monitoring layer that sustains a process's stability, complementing the one-time root cause investigation DMAIC provides during an active improvement project.
Key Insight: SPC and inspection-based quality control aren't the same tool wearing different names; inspection catches defects after they happen, SPC is built to catch a shift before it produces one at all.
A Worked Example: Telling the Two Apart
Consider a machine cutting a part to a target length of 50 millimeters, with a process that's historically shown a natural spread between 49.8 and 50.2 millimeters when nothing unusual is happening. Over several shifts, the following patterns might appear, and each calls for a different response:
- A single reading of 50.15 millimeters. This falls comfortably within the established common-cause range. No action is needed; adjusting the machine in response would be tampering with a process that's behaving exactly as expected.
- Seven consecutive readings all slightly above the process average, even though each individual reading falls within the control limits. This pattern is statistically unlikely to occur by chance in a stable process, and it signals a probable special cause, perhaps a tool beginning to wear, worth investigating even though no single point crossed a limit.
- A single reading of 50.35 millimeters, clearly outside the established control limits. This is an unambiguous special-cause signal calling for immediate investigation: what changed at that specific point in time, and does it affect the parts produced since then.
- A steadily rising trend across fifteen consecutive readings, moving gradually from 49.9 toward 50.1. Even though every individual reading might still fall inside the limits, the trend itself is the signal, often indicating gradual tool wear that will eventually cross the limit if left unaddressed.
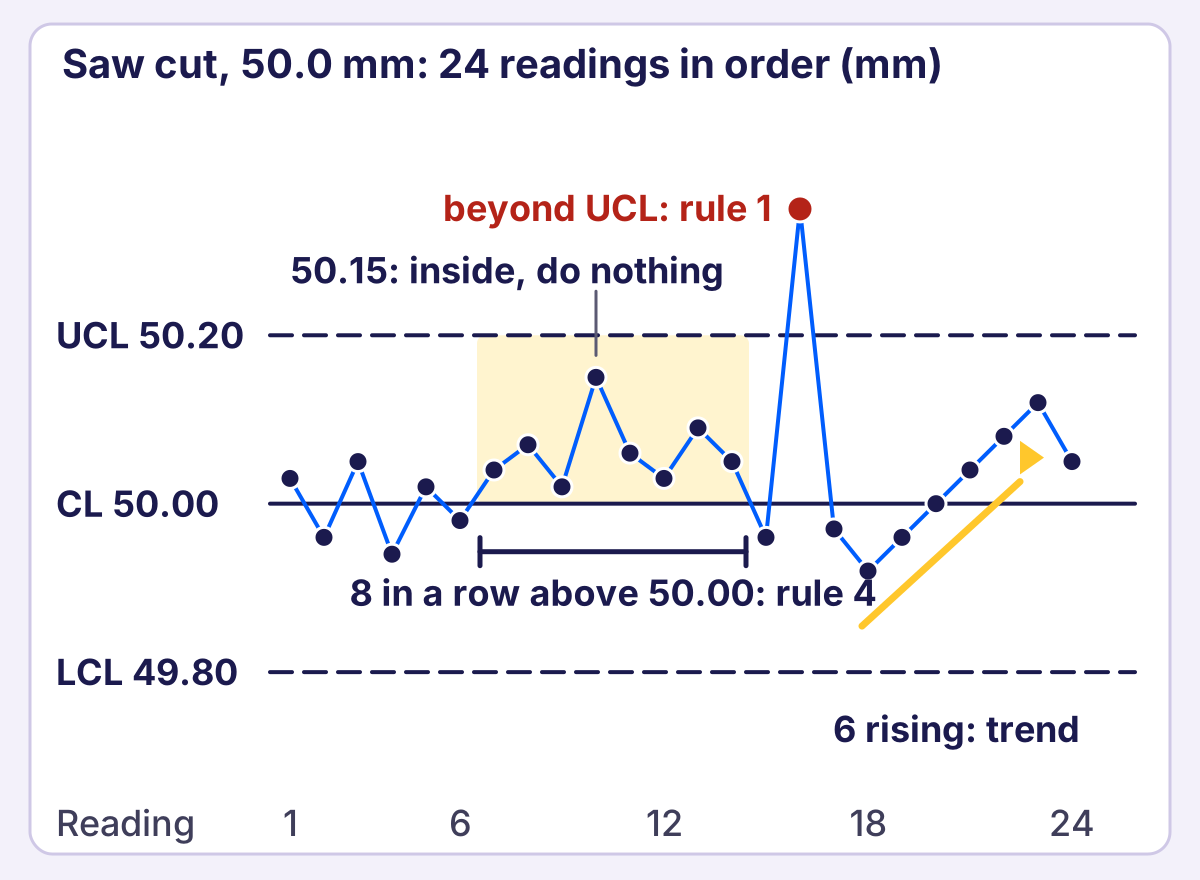
Text version of this figure
A run chart titled Saw cut, 50.0 mm: 24 readings in order (mm), with UCL 50.20, CL 50.00 and LCL 49.80 and a reading axis 1, 6, 12, 18, 24. Readings 1 to 6 scatter on both sides of the centre. Readings 7 to 14 are all above 50.00, shaded and bracketed: 8 in a row above 50.00: rule 4. Reading 10 is 50.15, with the note: 50.15: inside, do nothing. Reading 15 is below the centre. Reading 16 is 50.35 in red: beyond UCL: rule 1. Readings 18 to 23 climb from 49.92 to 50.12 under a gold arrow: 6 rising: trend. Reading 24 is 50.05.
This example illustrates why SPC requires looking at patterns over time, not just individual readings in isolation. A single measurement rarely tells the whole story on its own.
Key Insight: A reading inside the control limits isn't automatically a non-event; a run or a trend across several readings can be a real signal even when no single point crosses the line.
Common Misunderstandings That Undermine SPC
A handful of recurring misunderstandings prevent teams from getting the full value SPC is capable of providing:
- Treating control limits as specification limits. Control limits are calculated from the process's own historical behavior; specification limits come from the customer's requirements. A process can be perfectly "in control" statistically while still producing output outside what the customer actually needs, which is precisely the gap that process capability analysis, covered in the next blog after control charts, exists to measure.
- Assuming "in control" means "good enough." A stable process is predictable, not necessarily acceptable. Stability is a prerequisite for meaningful improvement, not a guarantee that the current level of performance is where it needs to be.
- Reacting to every individual data point. As covered above, this overcorrection actually increases variation rather than reducing it, undermining the very stability SPC is meant to protect.
- Calculating control limits from too little data, or from data containing an unaddressed special cause. Limits calculated this way don't represent the process's true, stable behavior, and every subsequent judgment built on those limits inherits the distortion.
Key Insight: Control limits and specification limits answer different questions; a process can be statistically in control while still producing output the customer wouldn't accept.
Who Should Own SPC on the Floor
SPC works best when it isn't treated as a specialist activity performed exclusively by quality engineers detached from daily operations. The people closest to a process, operators and team leaders, are usually best positioned to notice early warning patterns in real time, which is why many plants integrate basic SPC literacy into the leader standard work routine covered elsewhere on this site, rather than reserving all statistical interpretation for a periodic quality review. A team leader who understands the difference between common-cause and special-cause variation, even without deep statistical training, can make a meaningfully better daily decision than one who either ignores every fluctuation or reacts to all of them equally.
This doesn't eliminate the need for statistical expertise entirely. Setting up control limits correctly, validating a measurement system, and interpreting an ambiguous pattern still benefit from trained Six Sigma practitioners. But day-to-day monitoring and the first-line judgment of whether something looks unusual works best as a shared responsibility across the floor, not a function locked away in a separate department that only reviews data well after the fact.
Key Insight: SPC delivers the most value when basic literacy sits with the people closest to the process, not only with quality engineers who review the data well after a shift has already occurred.
Within the Lean System
Connection to Lean Principles
SPC is the statistical form of catching abnormalities close to the source, the same instinct behind andon and visual management, just applied to data instead of a visible stoppage. Both exist to surface a problem while it's still small and cheap to fix.
Connection to Lean Tools
SPC feeds directly into the tools covered elsewhere in this cluster, plotted using the Control Charts this blog introduces conceptually, and paired with Process Capability analysis to check whether stable performance also meets specification. DMAIC's Measure and Control phases lean on SPC most heavily of the five phases.
Connection to Continuous Improvement
A control chart that keeps signaling the same special cause is itself a continuous improvement trigger, pointing a team toward a root-cause investigation rather than a one-off adjustment. SPC's real value is in surfacing that pattern early, not just documenting it after the fact.
Frequently Asked Questions
Is SPC only useful for high-volume manufacturing?
No, not at all. SPC applies to any process producing repeated, measurable output, though it's most commonly associated with high-volume manufacturing simply because more data points make the underlying statistical patterns easier to establish and interpret reliably over time and across regular production shift changes.
How much baseline data is needed before SPC control limits are trustworthy?
Most practitioners recommend at least twenty to twenty-five subgroups of data collected while the process is genuinely stable and behaving normally, though the exact number needed can vary depending on subgroup size and how variable the process naturally is over time and by production shift.
Does SPC eliminate the need for final inspection?
Not entirely, though it substantially reduces reliance on it. SPC's goal is catching a process shift early enough that defective output never occurs, but final inspection often remains a valuable backup, particularly for safety- or quality-critical characteristics found on the line each and every shift.
What happens if control limits are recalculated too frequently?
Recalculating limits every time new data comes in defeats their purpose, since limits are meant to represent a stable reference point against which new data gets judged. A genuine special-cause shift can quietly get absorbed into the new baseline rather than flagged for further review.
What's the difference between SPC and process capability analysis?
SPC monitors whether a process is behaving consistently over time relative to its own historical behavior. Process capability, covered in Process Capability, measures whether that consistent behavior actually falls within the customer's specification limits, a related but genuinely distinct question entirely on its own terms.
Can SPC be applied to a process with very low volume or infrequent output?
It's harder, since SPC's statistical rules rely on having enough data points to distinguish a genuine pattern from ordinary noise. Low-volume processes sometimes use adapted approaches, such as short-run SPC techniques, to work around this real, practical limitation on available process data seen over time.
Free for this topic: 8D report template, Poka-yoke worksheet, First pass yield (FPY) calculator
Want our lean manufacturing guides first in Google? Add us as a preferred source.
Add LeanSuite as a preferred source on Google (opens in a new tab)


