
Skip to content

Example gallery · 19 examples · Lean leadership and employee engagement

Manufacturing KPI examples: 19 with the math worked out

Nineteen KPIs a manufacturing plant puts on its boards, grouped the way most plants group them. Each card gives the formula, one calculation worked through with numbers, who owns the KPI and how often it is reviewed, and the usual way it gets miscounted. The plants and numbers are illustrative.

Last reviewed:

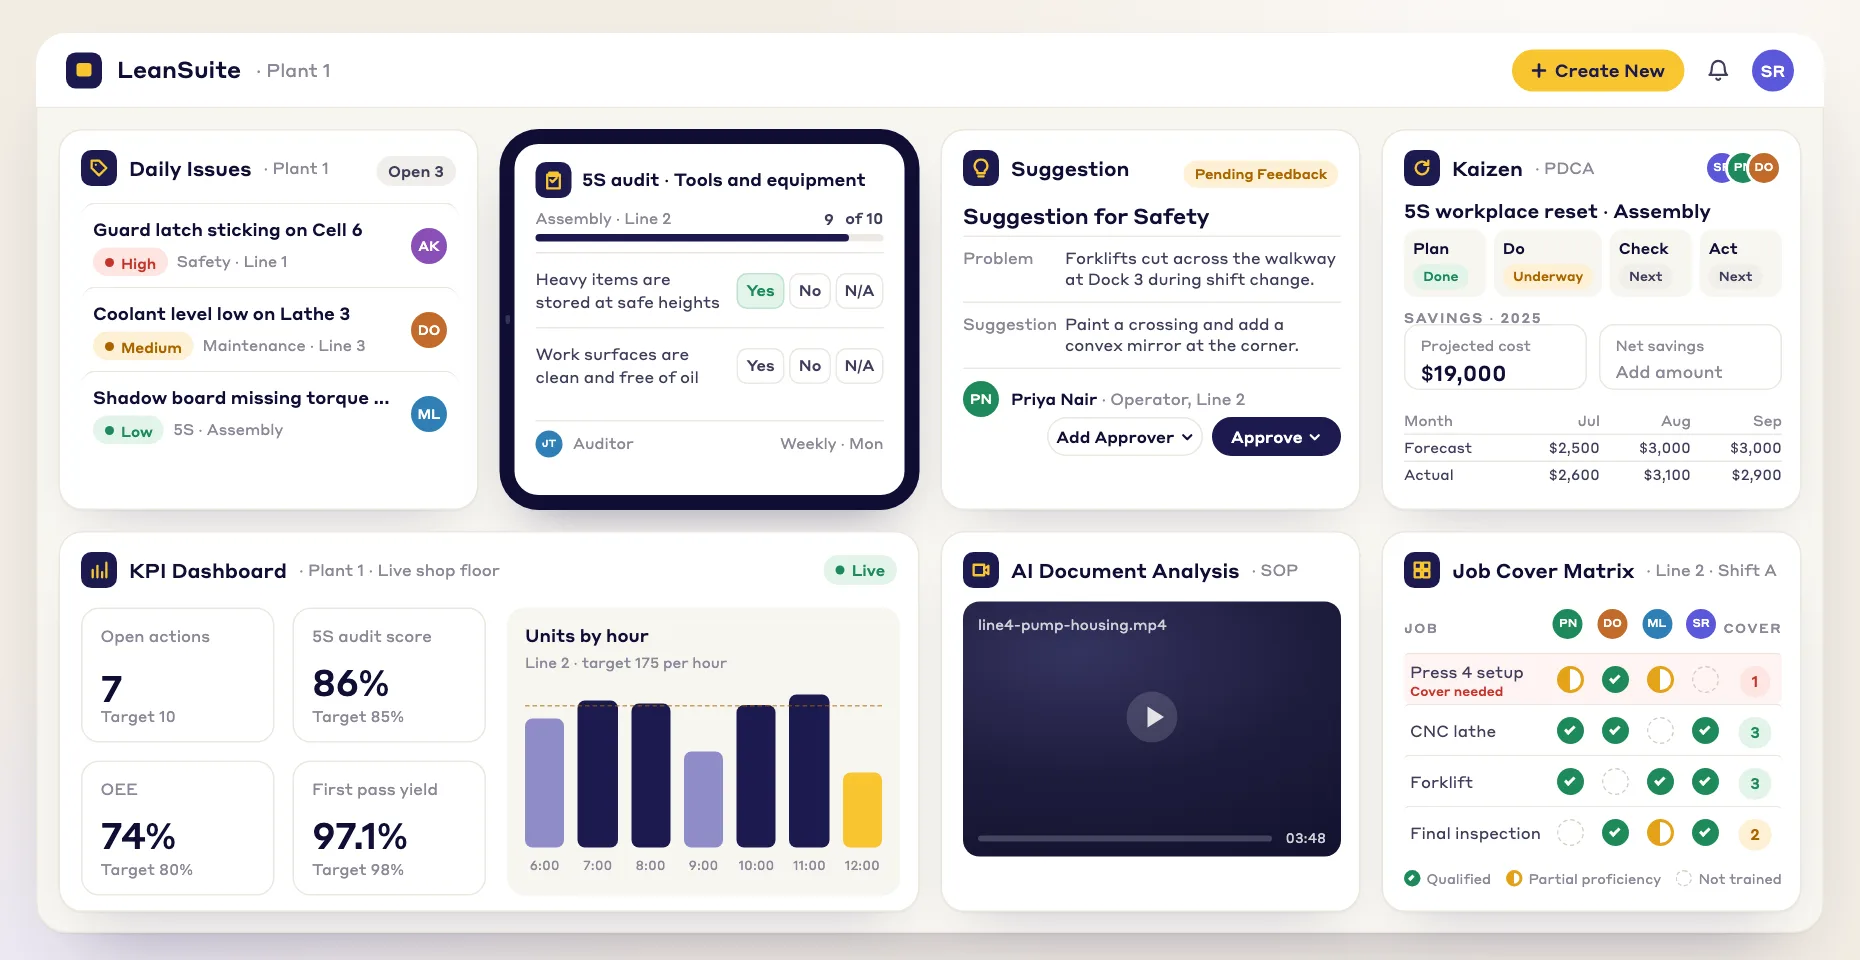
Get the manufacturing KPI dashboard template

Enter your own weekly numbers and see each KPI against its target. Free, after one short form.

Free to use: print it, copy it and edit it for your team. Enter your name and work email once to download.

More about it on the manufacturing kpi dashboard template page.

Want the long version? Maintenance KPIs: What to Measure and Why: the equipment KPIs on this page in more depth, with the maintenance measures that sit behind them.

Results are written as decimals: 0.94 is what a board would show as 94 in a hundred. A leading KPI is one the team can move this week, such as near misses reported or schedule attainment. A lagging KPI reports a result after the fact, such as the incident rate or parts the customer sent back. Filter by either, or by how often the KPI is reviewed.

Type
Review

Showing 19 of 19 examples

Safety

One result and one early signal. The result moves slowly, so the early signal is what a team reviews week to week.

    • Lagging
    • Monthly

    Total recordable incident rate (TRIR)

    Recordable injuries and illnesses, scaled so that plants of different sizes can be compared. The 200,000 is the hours 100 full-time employees work in a year, so the result reads as cases per 100 workers a year.

    Formula:
    Recordable cases x 200,000 / hours worked by all employees.
    Worked example:
    A plant of about 250 people worked 506,000 hours over the last 12 months and had 4 recordable cases. 4 x 200,000 / 506,000 = 1.58.
    Owner and review:
    The safety manager owns it. Reviewed monthly at the plant meeting as a rolling 12 months, with every case also reviewed on the day it happens.
    Watch out:
    Count all hours worked, including overtime and temporary staff you supervise. In a small plant one case moves the rate a long way, so show the case count next to the rate.

    Source: US Bureau of Labor Statistics: How to compute nonfatal incidence rates

    • Leading
    • Weekly

    Near misses reported

    How many near misses and unsafe conditions people report. A rising number usually means more people are reporting, which is the point. Each report is a hazard found before it hurt someone.

    Formula:
    Reports in the period x 100 / average headcount.
    Worked example:
    37 reports in October from a site of 210 people. 37 x 100 / 210 = 17.6 reports per 100 people in the month.
    Owner and review:
    Each supervisor owns their area's number. The count is reviewed weekly at the area meeting, with every open report listed until it is closed.
    Watch out:
    Never set a target to bring this number down. Pair it with how many reports were closed on time, or people stop reporting when nothing happens.

Quality

From the station out to the customer: right first time at one step, across the whole route, what was thrown away, and what the customer sent back.

    • Leading
    • Every shift

    First pass yield (FPY)

    The share of units that went through one step right the first time, with no rework and no repair. It is the quality KPI a station can act on within the shift.

    Formula:
    Units good the first time / units started.
    Worked example:
    A leak test station started 1,840 units on the shift. 1,731 passed first time, 82 passed after rework and 27 were scrapped. FPY = 1,731 / 1,840 = 0.941.
    Owner and review:
    The team leader owns it. It is written on the board every shift and reviewed at the next start-of-shift huddle with the top reason for failures.
    Watch out:
    A unit that passes after rework is not a first pass. Counting it gives 1,813 / 1,840 = 0.985 here, which is a different measure and hides 82 units of rework.
    • Leading
    • Weekly

    Rolled throughput yield (RTY)

    The chance that a unit gets through every step of the route without rework at any of them. It shows why a line of good-looking steps can still rework a lot of product.

    Formula:
    First pass yield of step 1 x step 2 x step 3, and so on for every step.
    Worked example:
    Three steps run at 0.98, 0.95 and 0.99. RTY = 0.98 x 0.95 x 0.99 = 0.922. About 8 units in every 100 need rework somewhere on the route, though no single step looks bad.
    Owner and review:
    The quality engineer for the value stream owns it. Reviewed weekly, with the lowest step named as the next problem to work on.
    Watch out:
    Multiply, do not average. The average of the three steps is 0.973, which describes none of the product.
    • Leading
    • Daily

    Scrap rate

    How much of what was made was thrown away. A discrete plant counts units. A process plant weighs material, as this extrusion line does.

    Formula:
    Scrap / total produced, in the same unit: units, kilograms or cost.
    Worked example:
    The line ran 9,640 kg of material on Tuesday and sent 212 kg to the scrap bin. 212 / 9,640 = 0.022.
    Owner and review:
    The production supervisor owns it. Reviewed daily at the area meeting, split by reason code so the largest cause is visible.
    Watch out:
    Decide whether start-up and changeover scrap counts, write the rule down, and keep it the same on every shift. Regrind that goes back into the process is still scrap the first time it is made.
    • Lagging
    • Monthly

    Customer PPM

    Parts the customer rejected, per million shipped. It is the last quality number to move and the one the customer keeps their own copy of.

    Formula:
    Parts the customer rejected x 1,000,000 / parts shipped.
    Worked example:
    9 parts rejected from 386,000 shipped in the quarter. 9 x 1,000,000 / 386,000 = 23.3 PPM.
    Owner and review:
    The quality manager owns it. Each rejection is reviewed the day it arrives, and the PPM trend is reviewed monthly.
    Watch out:
    Agree with the customer what is counted. When one bad part is found, some customers reject and count the whole lot, which can turn 1 part into 2,000.

Delivery

What the customer feels, what the line can act on during the shift, and how long an order takes from start to finish.

    • Lagging
    • Weekly

    On time in full (OTIF)

    The share of order lines that arrived on the promised date with the full quantity. Both conditions must be met for the line to count.

    Formula:
    Order lines delivered on time and complete / order lines due in the period.
    Worked example:
    200 order lines were due last week. 191 shipped on time, and 188 of those were complete. OTIF = 188 / 200 = 0.94.
    Owner and review:
    The planning or customer service lead owns it. Reviewed weekly, with every missed line listed by cause: material, capacity, quality hold or carrier.
    Watch out:
    Measure against the date first promised to the customer. If the date is moved after a delay and the order is then counted on time, the number stays green while the customer is waiting.
    • Leading
    • Every shift

    Schedule attainment

    Whether the line made what the plan asked for: the right items in the right quantities. It is the delivery KPI a line can act on during the shift.

    Formula:
    Sum of each item's output, capped at its plan / total planned.
    Worked example:
    Plan: item A 2,000, item B 1,400, item C 800, which is 4,200 in total. Made: A 2,300, B 1,150, C 800. Credit A at 2,000, B at 1,150 and C at 800. (2,000 + 1,150 + 800) / 4,200 = 0.94.
    Owner and review:
    The shift supervisor owns it. Written up at the end of every shift and reviewed at the next morning's area meeting.
    Watch out:
    No credit for overproduction. Total made here is 4,250 against a plan of 4,200, which looks like a good shift, yet item B is 250 short and somebody is waiting for it.
    • Lagging
    • Monthly

    Order-to-ship lead time

    How long an order takes from the day it is received to the day it ships. Customers feel the slow orders, so the slow end is reported alongside the middle.

    Formula:
    Ship date minus order date, in working days, for every order shipped in the period. Report the median and the slowest orders.
    Worked example:
    46 orders shipped in October. Sorted from fastest to slowest, the middle of the list is 6 working days, and 5 orders took more than 11 days.
    Owner and review:
    The value stream manager owns it. Reviewed monthly, and the five slowest orders are walked through one by one.
    Watch out:
    An average hides the slow orders. One order stuck for 30 days barely moves the median, so list the slowest ones by name.

Cost and productivity

How well hours, material and floor space turn into good output.

    • Lagging
    • Daily

    Units per labor hour

    Good output for each paid hour of direct labor. It is simple to calculate and easy to compare from day to day on the same product mix.

    Formula:
    Good units / paid direct labor hours.
    Worked example:
    The line made 3,950 good units on the day with 39 people on 8-hour shifts, which is 312 paid hours. 3,950 / 312 = 12.7 units per labor hour.
    Owner and review:
    The production manager owns it. Reviewed daily at the area meeting next to schedule attainment.
    Watch out:
    Count good units only, and paid hours, not hours at the station. A change in product mix moves the number without anyone working differently, so compare like with like.
    • Lagging
    • Monthly

    Inventory turns

    How many times a year the plant sells through its inventory. Dividing 365 by the turns gives days on hand, which most people find easier to picture.

    Formula:
    Cost of goods sold for the year / average inventory value.
    Worked example:
    Cost of goods sold is $14,400,000 and average inventory is $2,400,000. 14,400,000 / 2,400,000 = 6.0 turns, and 365 / 6.0 = 61 days on hand.
    Owner and review:
    The plant controller and the materials manager own it together. Reviewed monthly.
    Watch out:
    Use cost of goods sold, not sales revenue, or the margin inflates the turns. Use the average of the month-end values. A single year-end count taken after stock was run down flatters the number.
    • Leading
    • Weekly

    Changeover time

    How long the line is stopped between products. Shorter changeovers allow smaller batches, and smaller batches mean less inventory and a shorter wait for the customer.

    Formula:
    Time from the last good part of one product to the first good part of the next at full speed. Average it over the changeovers in the period.
    Worked example:
    14 changeovers on the filler last week took 532 minutes in total. 532 / 14 = 38 minutes on average, against a target of 30. The longest took 61 minutes.
    Owner and review:
    The line's team leader owns it. Each changeover is timed and written on the board. The average and the longest are reviewed weekly.
    Watch out:
    Stop the clock at the first good part at full speed, not at the first part. Otherwise the adjustment and start-up scrap after the restart disappear from the number.

Equipment

Measured per line or per asset. A plant-wide average hides the one machine that needs the attention.

    • Leading
    • Every shift

    Overall equipment effectiveness (OEE)

    How much of the planned production time turned into good parts at the ideal speed. It is three ratios multiplied together, and the three tell you more than the product does.

    Formula:
    Availability x performance x quality. Availability = run time / planned production time. Performance = ideal cycle time x total count / run time. Quality = good count / total count.
    Worked example:
    One line, one shift. Planned time 450 minutes, stops 47, so run time is 403 and availability is 403 / 450 = 0.896. Ideal cycle time 0.5 minutes and 742 parts made: 371 / 403 = 0.921. 721 good: 721 / 742 = 0.972. OEE = 0.801. Check the short way: 721 x 0.5 / 450 = 0.801.
    Owner and review:
    The line lead works it out at the end of each shift from the downtime log and the counter readings. The team reviews it at the next huddle, starting with the largest loss of the three.
    Watch out:
    Set the ideal cycle time from the fastest the line can run the product, not from the usual rate. A soft ideal pushes performance above 1.0 and hides the slow running.

    Source: OEE.com: Calculate OEE

    • Lagging
    • Monthly

    Mean time between failures (MTBF)

    How long an asset runs, on average, between breakdowns. It is tracked per asset on the critical machines and is a measure of reliability.

    Formula:
    Operating hours / number of failures.
    Worked example:
    A palletizer ran 620 hours in the quarter and broke down 8 times. 620 / 8 = 77.5 hours between failures.
    Owner and review:
    The maintenance manager owns it. Reviewed monthly for each critical asset, with the trend over the last four quarters.
    Watch out:
    Write down what counts as a failure. A common rule is any unplanned stop that needed maintenance to restart. If operators clear short stops themselves, those belong in OEE.
    • Lagging
    • Monthly

    Mean time to repair (MTTR)

    How long a breakdown lasts, on average, from the stop to running again. It measures the response: how fast someone arrives, finds the fault, gets the part and restarts.

    Formula:
    Total downtime for repairs / number of failures.
    Worked example:
    The same 8 breakdowns took 380 minutes in total. 380 / 8 = 47.5 minutes each. Waiting for a technician and for parts accounted for 150 of the 380.
    Owner and review:
    The maintenance supervisor owns it. Reviewed monthly alongside MTBF, with the longest repair examined in detail.
    Watch out:
    Start the clock when the machine stops, not when the technician arrives. Otherwise the waiting time is invisible, and waiting is often the largest part.
    • Leading
    • Weekly

    PM compliance

    Whether planned maintenance is getting done when it was scheduled. When this slips, breakdowns follow some weeks later.

    Formula:
    PM work orders completed on time / PM work orders due in the period.
    Worked example:
    50 PM work orders were due last week. 46 were completed inside their window. 46 / 50 = 0.92. Two of the four misses were on the same compressor.
    Owner and review:
    The maintenance planner owns it. Reviewed weekly, with every overdue PM listed by asset and by how late it is.
    Watch out:
    Define on time as a window, such as within 7 days of the due date for a monthly task. A PM closed three weeks late was done, and it was not on time.

People and improvement

The KPIs most often left off the board, and often the explanation for a red somewhere else on it.

    • Leading
    • Monthly

    Training compliance

    The share of required trainings that are current. The number comes straight off the training matrix, where each required training for each person is either in date or not.

    Formula:
    Required trainings that are current / required trainings in total.
    Worked example:
    The packing area has 180 required trainings across its people. 171 are current and 9 have expired. 171 / 180 = 0.95. Of the 171, 6 fall due within 60 days.
    Owner and review:
    The training coordinator owns the number and each supervisor owns their own rows. Reviewed monthly, with the expired ones listed by name.
    Watch out:
    Count each person and training pair, not people. Nine expired trainings may sit with nine different people, and none of them should be doing that task today.
    • Leading
    • Monthly

    Ideas implemented per person

    How many employee ideas were put in place, per person. It measures whether the suggestion system works from end to end, not how many cards went into the box.

    Formula:
    Ideas implemented in the period / average headcount.
    Worked example:
    64 ideas were implemented in the third quarter on a site of 120 people. 64 / 120 = 0.53 per person for the quarter. 97 were submitted, so about 2 in 3 were put in place.
    Owner and review:
    The continuous improvement lead owns it. Reviewed monthly by area, with the oldest open ideas listed.
    Watch out:
    Count implemented ideas, not submitted ones. Also track the days from submission to a first answer, because a slow answer is what stops people offering the next idea.
    • Leading
    • Weekly

    Actions closed on time

    Whether the actions that come out of huddles, audits and problem solving get done by the date agreed. A board full of overdue actions tells the team the meeting does not matter.

    Formula:
    Actions closed on or before their due date / actions due in the period.
    Worked example:
    52 actions fell due in October. 41 were closed on time. 41 / 52 = 0.79. Of the 11 that missed, 6 have now been open for more than 30 days.
    Owner and review:
    The area manager owns it. Reviewed weekly at the area meeting, where each overdue action gets a new date or is escalated.
    Watch out:
    Keep the original due date on the record when a date is moved. If the old date is overwritten, the action counts as on time and the delay is lost.

Illustrative examples. The numbers on this page are made up to show each calculation, and none comes from a real plant or a LeanSuite customer. They are not benchmarks or targets. Set your own target from your own history. The two cards with a source link take their formula from that source.

What to write down for every KPI on your board

Seven things. If any one is missing, two shifts will calculate the same KPI in two different ways.

  1. 1The formula, with the unit for each number in it.
  2. 2What counts and what does not, such as whether a reworked unit is a pass.
  3. 3Where each number comes from: which log, count or report.
  4. 4One named owner.
  5. 5The meeting that reviews it, and how often.
  6. 6A target taken from your own history, with the red and green limits.
  7. 7What happens when it is red: who acts, and by when.

How these examples were written

Pages that rank for this search list KPI names, sometimes with a formula, and stop there. What a plant needs in order to put a KPI on a board is one calculation worked through, a rule for what counts, an owner and a review rhythm. Each card gives those four things.

The incident rate and OEE formulas come from the two sources below. The other formulas are the ones in common use, and plants do differ on the detail, such as whether start-up scrap counts or what on time means. That is why every card ends with what to watch out for. Where a formula also appears in our manufacturing KPIs guide, the two agree.

Sources checked

Free templates and tools

FAQ

Questions about manufacturing KPI examples

  1. Common ones are the recordable incident rate and near misses reported for safety, first pass yield and scrap rate for quality, on time in full and schedule attainment for delivery, units per labor hour and inventory turns for cost, OEE, MTBF and MTTR for equipment, and training compliance for people. This page works through one calculation for each of 19.

  2. A lagging KPI reports a result after it has happened, such as the incident rate or parts the customer rejected. A leading KPI measures something that comes before the result and that the team can change this week, such as near misses reported, first pass yield at the station or PM compliance. A board needs both: lagging to know whether the plant got there, leading to know what to do today.

  3. Five to eight at a line huddle is typical, one or two each for safety, quality, delivery, cost and people. An area meeting carries a few more because it compares lines, and the monthly plant review adds the slow ones such as inventory turns. If a KPI has not led to an action in a month, question whether it belongs on the board.

  4. One named person, at the level that can act on it. A team leader can own first pass yield at a station. The plant manager cannot. The owner is responsible for the number being right, for explaining a miss and for the action that follows. A KPI owned by a department, or by everyone, is owned by nobody.

  5. No. They are made up to show each calculation and are not benchmarks or targets. The incident rate and OEE cards take their formulas from the linked sources. Set your own targets from your own history, one line or one area at a time.

Rather see it on your own problem?

Bring the problem you are stuck on, and we will show you on a call how LeanSuite handles it.