

Quick reference poster
Updated · Free to print and share
MTBF and MTTR poster
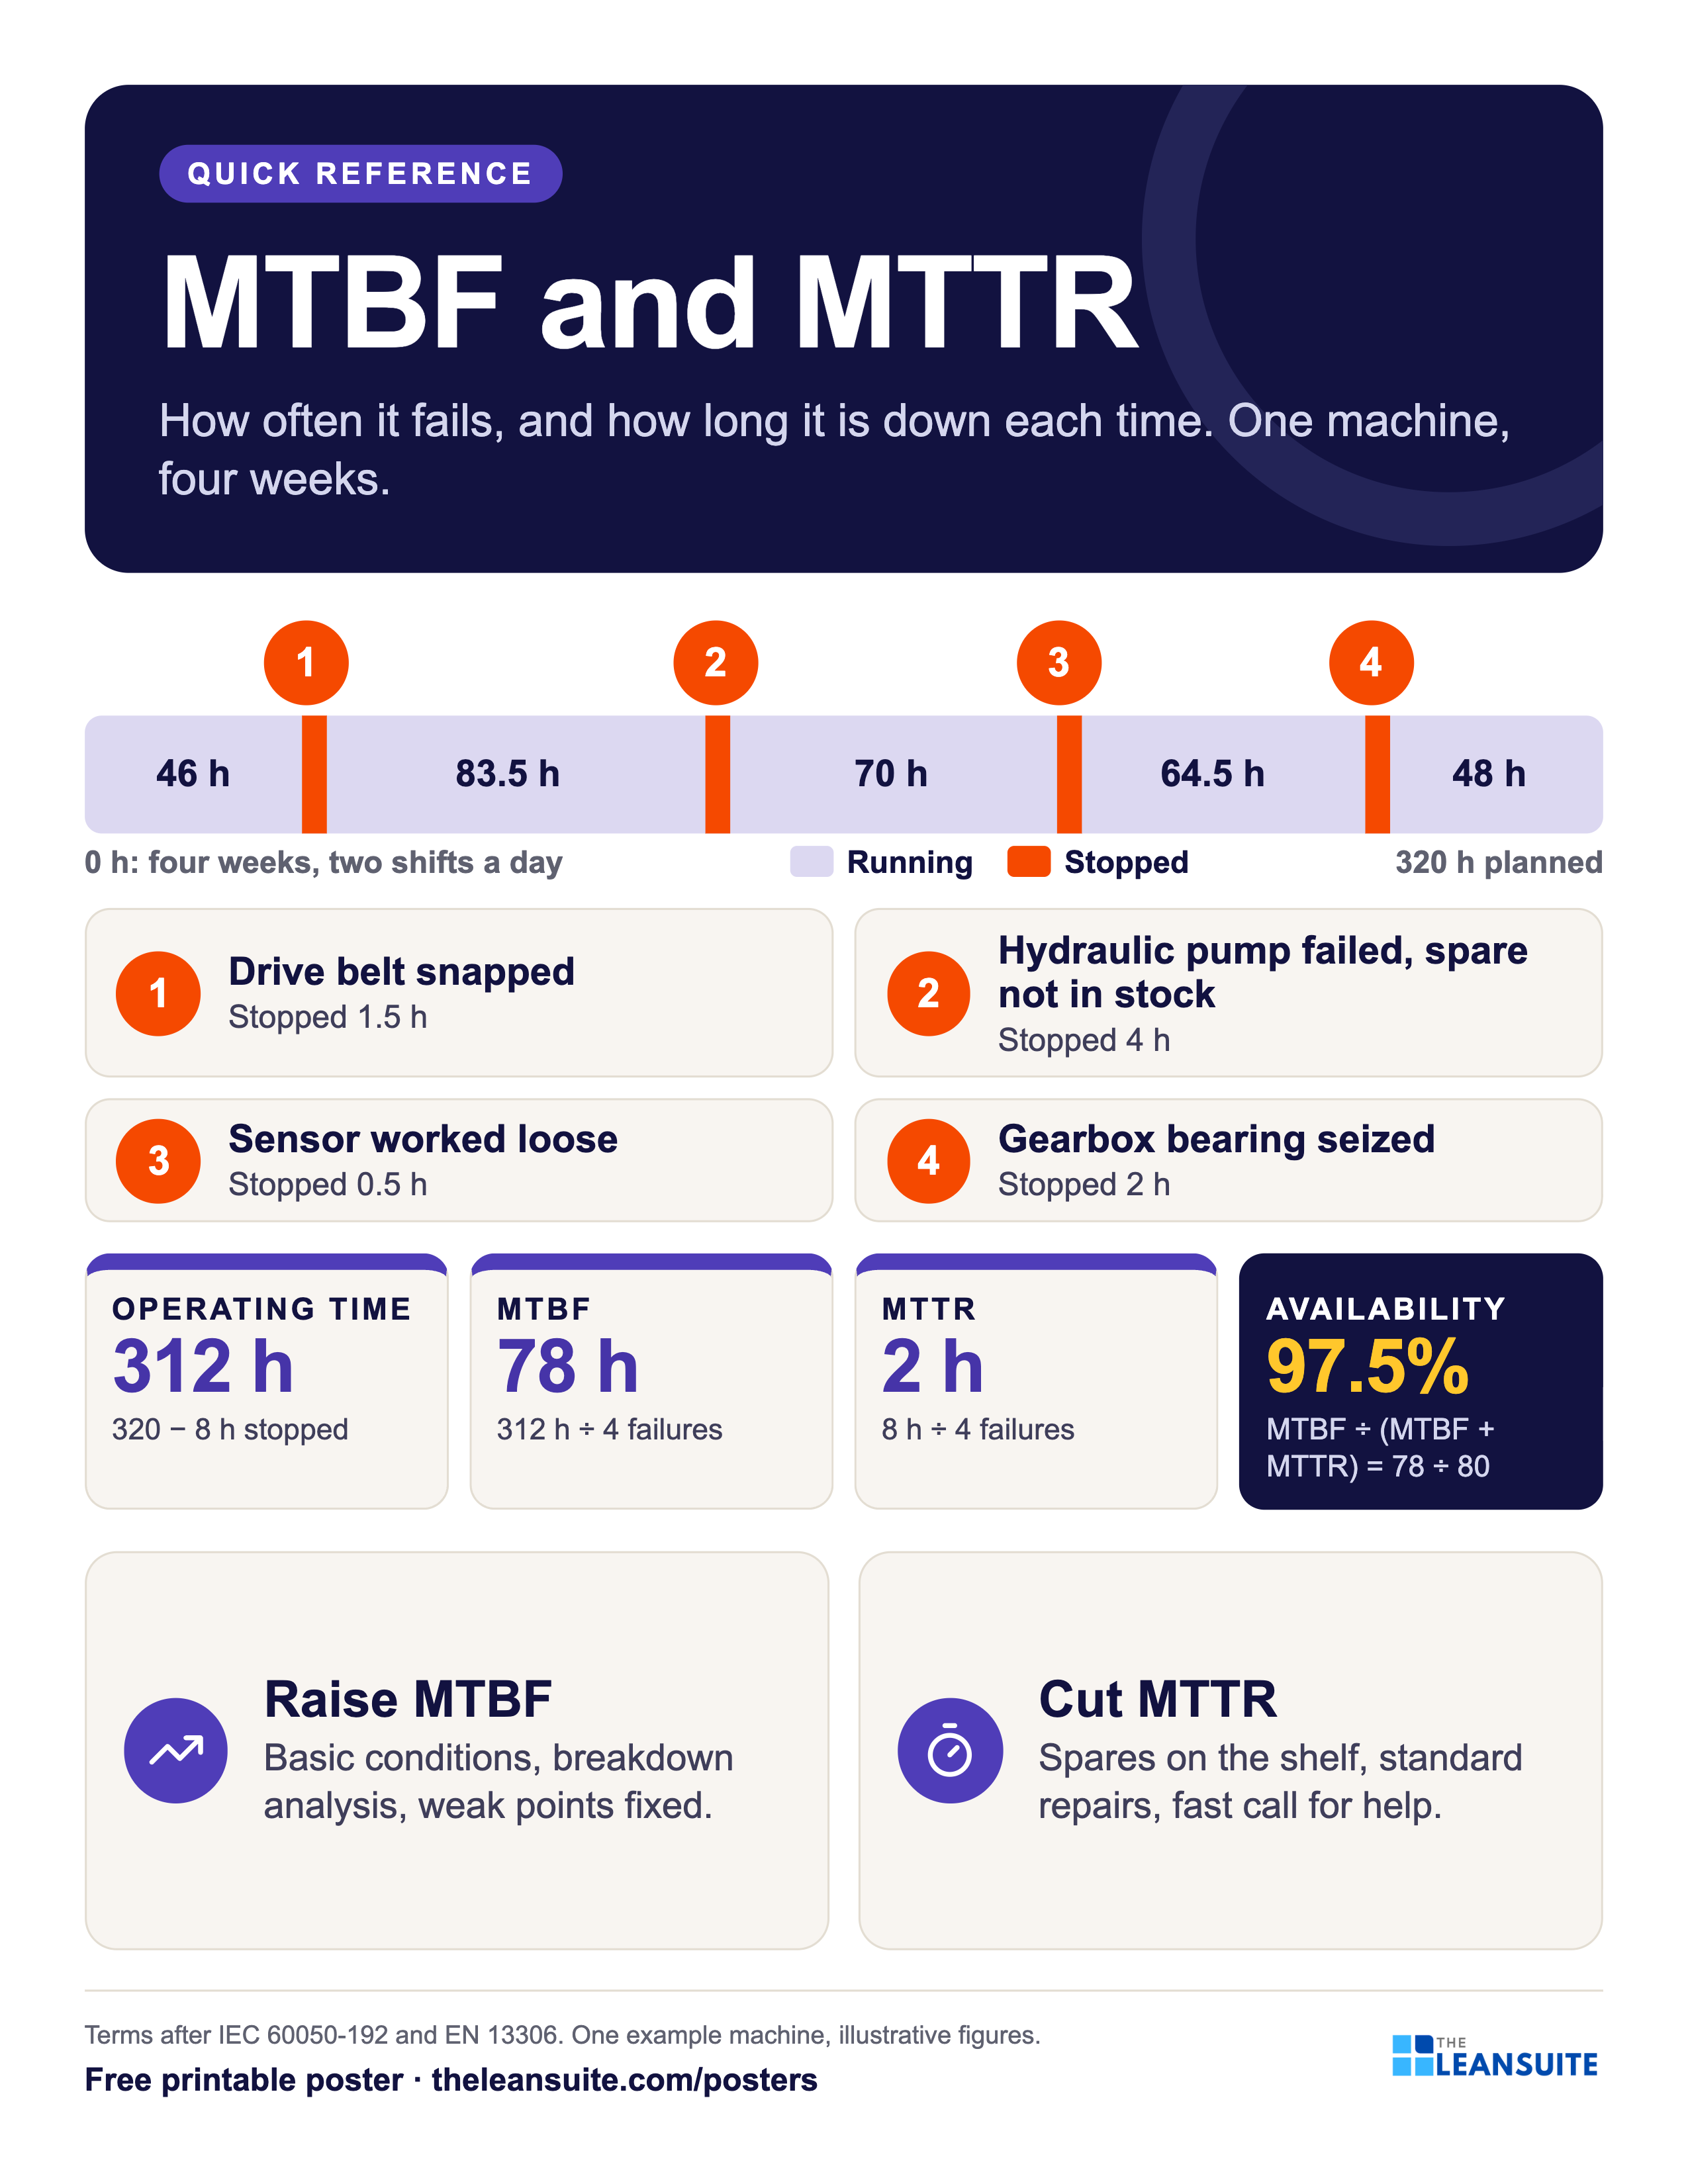
Mean time between failures (MTBF) is how long a machine runs, on average, between failures: operating time divided by the number of failures. Mean time to repair (MTTR) is how long, on average, it is stopped each time: total time stopped divided by the number of failures. Together they give availability, MTBF ÷ (MTBF + MTTR). This poster follows one machine over four weeks, 320 planned hours with four failures, on a timeline, works out each number, and lists what raises MTBF and what cuts MTTR.
Download the poster
The PNG is free to download now. The print-ready vector PDFs open after a short form, once.
Free to print and share with your team. Enter your name and work email once to download.
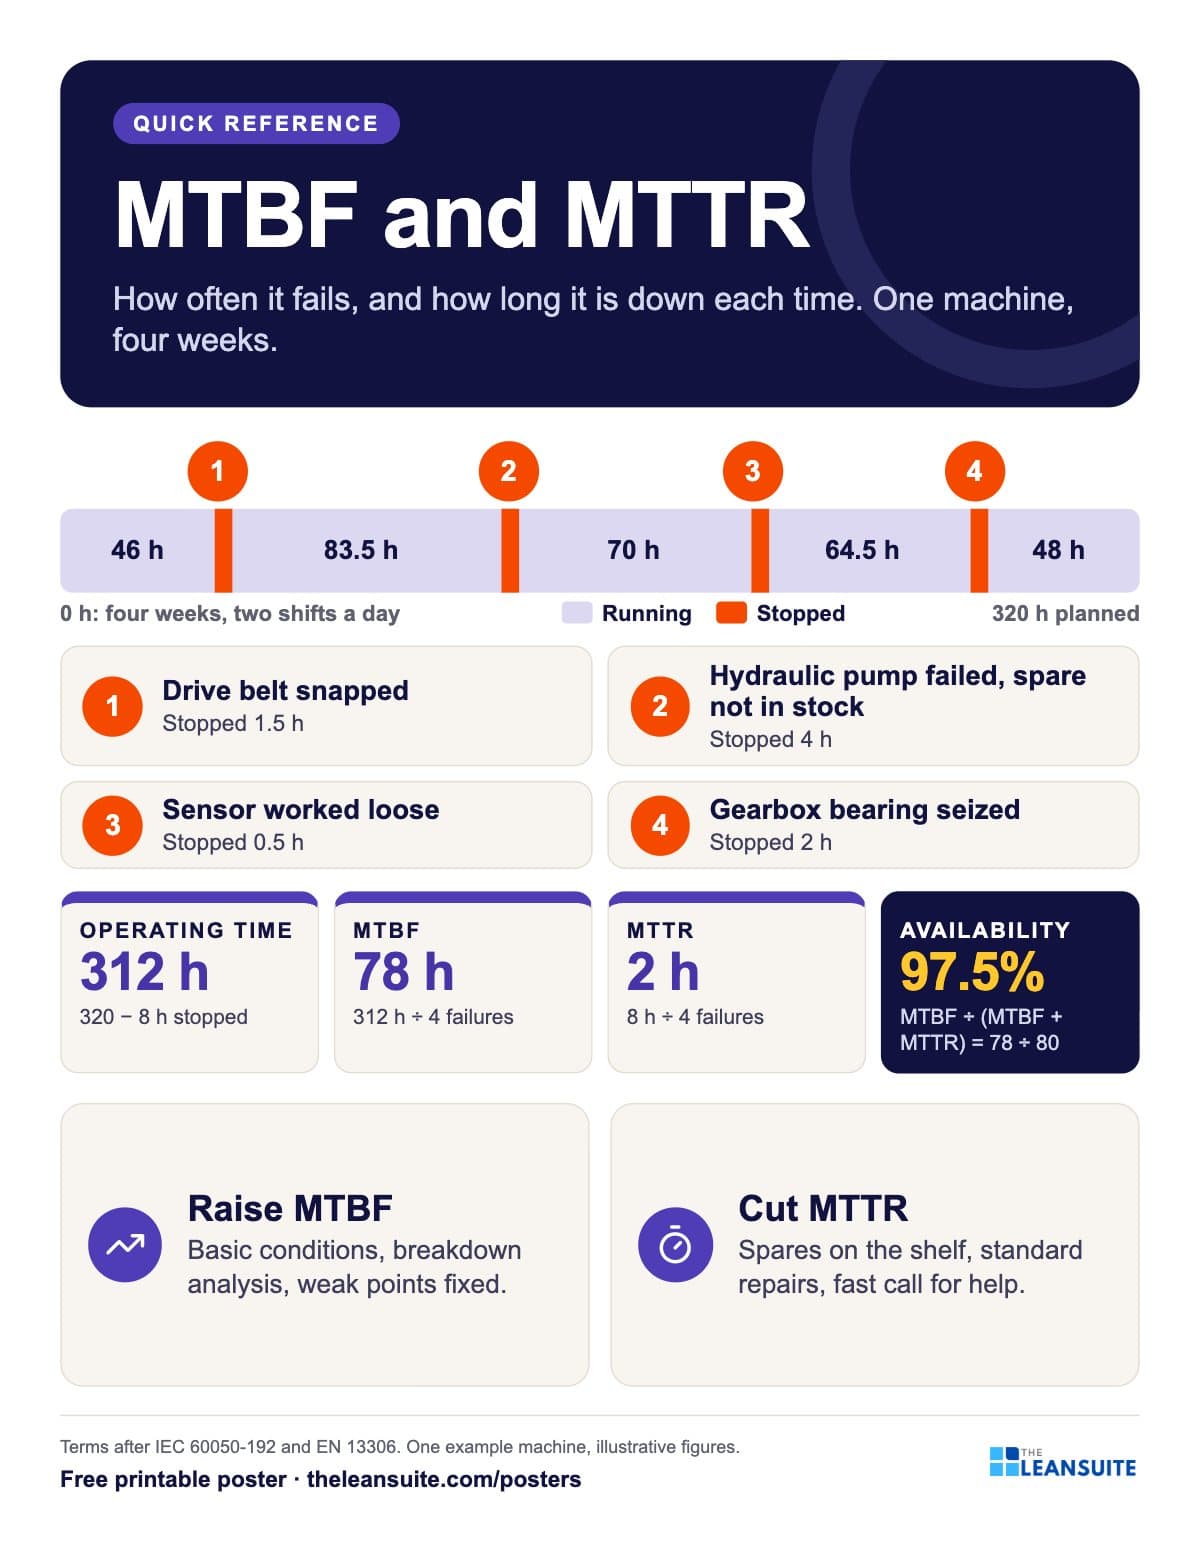 A four-week timeline of one machine with four numbered failures, then operating time, MTBF, MTTR and availability worked out.
The words on the poster
MTBF and MTTR
How often it fails, and how long it is down each time. One machine, four weeks.
One machine, four weeks, two shifts a day: 320 planned hours
- Failure 1 at hour 46: Drive belt snapped 1.5 h from stop to restart.
- Failure 2 at hour 131: Hydraulic pump failed, spare not in stock 4 h from stop to restart.
- Failure 3 at hour 205: Sensor worked loose 0.5 h from stop to restart.
- Failure 4 at hour 270: Gearbox bearing seized 2 h from stop to restart.
Worked out
- Operating time 312 h Planned time − time stopped = 320 − 8.
- MTBF 78 h Operating time ÷ number of failures = 312 ÷ 4.
- MTTR 2 h Time stopped ÷ number of failures = 8 ÷ 4.
- Availability 97.5% MTBF ÷ (MTBF + MTTR) = 78 ÷ 80, the same as operating time ÷ planned time.
- Raise MTBF Basic conditions, breakdown analysis, weak points fixed.
- Cut MTTR Spares on the shelf, standard repairs, fast call for help.
Terms after IEC 60050-192 and EN 13306. One example machine, illustrative figures.
On the floor
How to use it
Putting the MTBF and MTTR poster to work
- 1
Pin it by the maintenance KPI board, so MTBF and MTTR are read as hours of a real machine, not just numbers.
- 2
Use the worked month to teach how the numbers are calculated before anyone fills in a KPI tracker.
- 3
In the weekly review, ask which list a breakdown's fix belongs to: fail less often, or fix faster.
- 4
Pair it with the free maintenance KPI tracker and equipment downtime log.
Which size to print
- 24 x 36 in or A2: a main wall or team board, read from a few metres away.
- 18 x 24 in or A3: a station or notice board. The A3 file also fits 11 x 17 in paper.
- Letter or A4: a clipboard, binder or handout, on any office printer.
Every PDF is vector, so it stays sharp at full size. Nothing runs to the edge of the page, so no bleed is needed.
Sources and notes
The machine on the poster is a worked example with illustrative figures. MTTR here counts every hour from stop to restart, including waiting for people and parts, so availability = MTBF ÷ (MTBF + MTTR) equals operating time ÷ planned time. Some plants count only the hands-on repair time in MTTR, and some work MTBF out from total time rather than operating time; say which you use.
- IEC 60050-192, International Electrotechnical Vocabulary, part 192: dependability (mean operating time between failures, mean time to restoration).
- EN 13306:2017, Maintenance: maintenance terminology.
Templates, decks and guides to go with it
- TPM training presentation: the 8 pillarsFree training deck: What TPM is, the six big losses, OEE and the 8 pillars, in 19 slides with a loss-spotting activity.
- Maintenance KPI trackerMTBF, MTTR, availability and PM compliance per asset and month, plant figures from the totals, planned maintenance % and backlog in weeks.
- Equipment downtime log (MTTR and MTBF)A breakdown and downtime log, with MTTR, MTBF and downtime by machine and cause worked out in Excel.
- Machine history record templateOne record per machine: components and their life, every breakdown and repair with cost, MTBF and MTTR, and a repair-or-extend check.
- Breakdown analysis reportOne equipment breakdown from the stop to the 90-day check, plus a breakdown log with repeat flags, MTBF and MTTR by asset and a Pareto of causes.
- Topic: TPM and maintenanceEvery guide we have on the subject, sorted.
A poster reminds. A routine makes it stick.
See how plants run their audits, improvements and follow-ups in LeanSuite, on a call built around your own problem.
Book a 45-minute demo