

Free template
Spaghetti diagram template
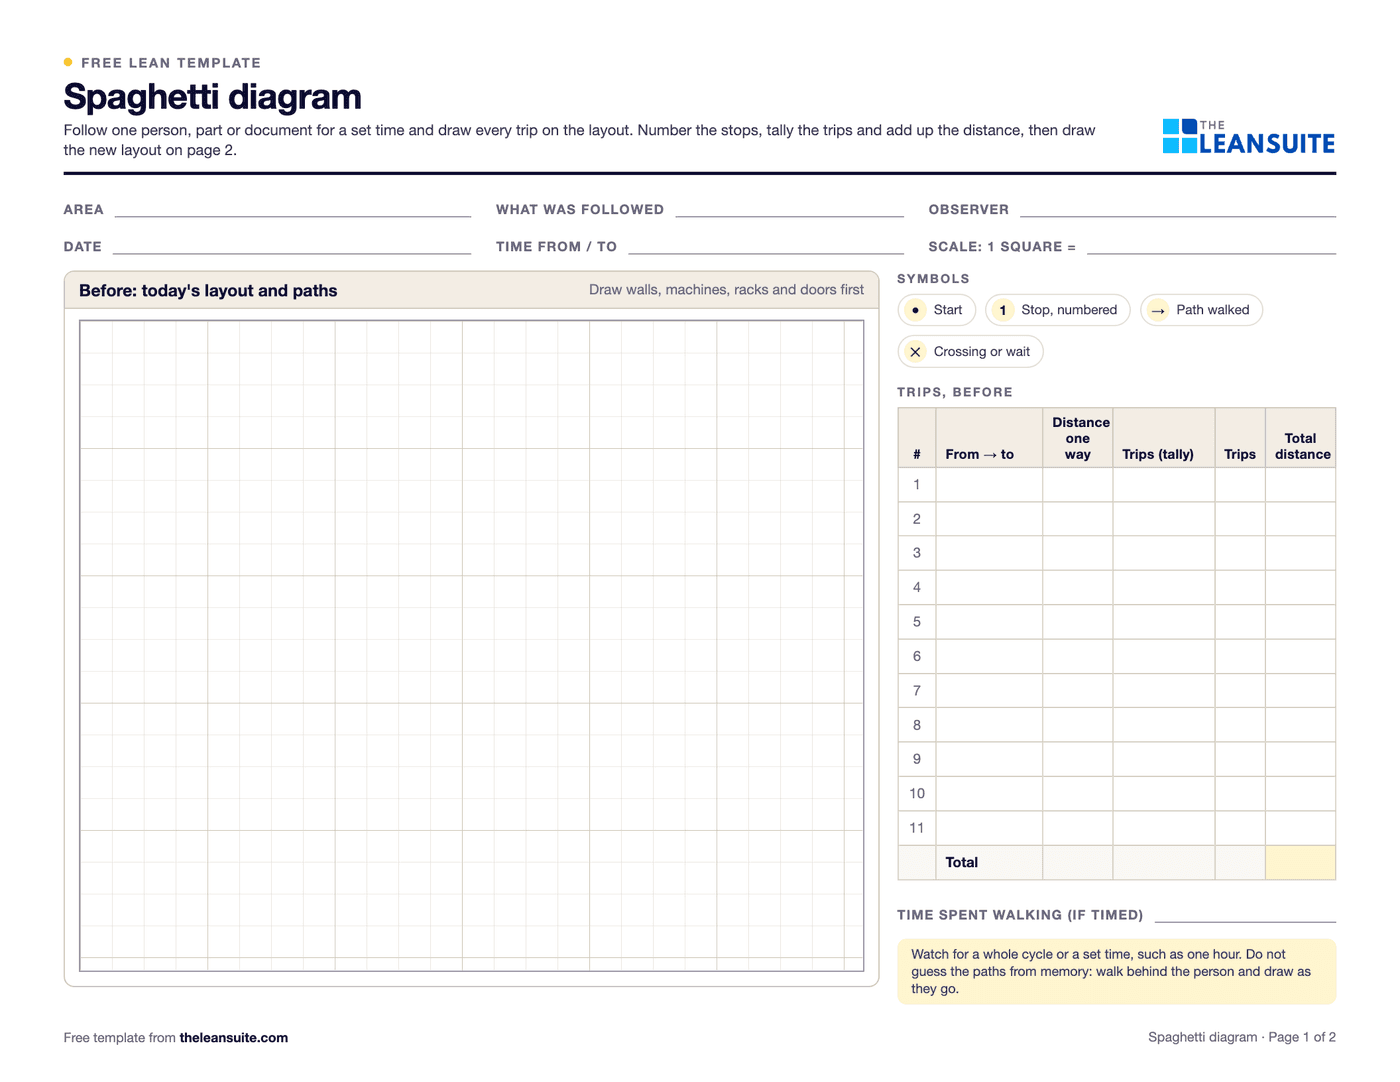
A spaghetti diagram is a drawing of the path a person, a part or a document takes through a work area, traced on the layout as it happens. The tangle of lines shows how much walking and transport the process needs, where paths cross and where the layout makes people double back. This template has a before page with squared paper for the current layout, a key to the symbols and a tally of trips and distances, and an after page for the new layout with a before and after comparison of distance, trips, stops, walking time and crossings.
Free to use: print it, copy it and edit it for your team. Enter your name and work email once to download.
When to use it
When to use a spaghetti diagram
- When operators or material handlers seem to walk a lot, or a job takes longer than the work in it.
- Before a layout change, to see the current paths, and after it, to measure the difference.
- On a waste walk, to show motion and transport waste with evidence rather than opinion.
- Alongside a value stream map or a time study, to show where the walking happens.
How to fill it in
- 1
Choose what to follow
One person, one part or one document, for a whole cycle or a set time such as an hour. Write it and the time on the sheet.
- 2
Draw the layout
Sketch the walls, machines, benches, racks and doors on the squared paper, and write the scale: one square equals so many feet or meters.
- 3
Trace every trip
Walk behind the person and draw each move as it happens, numbering the stops. Do not draw from memory.
- 4
Tally the trips and distances
For each path, write the distance one way, tally the trips and multiply. Add up the total distance and the number of trips.
- 5
Redesign and trace again
Draw the new layout on page 2, try it, then trace the same person or part for the same length of time.
- 6
Compare
Fill in the before and after table: distance, trips, stops, walking time and crossings.
A filled-in example
Illustrative, not a benchmarkAn example: a spaghetti diagram of one operator in a kitting area over one hour, at a scale of one square to three feet.
- 14 trips, most of them to a label printer and a parts rack at opposite ends of the area.
- About 1,100 feet of walking in the hour, with four places where the path crossed a forklift aisle.
- New layout: the printer moved next to the packing bench, and the fastest-moving parts moved to a rack beside it.
- Traced again for an hour: 6 trips, about 380 feet and no crossings of the forklift aisle.
The walking in the hour fell by roughly two thirds and the crossings with forklift traffic went away. The team wrote the new layout into the area's standard work.
Common mistakes
Drawing from memory
People forget the short trips and the double-backs. Trace it live.
No scale
Without a scale the distances are guesses. Pace out one wall and set the squares from it.
Following something different before and after
Compare the same person or part, the same task and the same length of time, or the comparison means little.
Stopping at the drawing
The value is in the new layout. Use the diagram to decide what to move.
Blaming the walker
The paths come from the layout and the process. Change those, not the person.
Download the template
Free to use: print it, copy it and edit it for your team. Enter your name and work email once to download.
Run this template in LeanSuite
LeanSuite builds a current-state value stream map from phone video of each process step, with measured cycle times, the inventory between steps and the lead time, and lets you branch it into a future state to compare side by side.
In the lean glossary
Free tools
FAQ
Spaghetti diagram template: common questions
More free templates
All templates- 5S audit checklist template25 checks, five per S, scored 1 to 5, with a score summary and a chart of the five S's.
- Gemba walk checklistA walk plan and route, 30 prompts in six groups and a findings table with owners and due dates.
- Leader standard work templateA team leader's daily, weekly and monthly routine with a box per day, follow-ups and a weekly review.
- Autonomous maintenance (CILR) checklist20 clean, inspect, lubricate and retighten checks with a box per day, an abnormality log and sign-off.
- A3 problem solving templateThe standard seven-box A3 on one landscape sheet, from background to follow-up.
- PDCA templateOne improvement cycle on one landscape page: plan, do, check against the goal, then standardize or adjust.
- 5 Whys templateA problem statement, five why rows with evidence, the root cause and the countermeasure.
- 5W1H templateSix questions with prompts and evidence, turned into a problem statement before the root cause analysis.
- 8D report templateD0 to D8 on three pages: team, is/is not, containment, occurrence and escape causes, actions and closure.
- Poka-yoke worksheetEach step's possible errors, prevention or detection, the method, a device idea and a verified box.
- Skills matrix templatePeople by skills, a 0 to 4 scale, a training column and a coverage row that shows the gaps.
- Standard work sheet templateTakt time, each element's manual, machine and walk time on a time chart, key points and standard WIP.
- One point lesson (OPL) templateOne topic on one page: wrong way and right way pictures, key points, why it matters and a sign-off record.
- SMED changeover worksheetChangeover steps with times, internal or external, what can move, ideas and before/after totals.
- Kaizen event charter templateScope, team and roles, baseline and target metrics, a five-day schedule, risks and sign-off.
- RACI matrix template17 kaizen project tasks by 10 roles, with R, A, C, I drop-downs and a check for one accountable per task.
- Layered process audit (LPA) checklist20 yes, no or N/A checks at the station, a fixed-on-the-spot box, scores by group and a findings table.
- PFMEA template (process FMEA)Failure modes, effects and causes rated for severity, occurrence and detection, with RPN before and after action.
- 5S red tag log and red tagsA log of every red-tagged item with its decision, and six printable red tags to cut out.
- Shift handover templateProduction against plan, safety, quality, equipment, materials and people, and the open issues the next shift takes over.
- Kanban card templateSix production and six withdrawal kanban cards to print and cut out, with loop sizing and a card register.
- Pareto chart templateA tally sheet, the categories sorted largest first with cumulative %, and the chart. Excel does the sorting and drawing.
- Control plan templateWhat is checked at each step, against which limits, how, how often, and what to do when a result is out.
- Corrective action request (CAPA) formProblem, containment, root cause, corrective and preventive action, and proof the fix worked, on two pages.
- Idea suggestion formA one-page idea form with the supervisor's answer and points, and an idea log that tracks days to answer.
- Just Do It (JDI) card templateSix Just Do It cards per sheet for quick fixes, with the rules for what counts and a log of every card.
- Quick kaizen templateOne page for a small improvement: before and after, the cause, the countermeasure, the results and whether the standard changed.
- Time study sheetTime each element over 10 cycles and work out the average, lowest repeatable and standard time. Excel does the sums.
- OEE tracking sheetOne row per shift for a week. The Excel version works out availability, performance, quality and OEE and charts the week.
- Near miss report formA two-page near miss report from the first report to closure, and an Excel log with status and days open.
- Safety observation card templateFour behavior-based safety cards per sheet, with safe and at-risk checks, the conversation and a tally sheet.
- Job safety analysis (JSA) templateJob steps, hazards, risk scored before and after the controls, the hierarchy of controls, PPE and sign-off.
- Risk assessment matrix template (5×5)A color-coded 5 × 5 severity and likelihood matrix, a scoring guide and a risk register.
- Incident investigation report templateWhat happened, people, evidence and timeline, root cause with 5 Whys and contributing factors, actions and sign-off.
- Toolbox talk templateA record of a short safety talk: topic, key points, questions raised, actions and an attendee sign-in sheet.
- Lockout/tagout (LOTO) procedure templateA machine-specific LOTO procedure: energy sources and isolation points, the steps from shutdown to restart, and the annual review.
- Forklift inspection checklist23 pre-shift checks for a week on one page, a do-not-operate rule, and a defect and repair log.
- Non-conformance report (NCR) formA two-page NCR from the requirement against what was found to disposition and closure, and an Excel NCR log.
- CAPA log templateAn Excel CAPA tracker with status, days open, late flags and counts by source, plus a printable log and monthly review.
- Supplier corrective action request (SCAR) formA SCAR from the problem and containment asked for to the supplier's 8D-style response, verification and closure.
- First article inspection (FAI) report templatePart information, a ballooned characteristic table with tolerances and results, material and process certificates, and sign-off.
- Preventive maintenance checklist templateA PM checklist per machine with readings and sign-off, and a PM schedule that works out the next due date.
- Equipment downtime log (MTTR and MTBF)A breakdown and downtime log, with MTTR, MTBF and downtime by machine and cause worked out in Excel.
- Environmental aspects and impacts registerAn ISO 14001-style register of aspects and impacts, with significance scoring, legal requirements, controls and owners.
- Manufacturing process instruction (MPI) templateOperation steps with parameters, tools, quality checks, safety and a photo each, plus revision history and approval.
- Engineering process instruction (EPI) templateScope, parameters and limits, equipment and materials, validation steps, acceptance criteria, change history and approvals.
- Training sign-off sheetAn attendance and sign-off record where each person signs they understood, with a competence check and an Excel log.
- On-the-job training (OJT) checklistA job breakdown and the four TWI Job Instruction steps with sign-offs, the tries and the date the trainee qualified.
- New hire onboarding checklist (manufacturing)29 onboarding items from before day 1 to the 90-day review, with owners, dates and review notes.
- Competency assessment formEach task rated 0 to 4 on the skills matrix scale with the evidence seen, then the gaps and a training plan.
- Cross-training plan templateWho is learning which task, from and to which level, by when, and how many are qualified on each task.
- Absenteeism tracker templateA monthly attendance grid with codes, absence rate by person and team, and an optional Bradford factor.
Can't find the template you need?
Tell us what you're looking for. We'll make it and send it to your inbox, free.
A shift handover sheet, a red tag log, a changeover checklist for one machine: if your team uses it on the floor, ask.