

Quality poster
Updated · Free to print and share
Histogram shapes poster
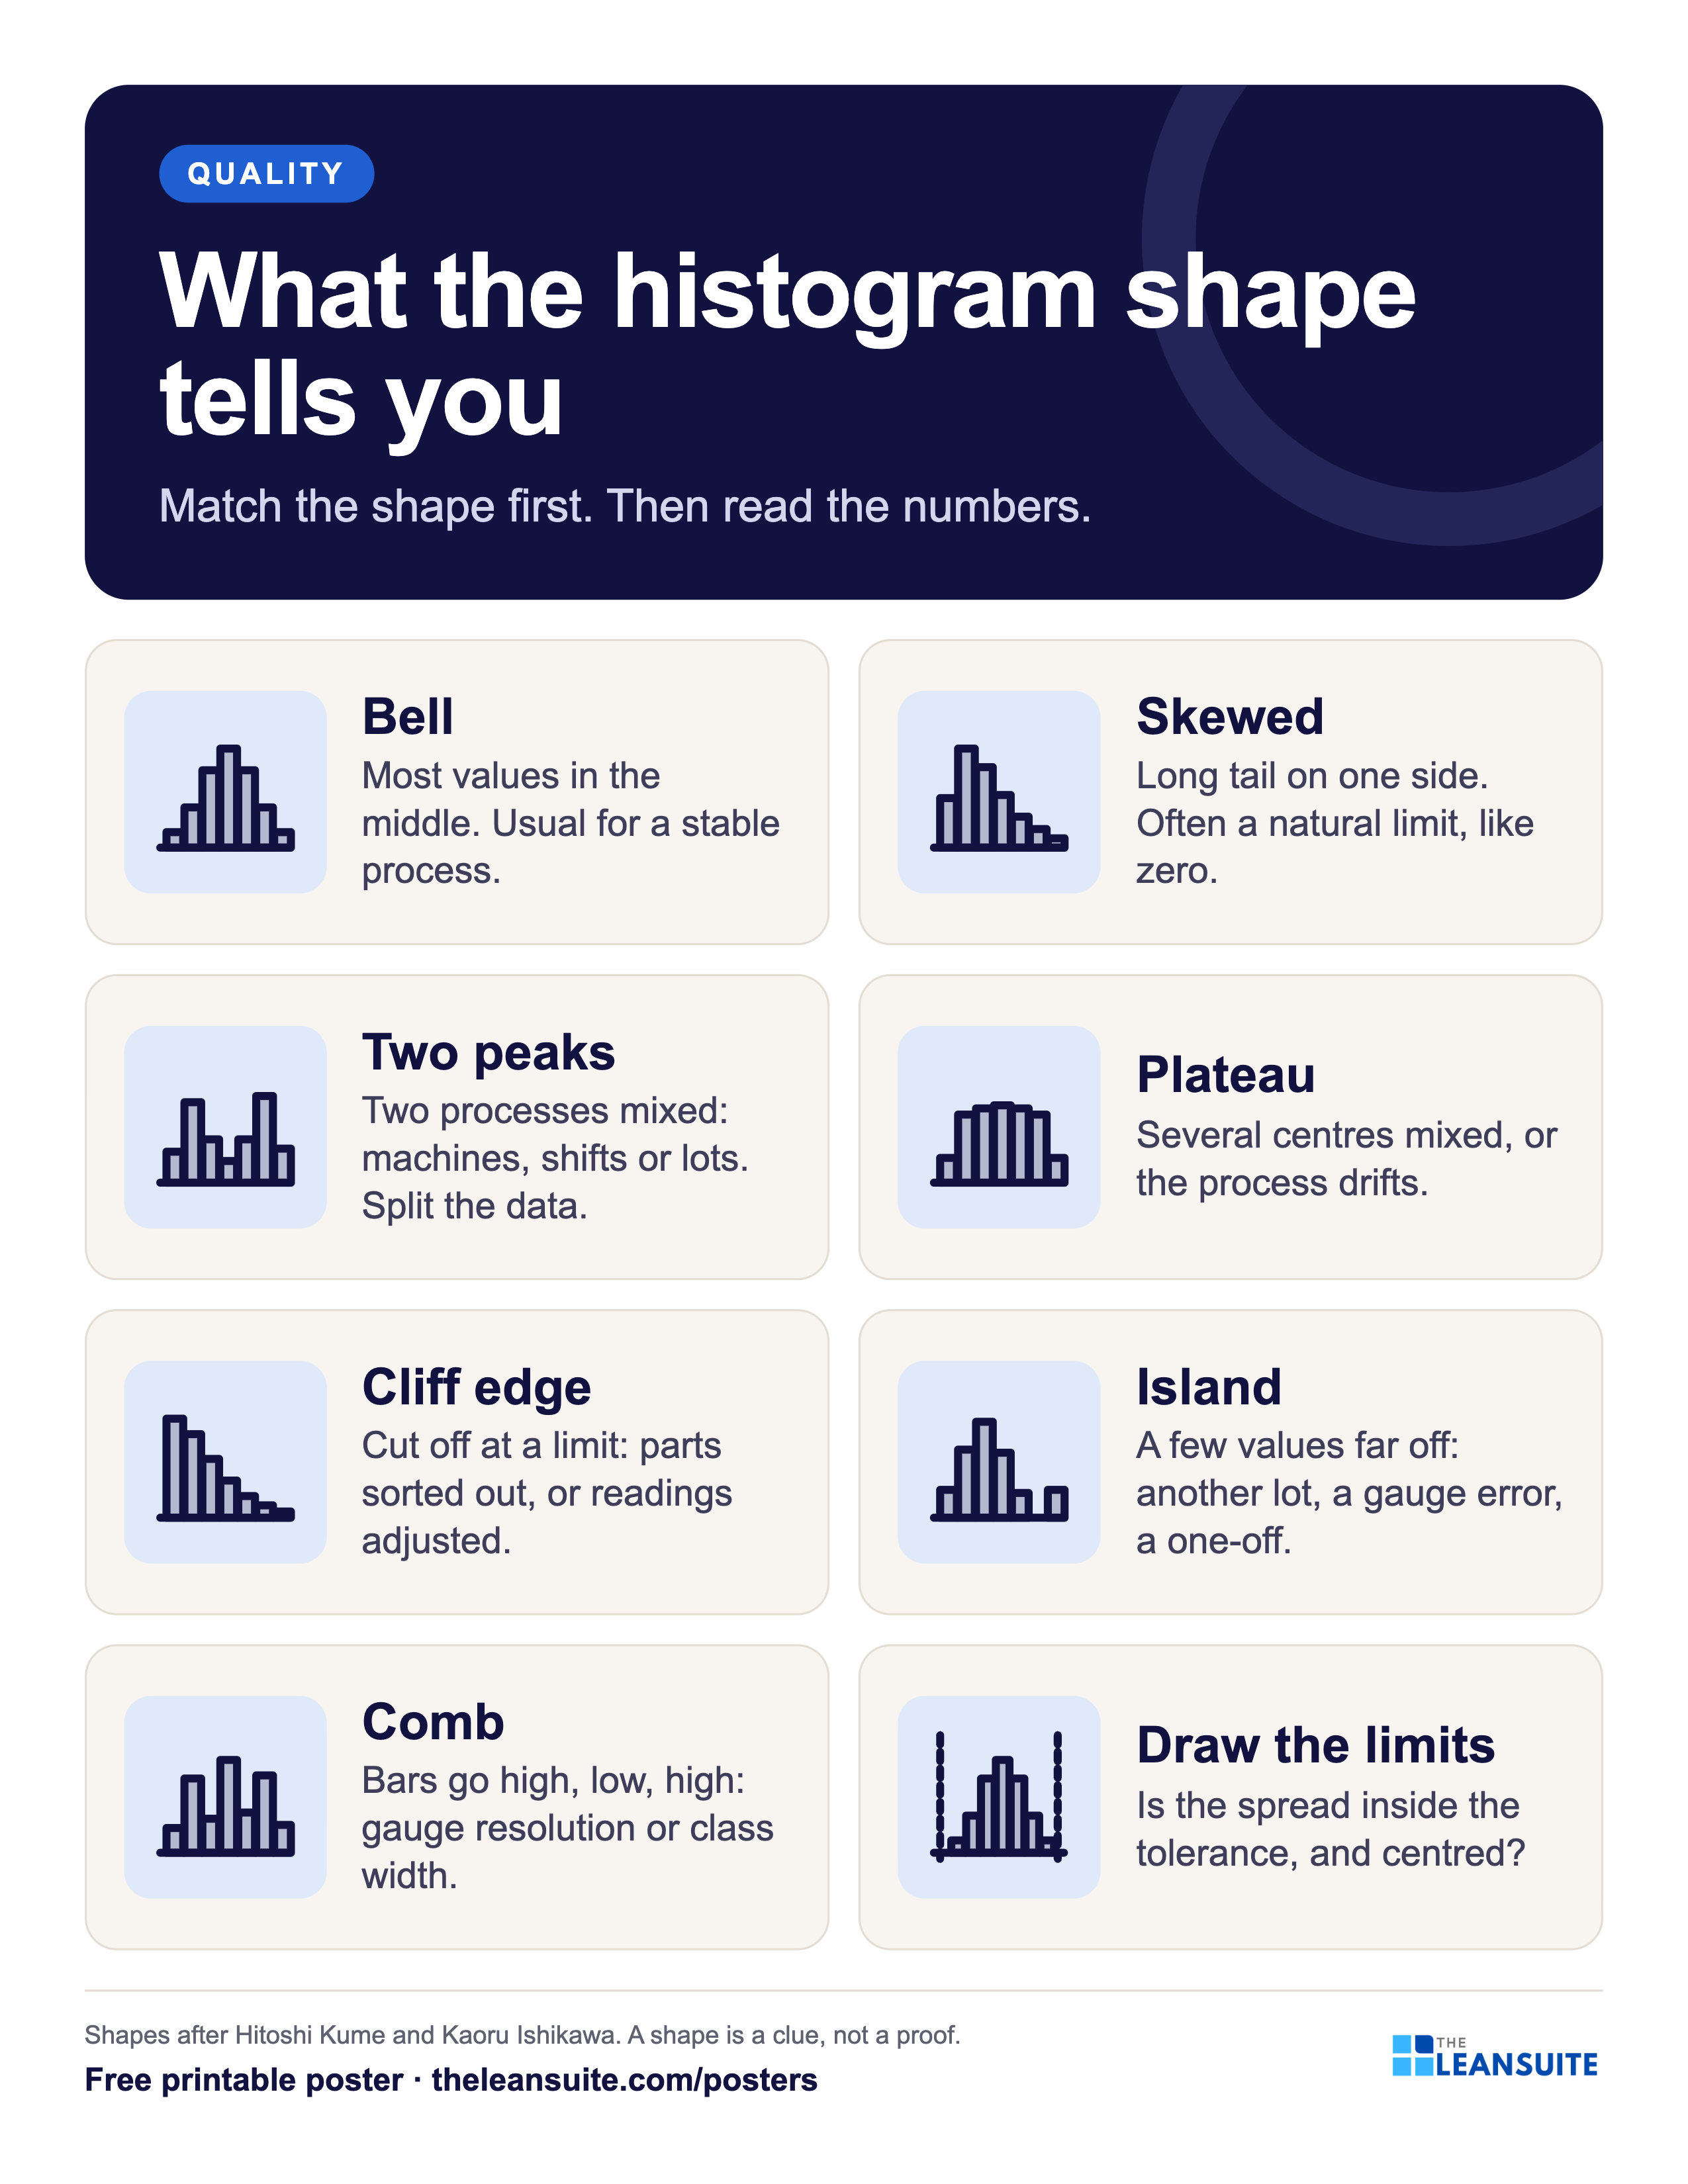
A histogram shows how a measurement is spread: where most values sit, how wide the spread is and whether it fits the tolerance. Its shape is a clue to the process behind it. Two peaks usually mean two processes mixed; a cliff edge often means parts were sorted or readings adjusted; a comb points at the gauge or the class width. This poster draws seven common shapes with what each usually means, and a reminder to draw the limits.
Download the poster
The PNG is free to download now. The print-ready vector PDFs open after a short form, once.
Free to print and share with your team. Enter your name and work email once to download.
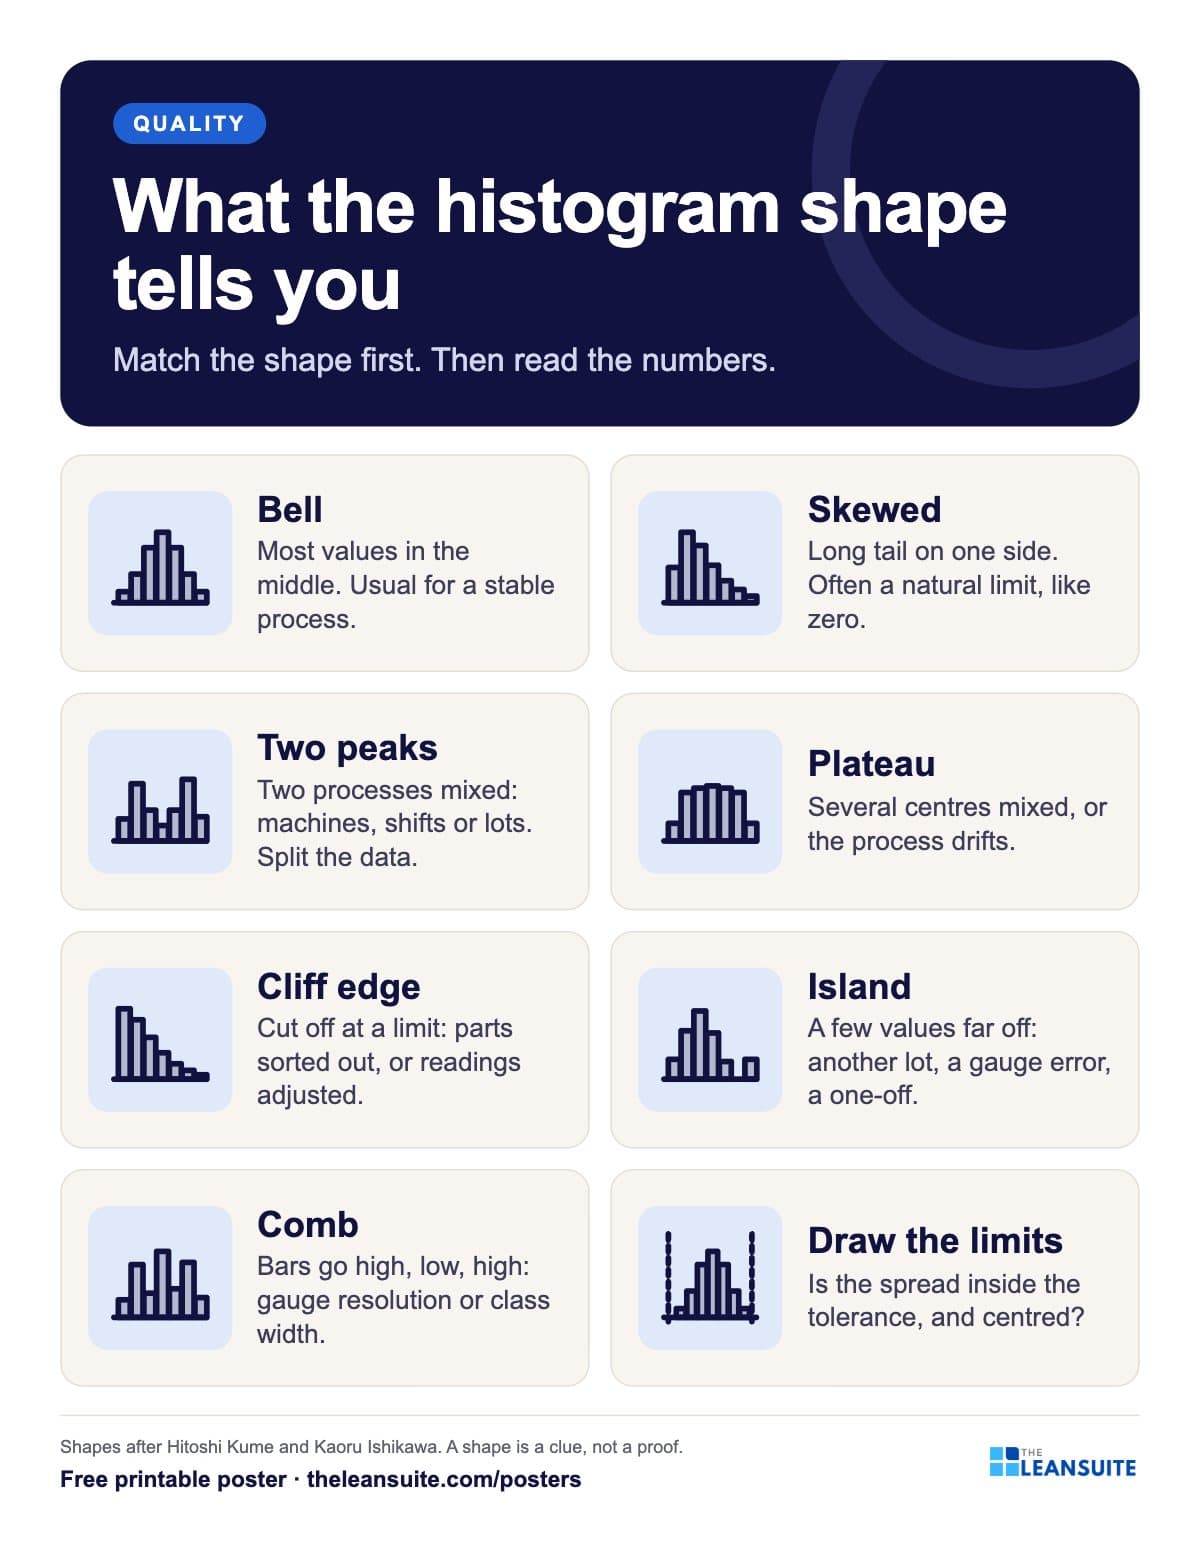 Seven small histograms (bell, skewed, two peaks, plateau, cliff, island, comb) with what each means, and one with the limits drawn.
The words on the poster
What the histogram shape tells you
Match the shape first. Then read the numbers.
- Bell Most values in the middle. Usual for a stable process.
- Skewed Long tail on one side. Often a natural limit, like zero.
- Two peaks Two processes mixed: machines, shifts or lots. Split the data.
- Plateau Several centres mixed, or the process drifts.
- Cliff edge Cut off at a limit: parts sorted out, or readings adjusted.
- Island A few values far off: another lot, a gauge error, a one-off.
- Comb Bars go high, low, high: gauge resolution or class width.
- Draw the limits Is the spread inside the tolerance, and centred?
Shapes after Hitoshi Kume and Kaoru Ishikawa. A shape is a clue, not a proof.
On the floor
How to use it
Putting the Histogram shapes poster to work
- 1
Hang it where histograms and capability studies are reviewed.
- 2
When a histogram is drawn, match its shape to a card before reading the numbers.
- 3
Two peaks or a plateau: split the data by machine, shift or lot and draw it again.
- 4
Pair it with the free histogram template and Cpk study sheet.
Which size to print
- 24 x 36 in or A2: a main wall or team board, read from a few metres away.
- 18 x 24 in or A3: a station or notice board. The A3 file also fits 11 x 17 in paper.
- Letter or A4: a clipboard, binder or handout, on any office printer.
Every PDF is vector, so it stays sharp at full size. Nothing runs to the edge of the page, so no bleed is needed.
Sources and notes
- Shape types after Hitoshi Kume, Statistical Methods for Quality Improvement (AOTS, 1985) and Kaoru Ishikawa, Guide to Quality Control.
Templates, decks and guides to go with it
- Histogram templateReadings, bins set by the square root rule, a tally and counts, the spec limits drawn and the share out of spec, with the common shapes explained.
- Process capability (Cpk) study sheet25 subgroups of readings with Cp, Cpk, Pp and Ppk worked out, control limits to check stability, and a histogram.
- Defect check sheetTally defects by type and day, with units inspected, defect rates, a location sheet and the week's Pareto.
- Topic: Quality managementEvery guide we have on the subject, sorted.
Terms on this poster
More quality posters
All posters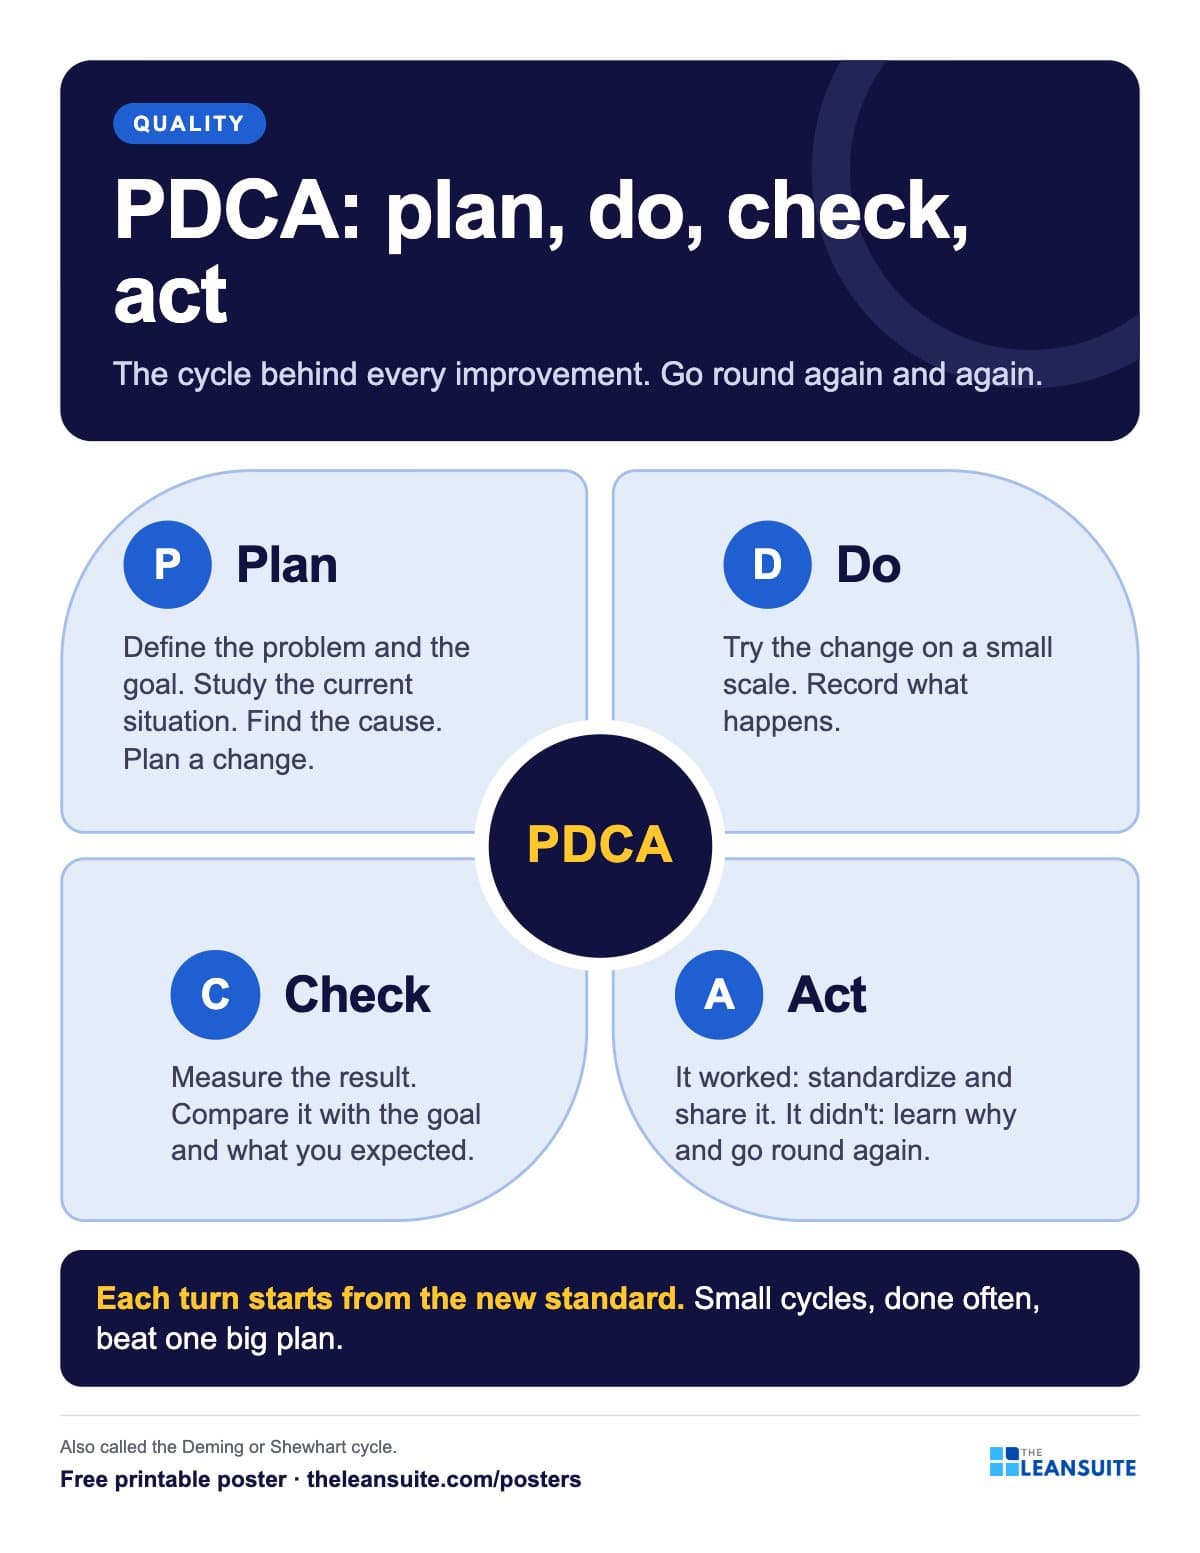 PDCA cycle poster
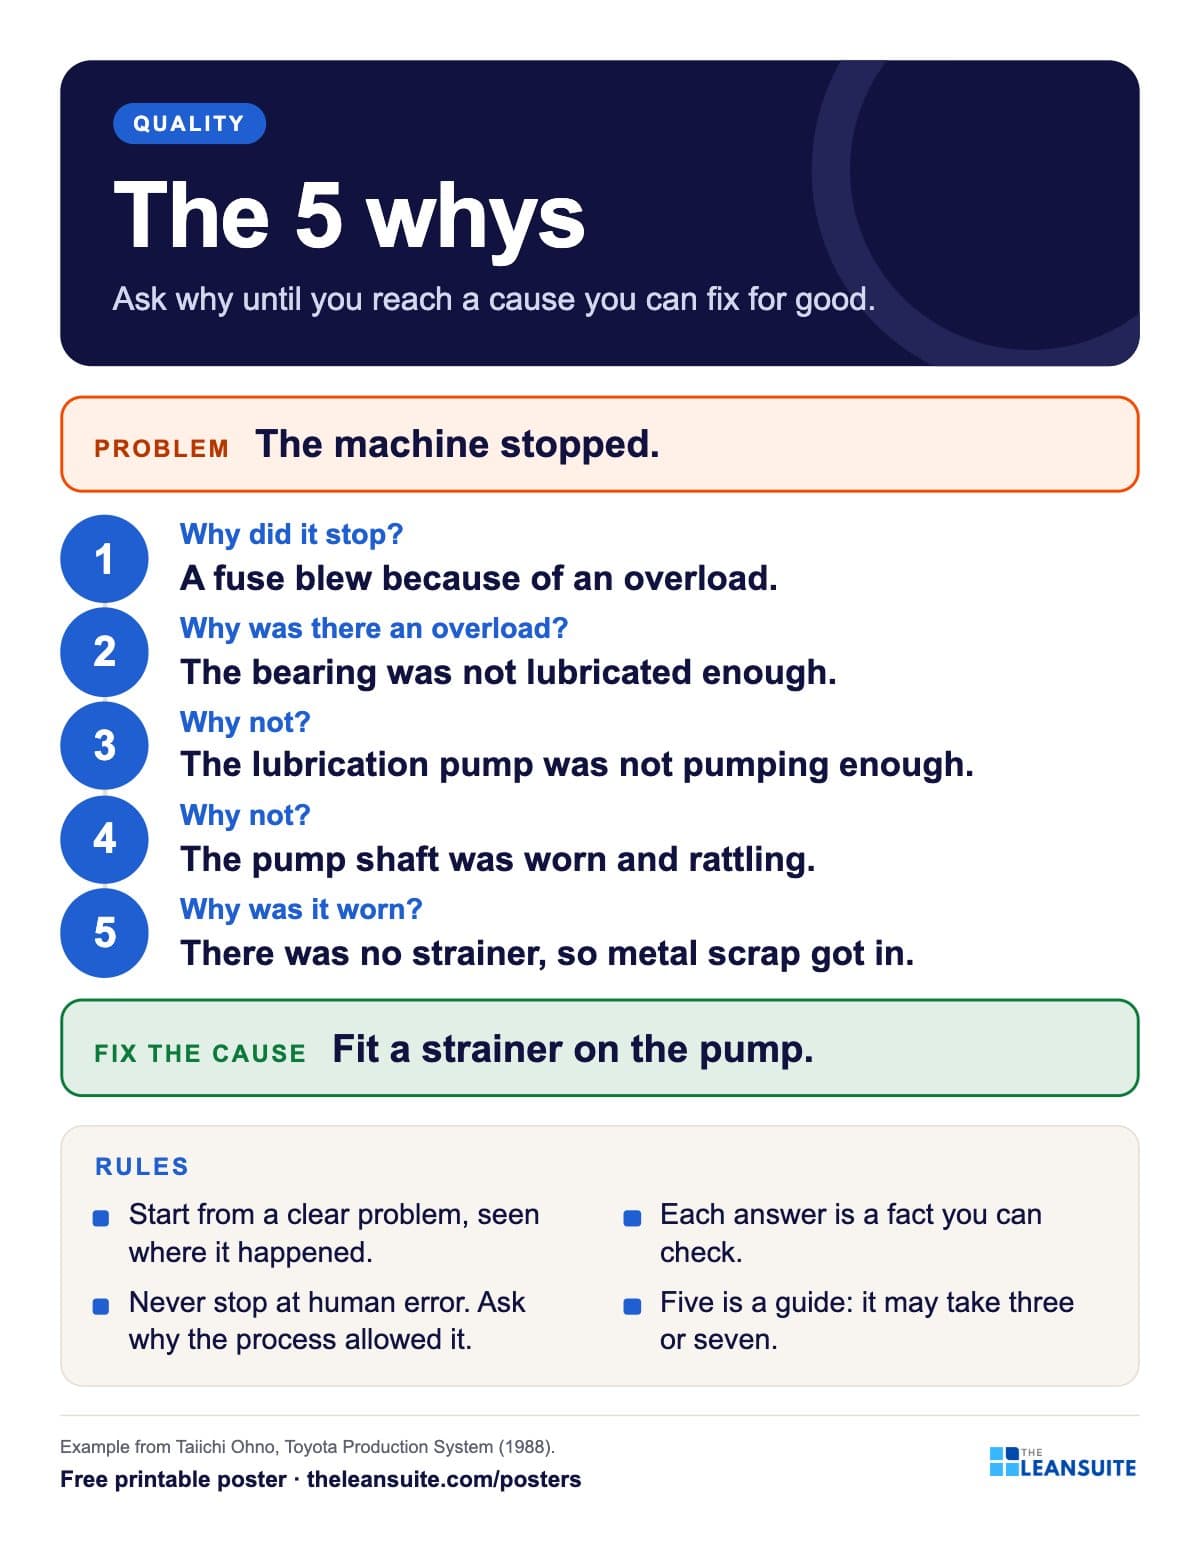 5 whys poster
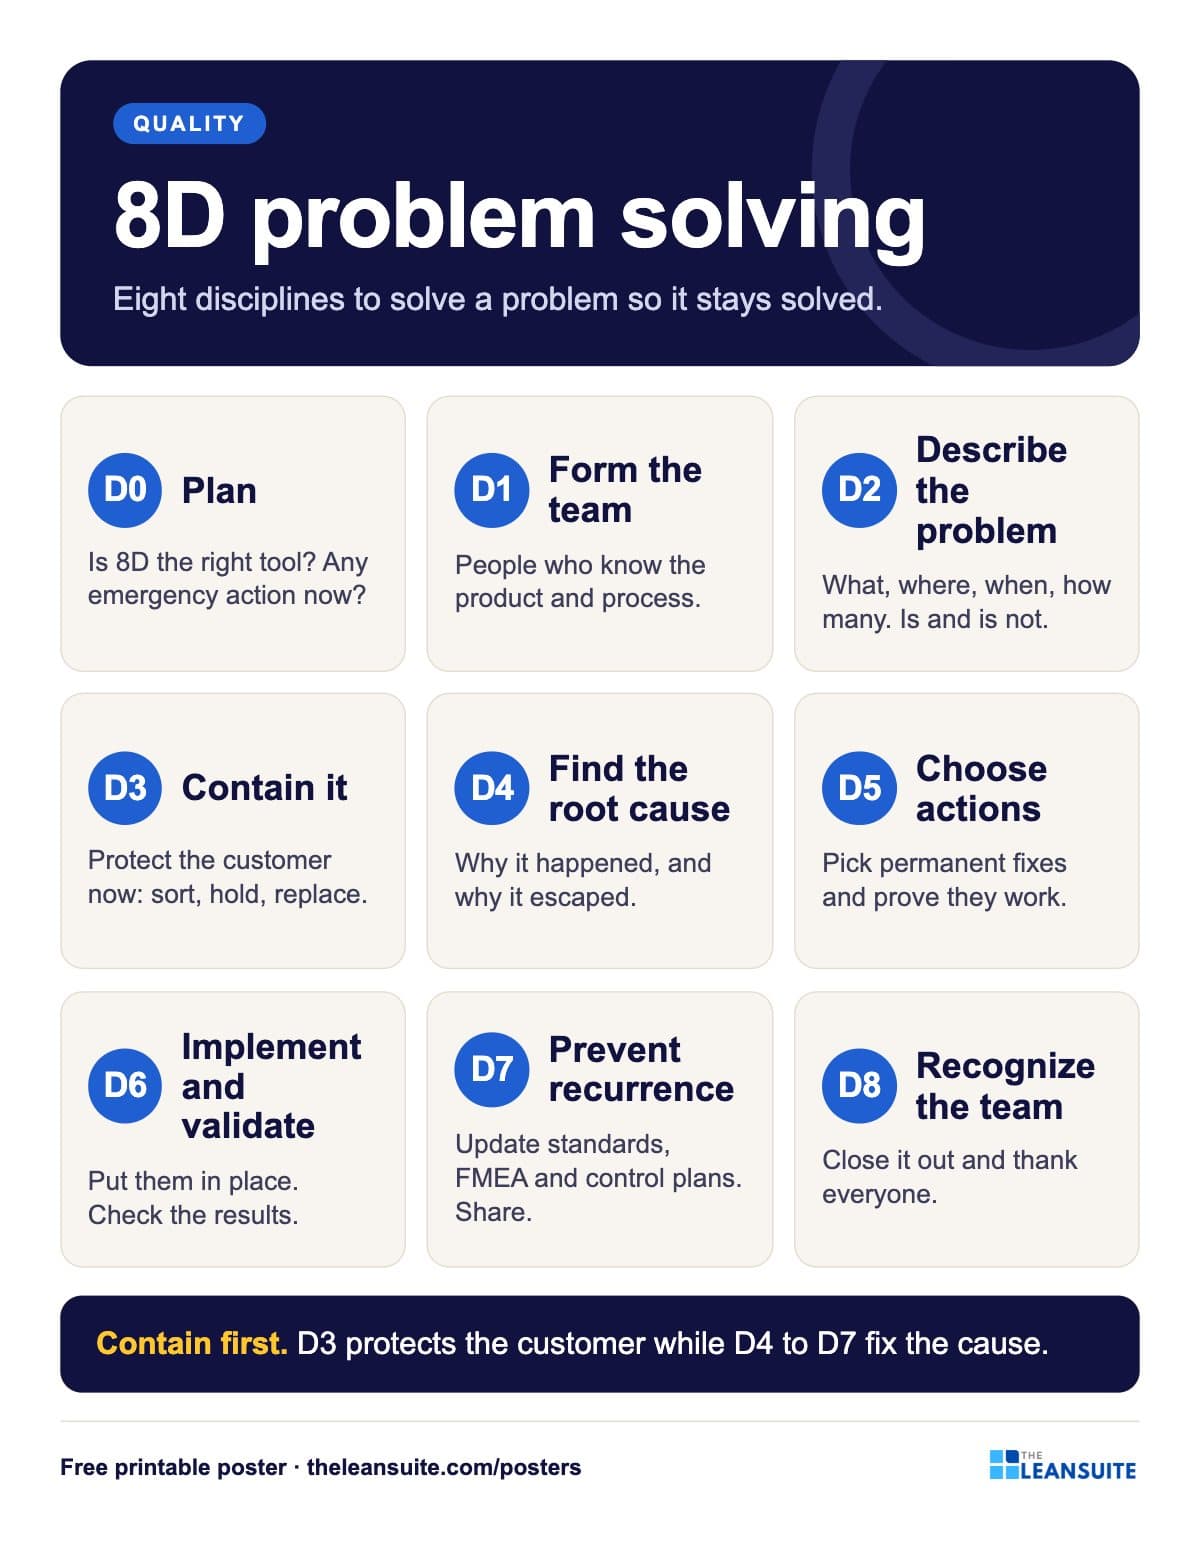 8D problem solving poster
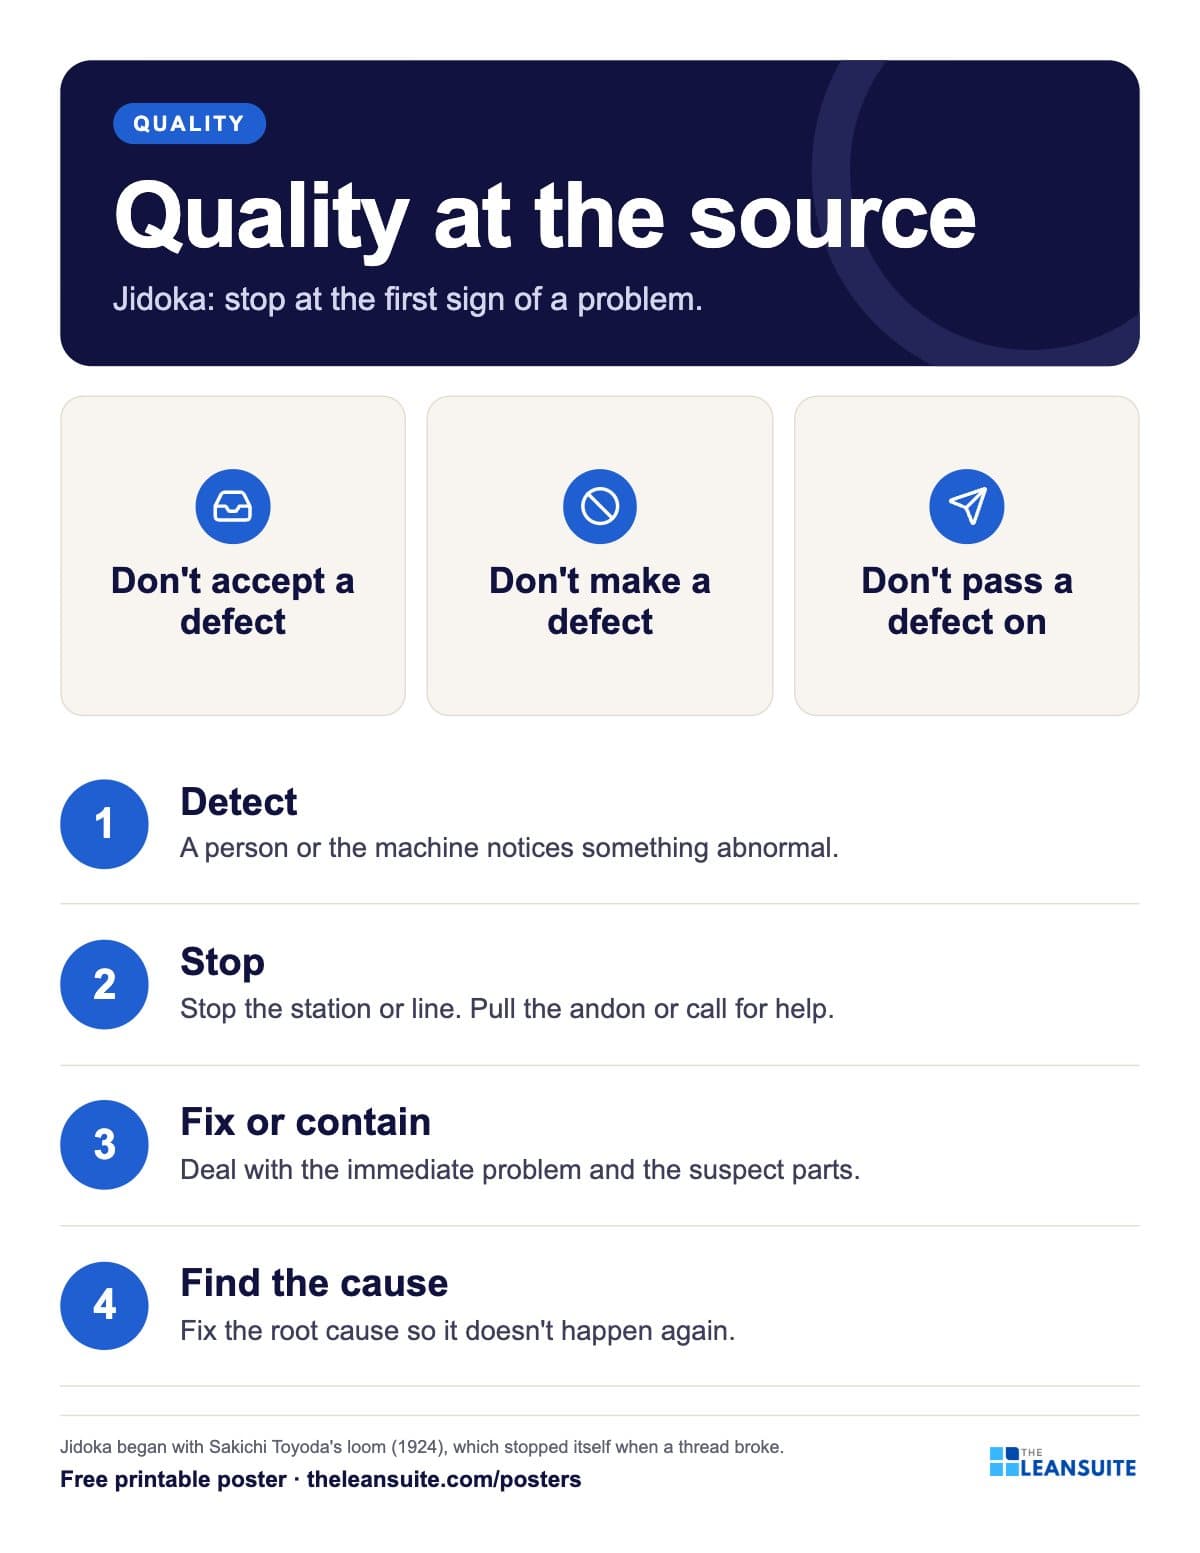 Jidoka and quality at the source poster
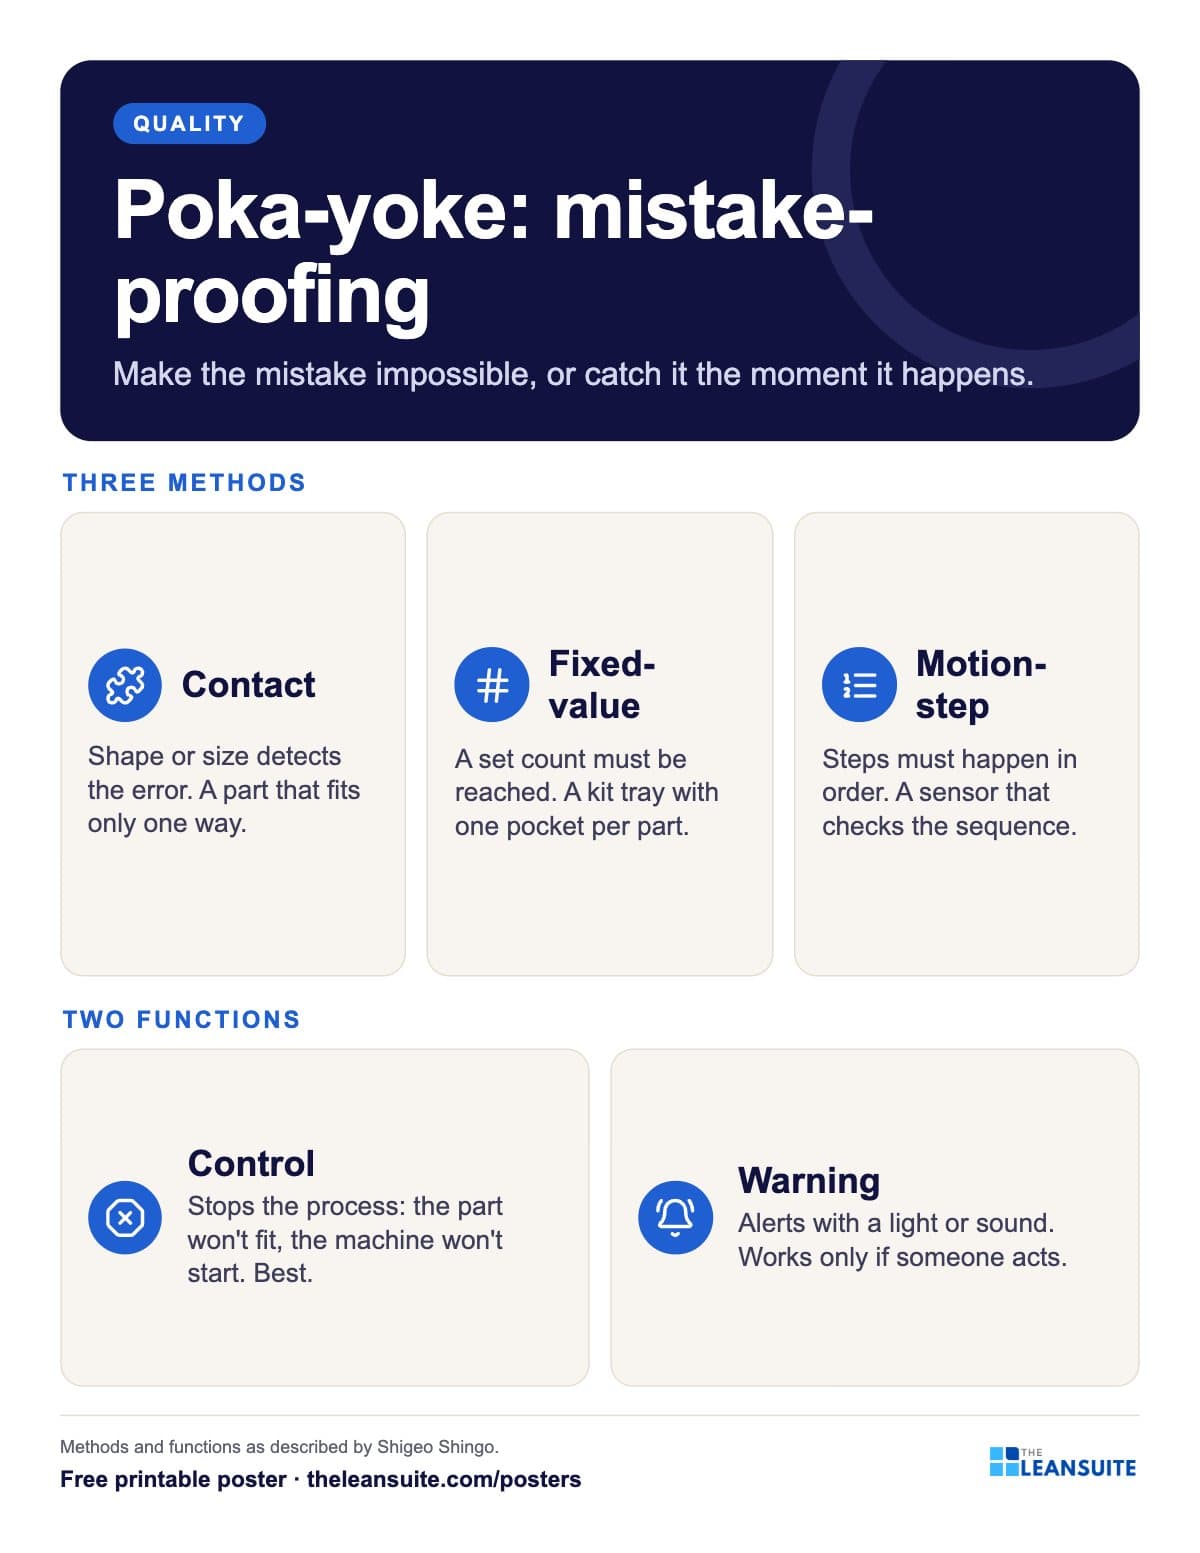 Poka-yoke types poster
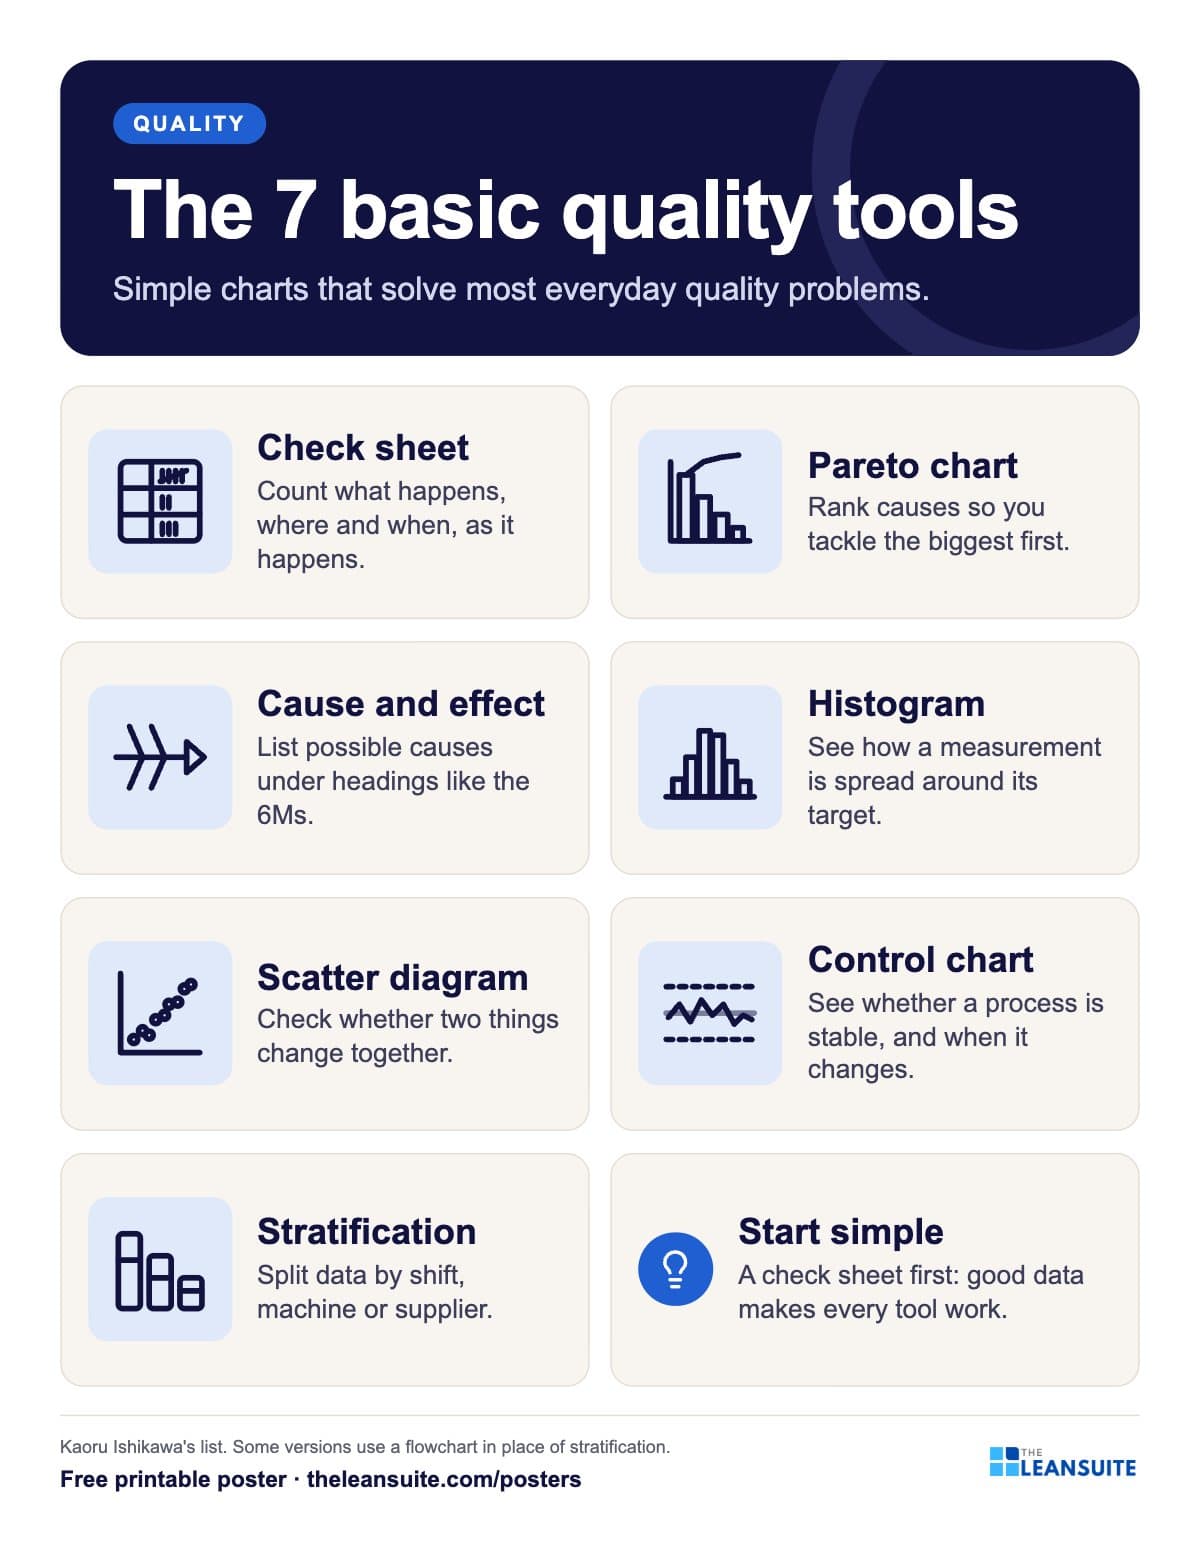 7 basic quality tools poster
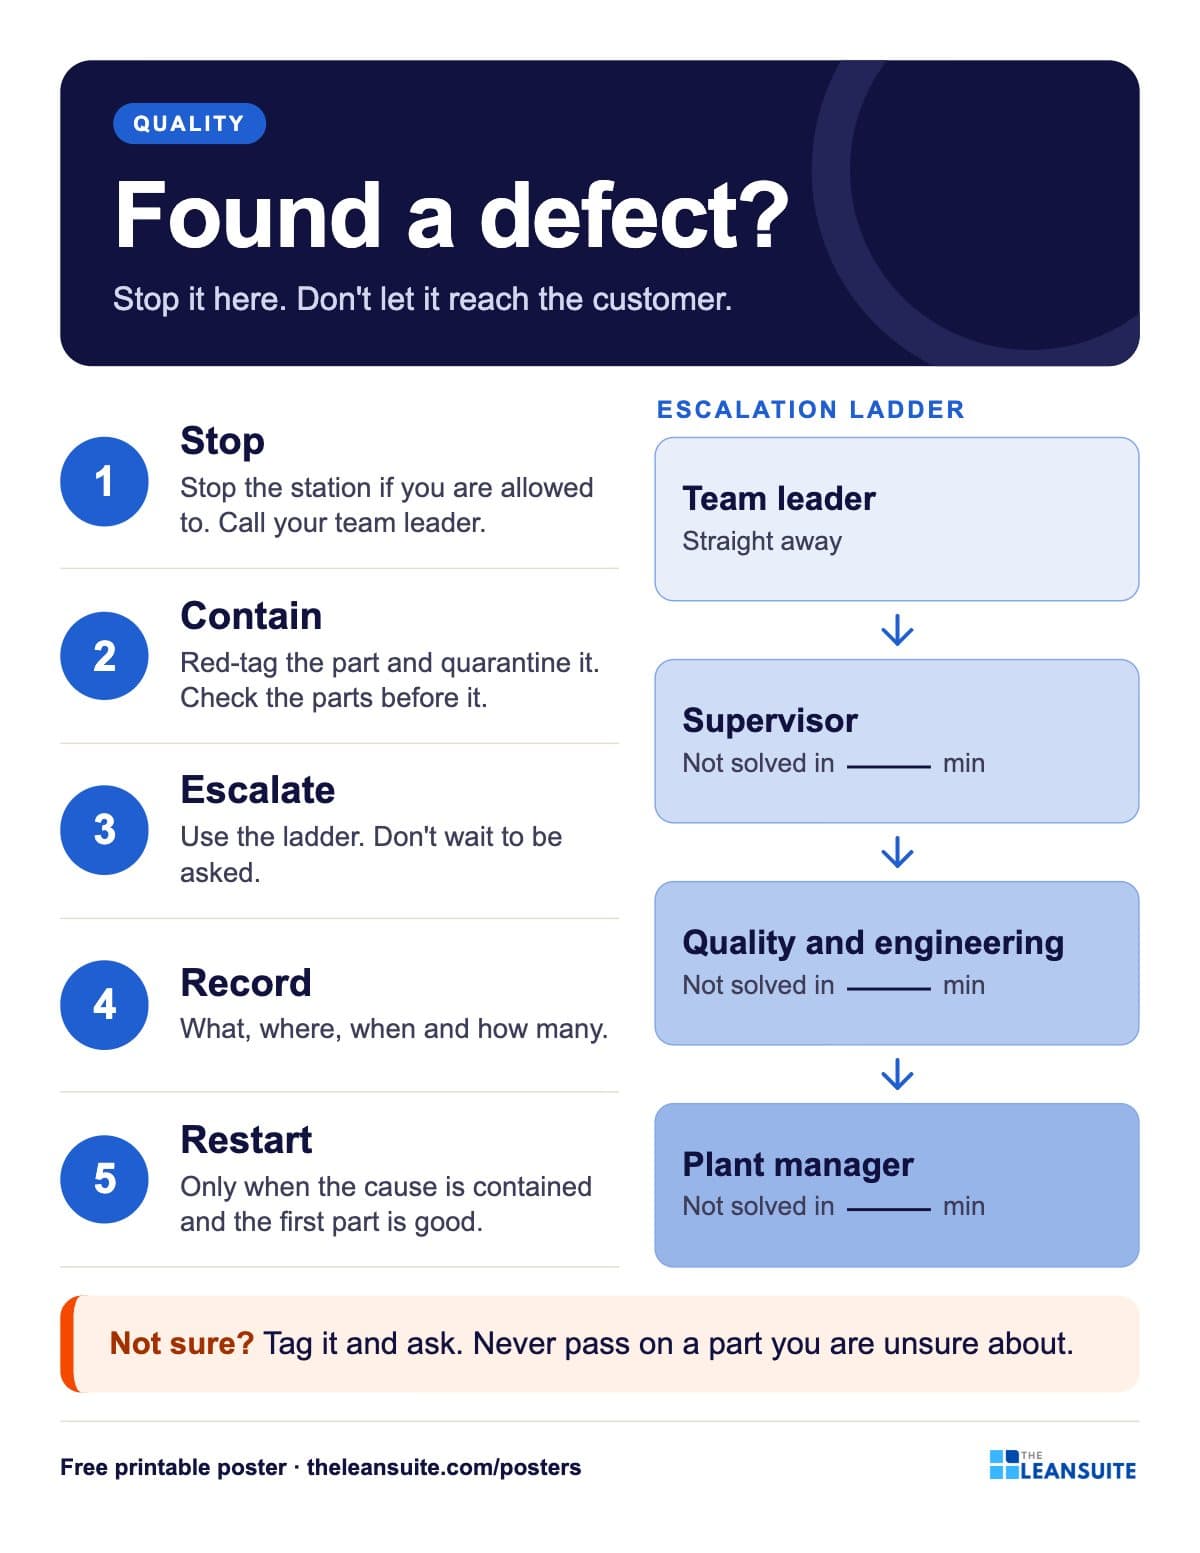 Defect escalation poster (red tag and stop the line)
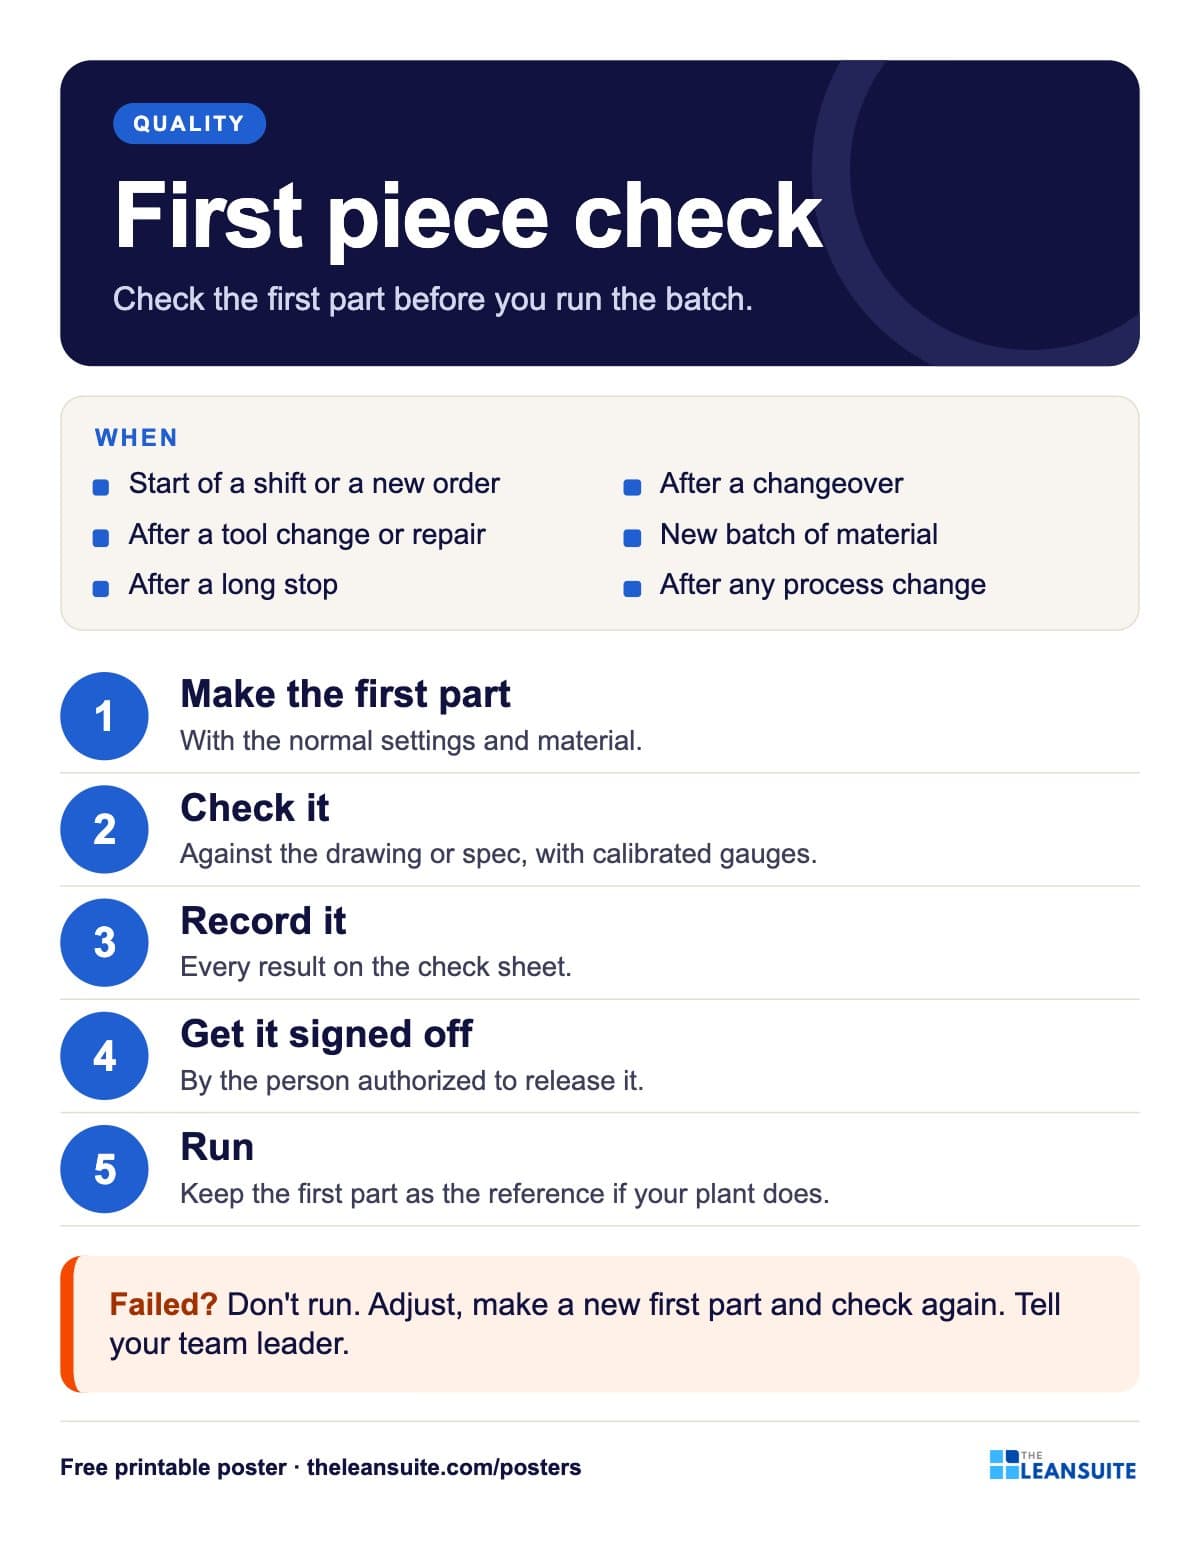 First piece (first article) check poster
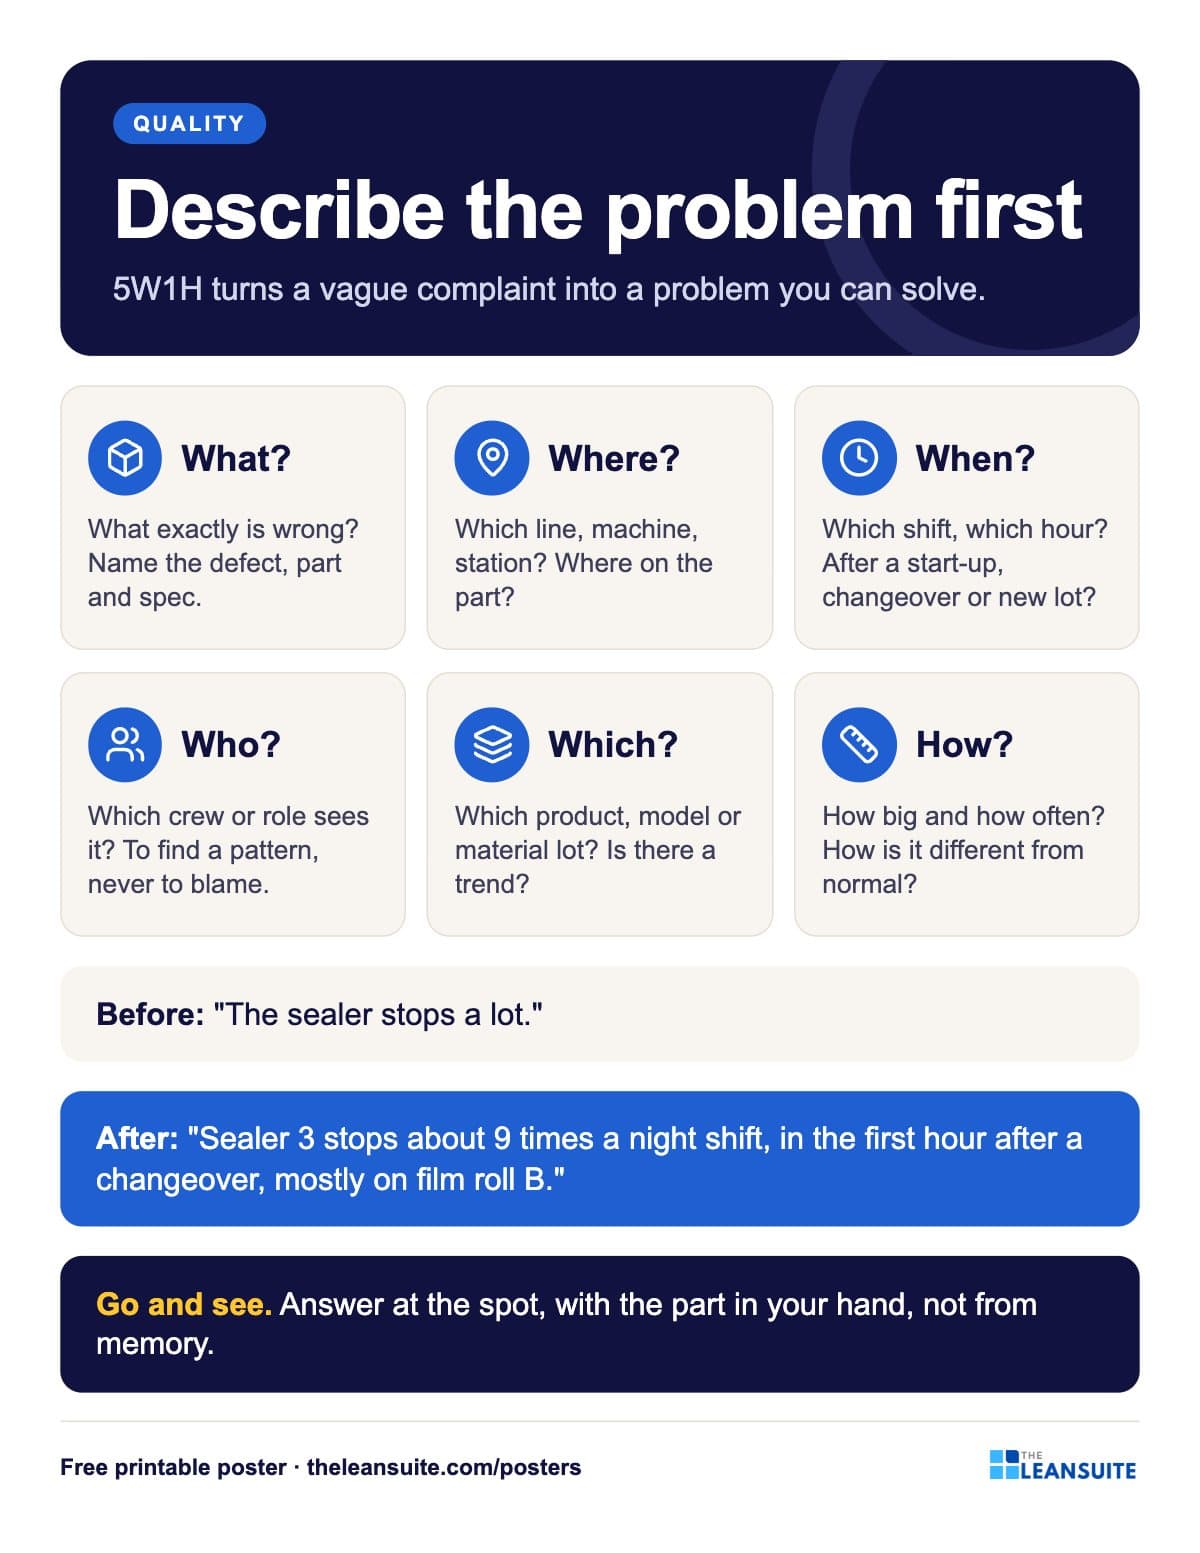 5W1H problem description poster
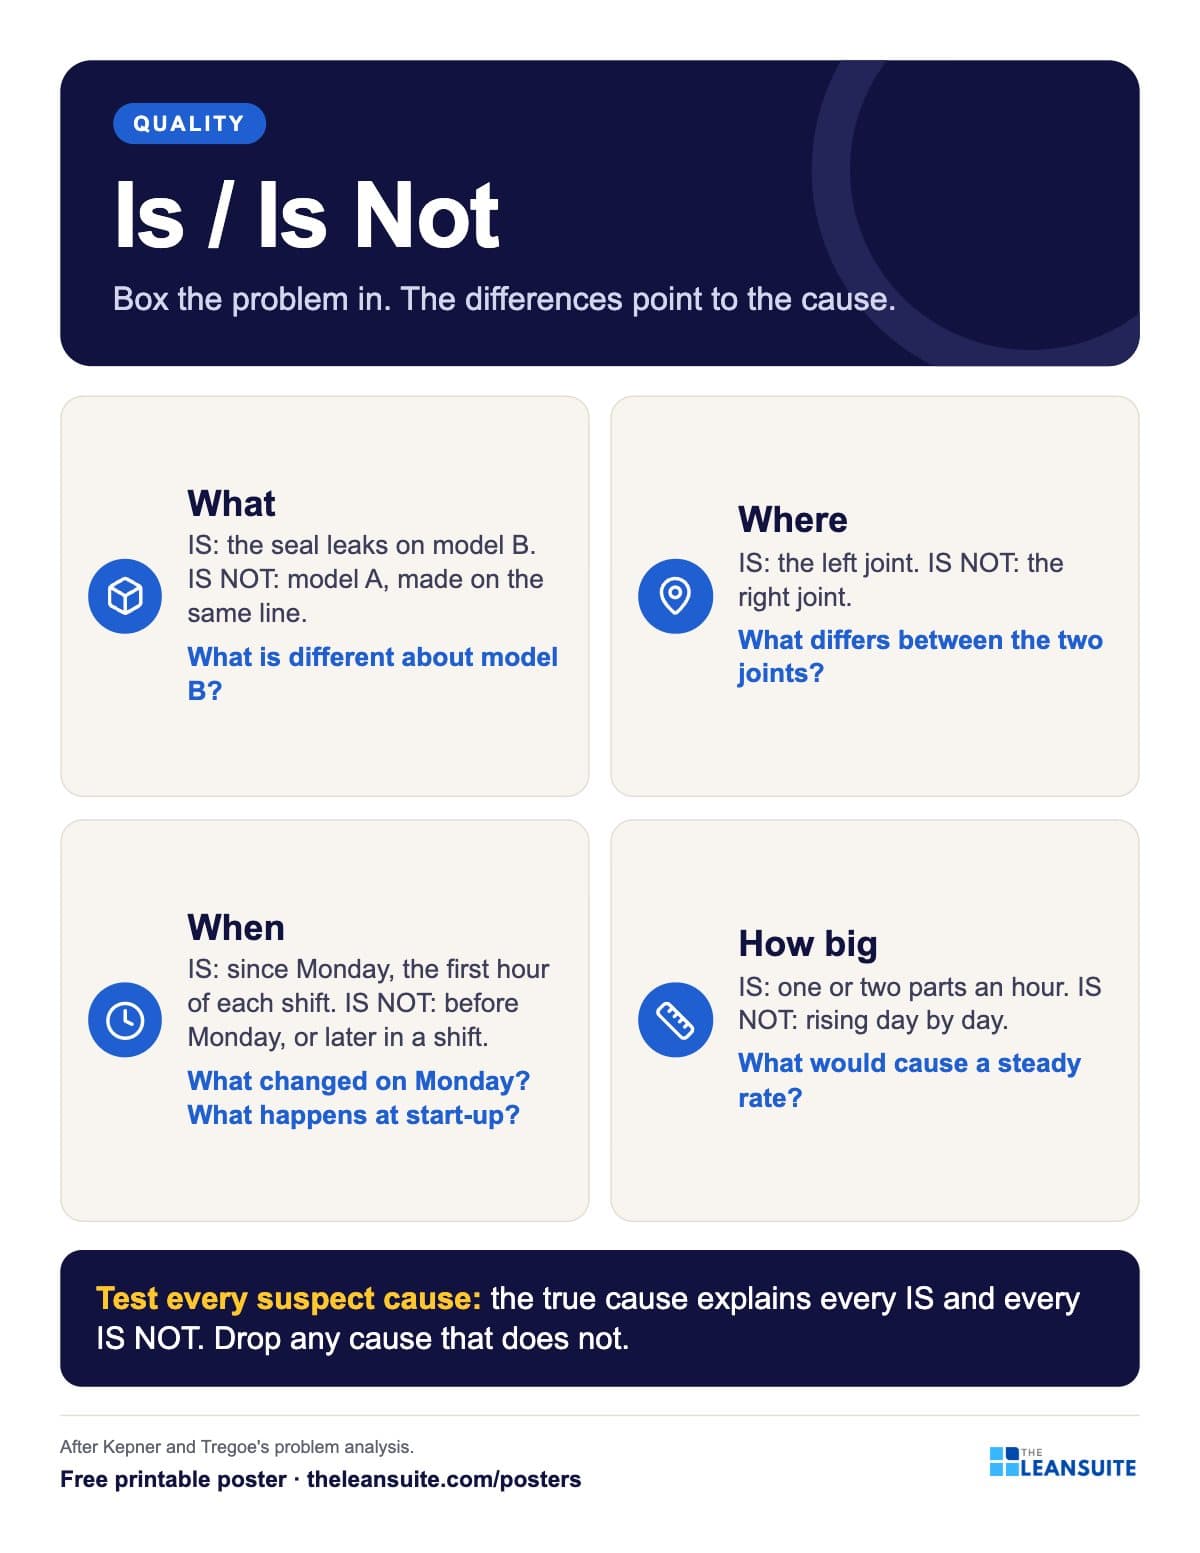 Is / Is Not analysis poster
 Fishbone 6M questions poster
 Human error root causes poster
 Why made, why missed poster
 4M change points poster
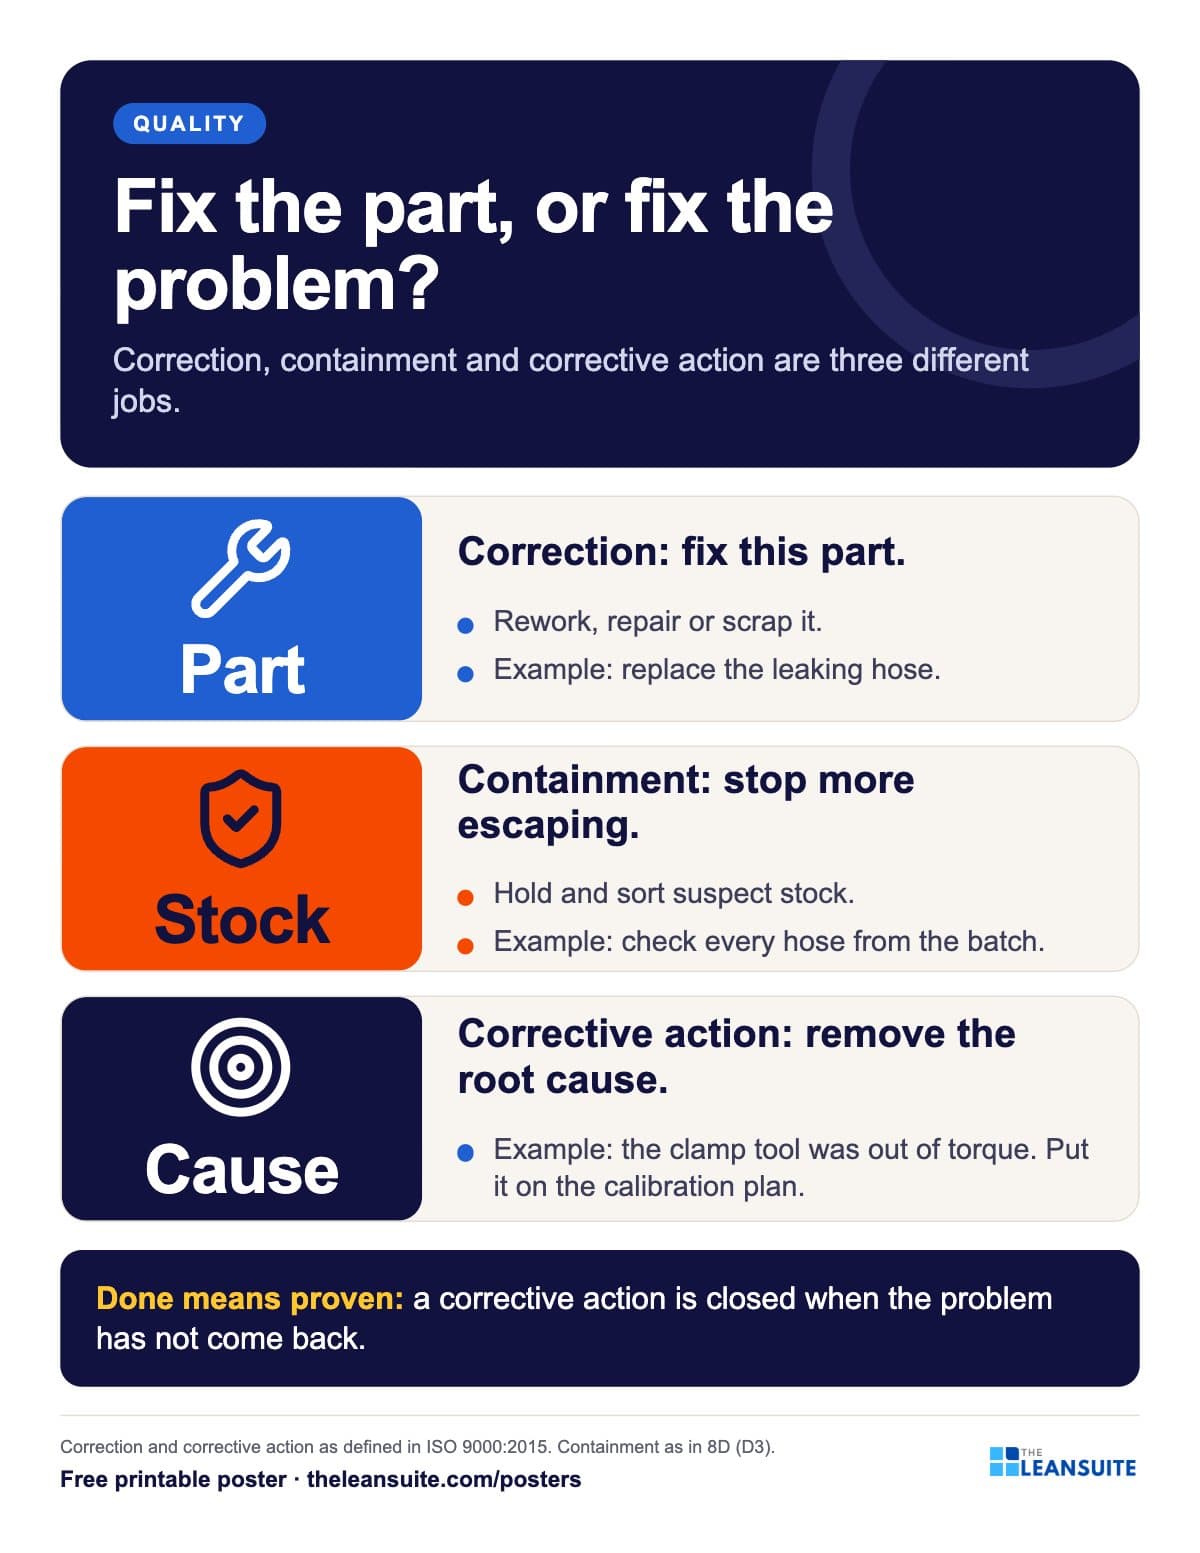 Correction vs corrective action poster
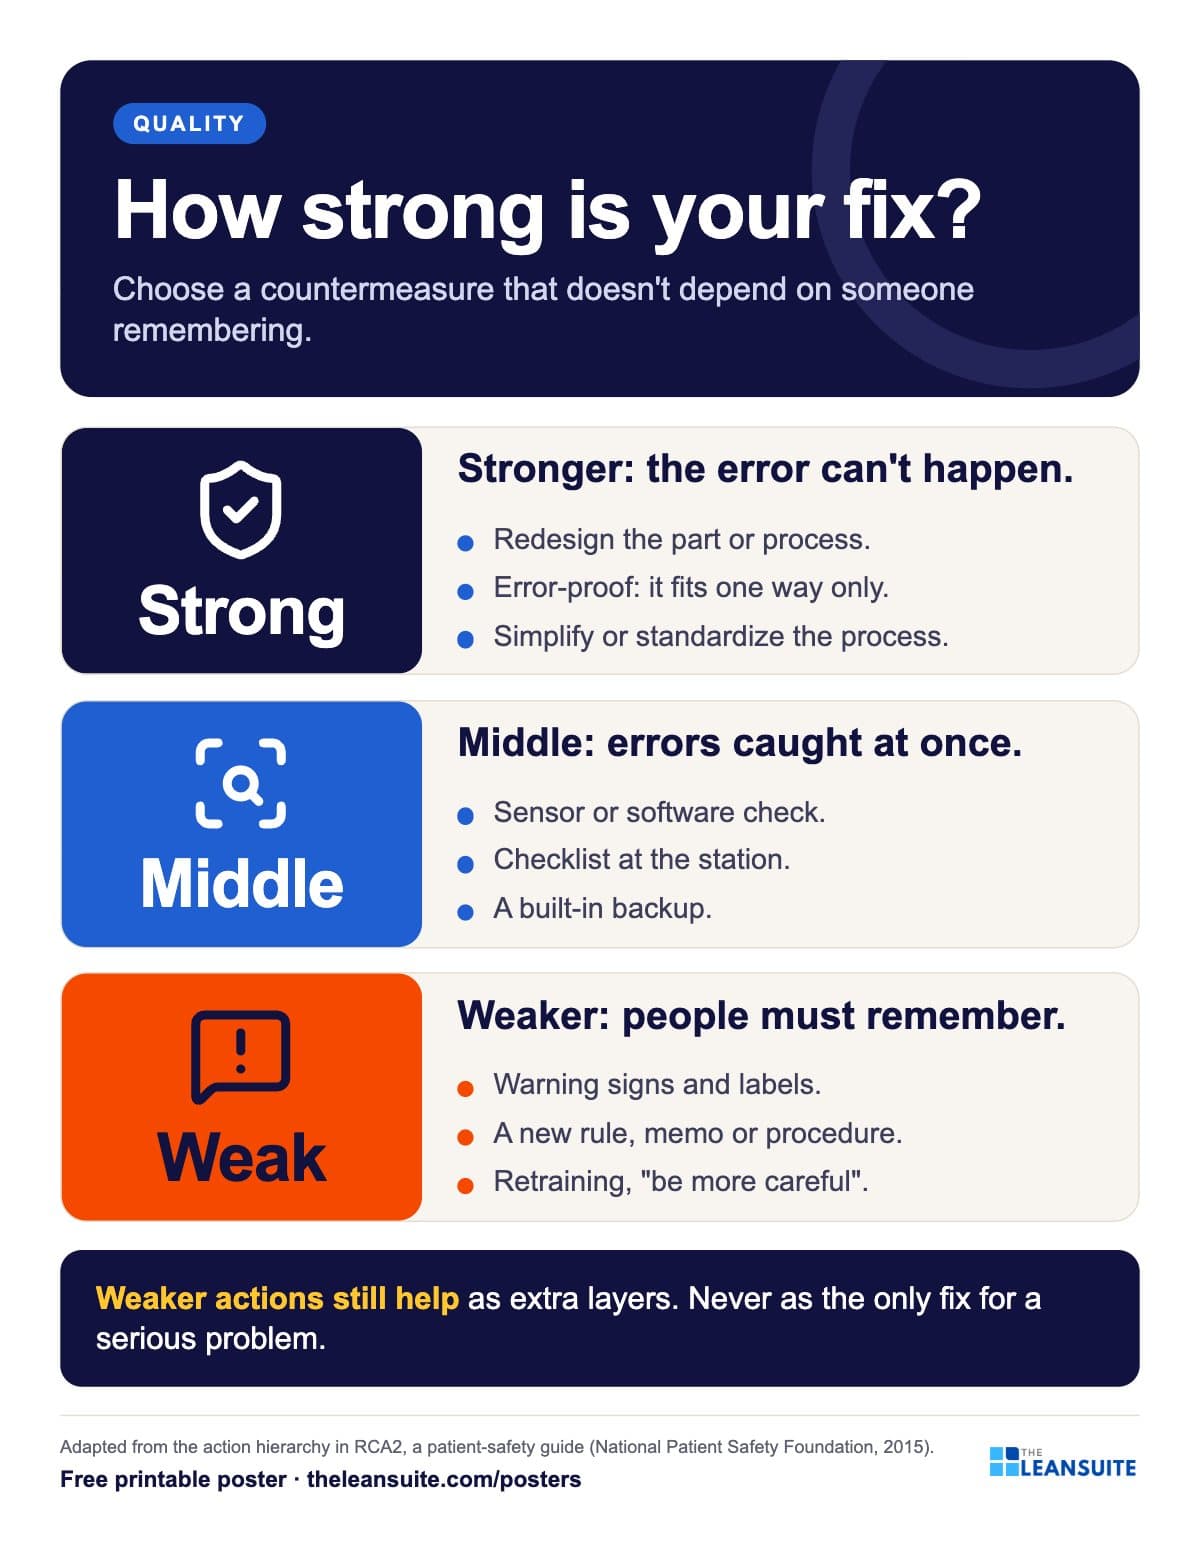 Strong and weak countermeasures poster
 Containment actions poster
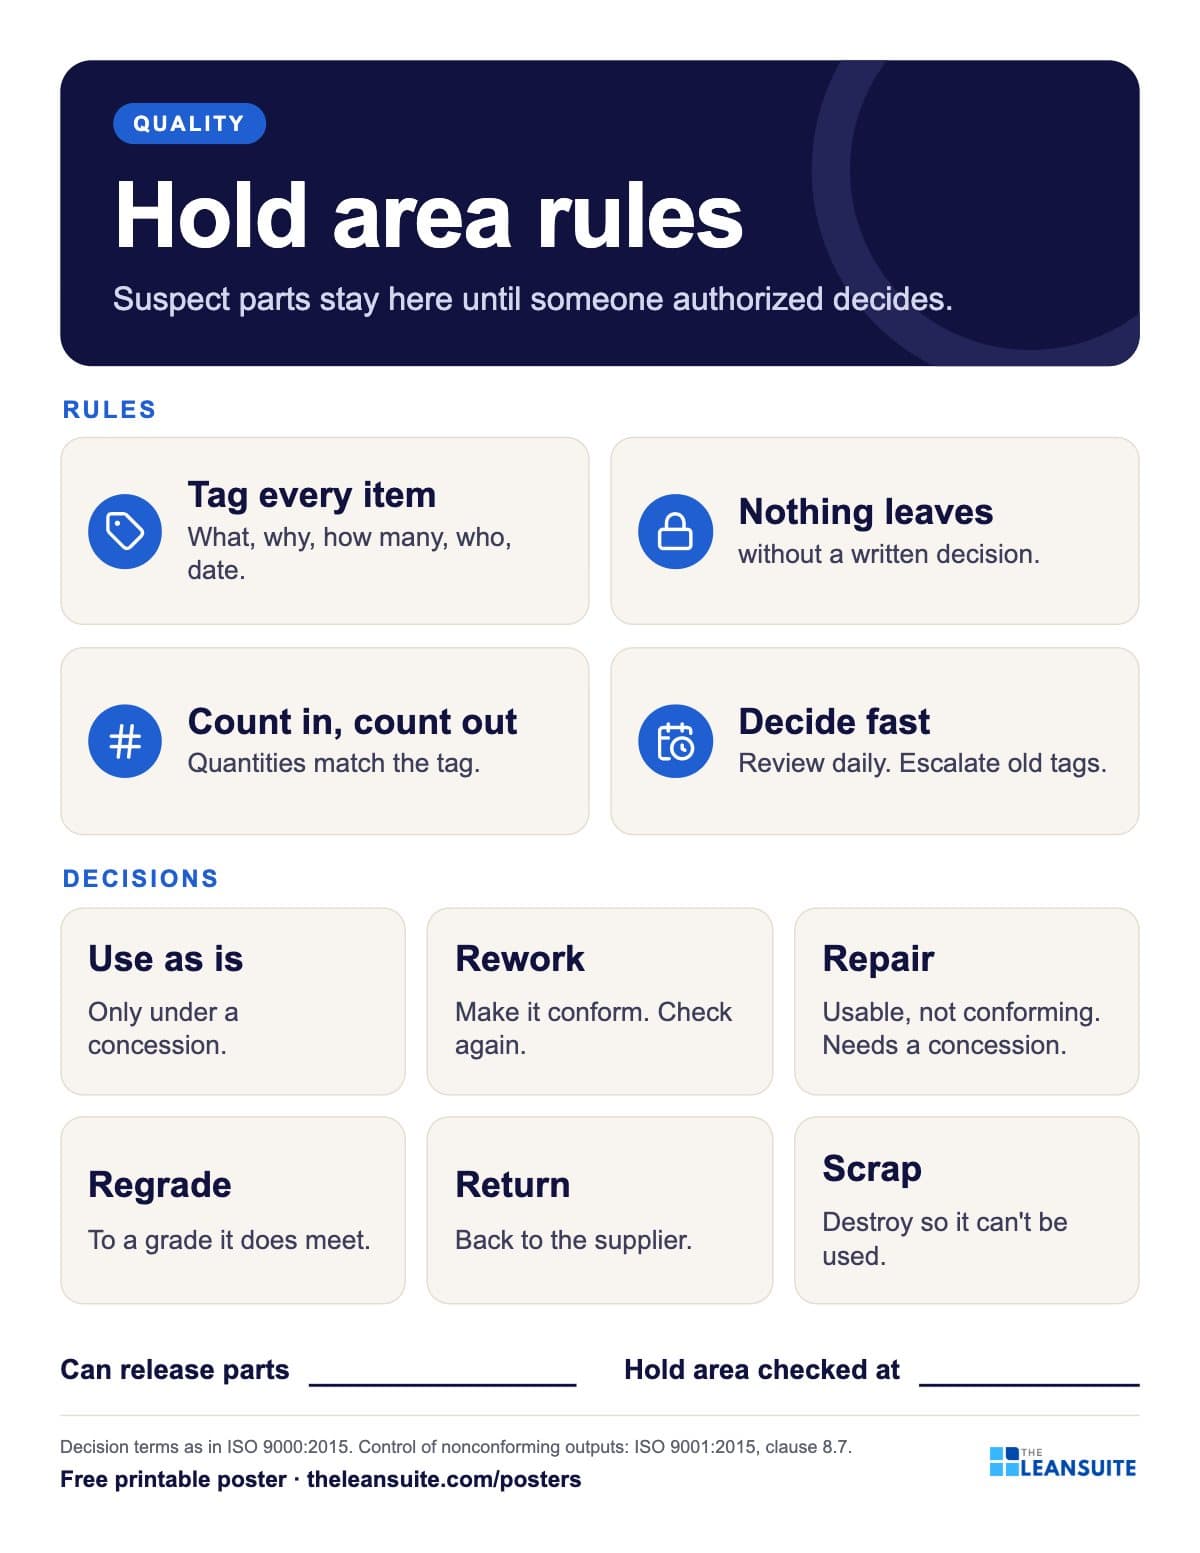 Hold area (quarantine) rules poster
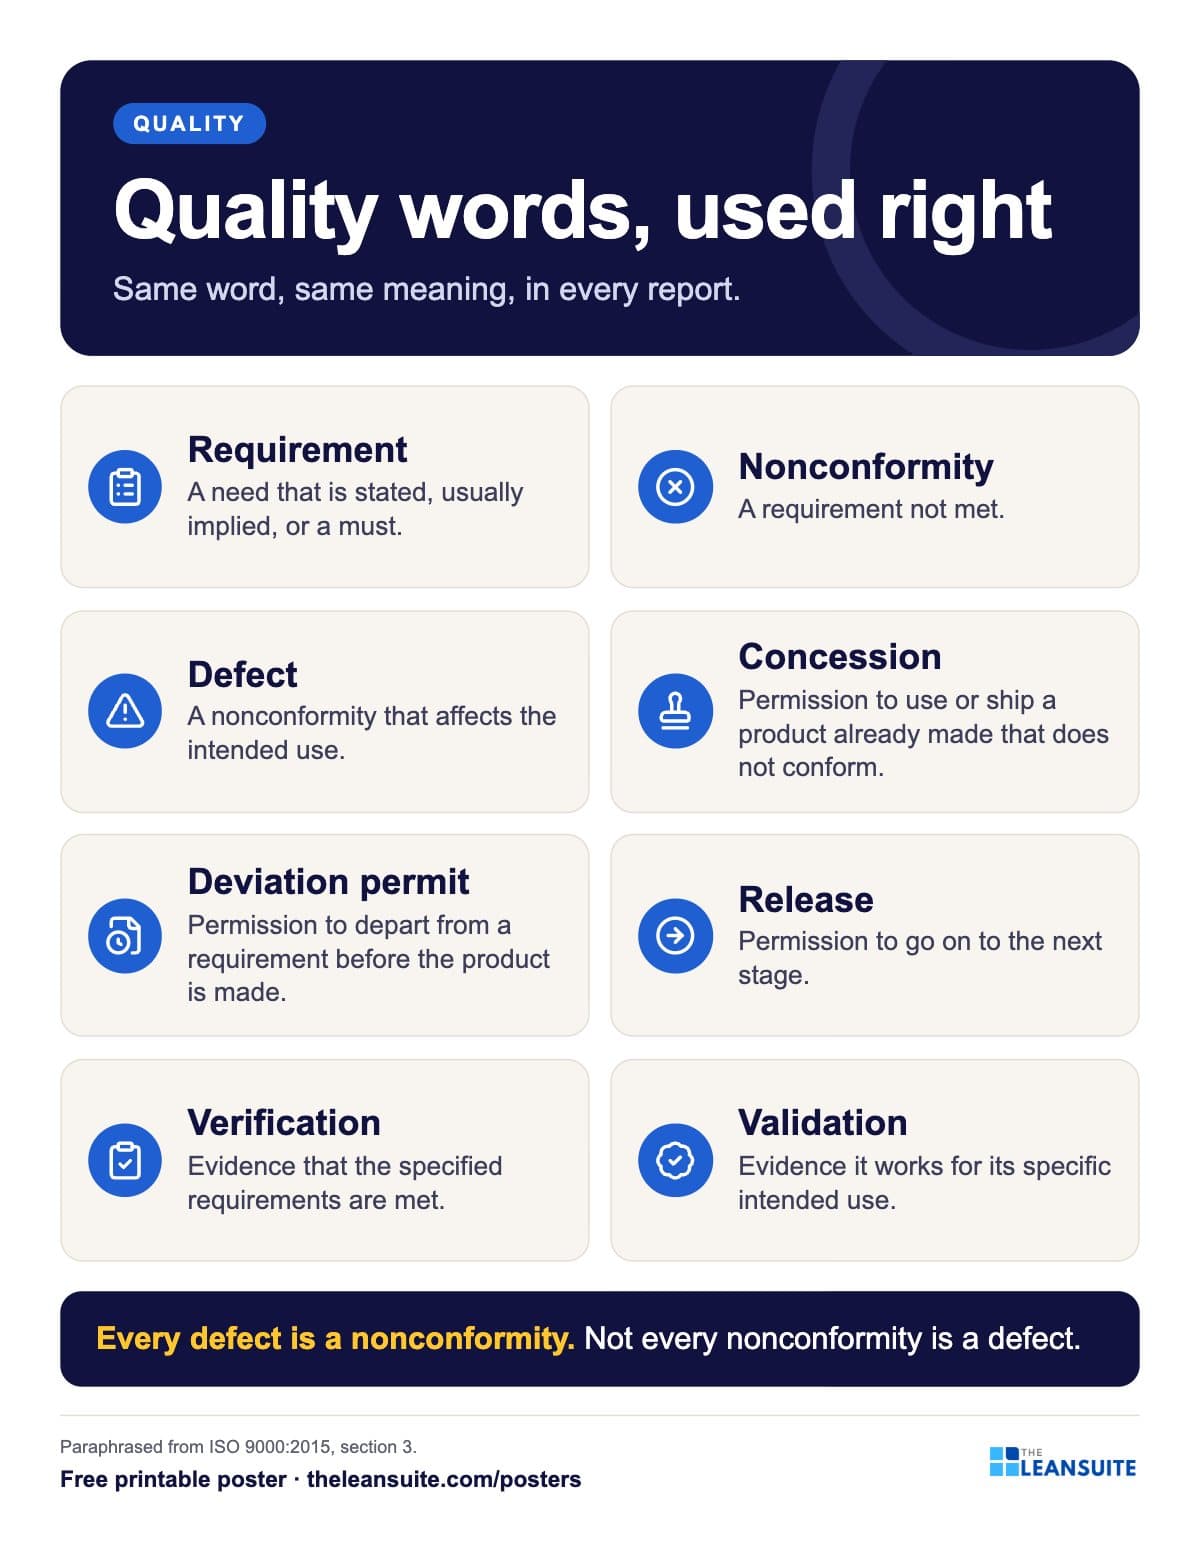 Quality terms poster (nonconformity, defect, concession)
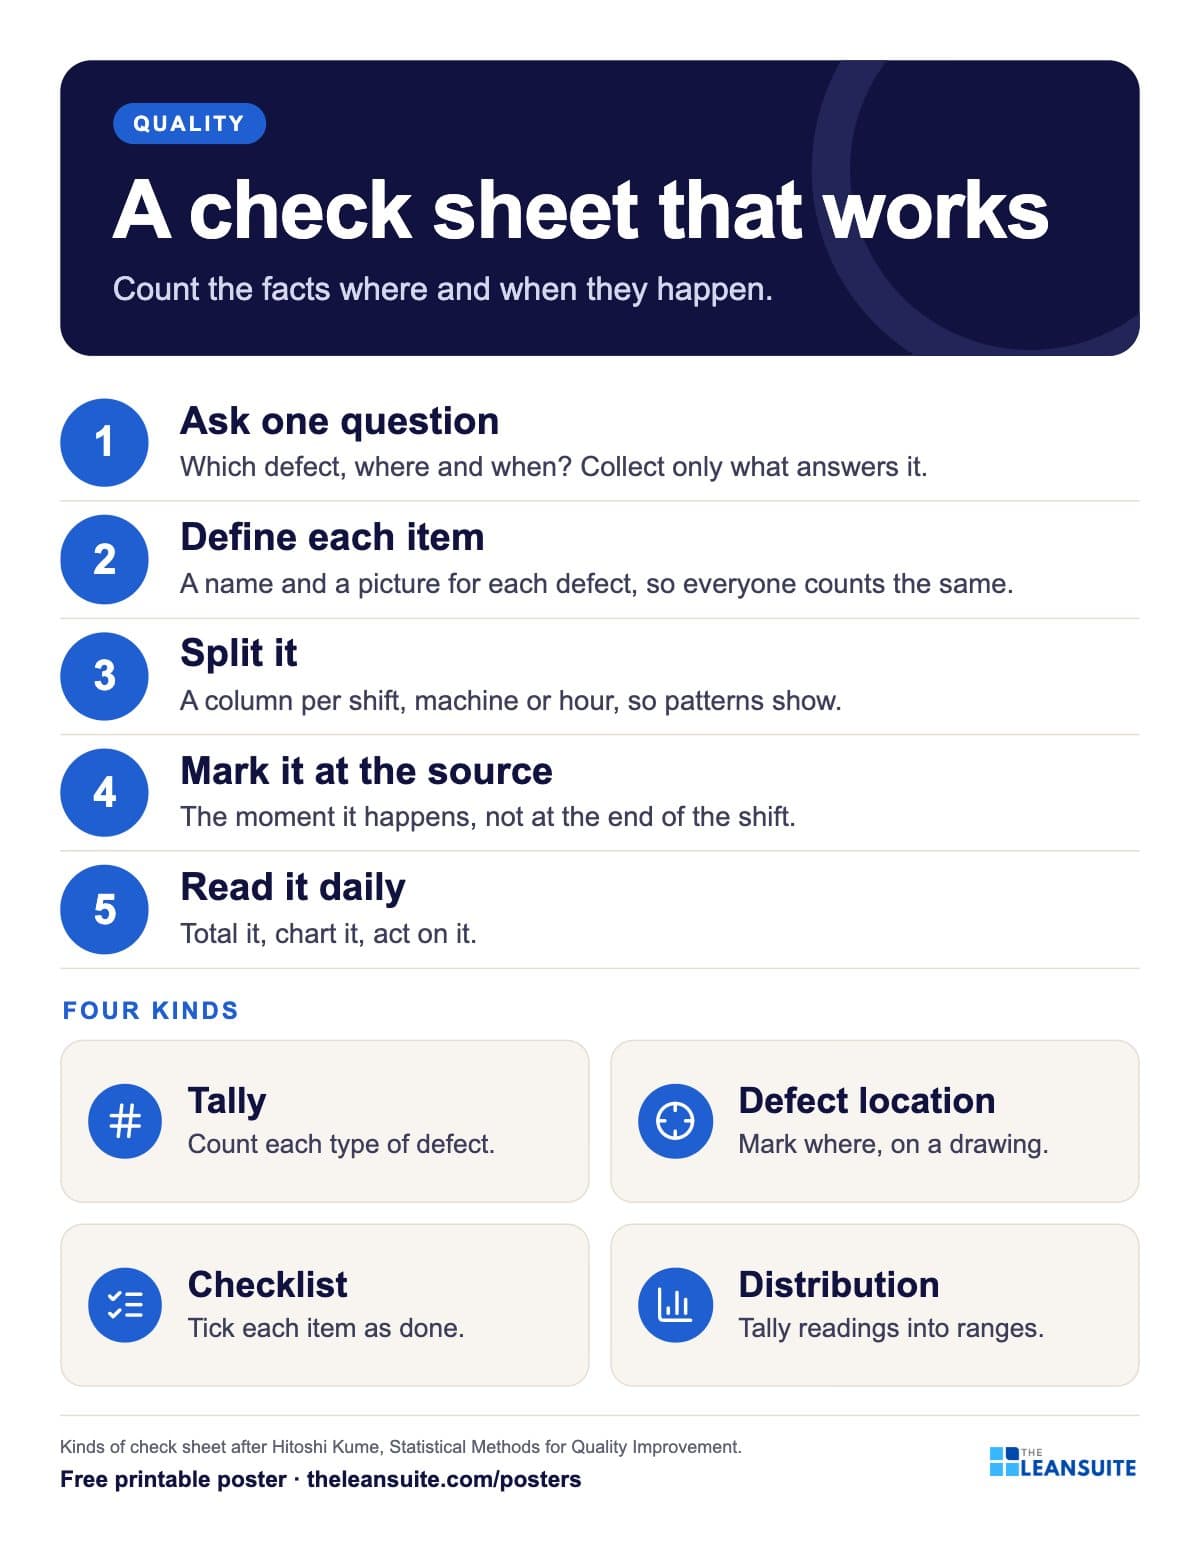 Check sheet poster
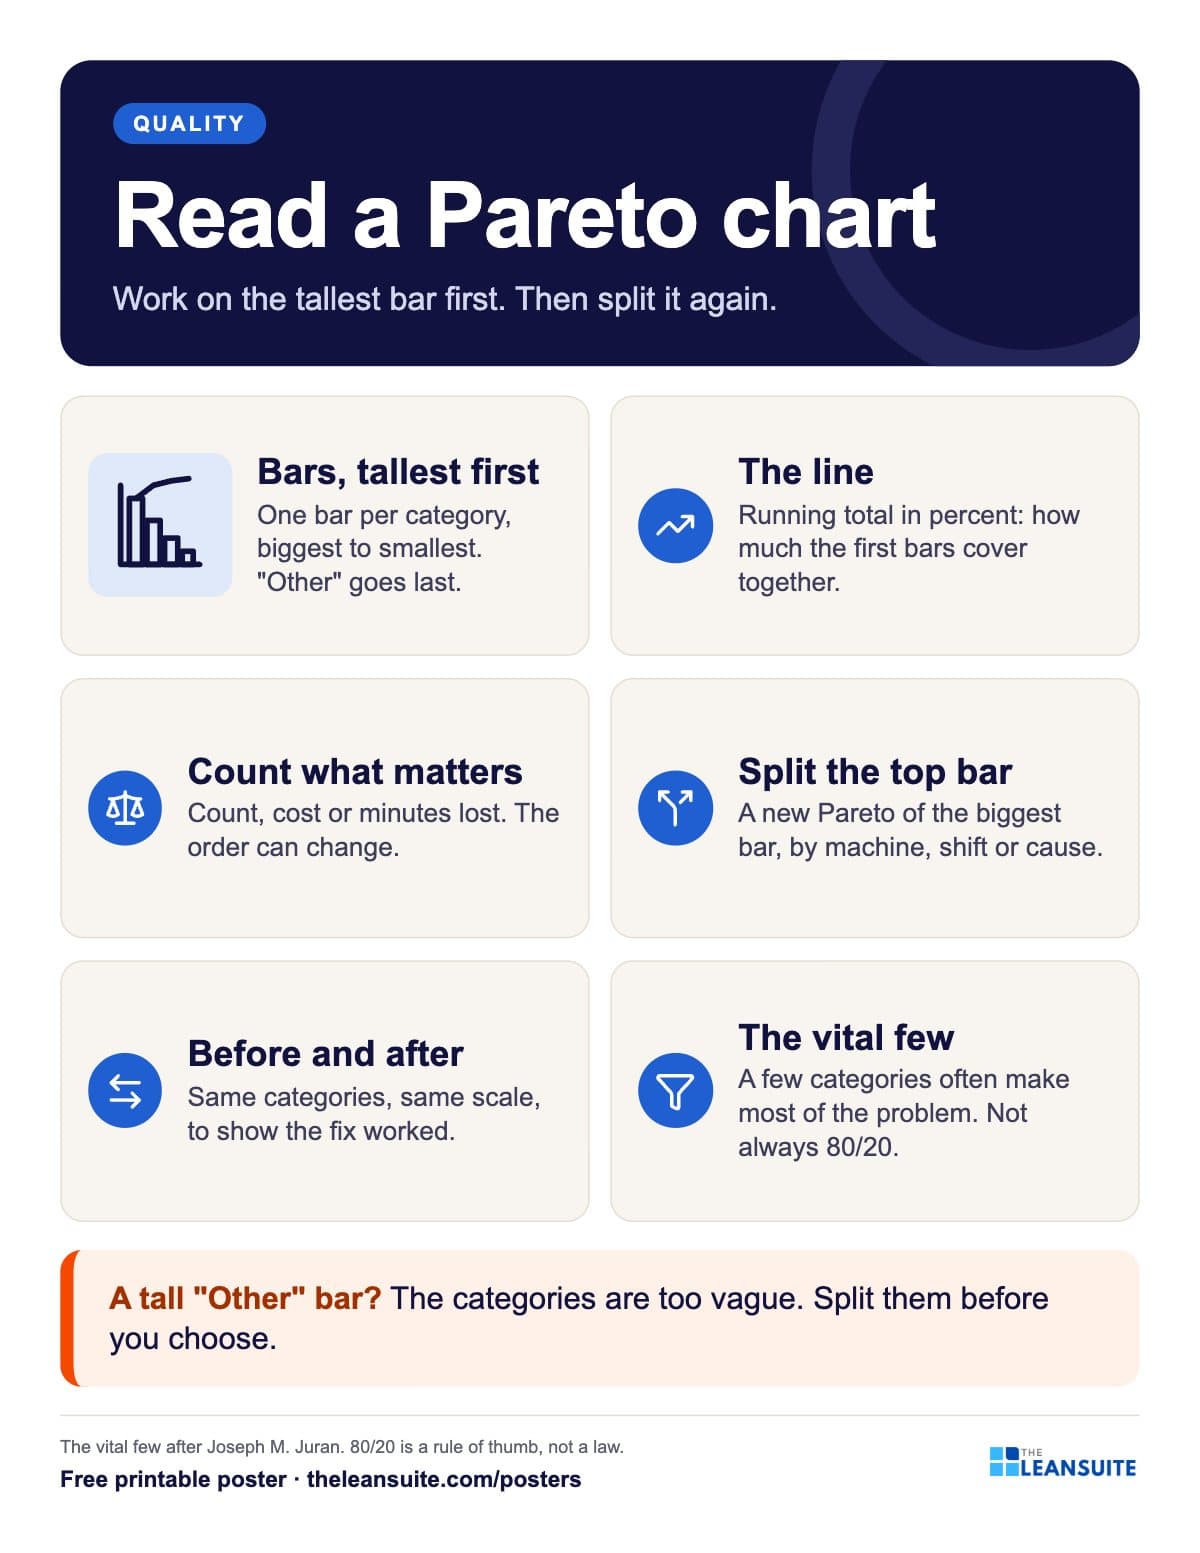 How to read a Pareto chart poster
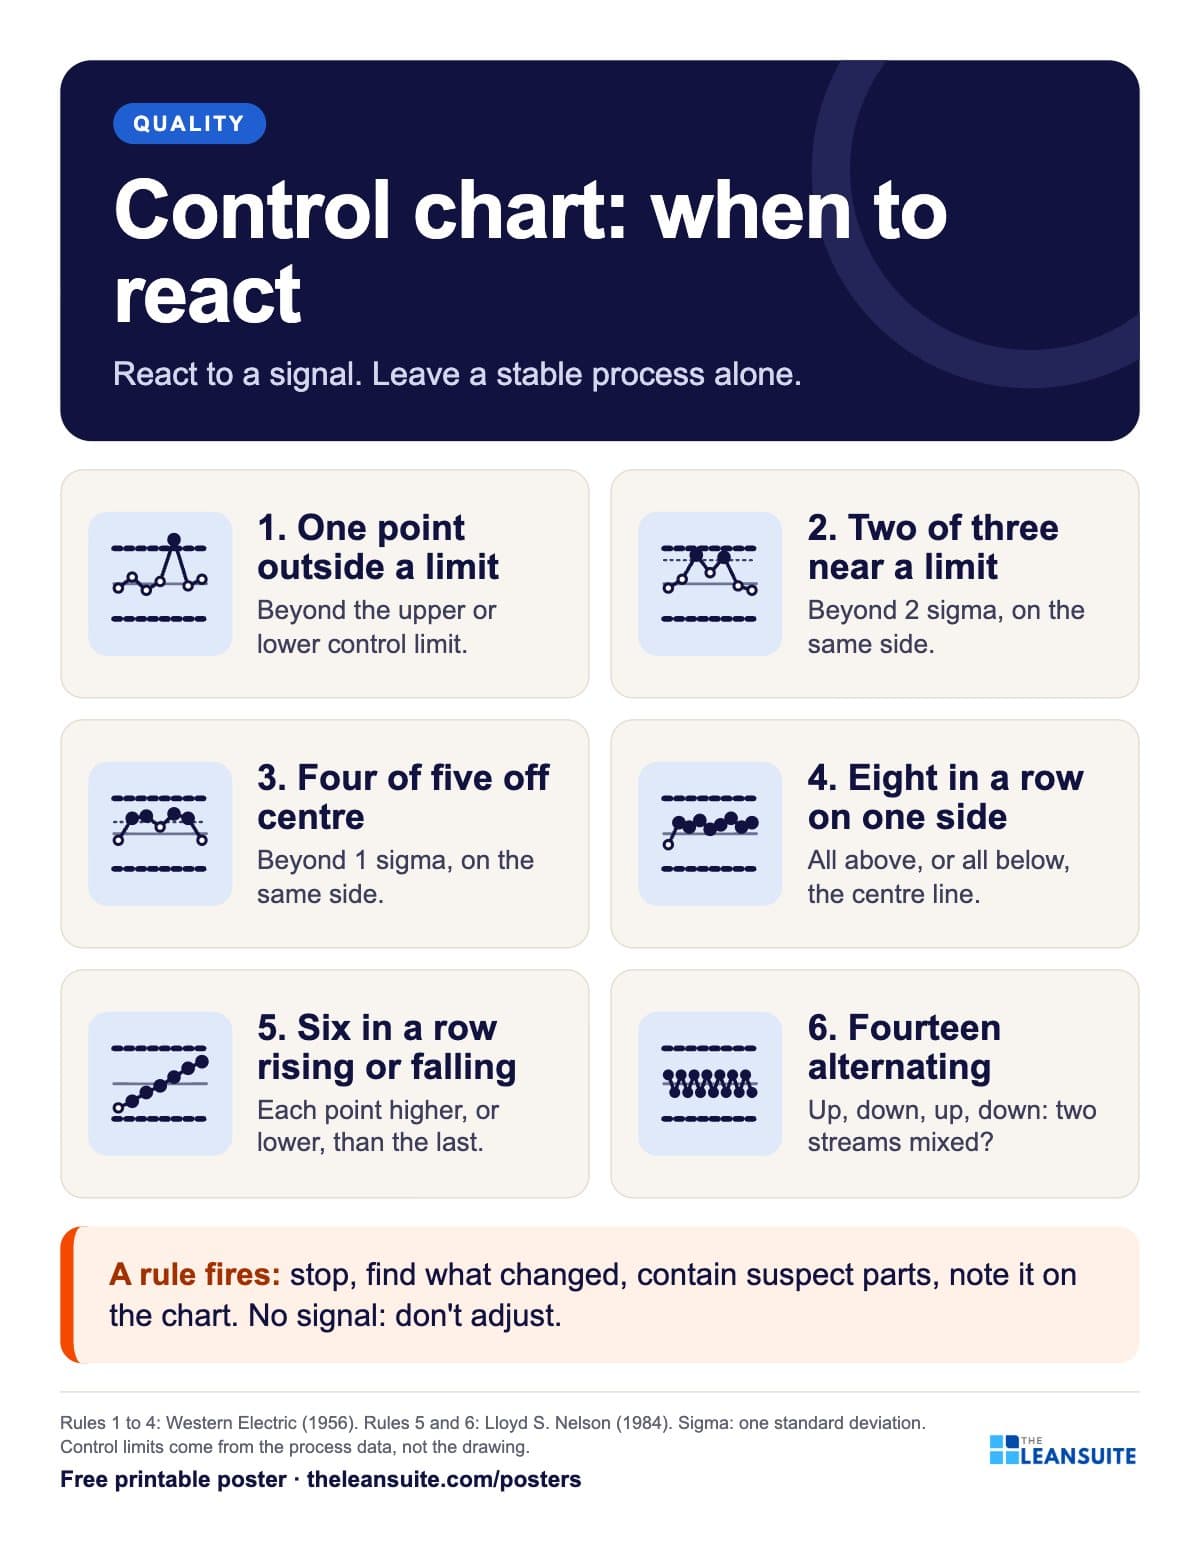 Control chart rules poster (when to react)
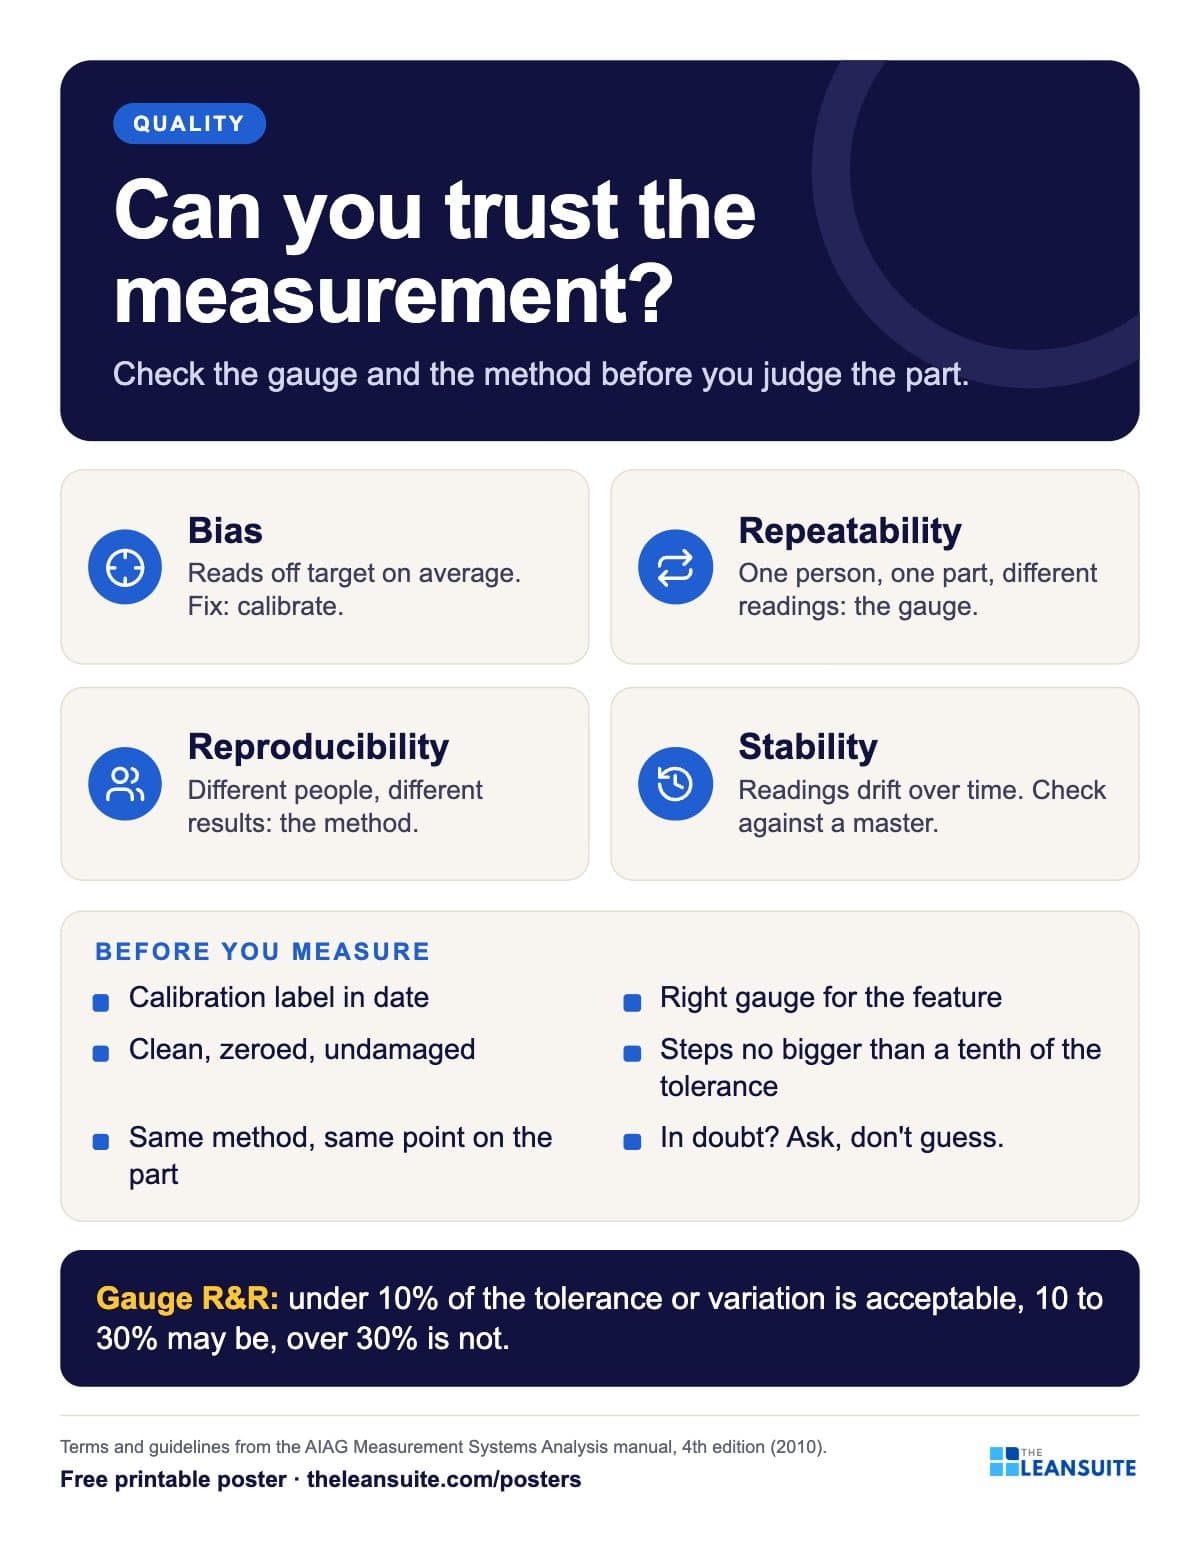 Measurement system basics poster
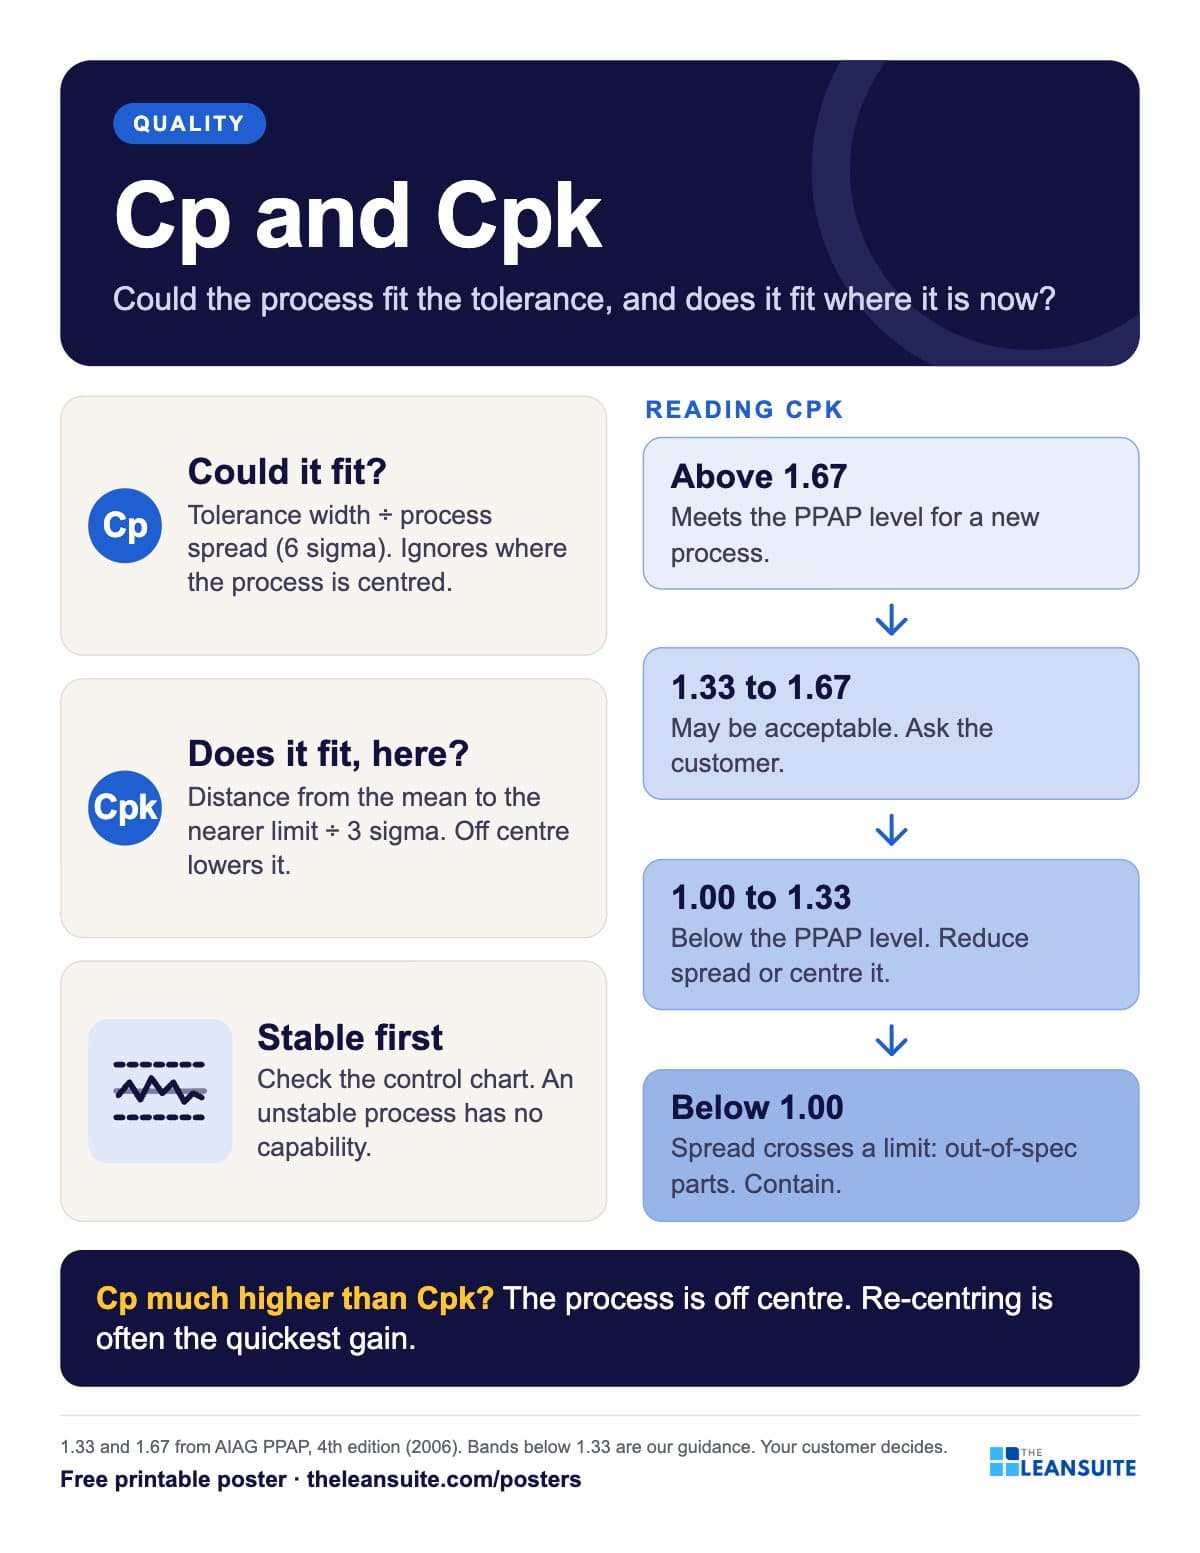 Cp and Cpk process capability poster
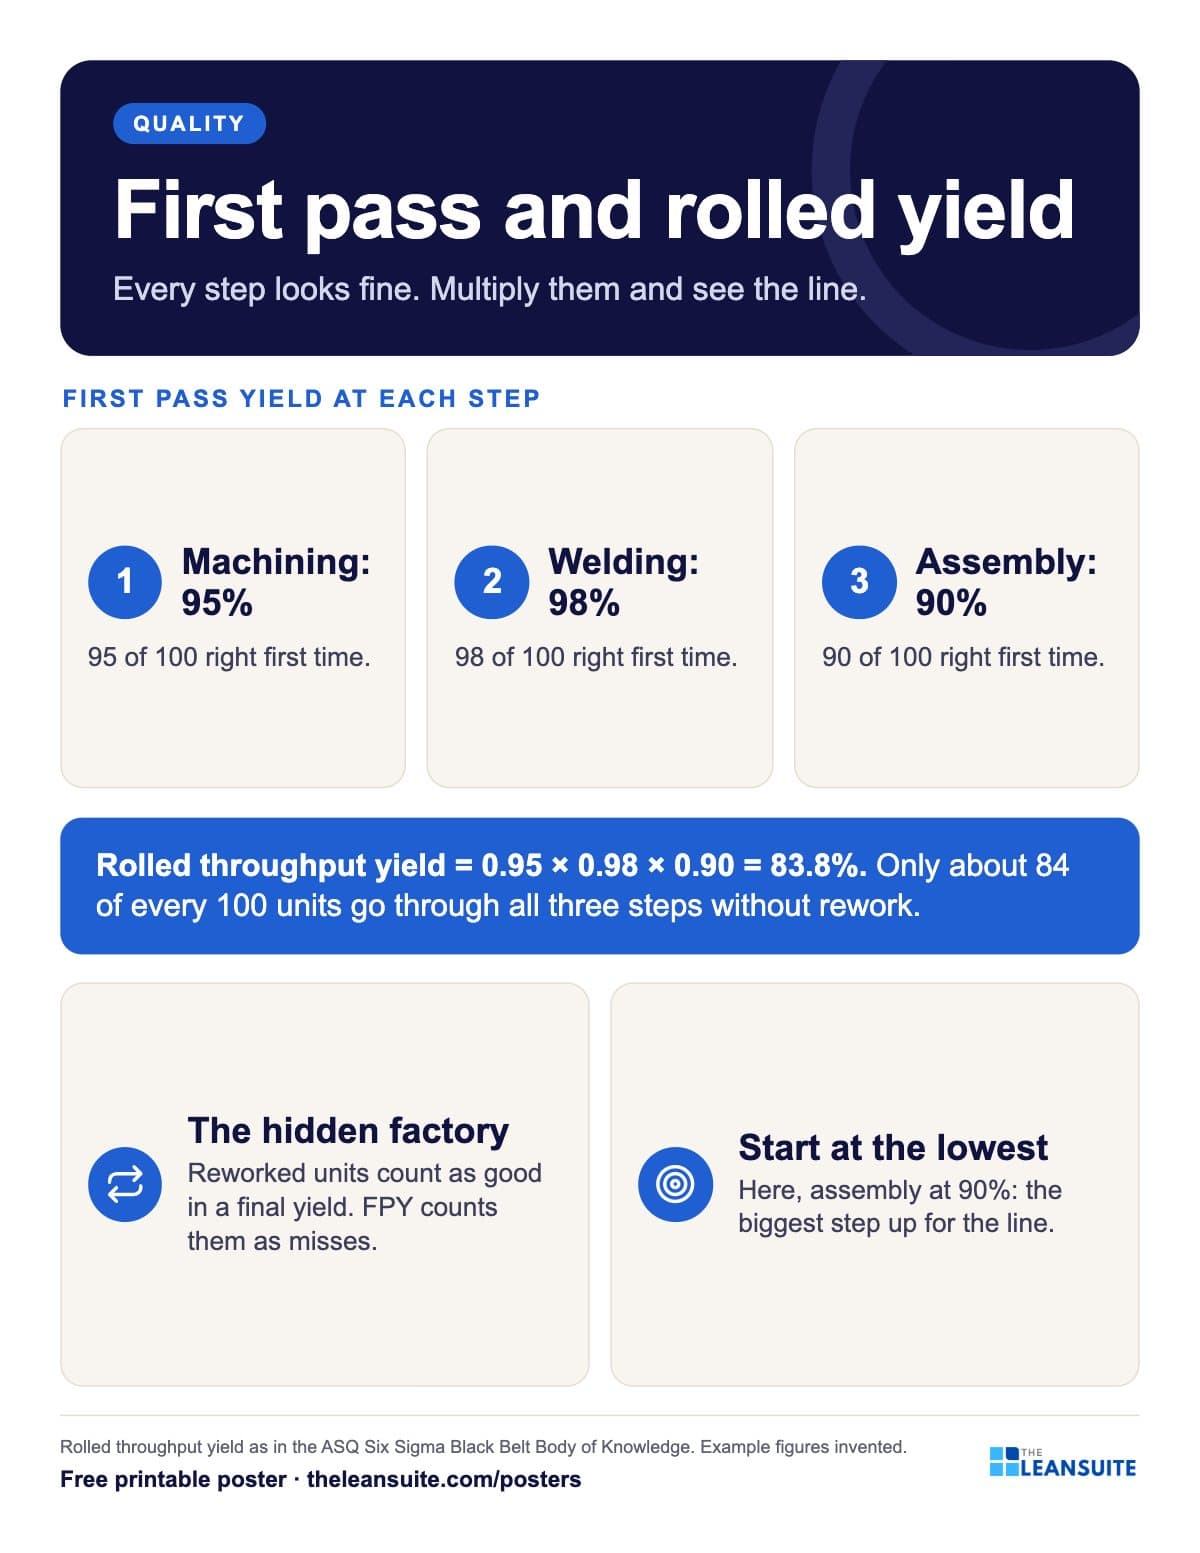 First pass yield and rolled throughput yield poster
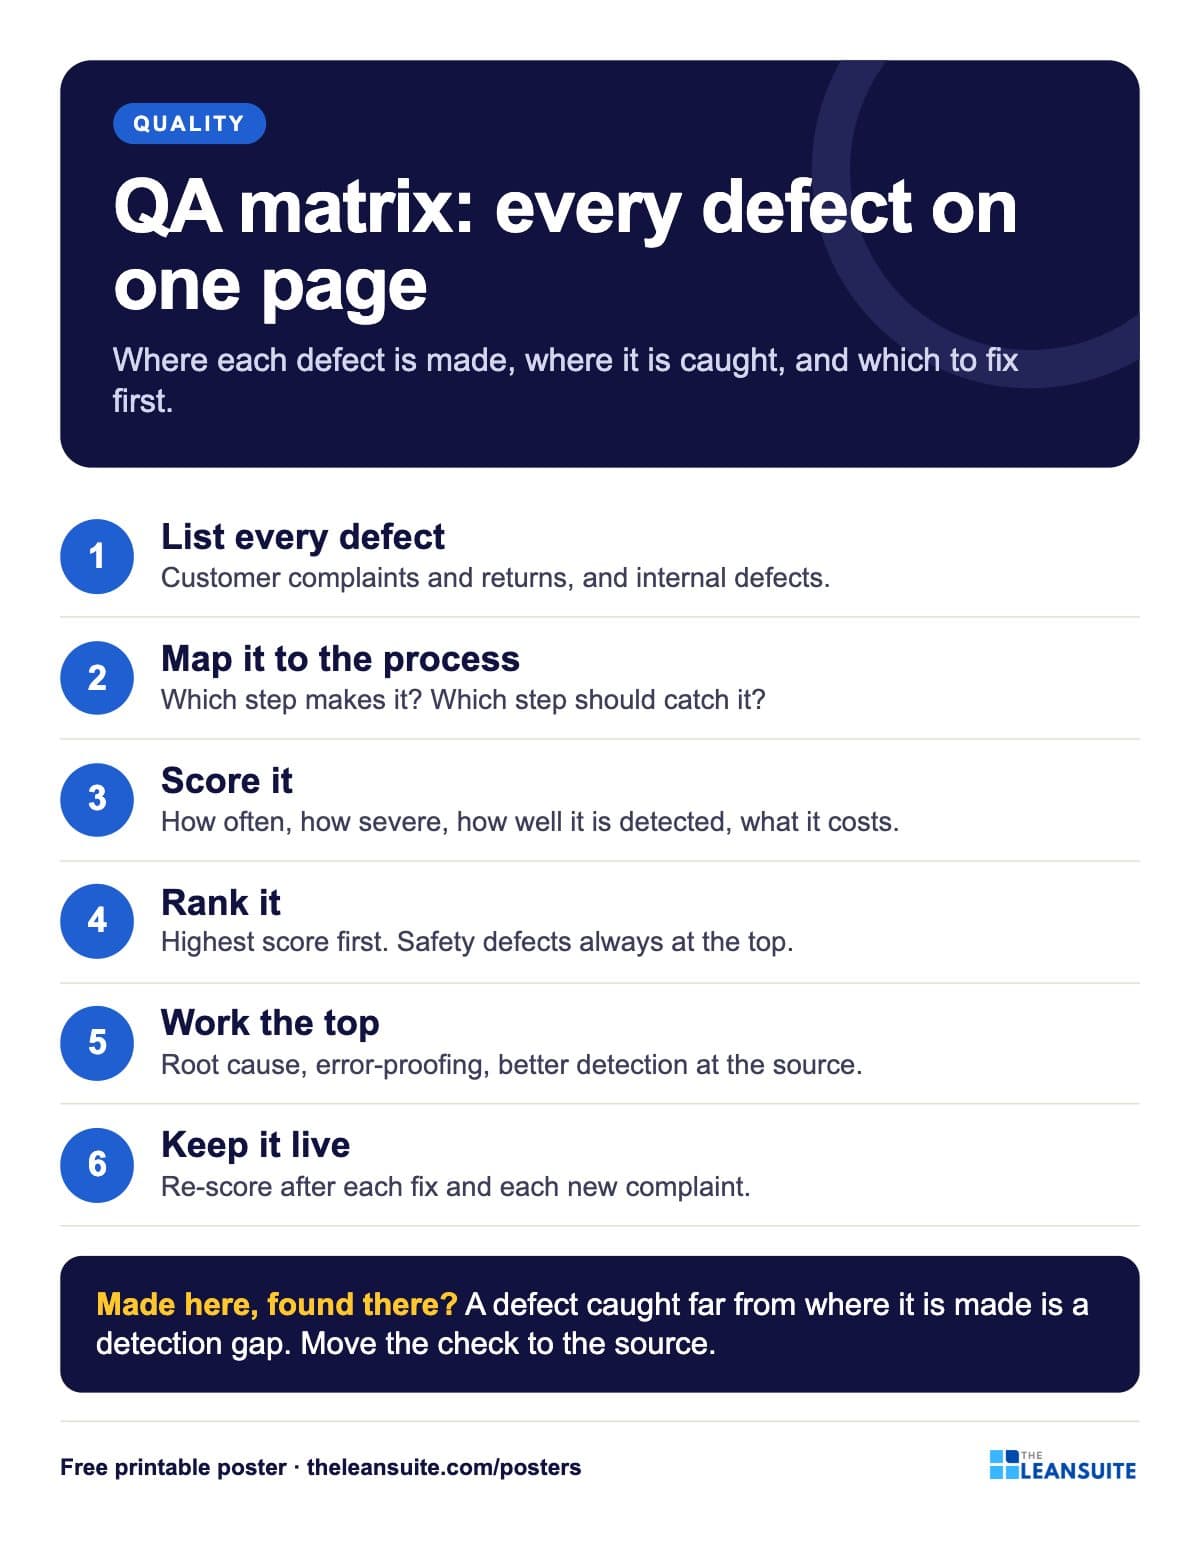 QA matrix poster
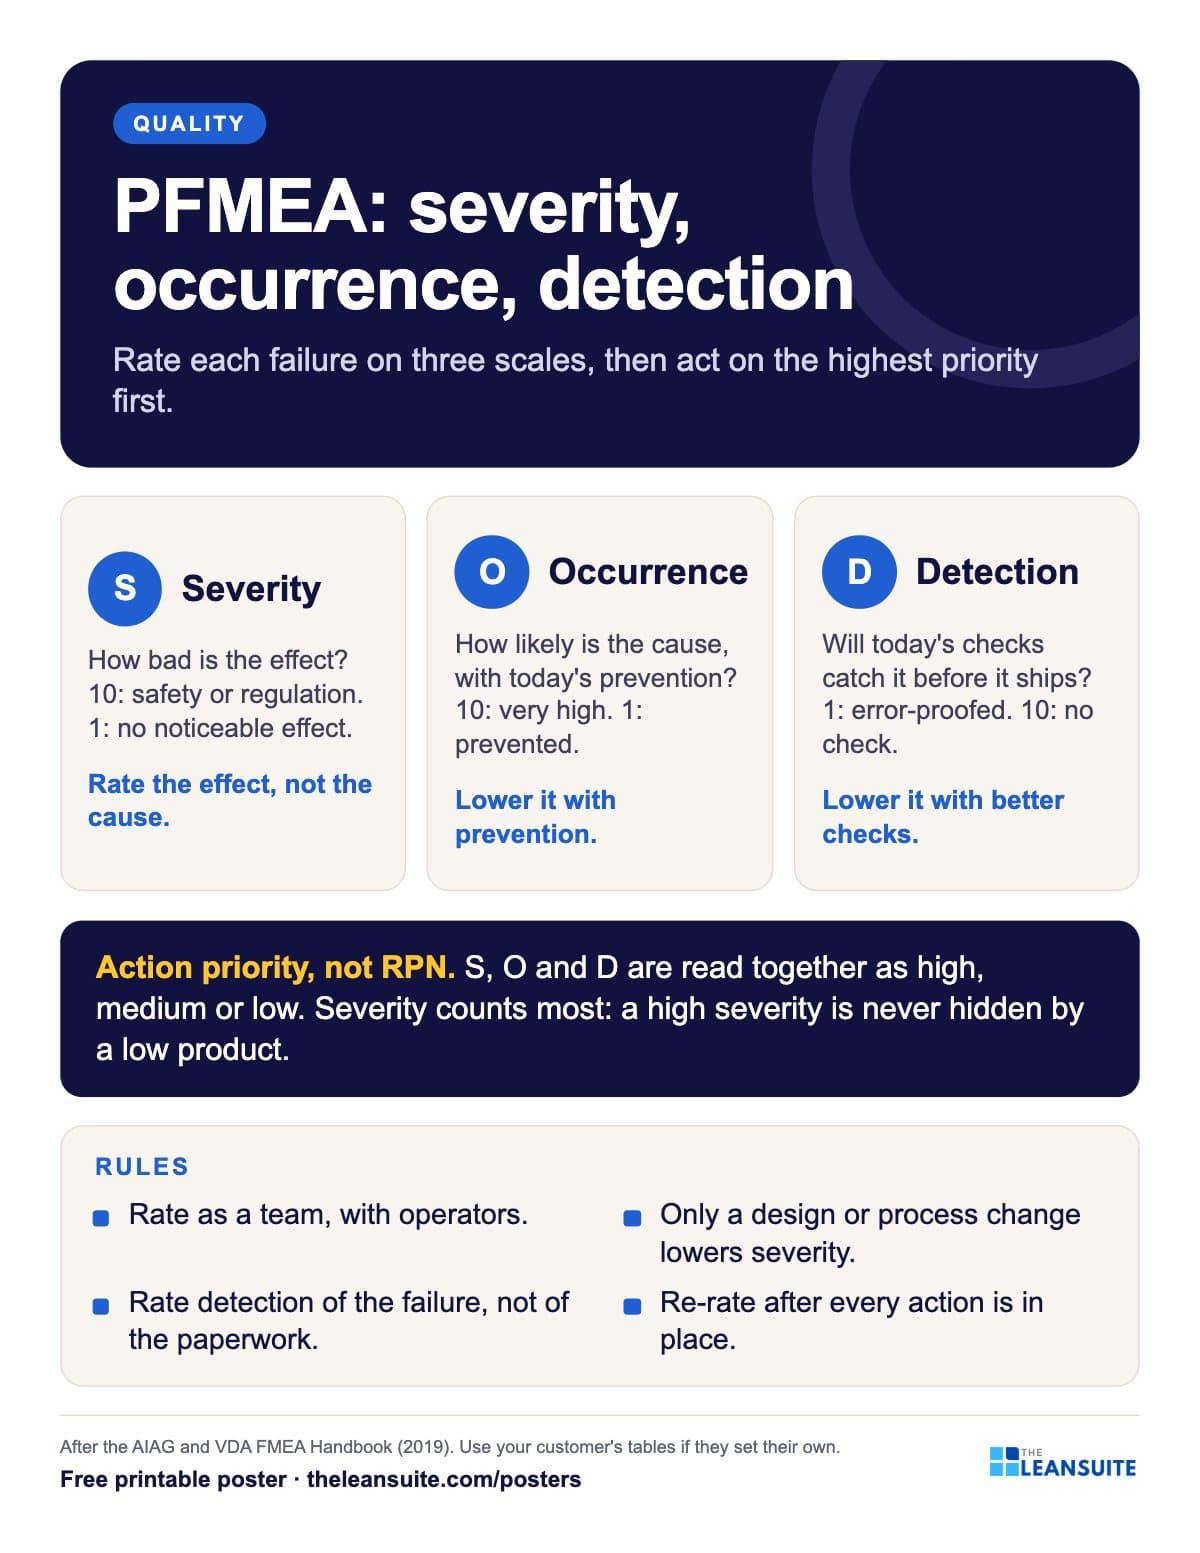 PFMEA severity, occurrence and detection poster
 How to read a control plan poster
 Layered process audit poster
 Internal audit steps poster
 Audit score 0 to 5 poster
 Reactive, preventive, proactive poster
A poster reminds. A routine makes it stick.
See how plants run their audits, improvements and follow-ups in LeanSuite, on a call built around your own problem.
Book a 45-minute demo