

Quality poster
Updated · Free to print and share
7 basic quality tools poster
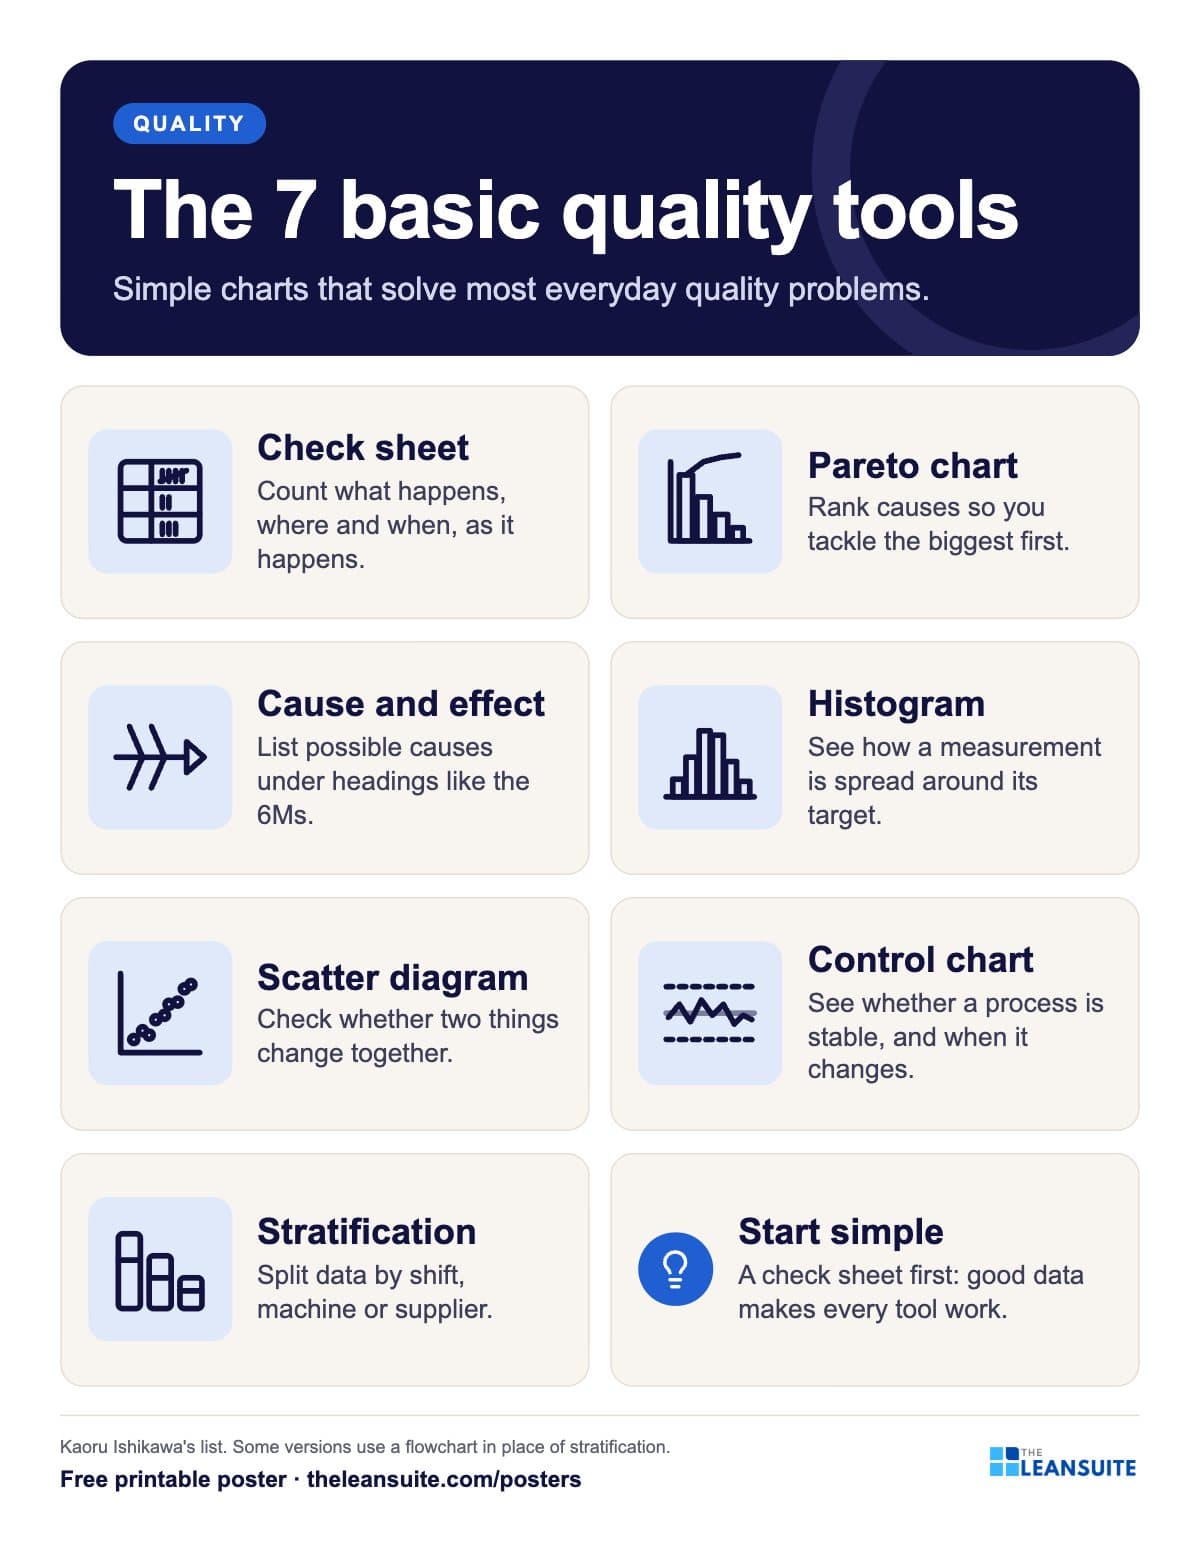
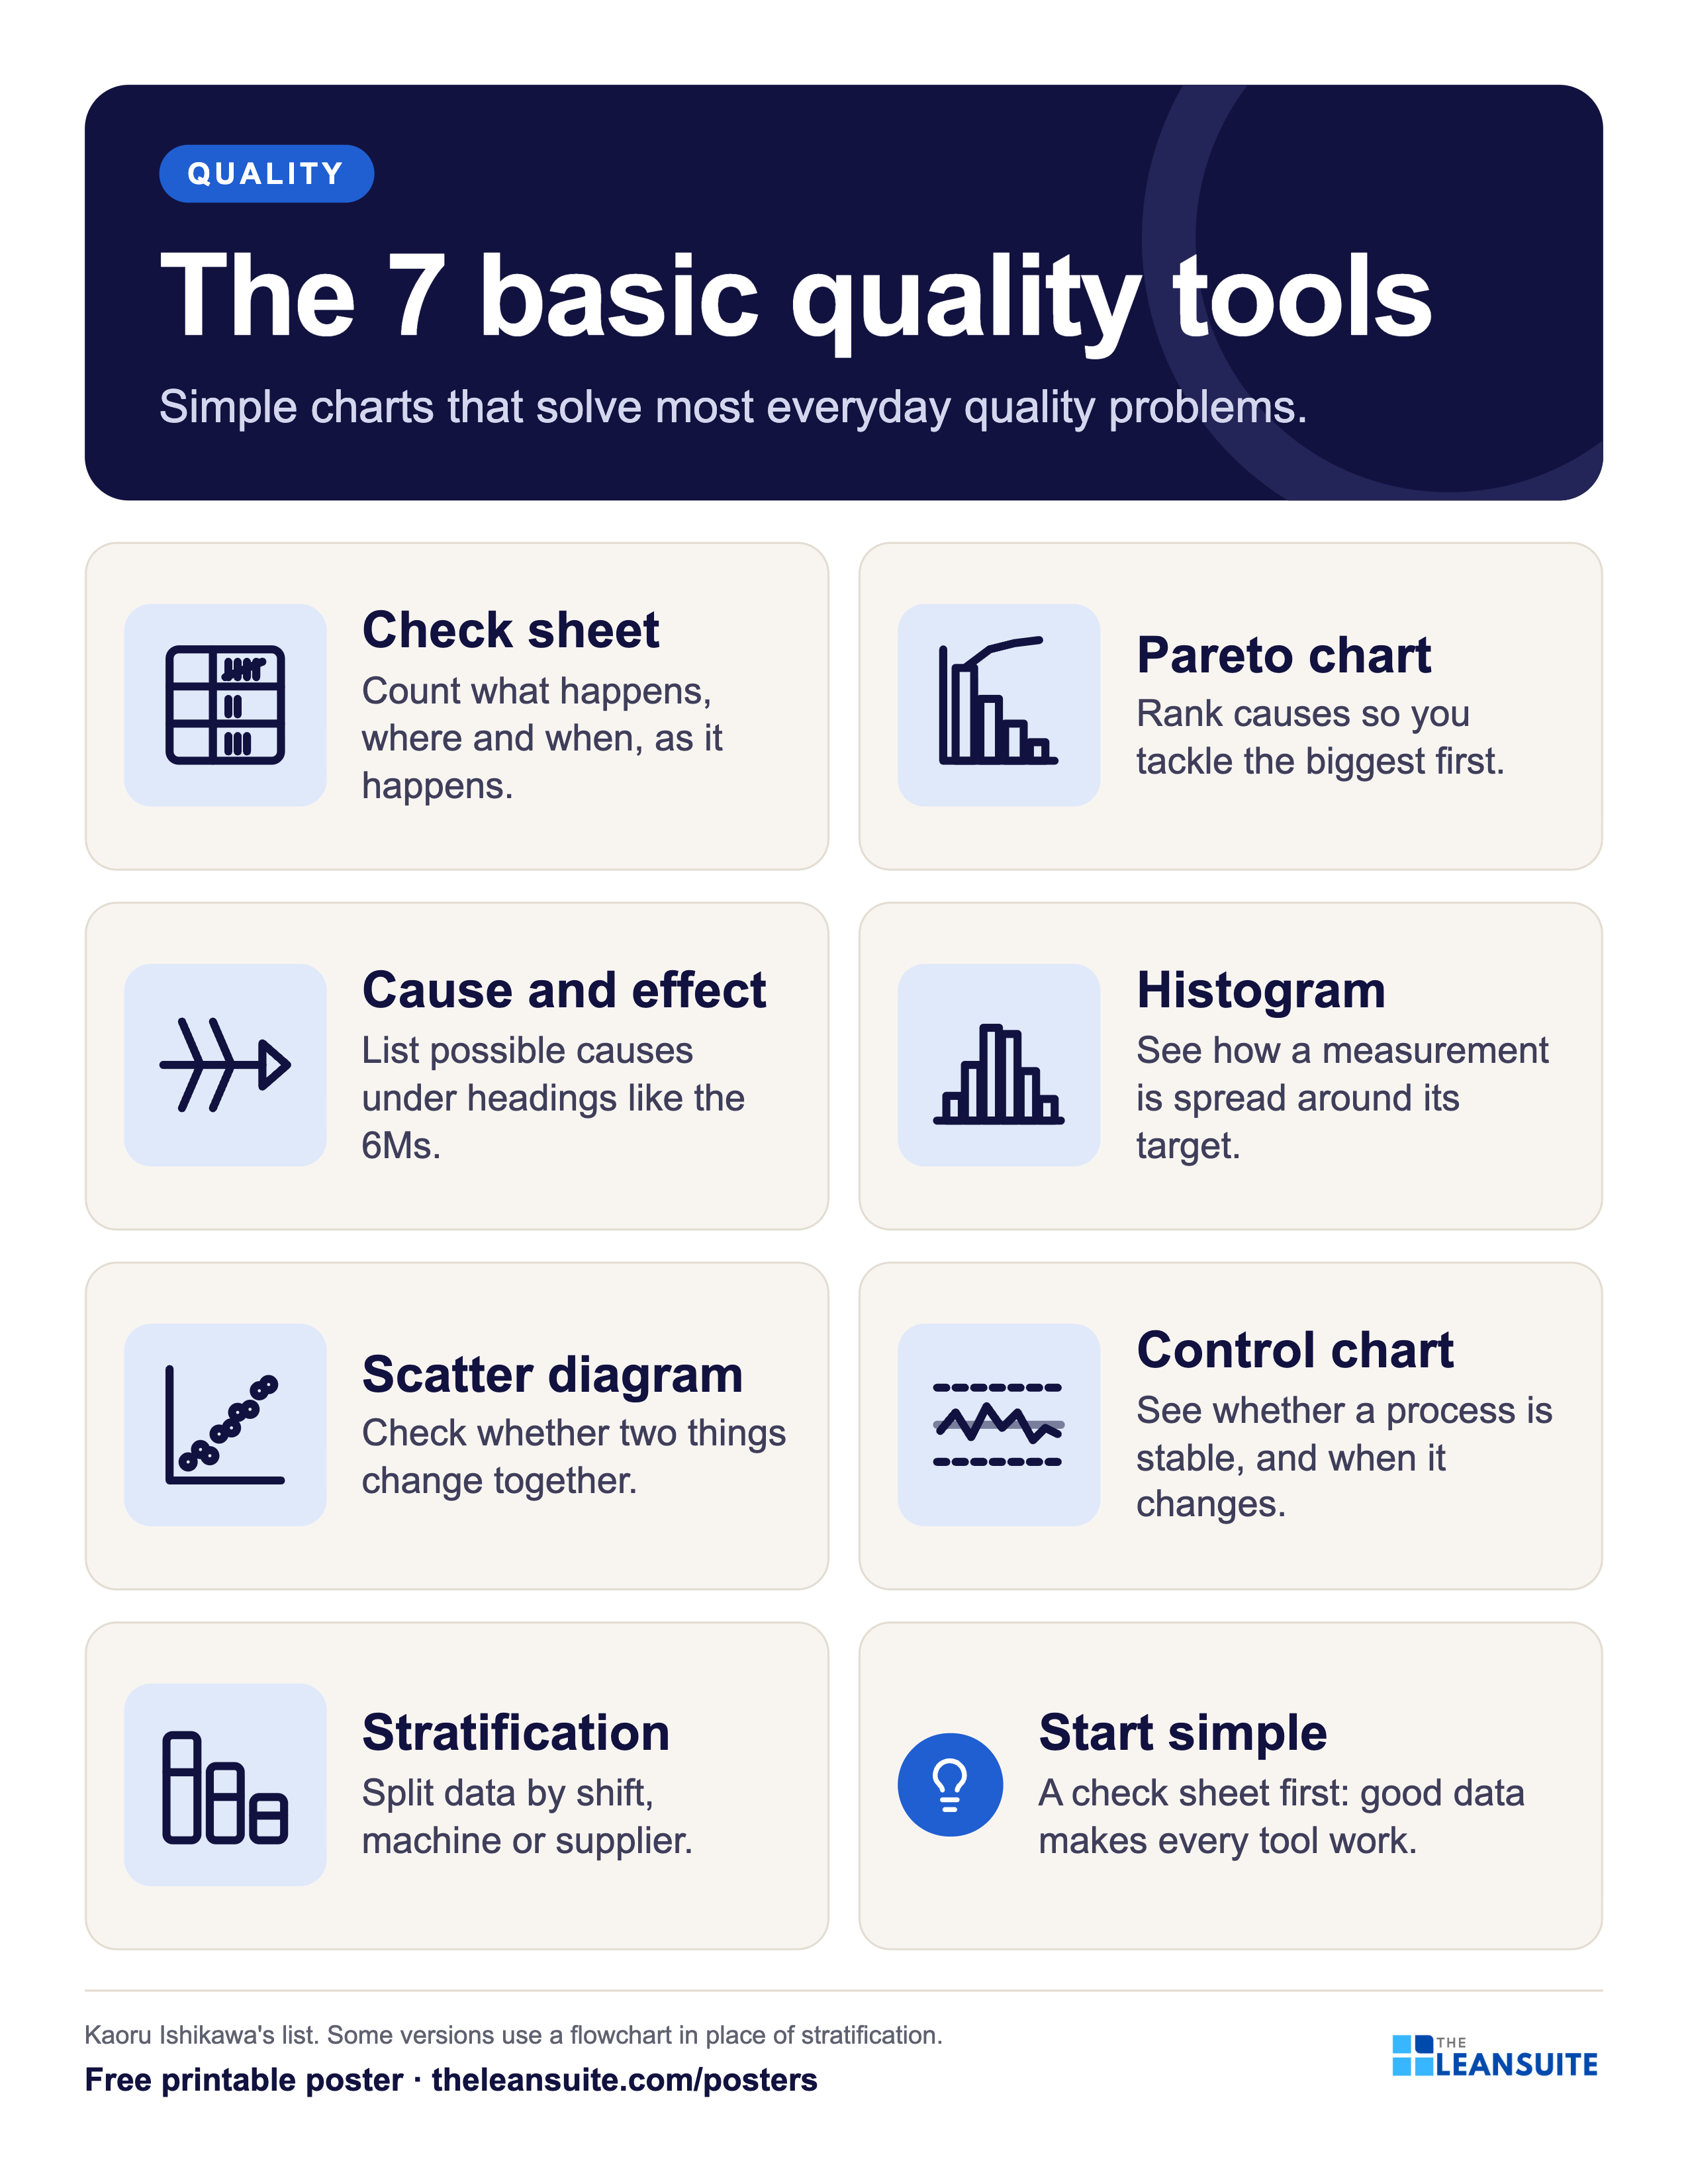
The seven basic quality tools are the simple charts Kaoru Ishikawa recommended for solving most everyday quality problems: the check sheet, Pareto chart, cause and effect (fishbone) diagram, histogram, scatter diagram, control chart and stratification. This poster draws each one and says in a line what it is for. Some versions of the list use a flowchart in place of stratification.
Download the poster
The PNG is free to download now. The print-ready vector PDFs open after a short form, once.
Free to print and share with your team. Enter your name and work email once to download.
The words on the poster
The 7 basic quality tools
Simple charts that solve most everyday quality problems.
- Check sheet Count what happens, where and when, as it happens.
- Pareto chart Rank causes so you tackle the biggest first.
- Cause and effect List possible causes under headings like the 6Ms.
- Histogram See how a measurement is spread around its target.
- Scatter diagram Check whether two things change together.
- Control chart See whether a process is stable, and when it changes.
- Stratification Split data by shift, machine or supplier.
- Start simple A check sheet first: good data makes every tool work.
Kaoru Ishikawa's list. Some versions use a flowchart in place of stratification.
On the floor
How to use it
- 1
Put it in the quality area or the training room.
- 2
When a problem comes up, ask which tool would show it best, then use the free template.
- 3
Start with a check sheet: good data makes every other tool work.
- 4
Use it with quality circles or problem-solving teams as a reference.
Which size to print
- 24 x 36 in or A2: a main wall or team board, read from a few metres away.
- 18 x 24 in or A3: a station or notice board. The A3 file also fits 11 x 17 in paper.
- Letter or A4: a clipboard, binder or handout, on any office printer.
Every PDF is vector, so it stays sharp at full size. Nothing runs to the edge of the page, so no bleed is needed.
Sources and notes
- Kaoru Ishikawa, Guide to Quality Control (Asian Productivity Organization, 1968; English edition 1976). Some later lists replace stratification with a flowchart.
Templates, decks and guides to go with it
- Defect check sheetTally defects by type and day, with units inspected, defect rates, a location sheet and the week's Pareto.
- Pareto chart templateA tally sheet, the categories sorted largest first with cumulative %, and the chart. Excel does the sorting and drawing.
- Histogram templateReadings, bins set by the square root rule, a tally and counts, the spec limits drawn and the share out of spec, with the common shapes explained.
- Scatter diagram templateUp to 50 pairs with a group code, r and R², the least squares line, the quadrant count and r for each group.
- X-bar and R control chart template25 subgroups with means and ranges, control limits from A2, D3 and D4, signal flags, both charts and a reaction log.
- Topic: Quality managementEvery guide we have on the subject, sorted.
- Topic: Root cause analysis and problem solvingEvery guide we have on the subject, sorted.
A poster reminds. A routine makes it stick.
See how plants run their audits, improvements and follow-ups in LeanSuite, on a call built around your own problem.
Schedule Demo