

Quality poster
Updated · Free to print and share
Control chart rules poster (when to react)
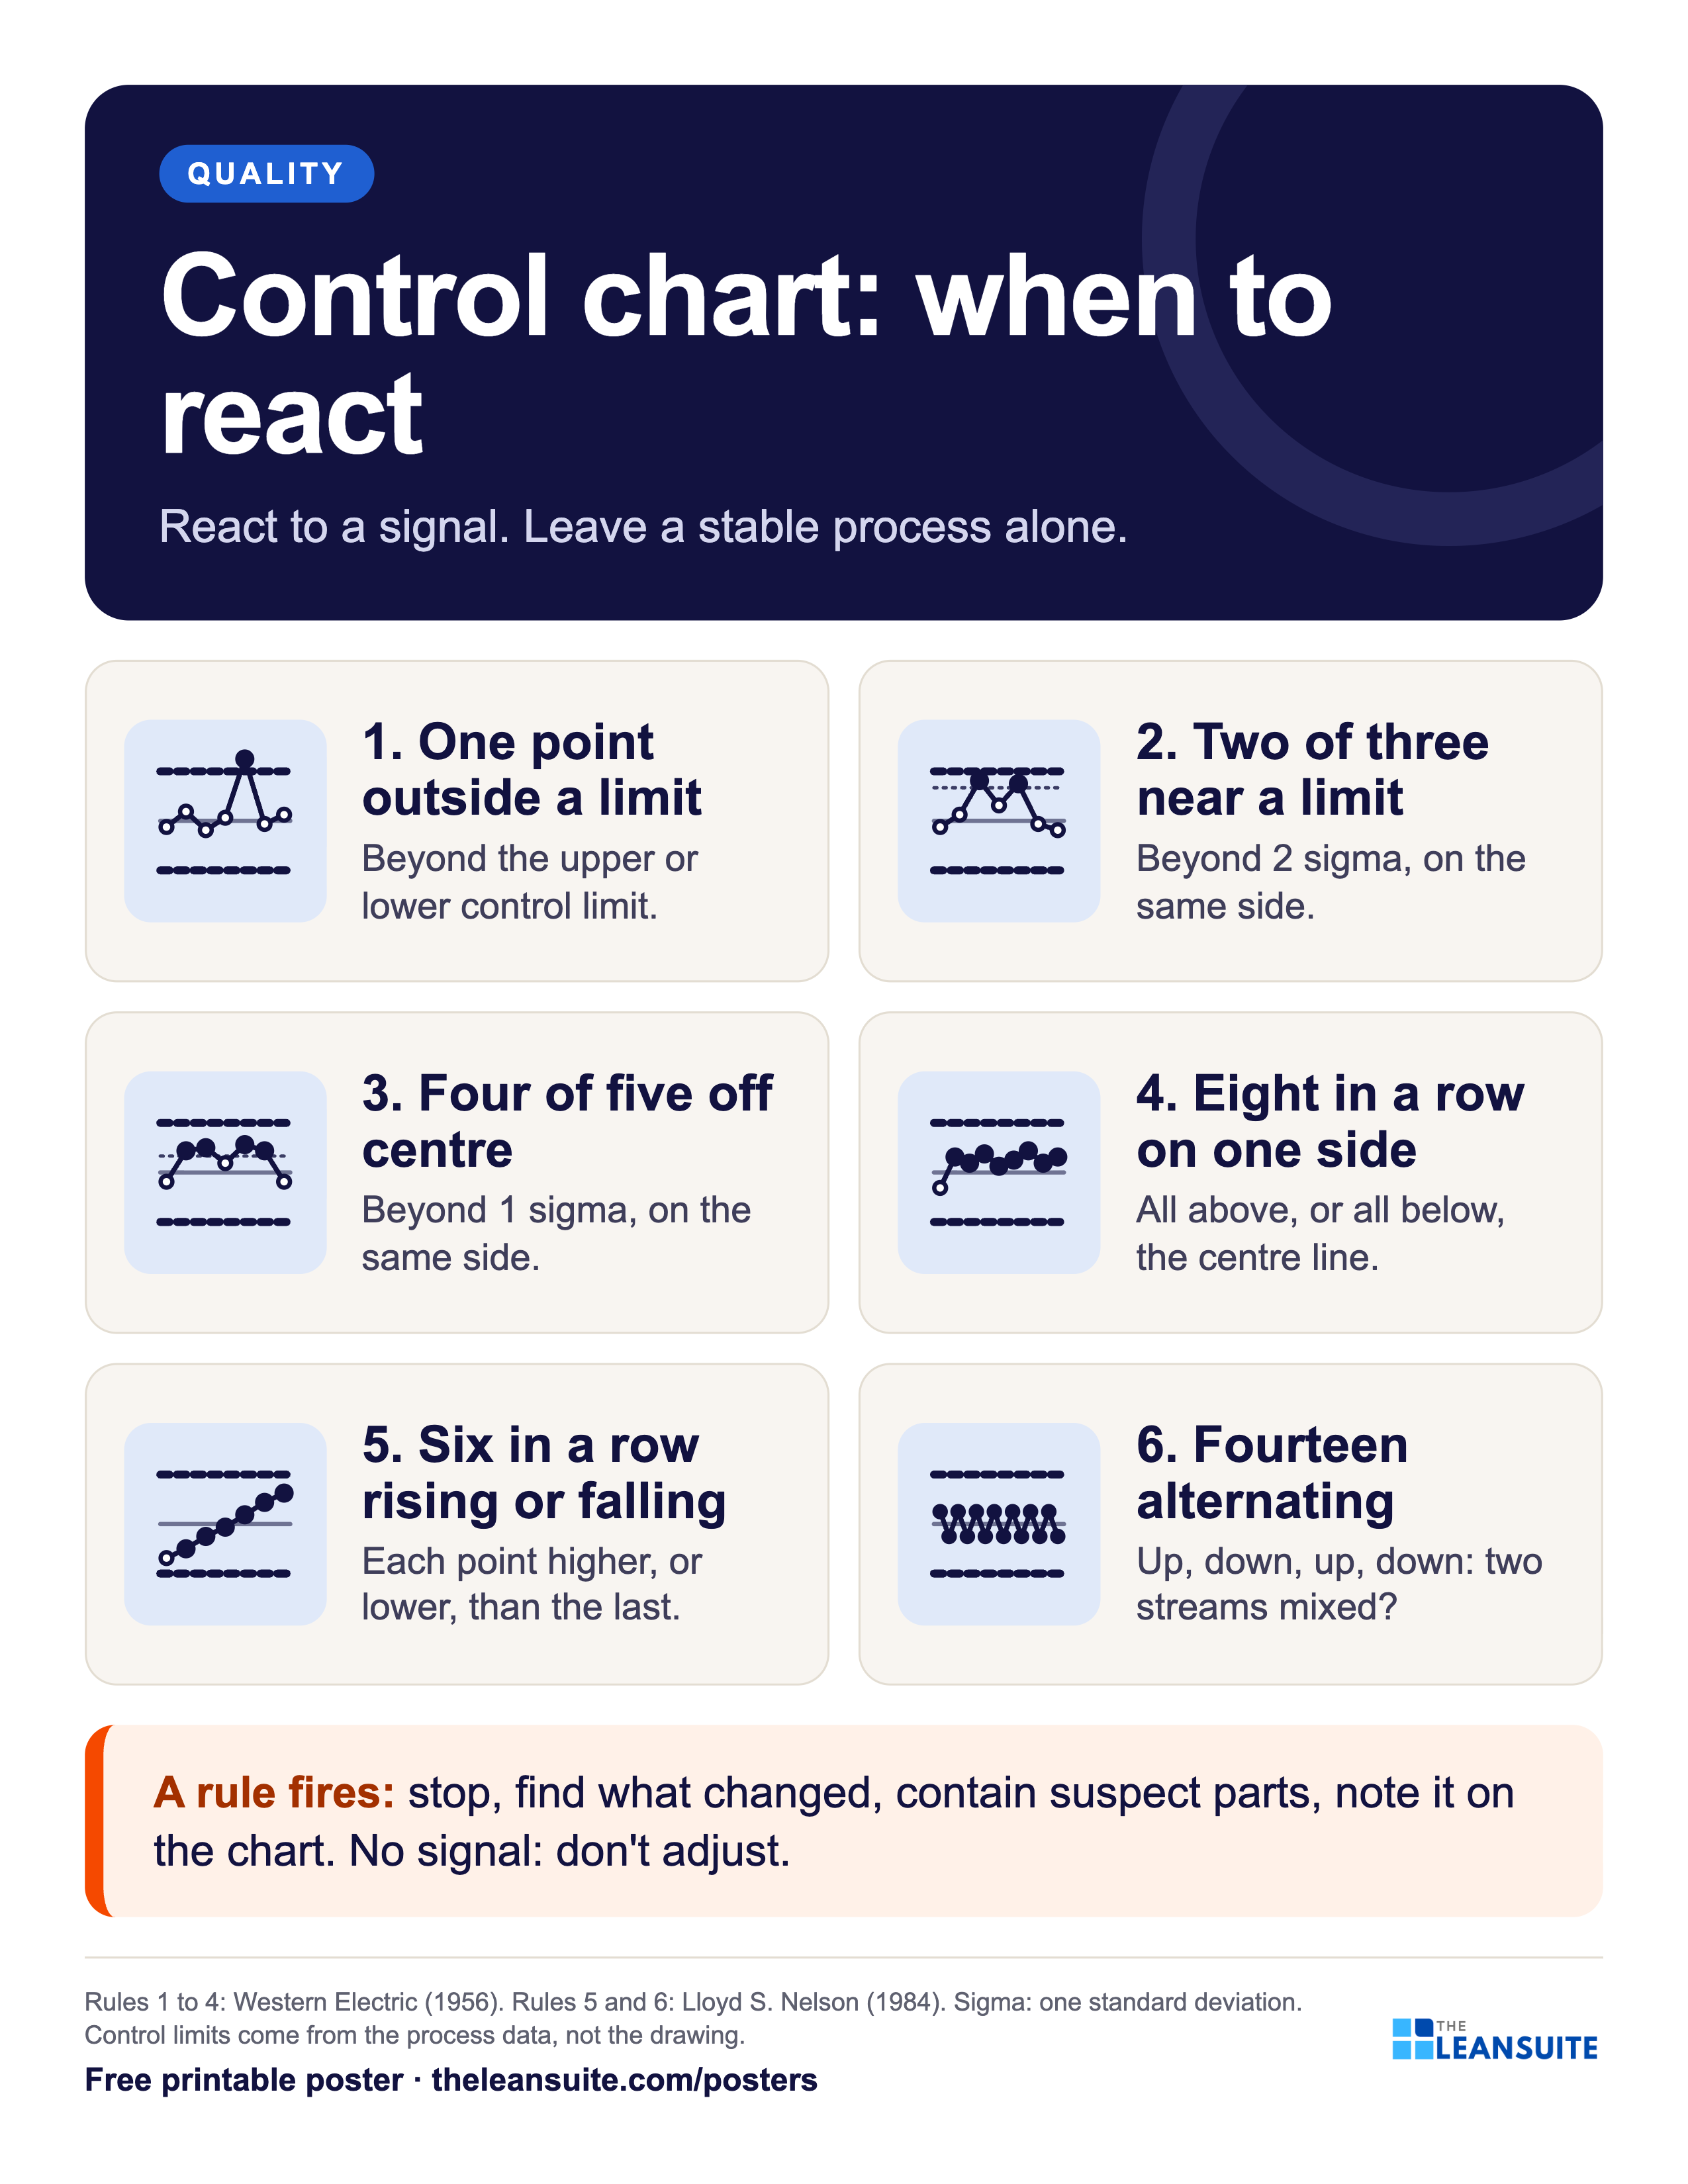
A control chart shows whether a process is stable. Points inside the limits that wander at random are common cause variation: leave the process alone. Certain patterns signal a special cause worth finding: a point beyond a limit, runs on one side, trends. This poster draws the four Western Electric rules and two of Lloyd Nelson's tests, says what to do when one fires, and reminds the team that control limits come from the process, not from the drawing.
Download the poster
The PNG is free to download now. The print-ready vector PDFs open after a short form, once.
Free to print and share with your team. Enter your name and work email once to download.
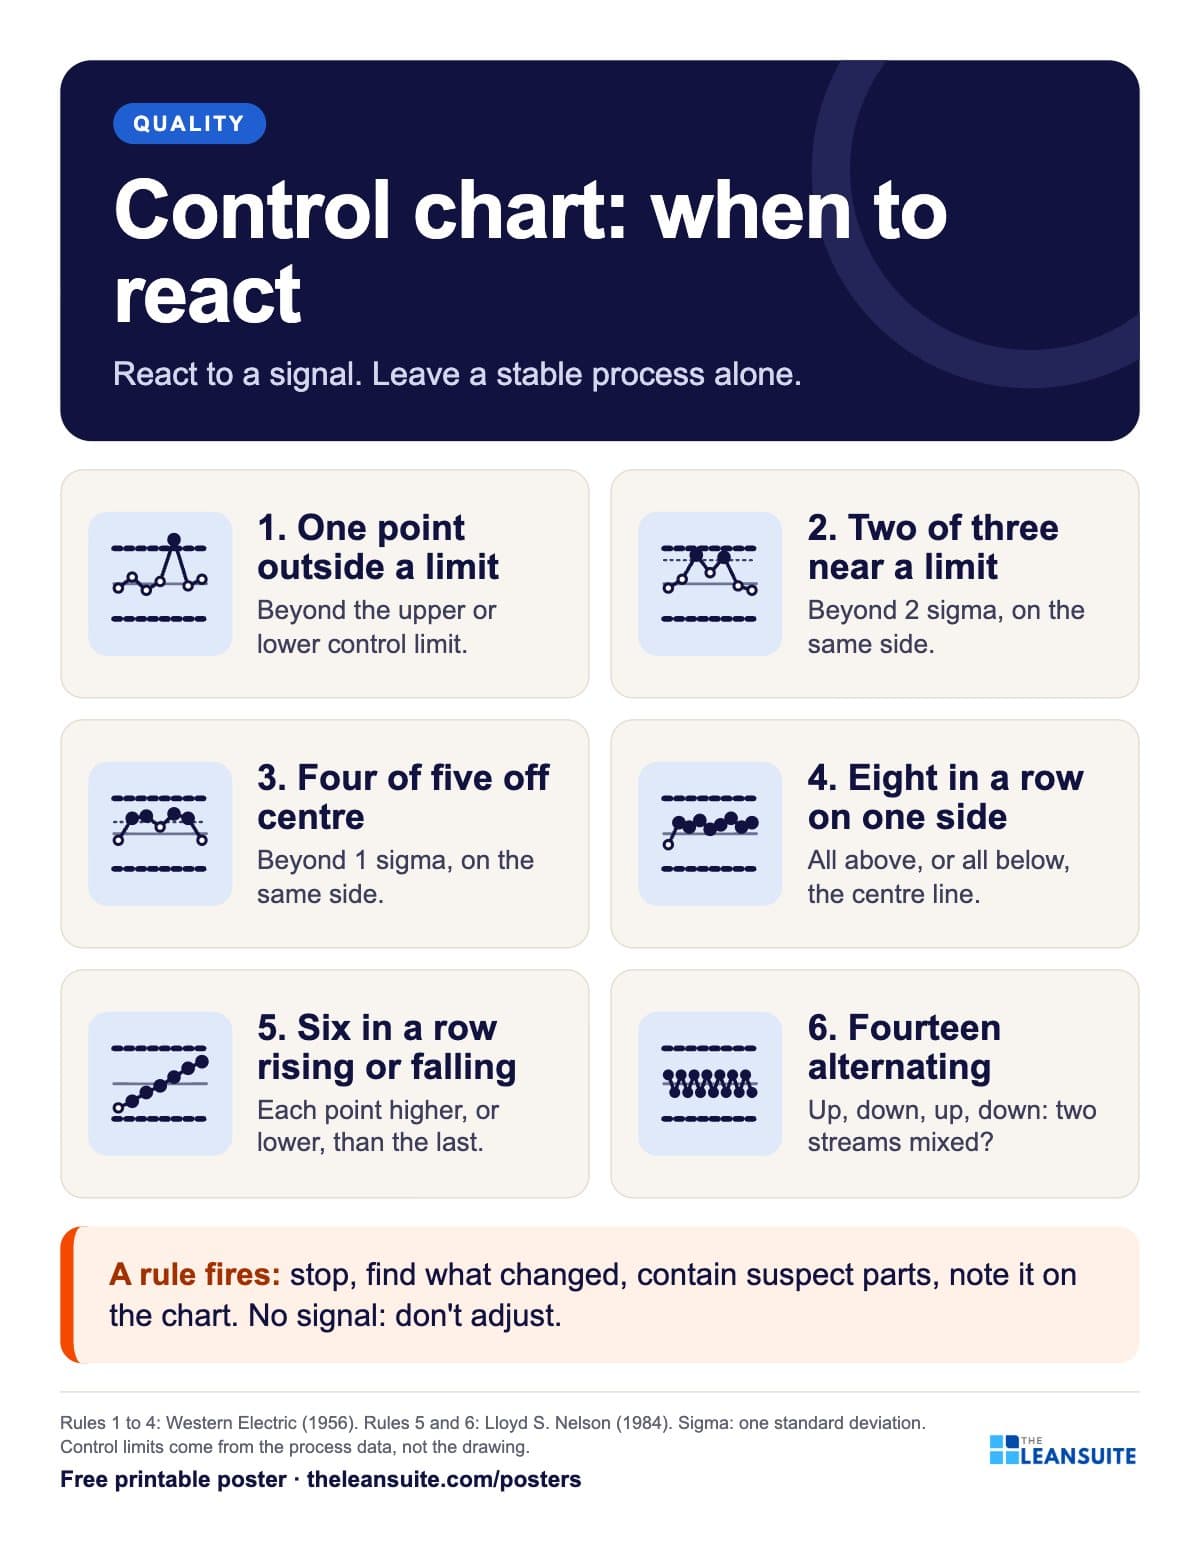 Six small charts, one per rule, from a point beyond the limits to fourteen points alternating, with what to do next.
The words on the poster
Control chart: when to react
React to a signal. Leave a stable process alone.
- 1. One point outside a limit Beyond the upper or lower control limit.
- 2. Two of three near a limit Beyond 2 sigma, on the same side.
- 3. Four of five off centre Beyond 1 sigma, on the same side.
- 4. Eight in a row on one side All above, or all below, the centre line.
- 5. Six in a row rising or falling Each point higher, or lower, than the last.
- 6. Fourteen alternating Up, down, up, down: two streams mixed?
- A rule fires: stop, find what changed, contain suspect parts, note it on the chart. No signal: don't adjust.
Rules 1 to 4: Western Electric (1956). Rules 5 and 6: Lloyd S. Nelson (1984). Sigma: one standard deviation. Control limits come from the process data, not the drawing.
On the floor
How to use it
Putting the Control chart rules poster (when to react) poster to work
- 1
Post it next to every control chart kept at a machine.
- 2
Agree which rules your plant uses before you print: many use rules 1 to 4 only.
- 3
When a rule fires, write what you found on the chart at that point.
- 4
Pair it with the free control chart template and out-of-control action plan.
Which size to print
- 24 x 36 in or A2: a main wall or team board, read from a few metres away.
- 18 x 24 in or A3: a station or notice board. The A3 file also fits 11 x 17 in paper.
- Letter or A4: a clipboard, binder or handout, on any office printer.
Every PDF is vector, so it stays sharp at full size. Nothing runs to the edge of the page, so no bleed is needed.
Sources and notes
- Western Electric Company, Statistical Quality Control Handbook (1956): rules 1 to 4, with zones at one, two and three standard deviations.
- Lloyd S. Nelson, "The Shewhart Control Chart: Tests for Special Causes", Journal of Quality Technology 16(4), 1984: trend and alternating tests.
Templates, decks and guides to go with it
- X-bar and R control chart template25 subgroups with means and ranges, control limits from A2, D3 and D4, signal flags, both charts and a reaction log.
- Out-of-control action plan (OCAP) templateA reaction plan for a control chart: the steps, what each signal means, who to call and a log of events.
- I-MR chart template (individuals and moving range)Up to 100 single readings with moving ranges, limits from a baseline, five run-rule flags, both charts, a second phase and a reaction log.
- Topic: Quality managementEvery guide we have on the subject, sorted.
More quality posters
All posters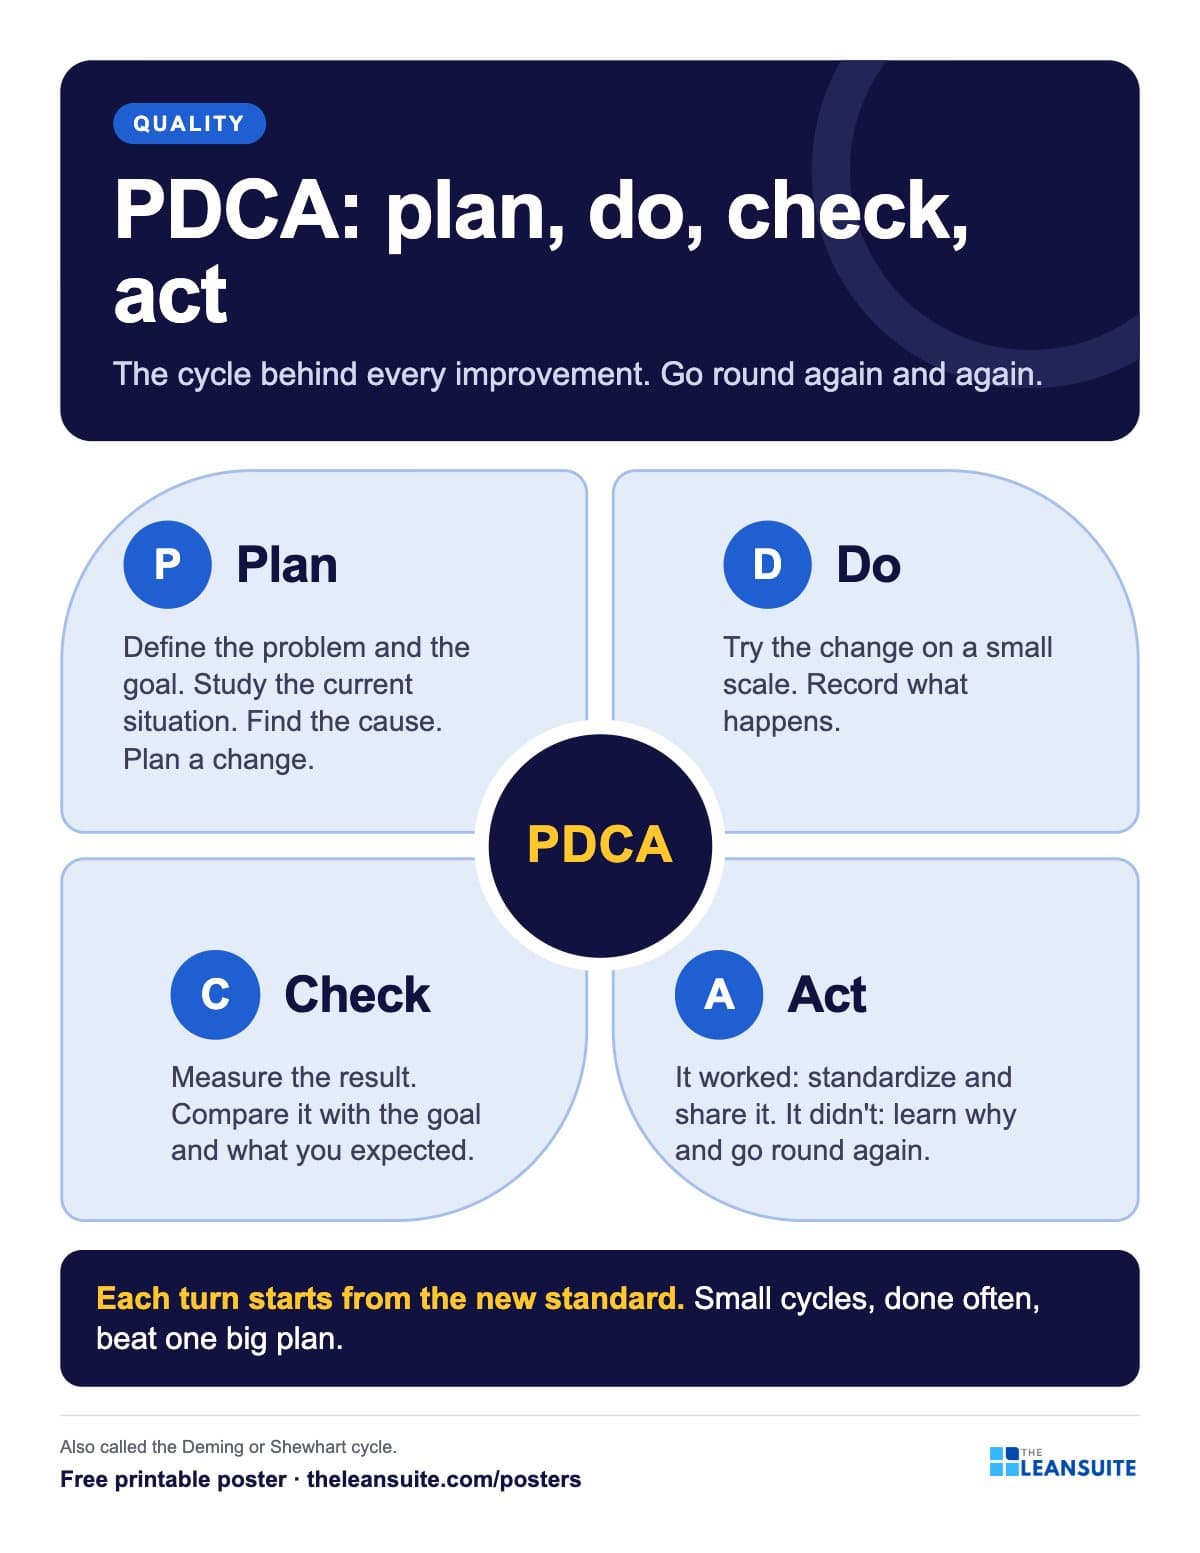 PDCA cycle poster
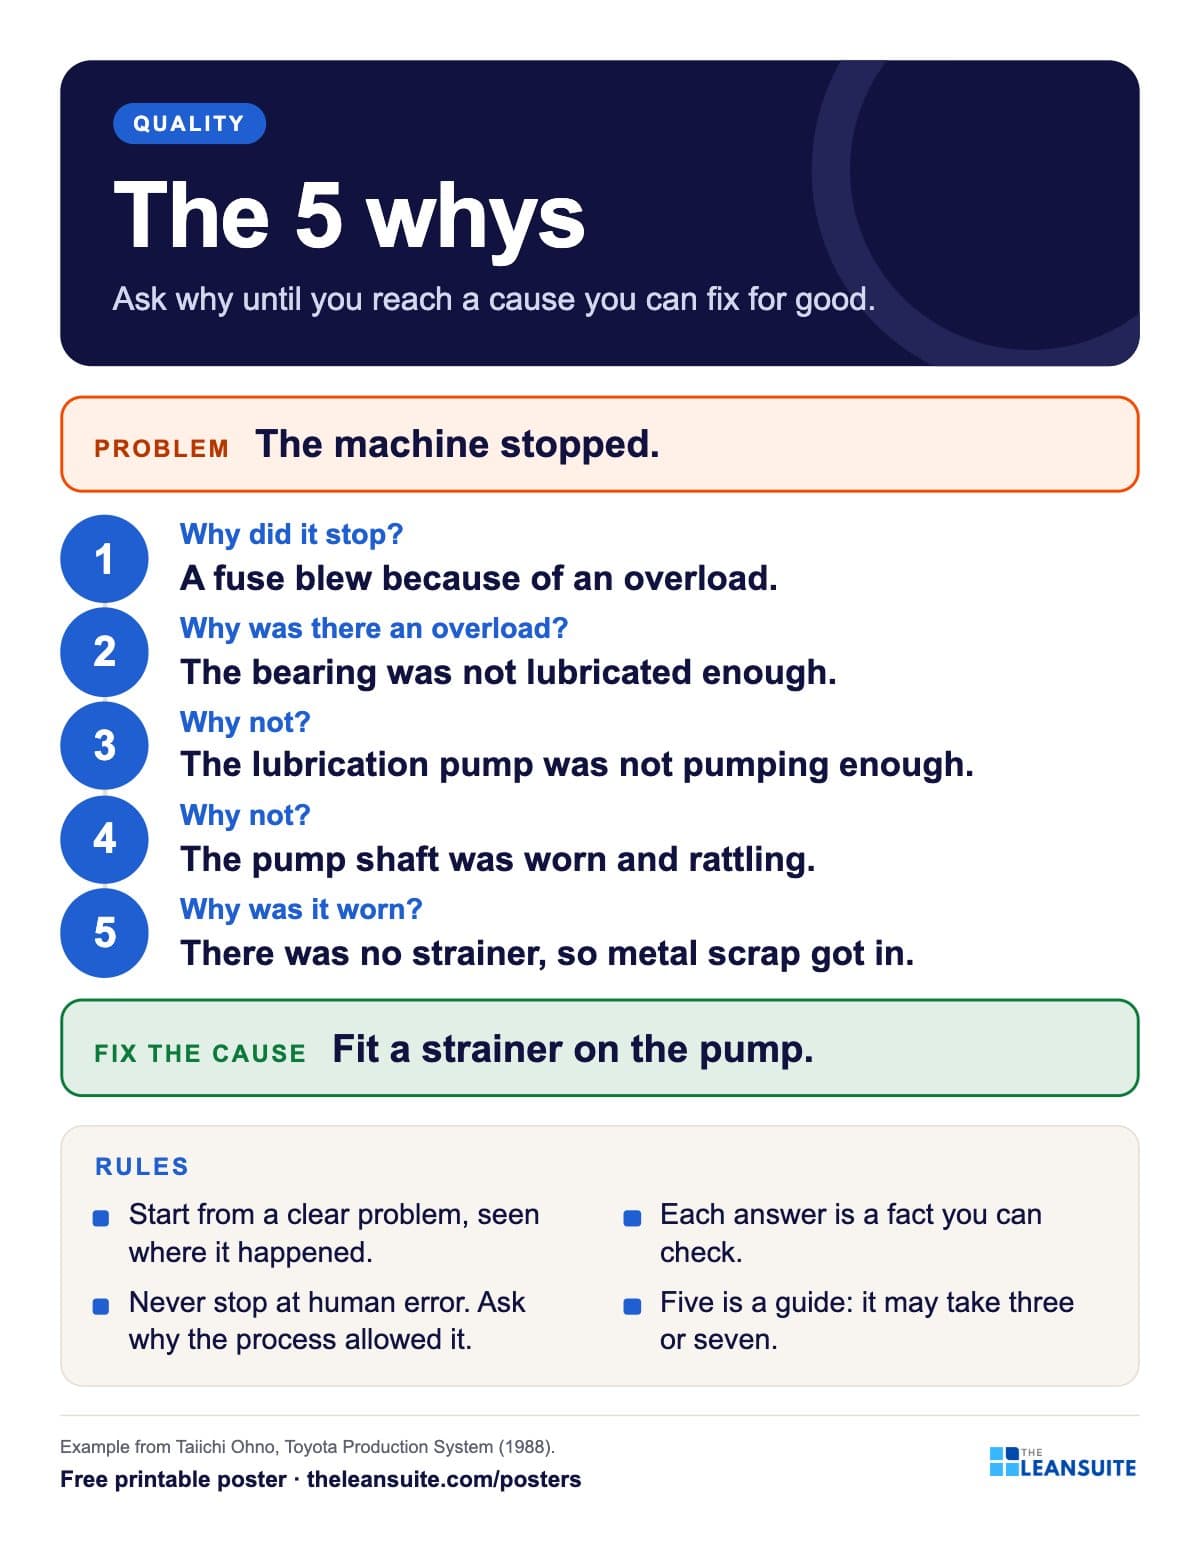 5 whys poster
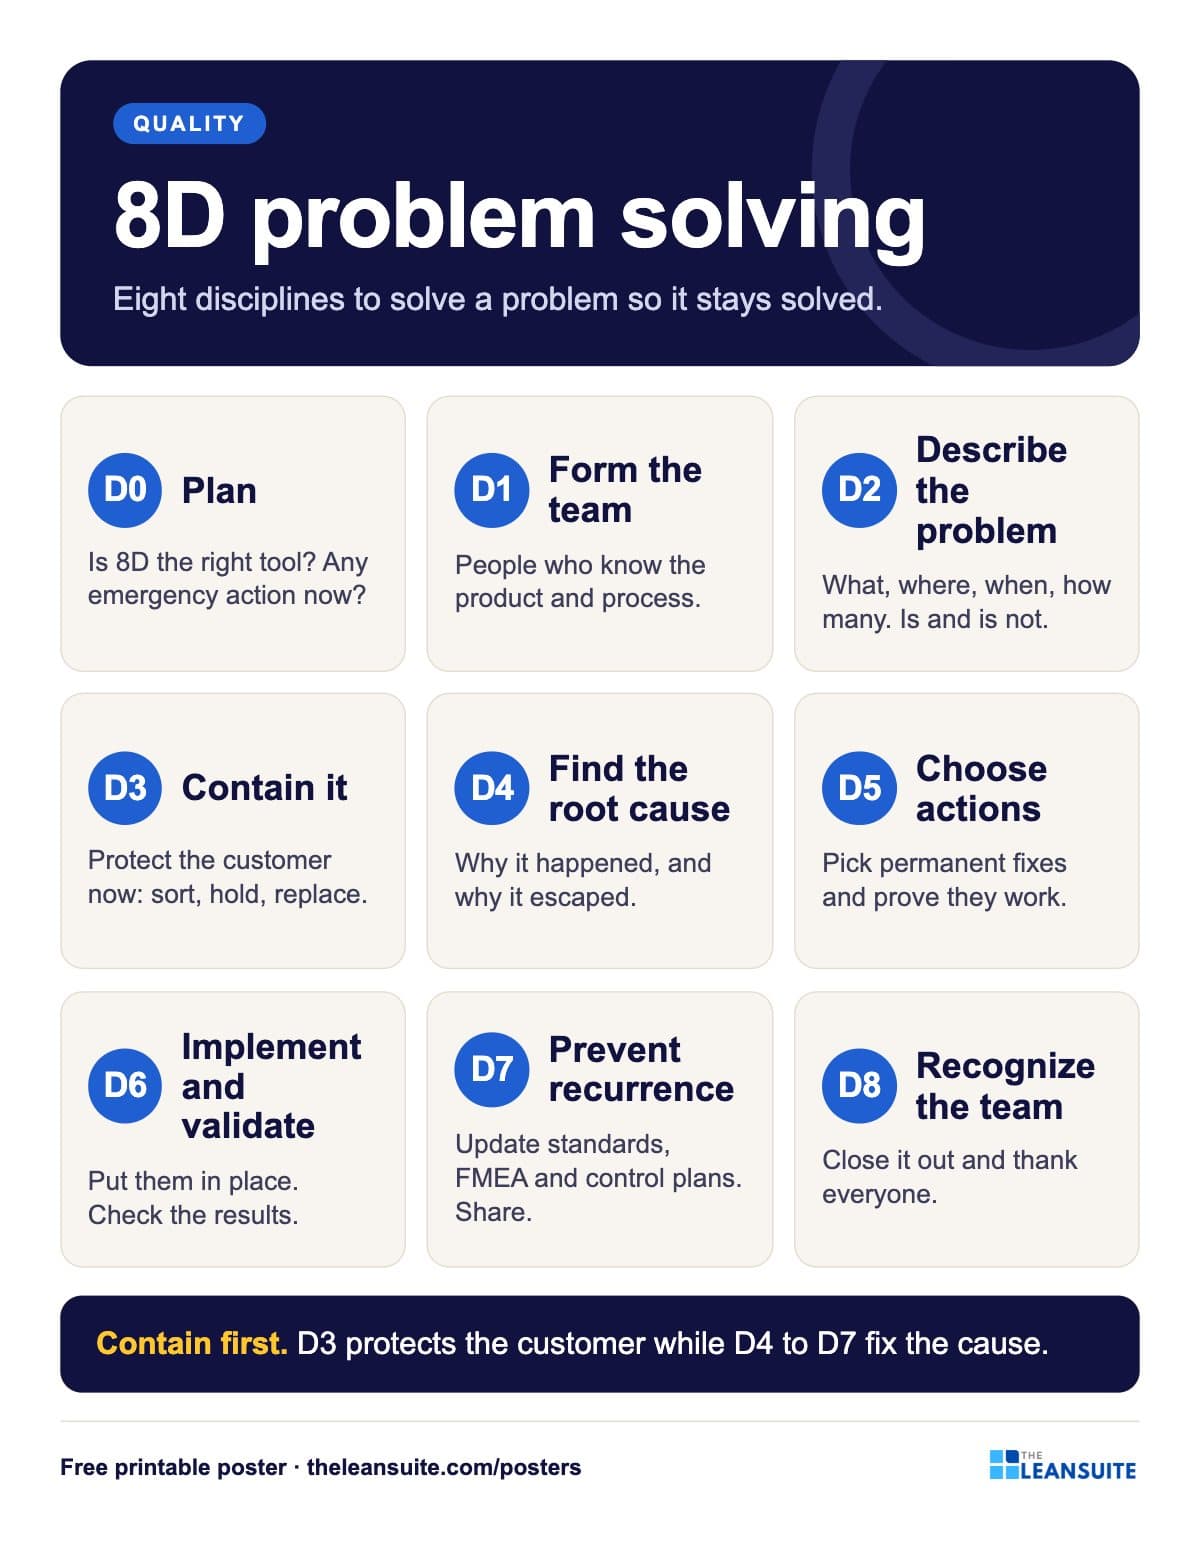 8D problem solving poster
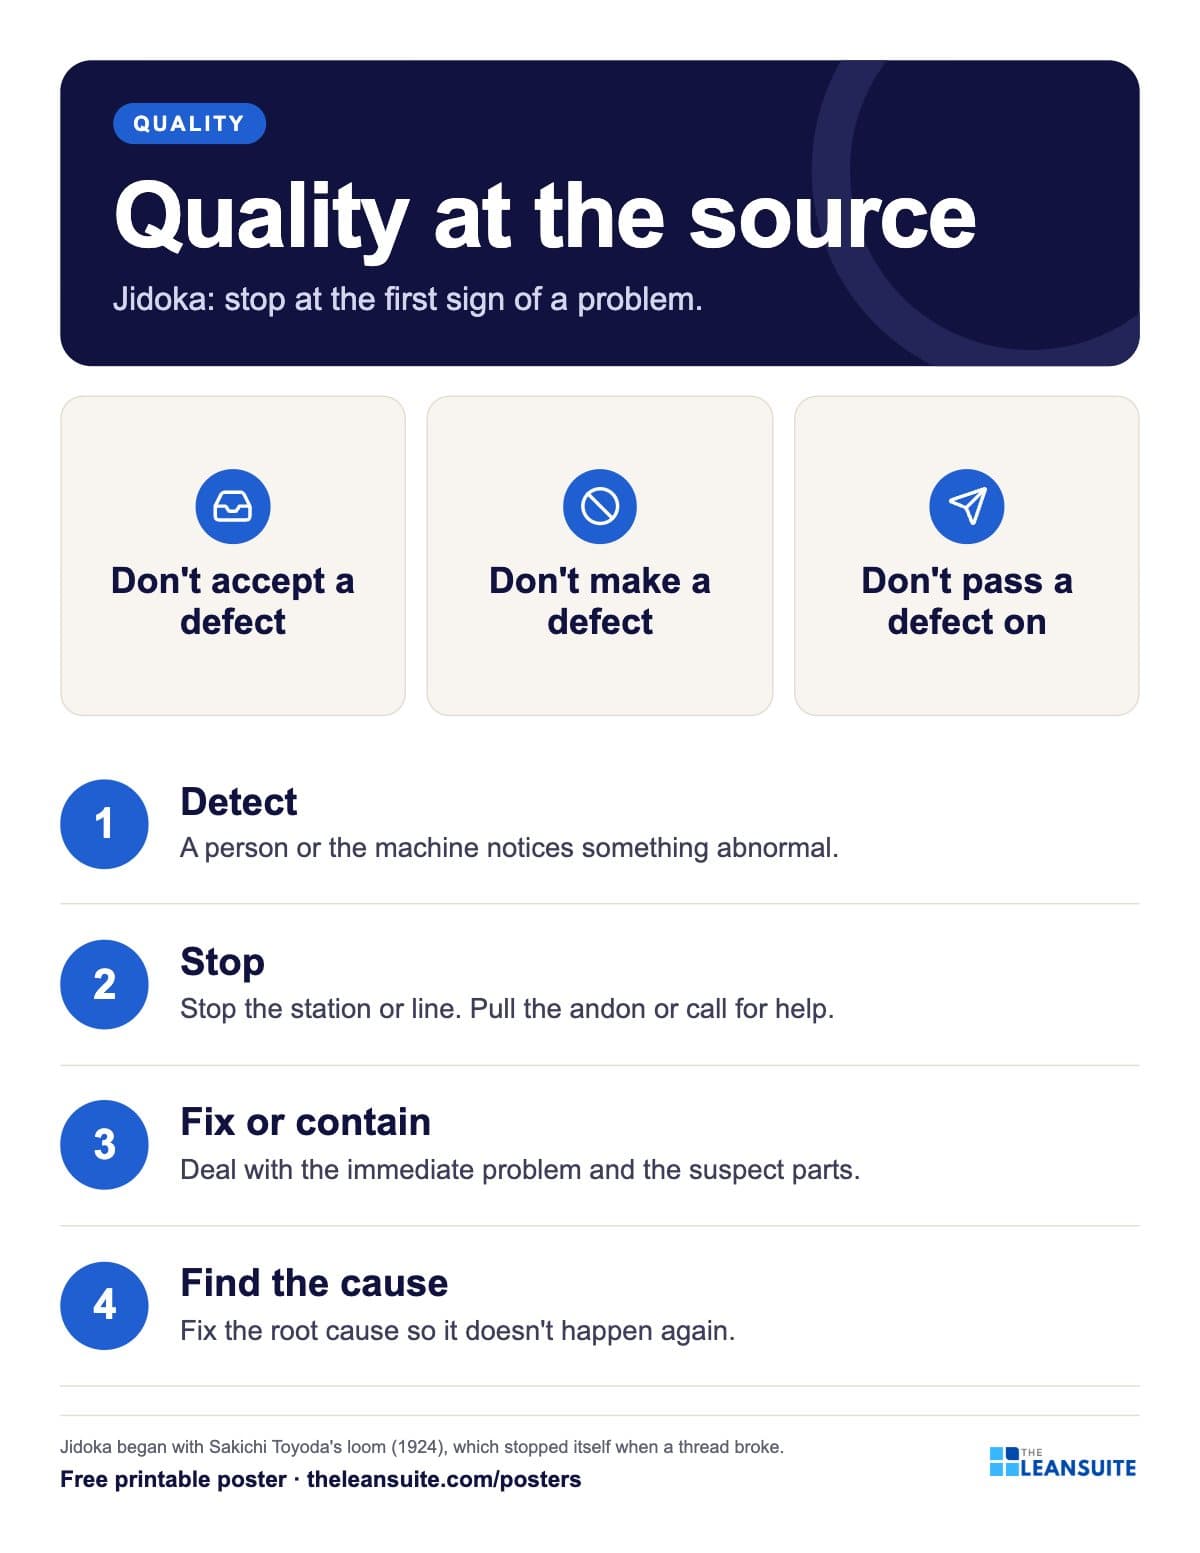 Jidoka and quality at the source poster
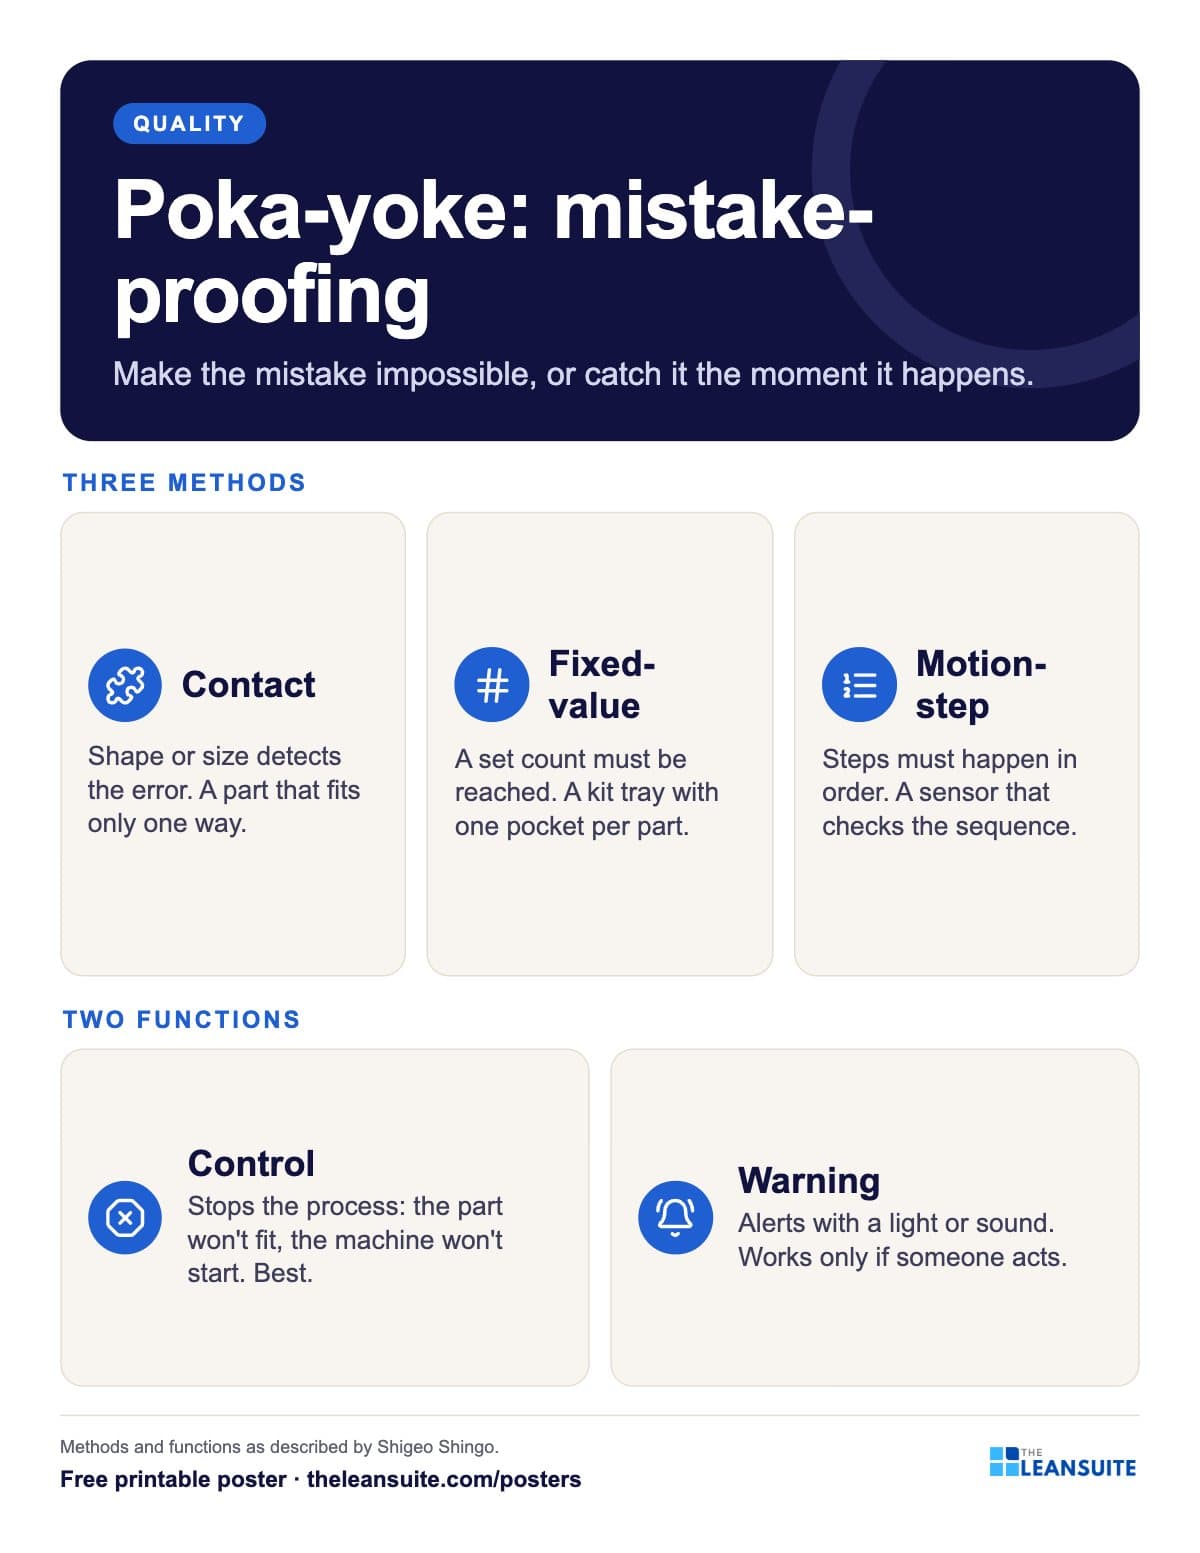 Poka-yoke types poster
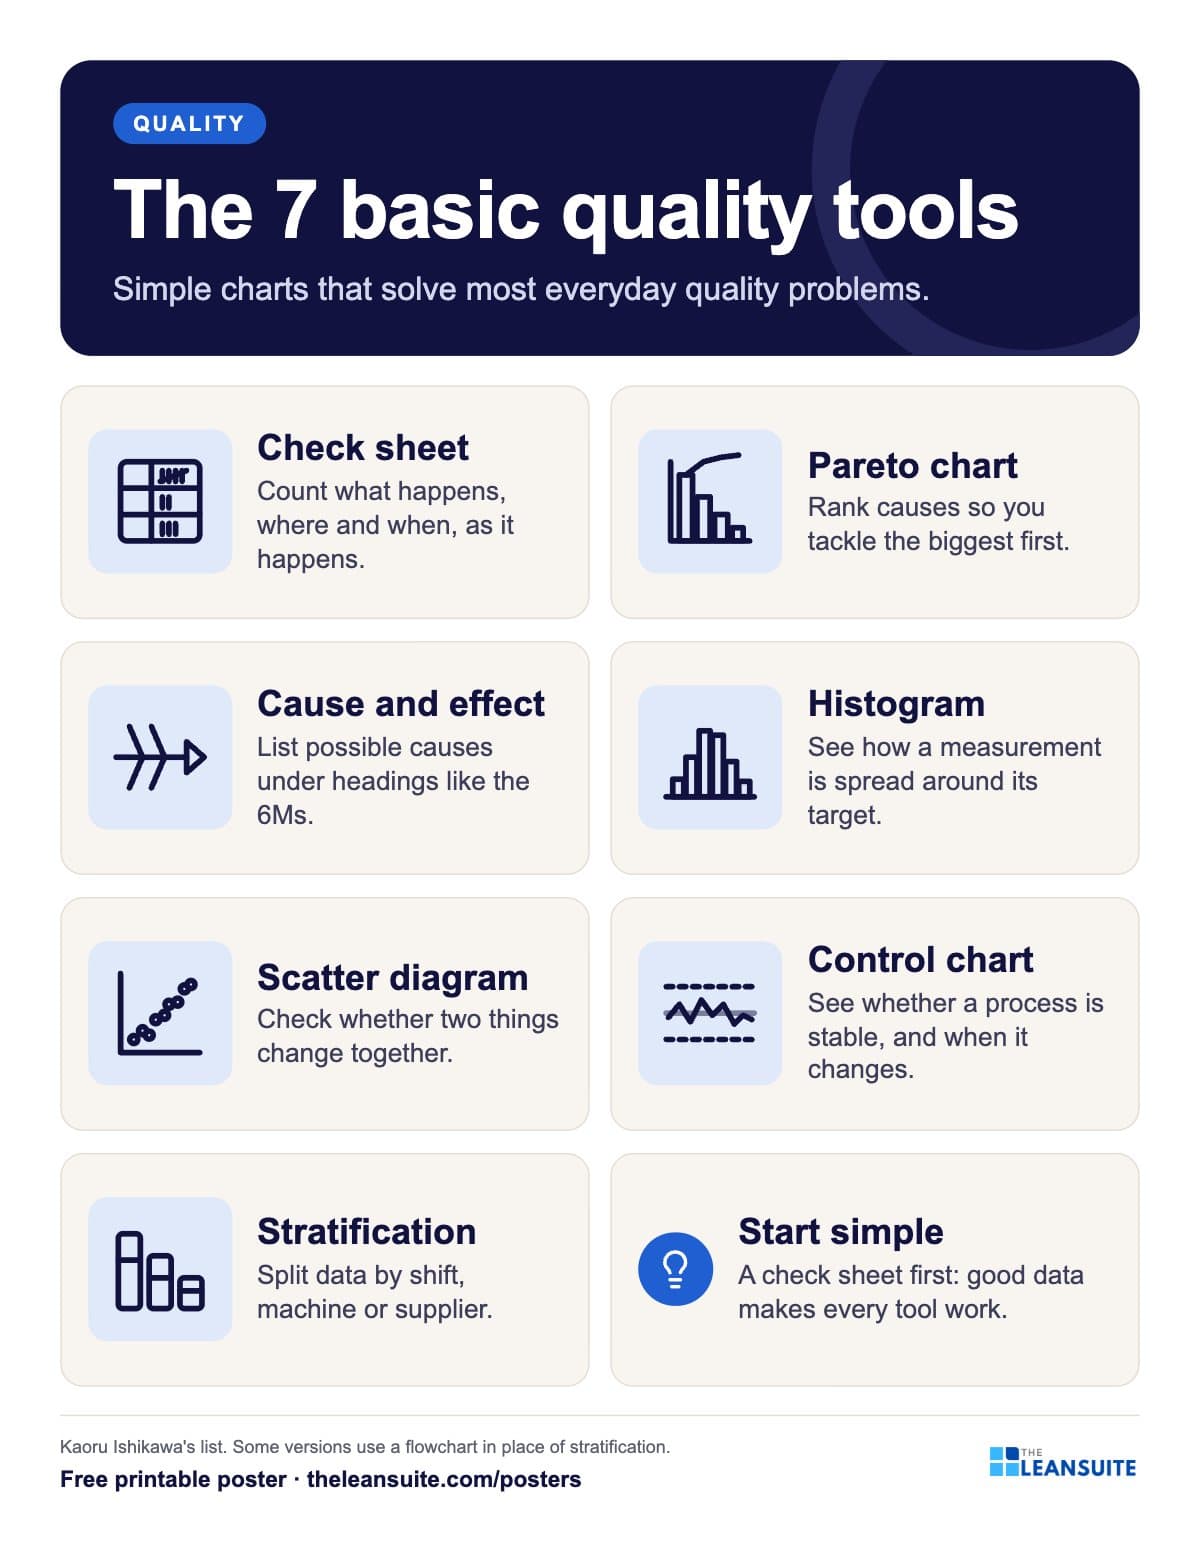 7 basic quality tools poster
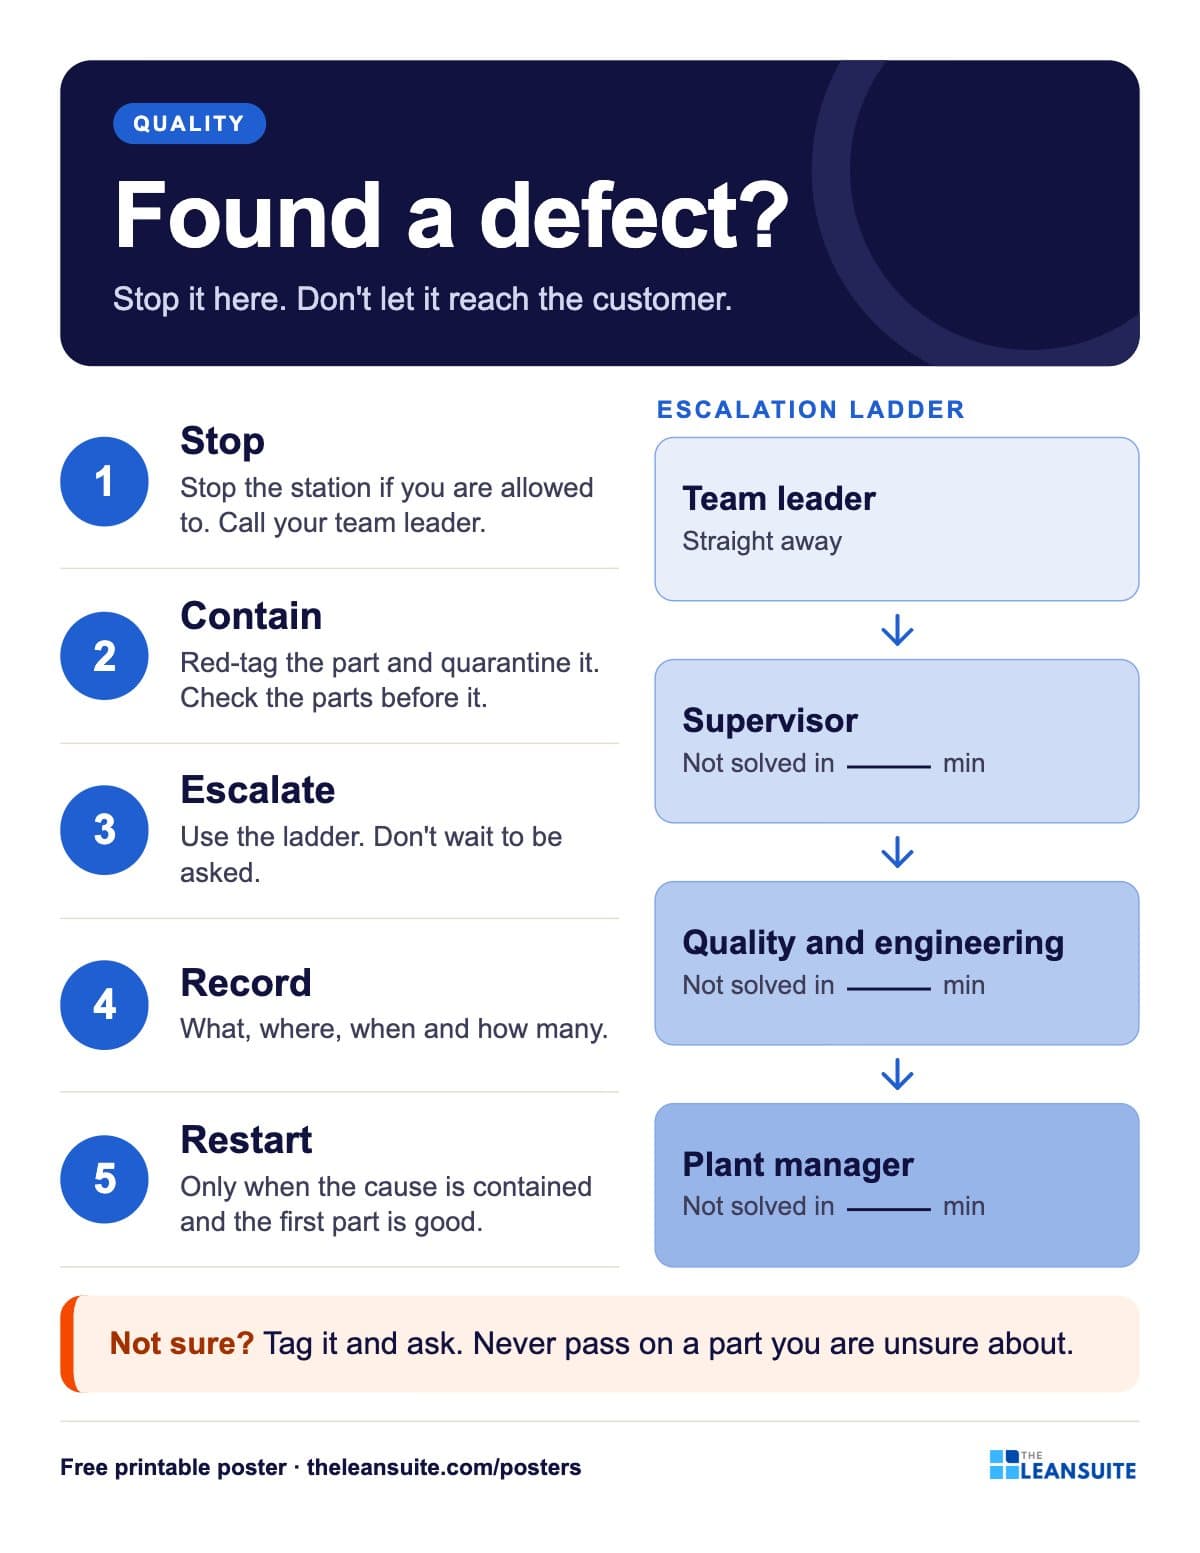 Defect escalation poster (red tag and stop the line)
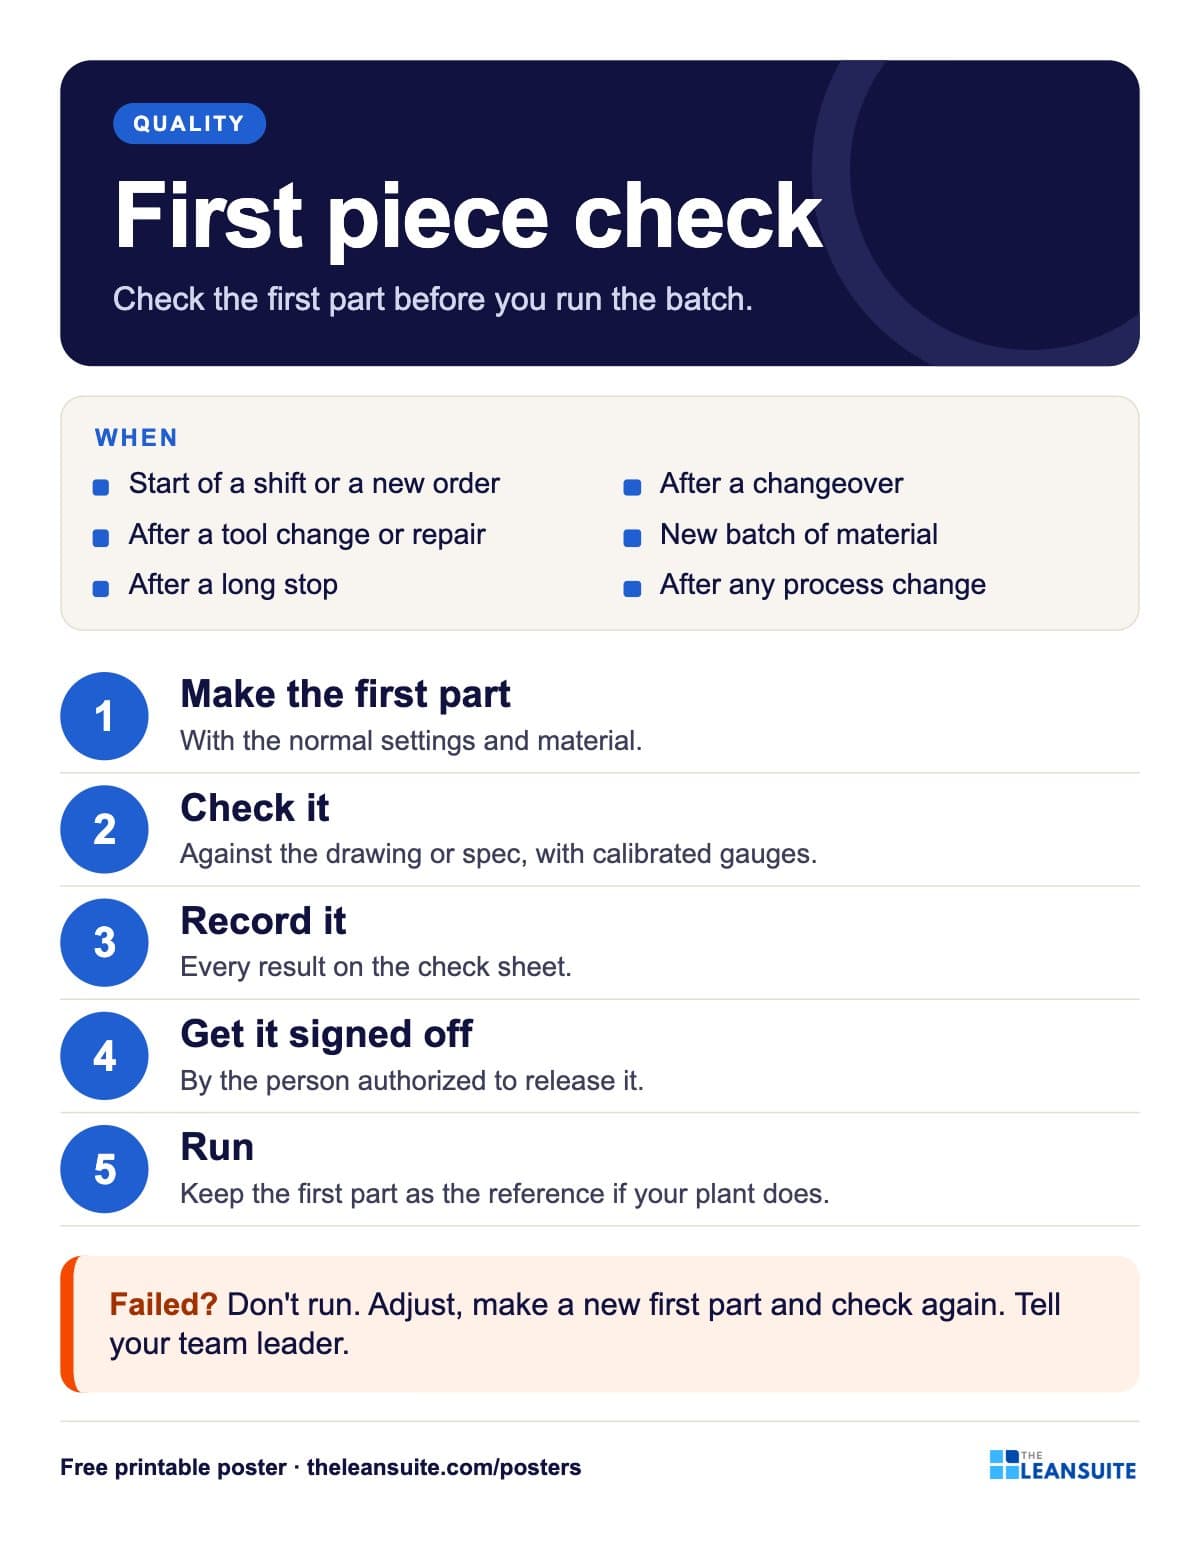 First piece (first article) check poster
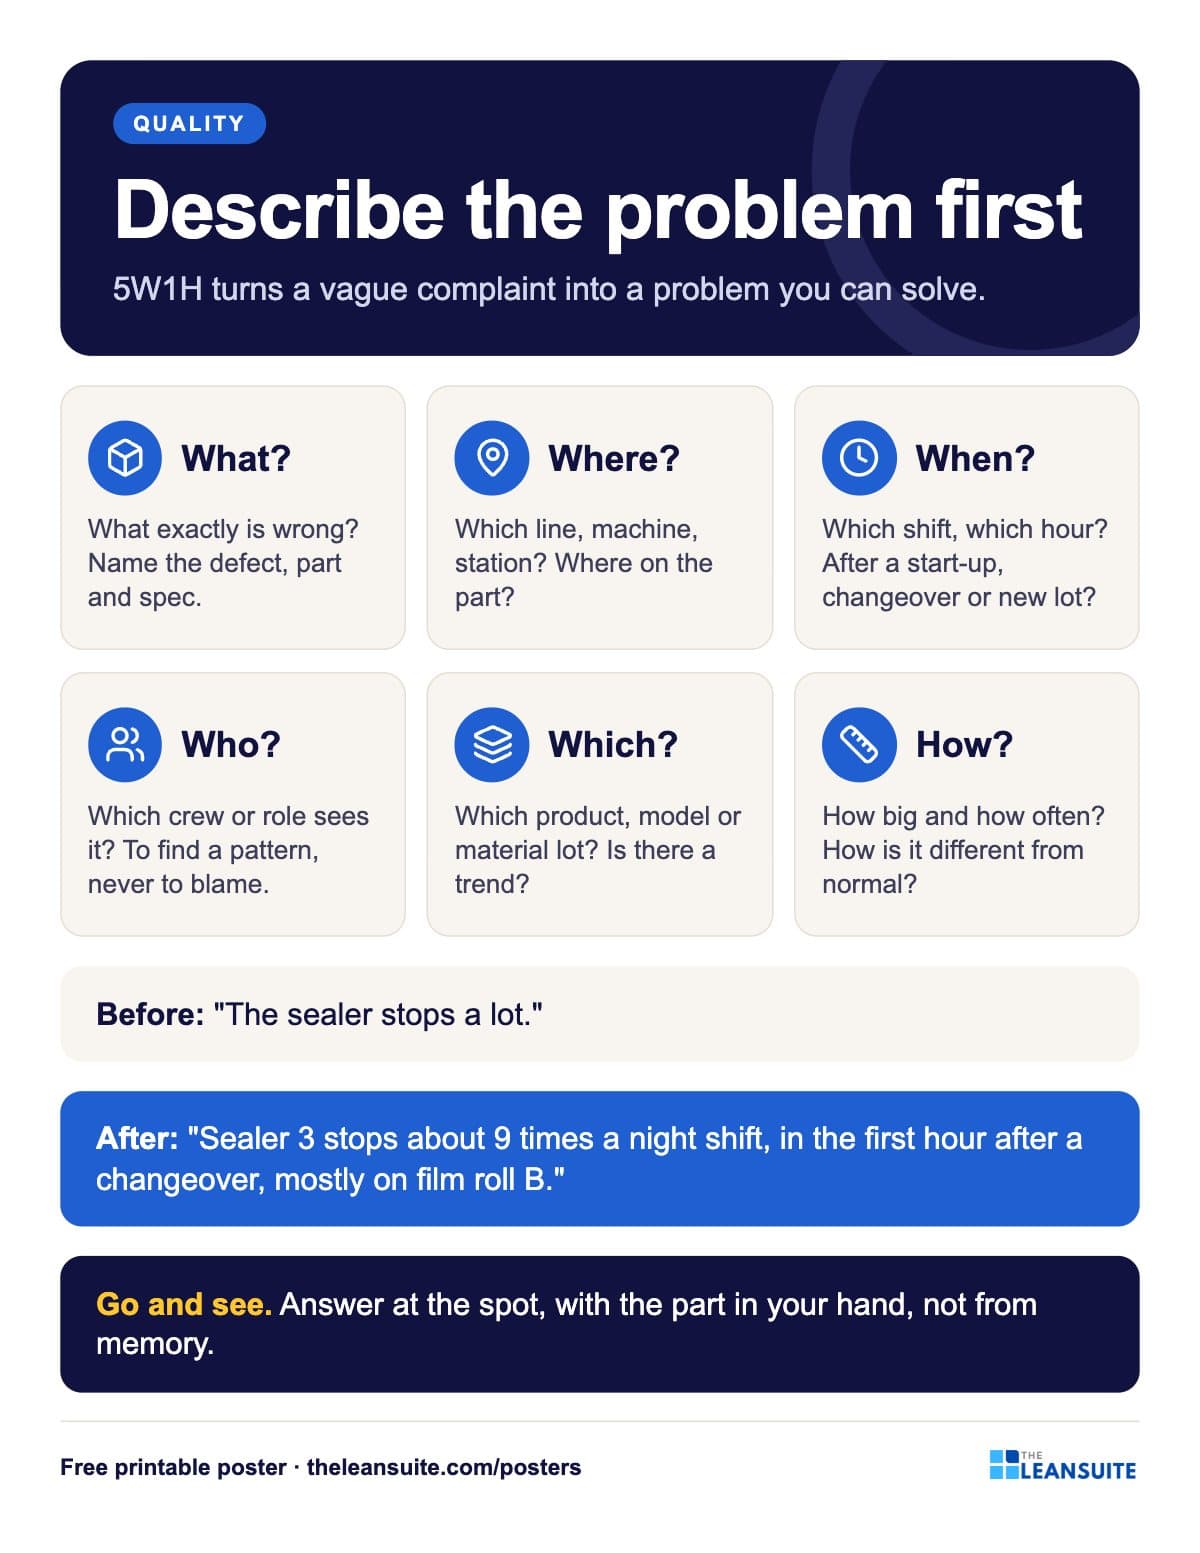 5W1H problem description poster
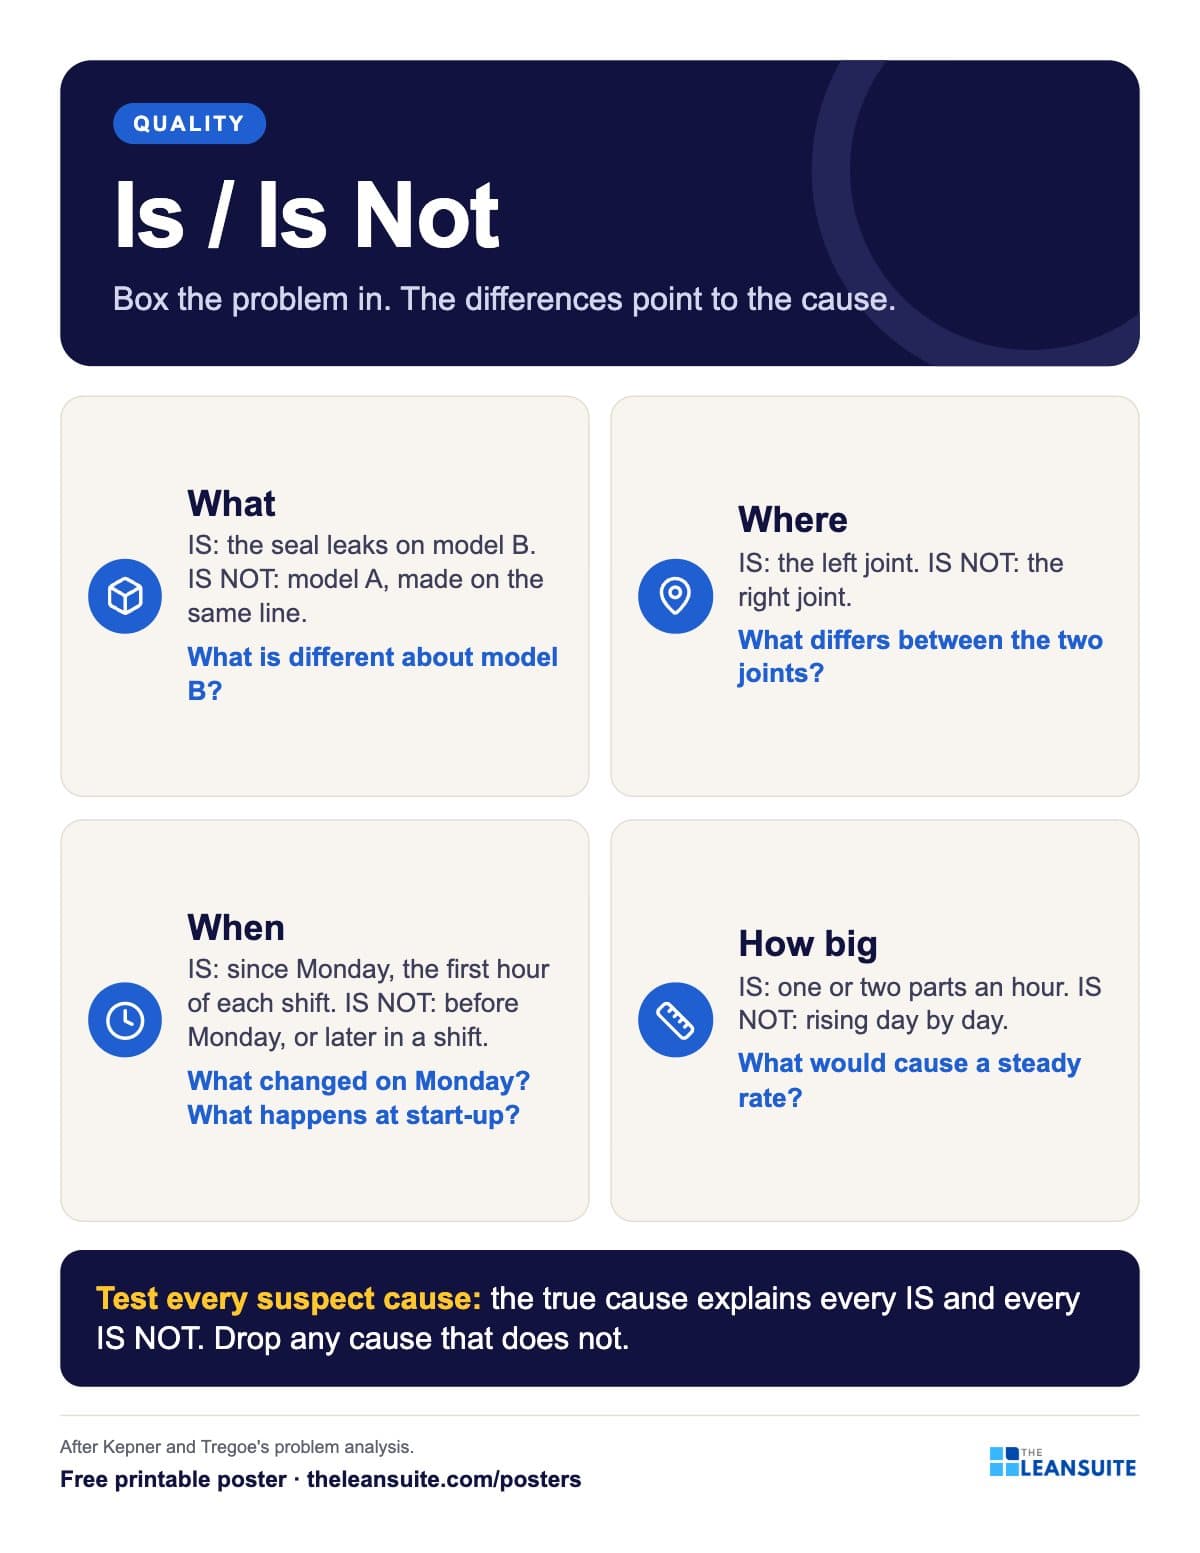 Is / Is Not analysis poster
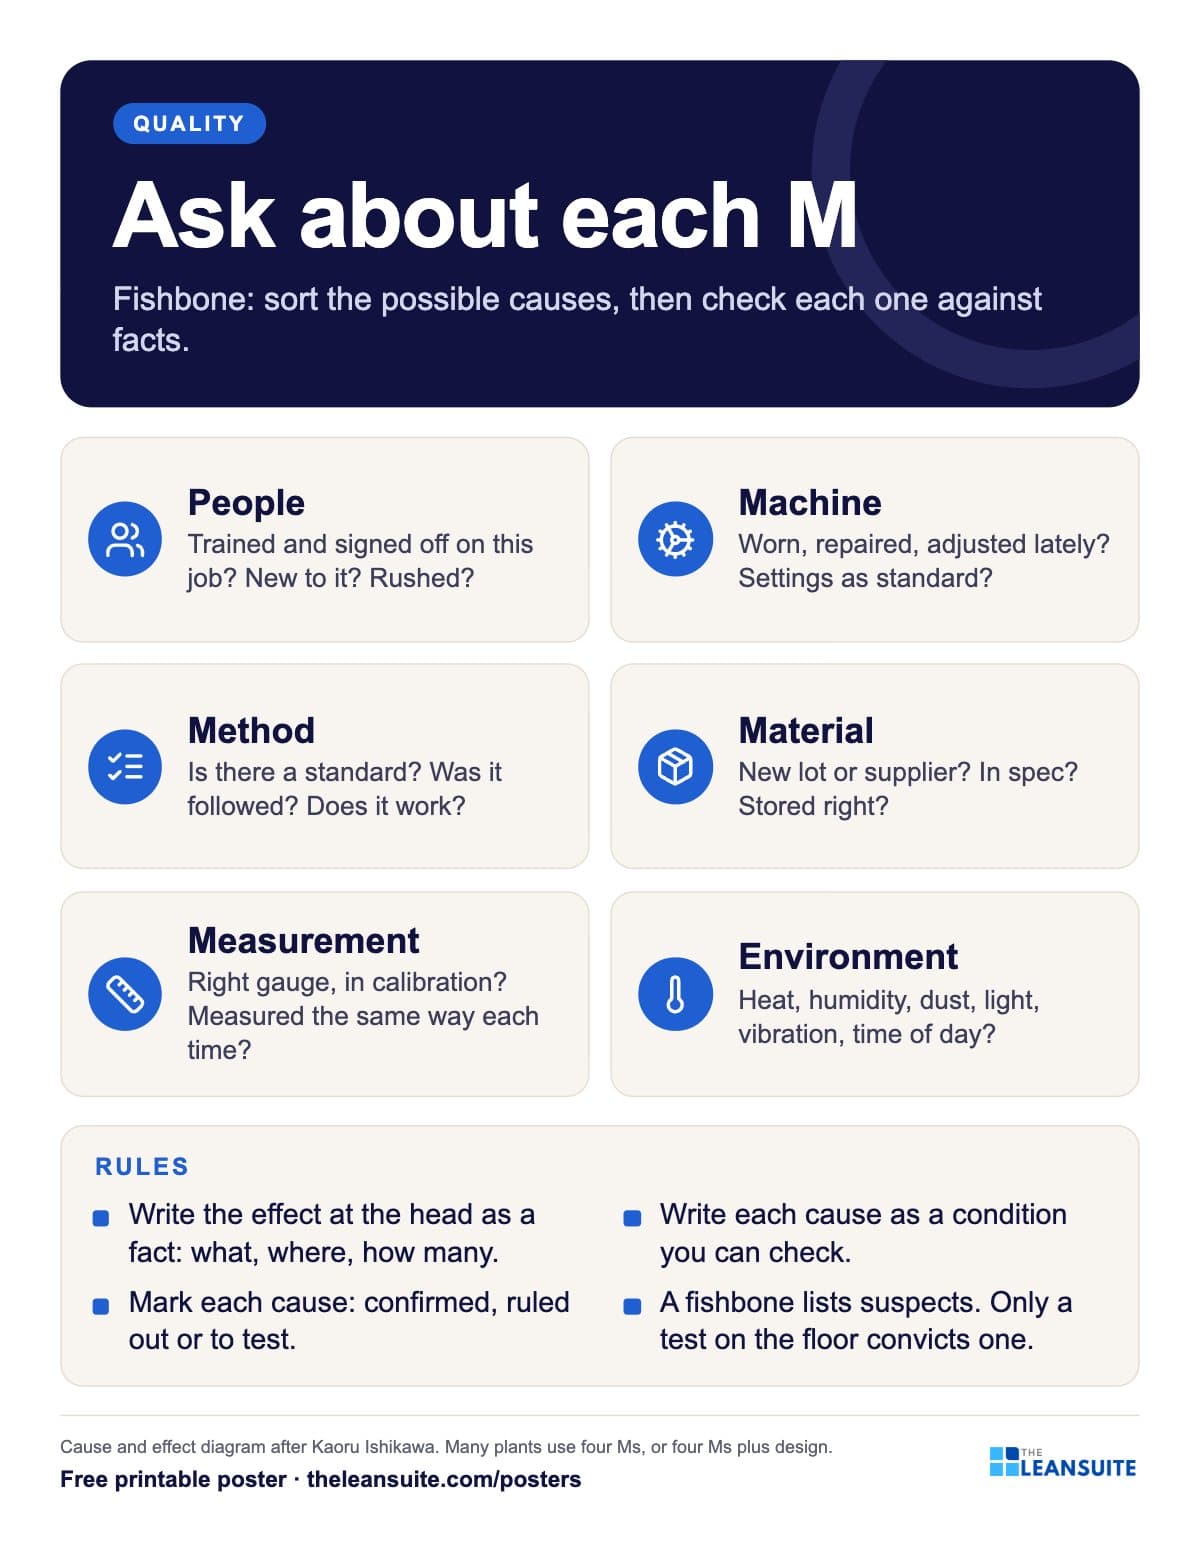 Fishbone 6M questions poster
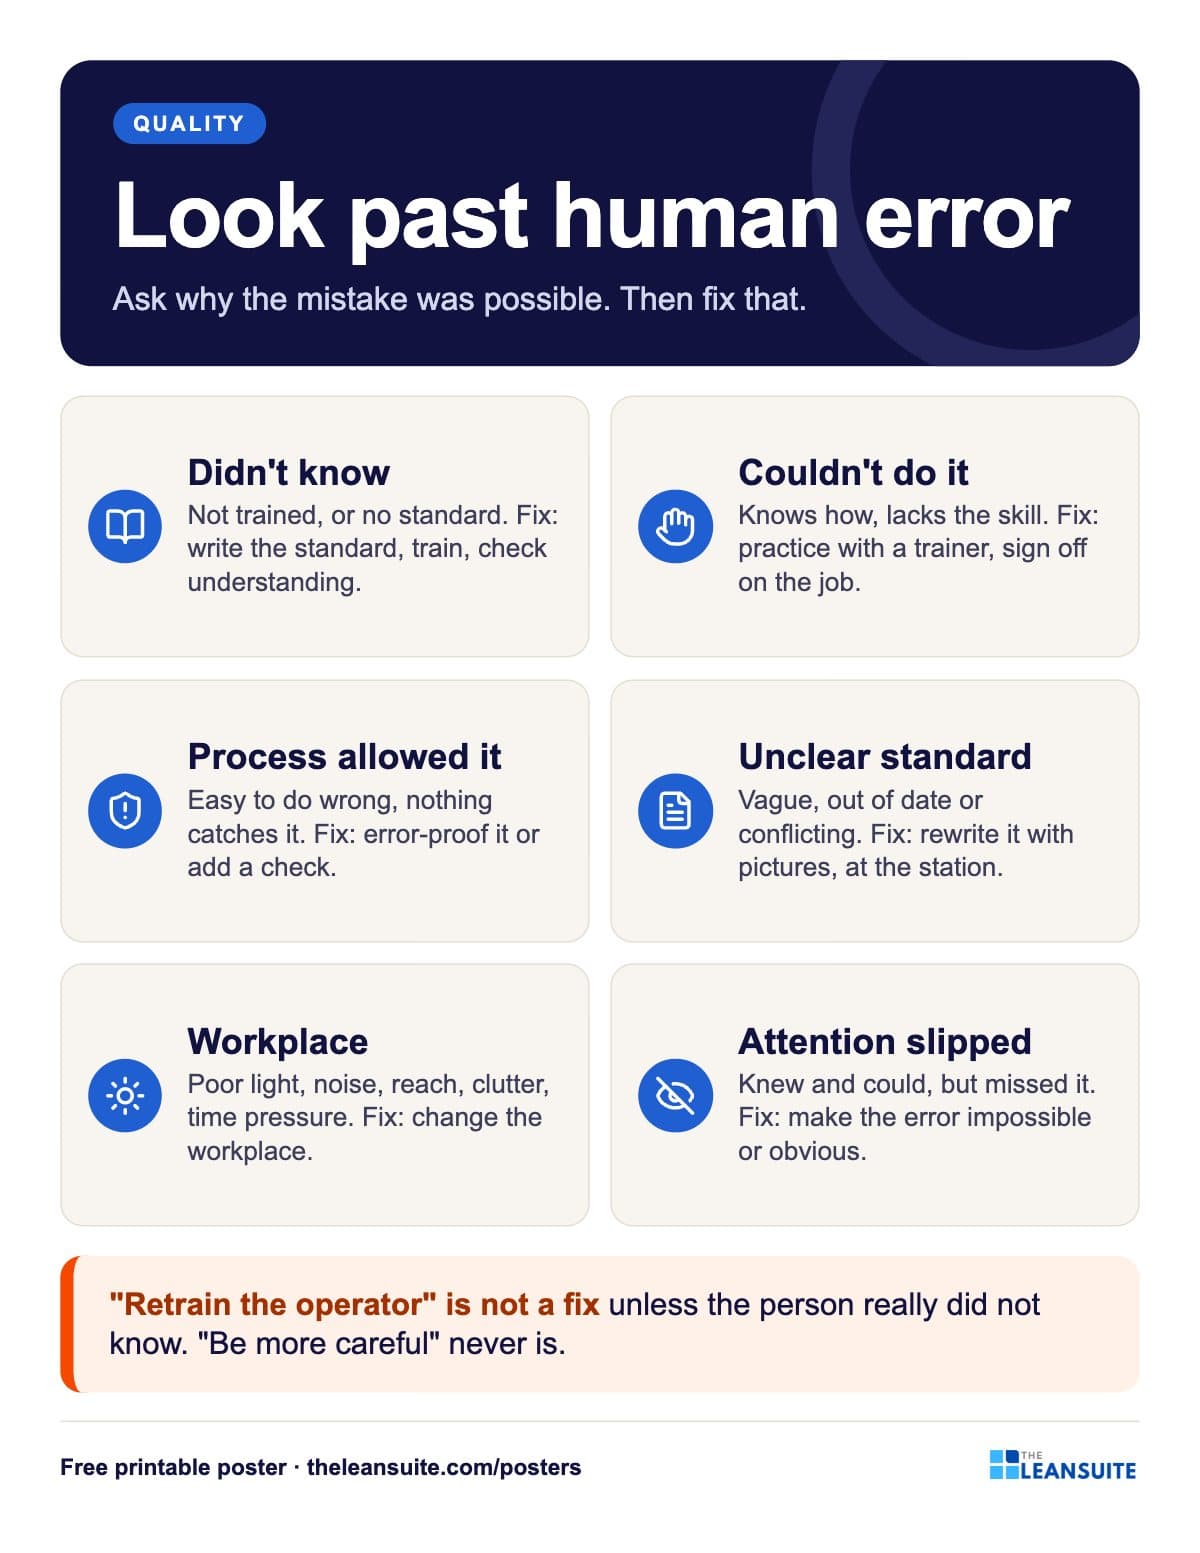 Human error root causes poster
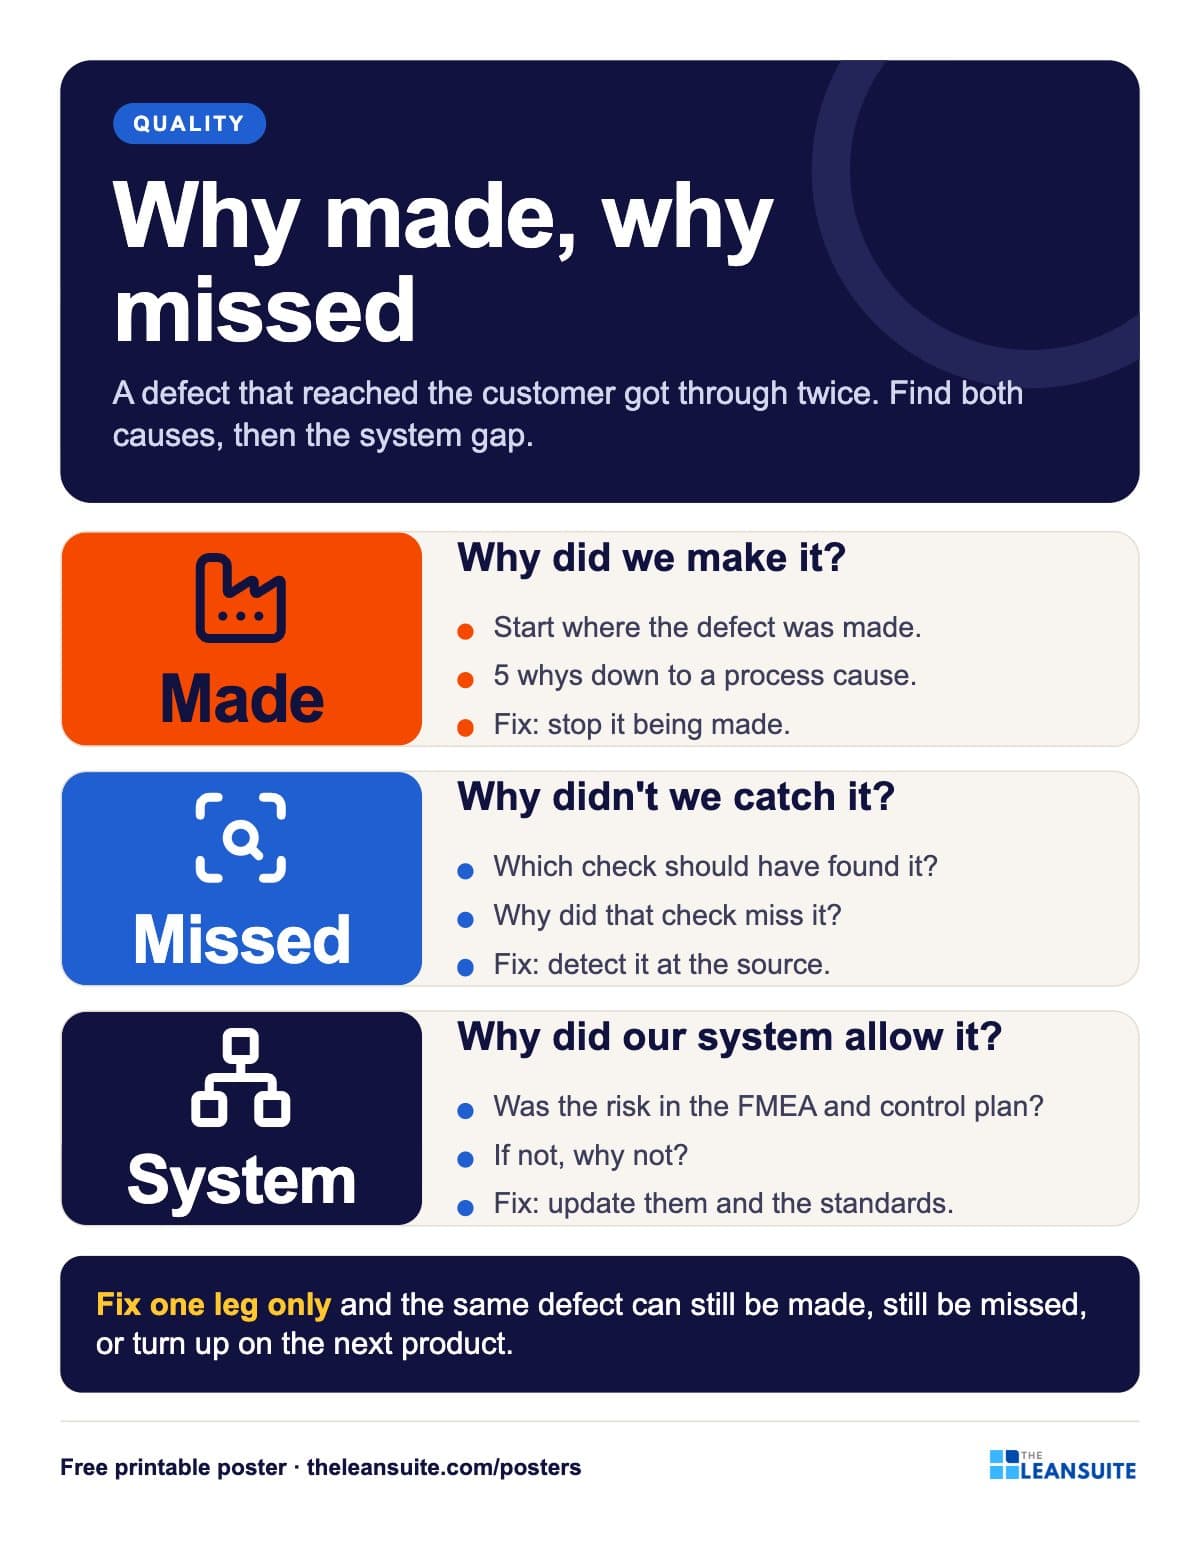 Why made, why missed poster
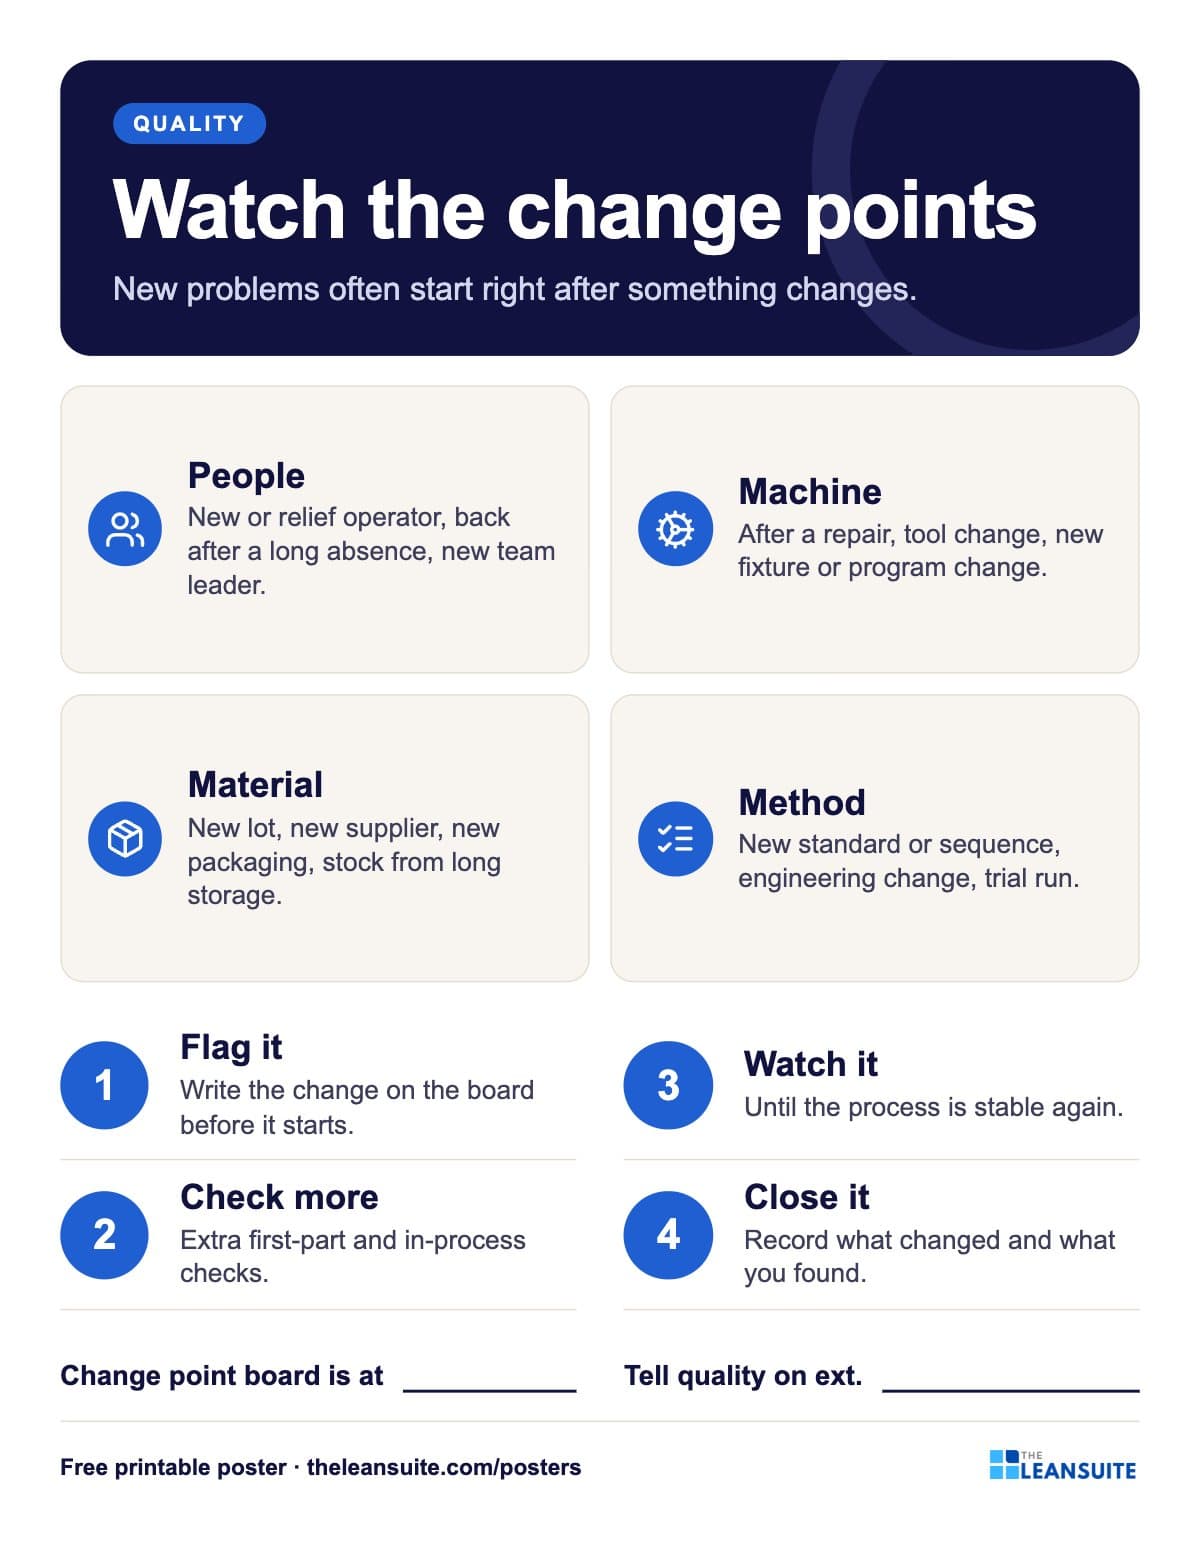 4M change points poster
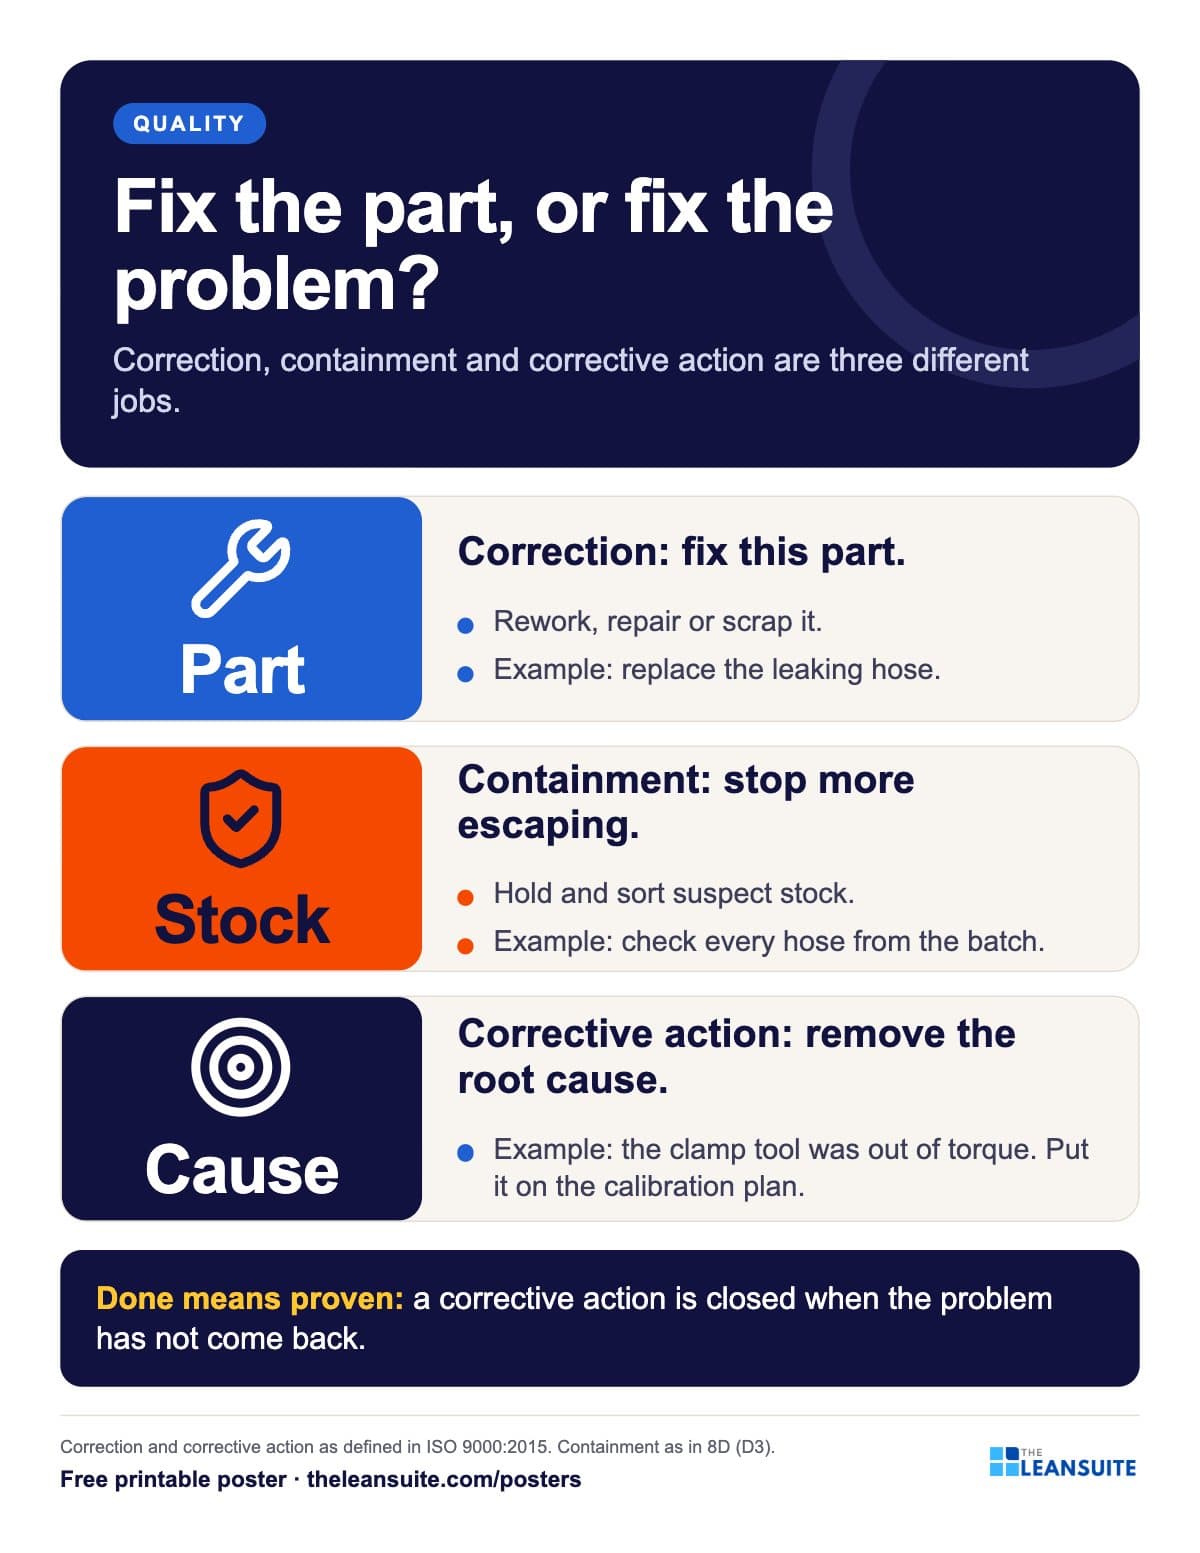 Correction vs corrective action poster
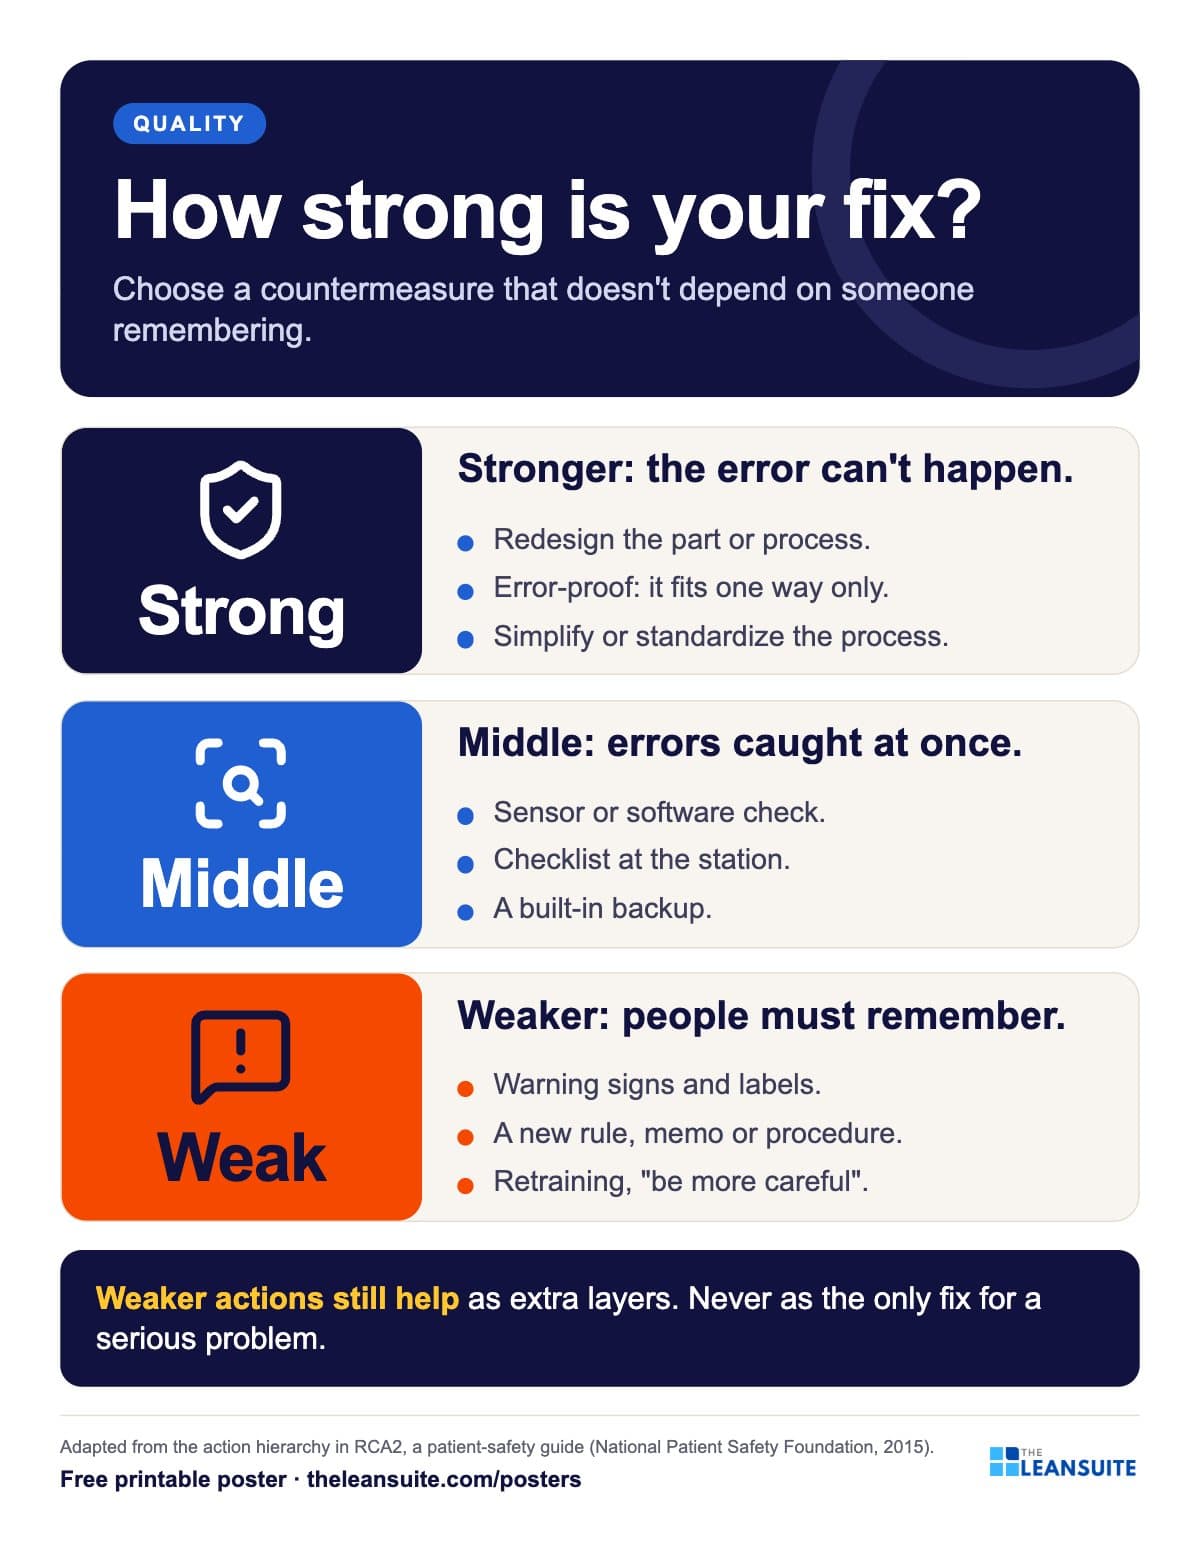 Strong and weak countermeasures poster
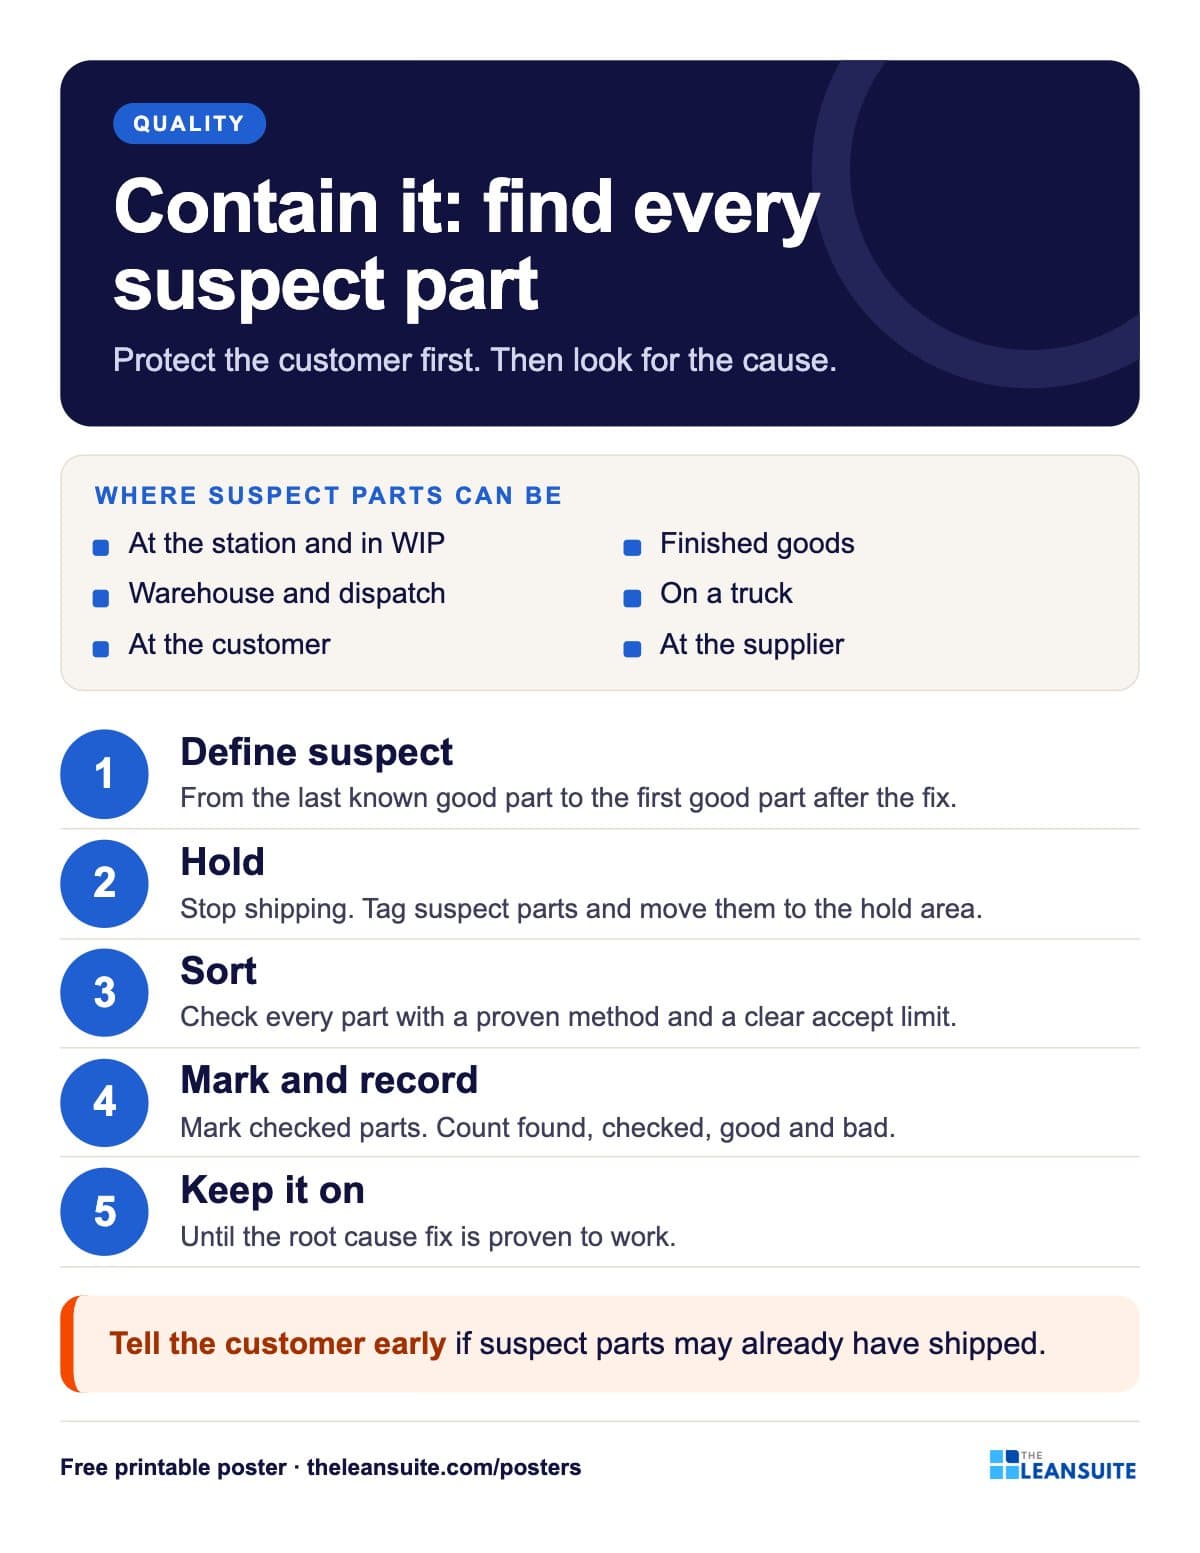 Containment actions poster
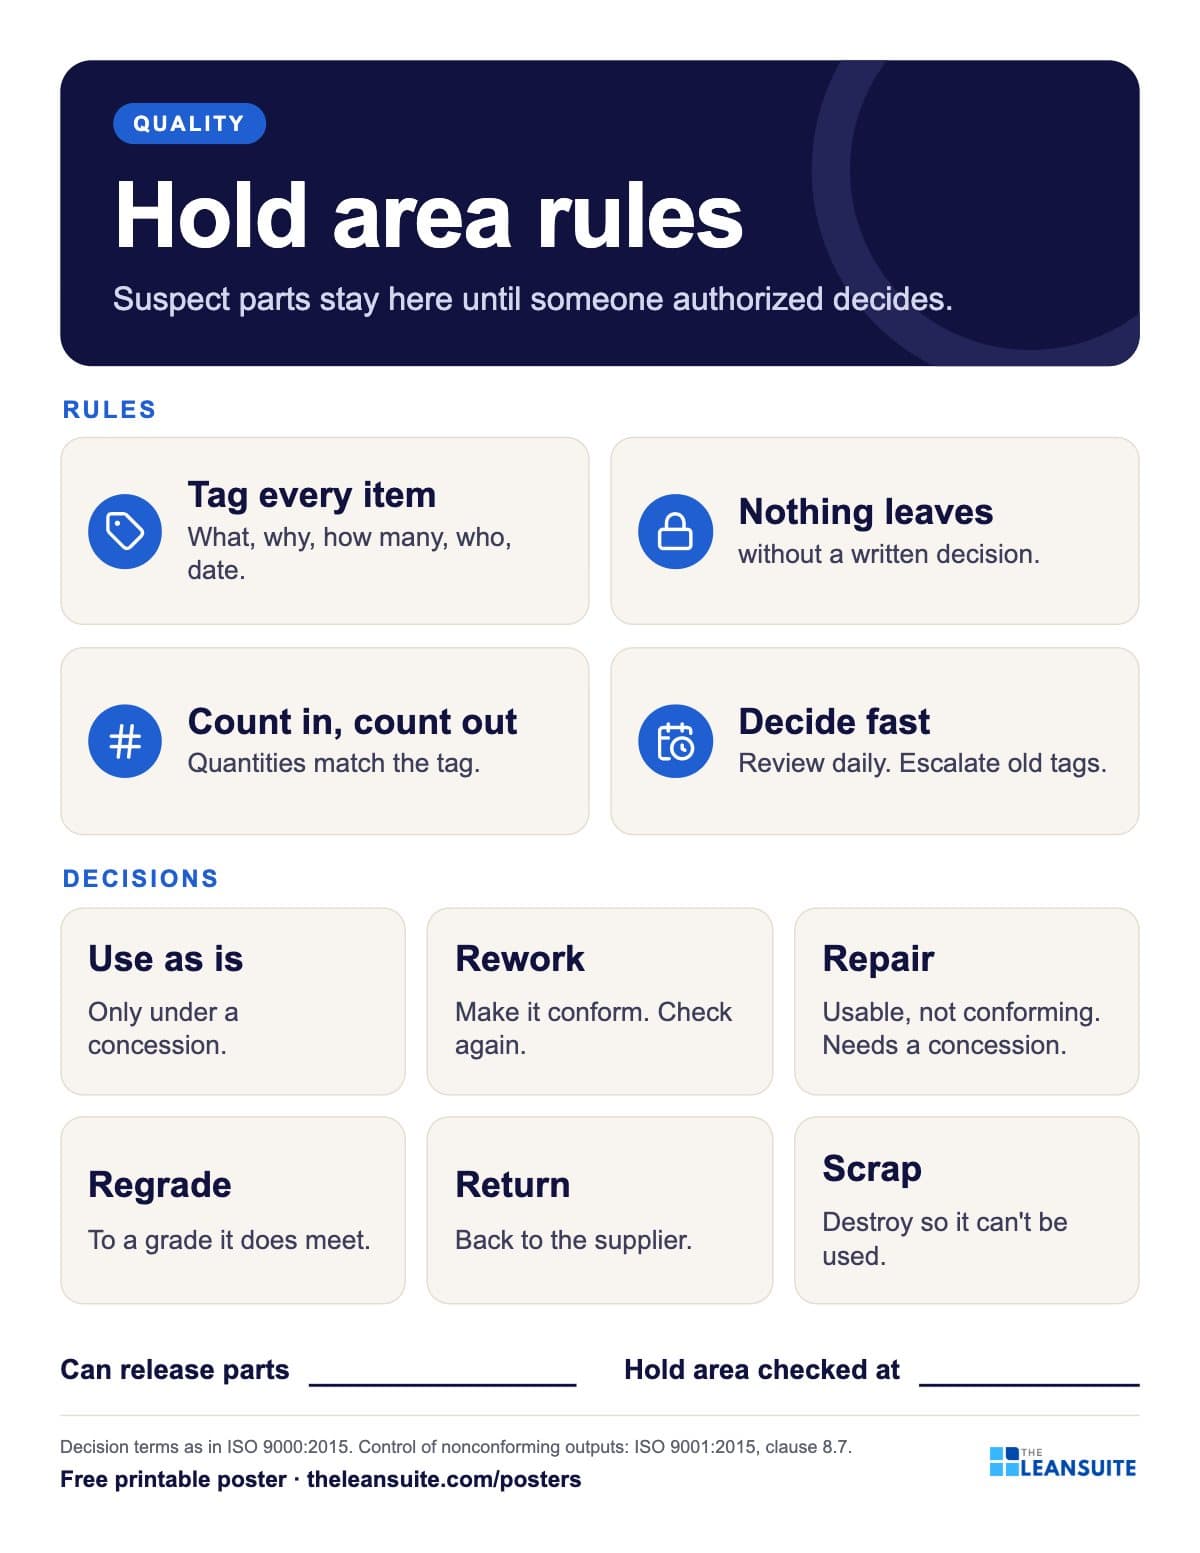 Hold area (quarantine) rules poster
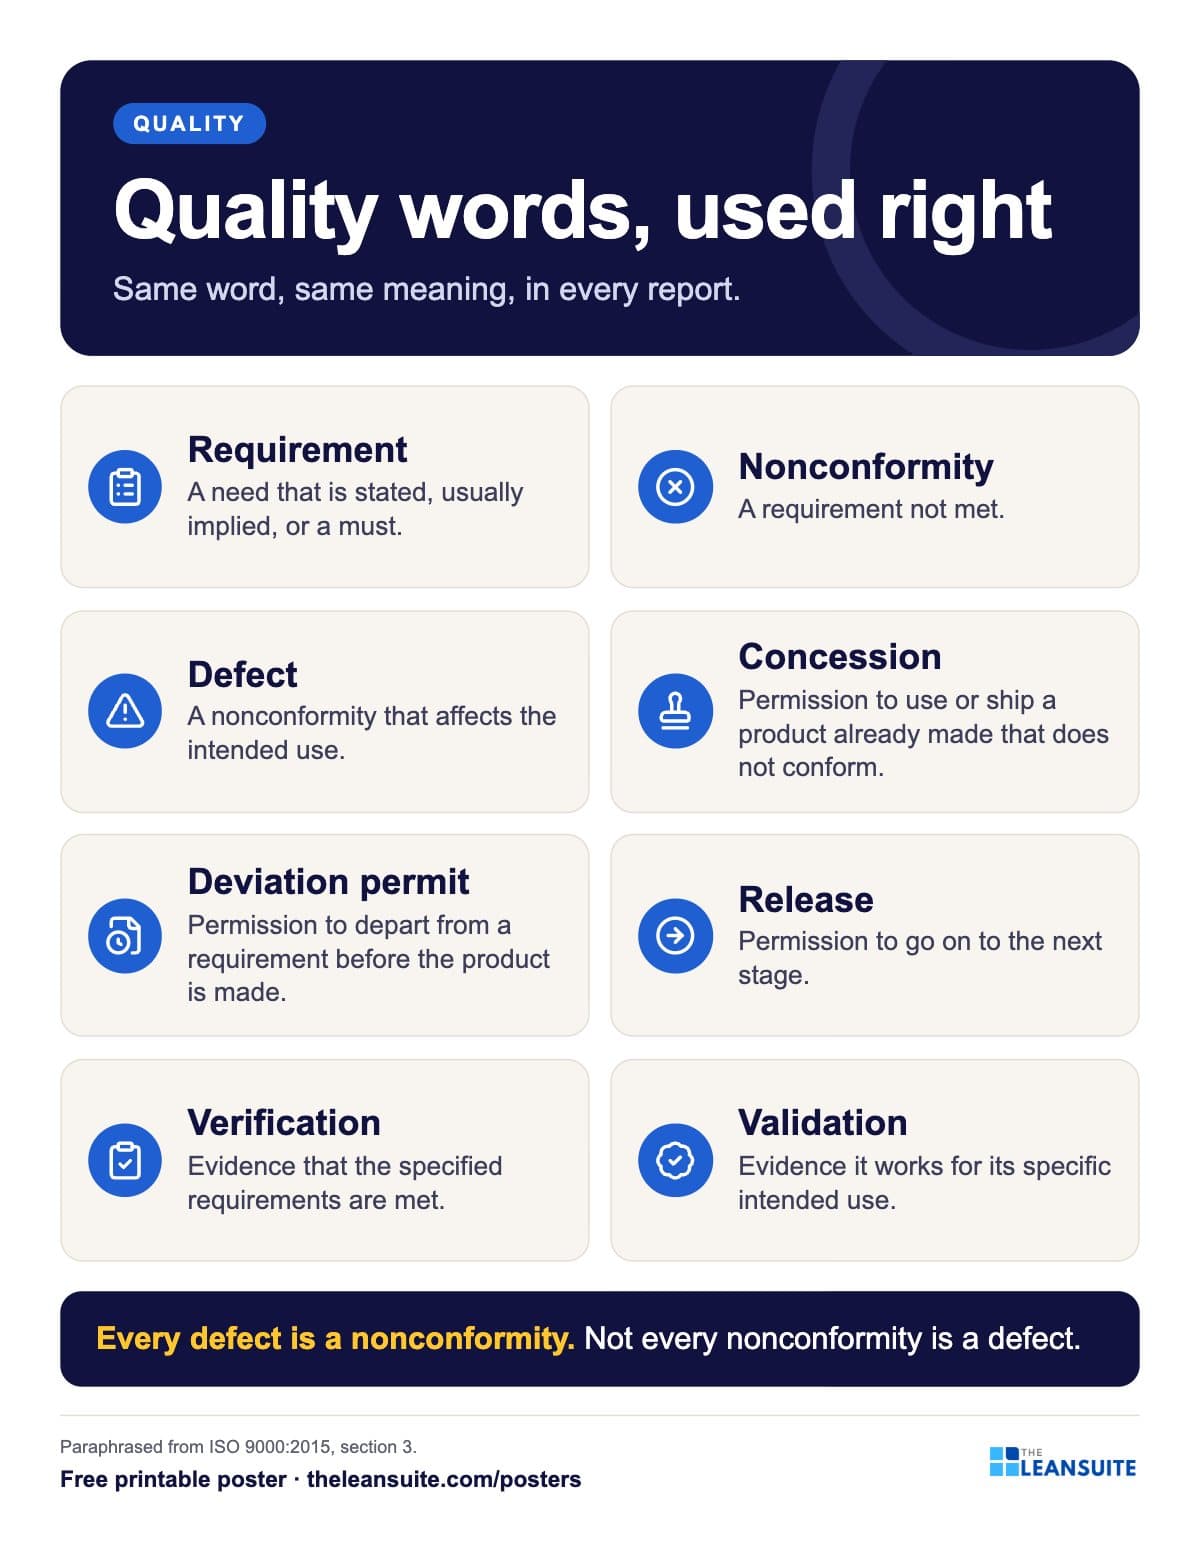 Quality terms poster (nonconformity, defect, concession)
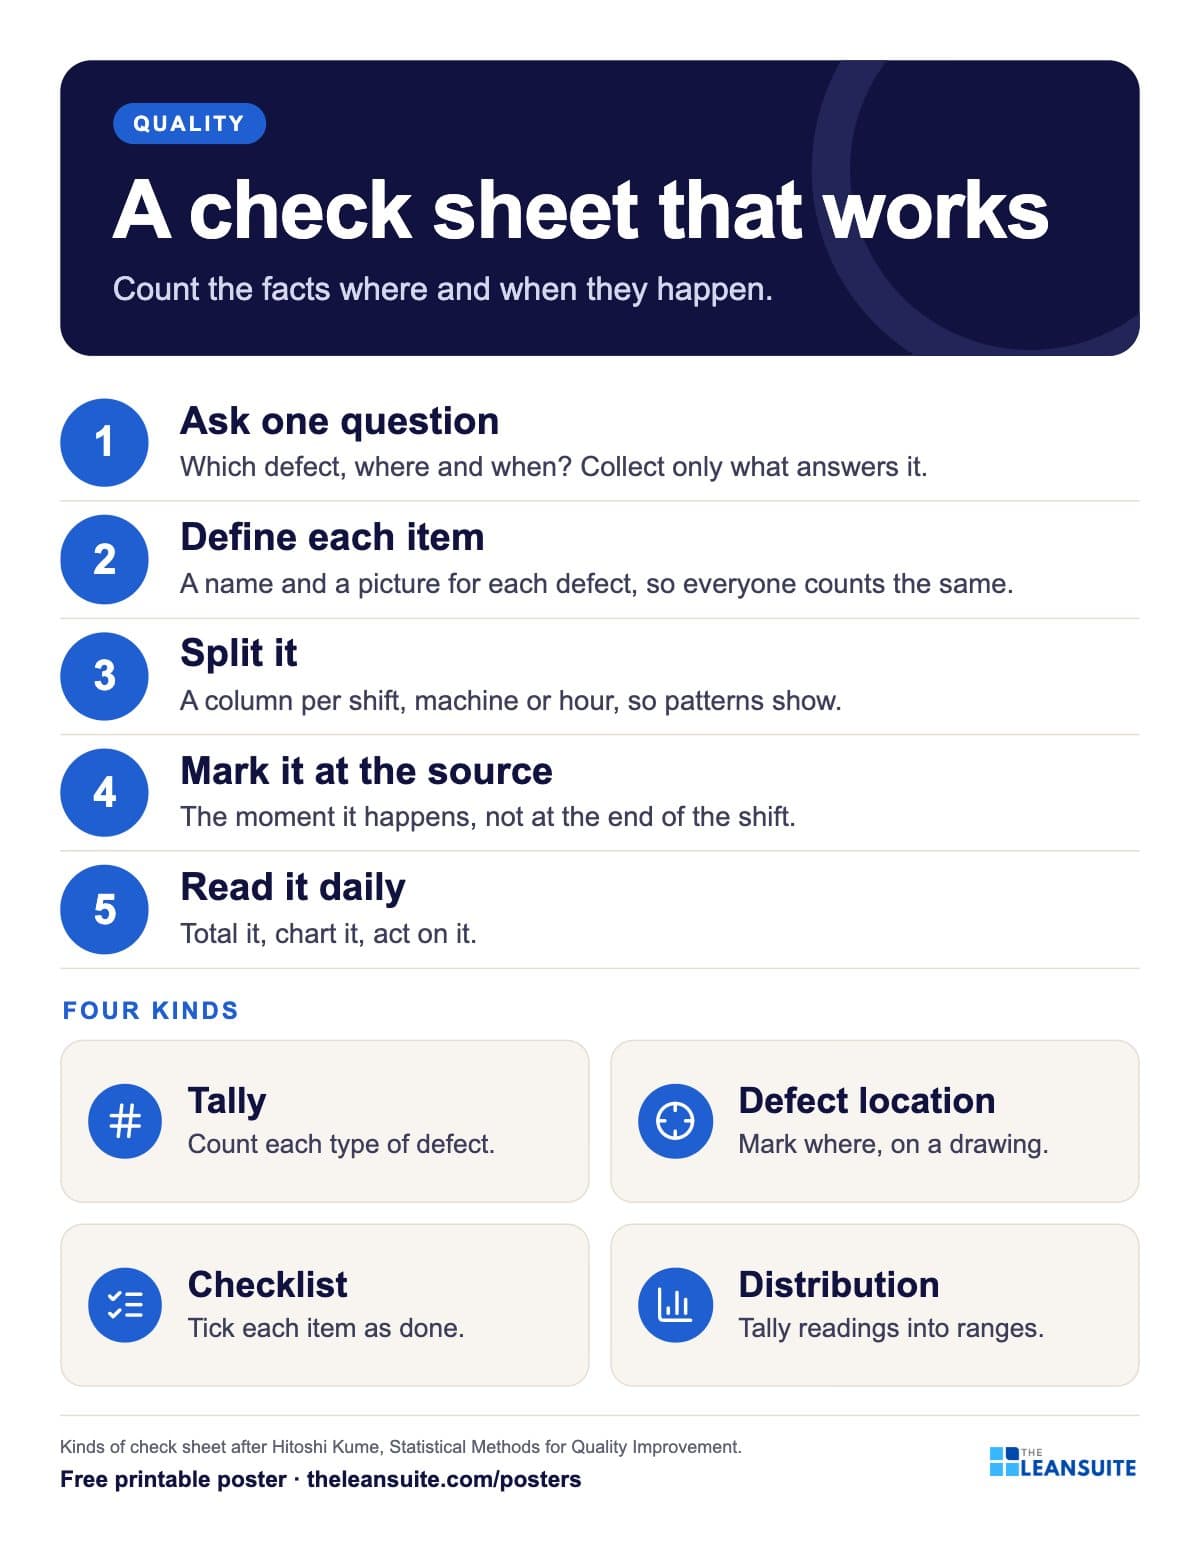 Check sheet poster
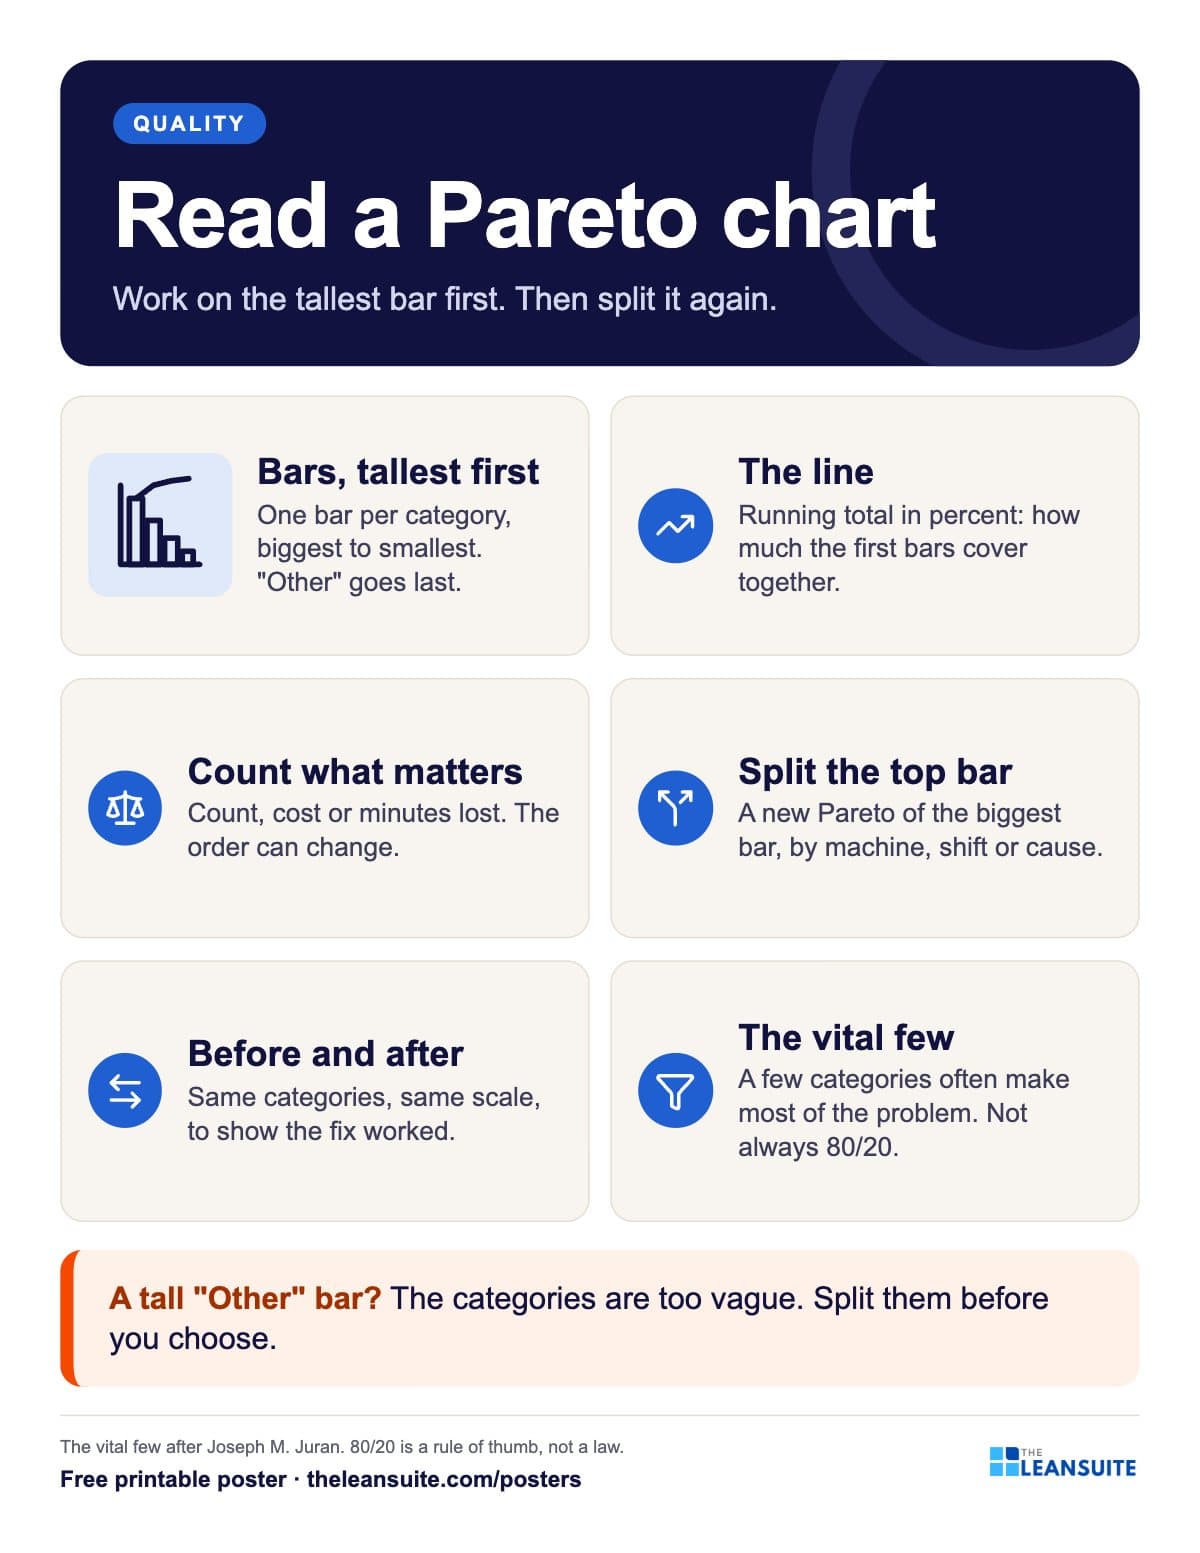 How to read a Pareto chart poster
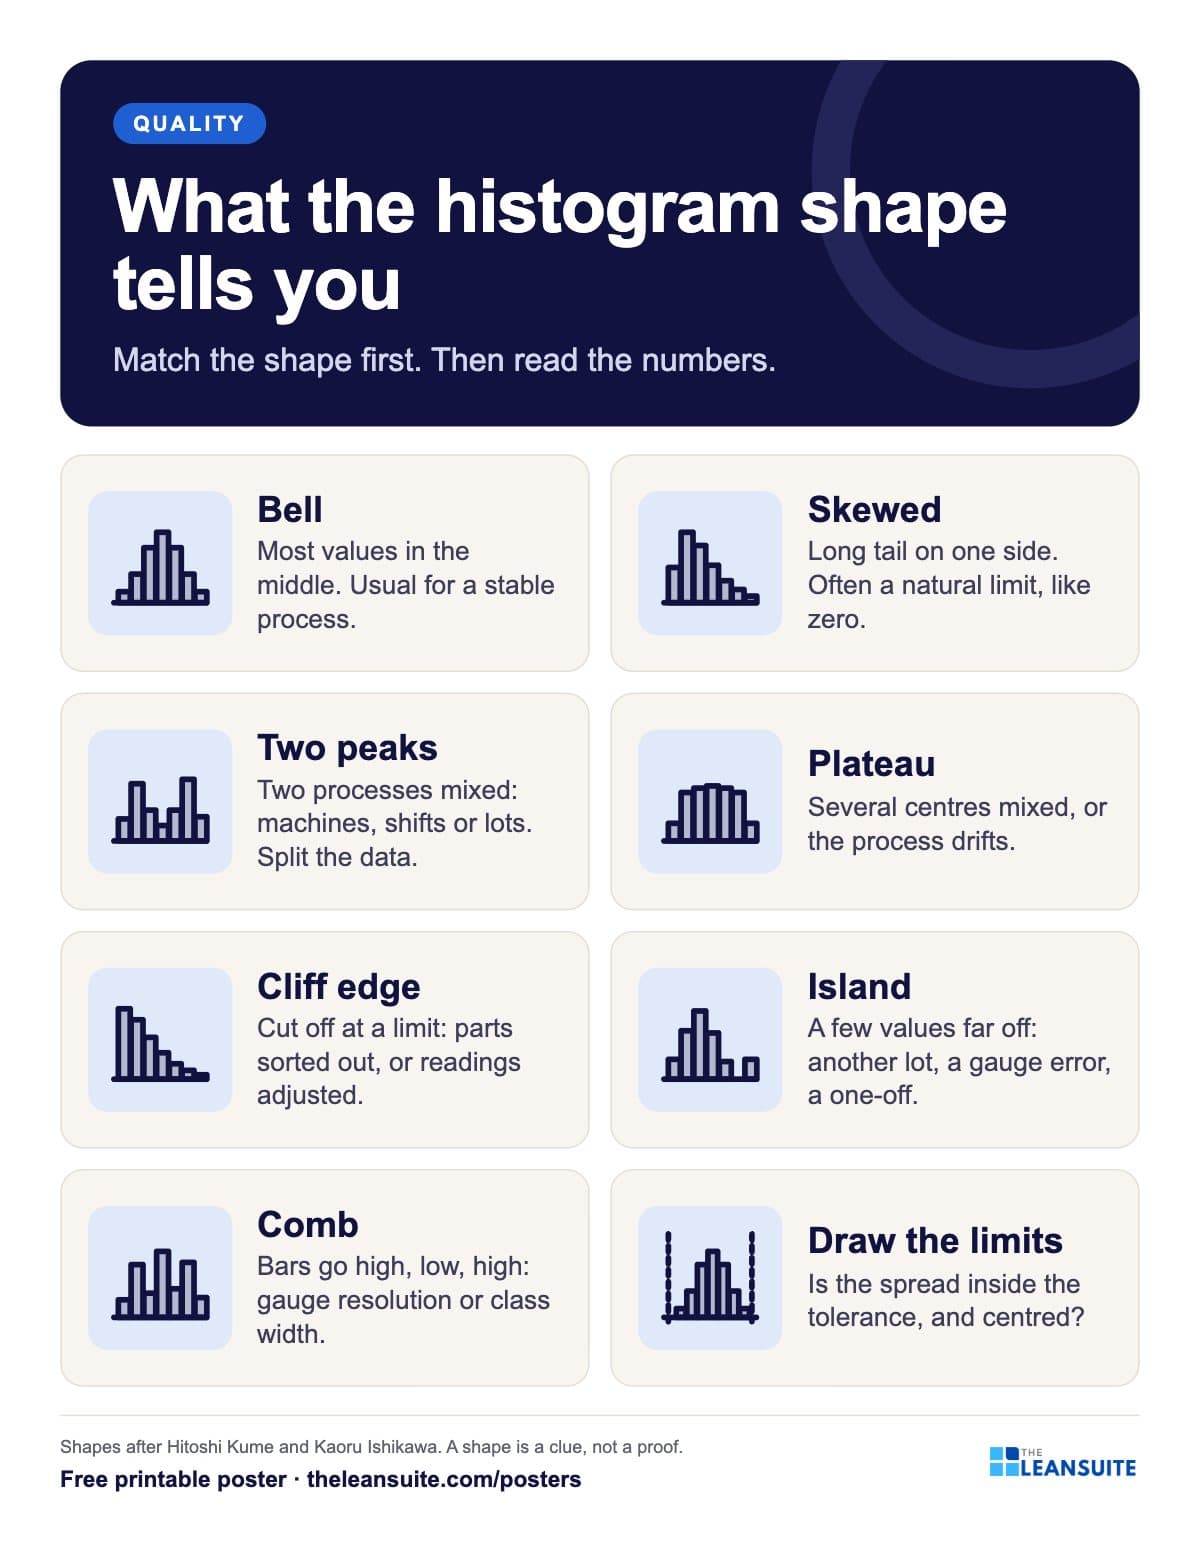 Histogram shapes poster
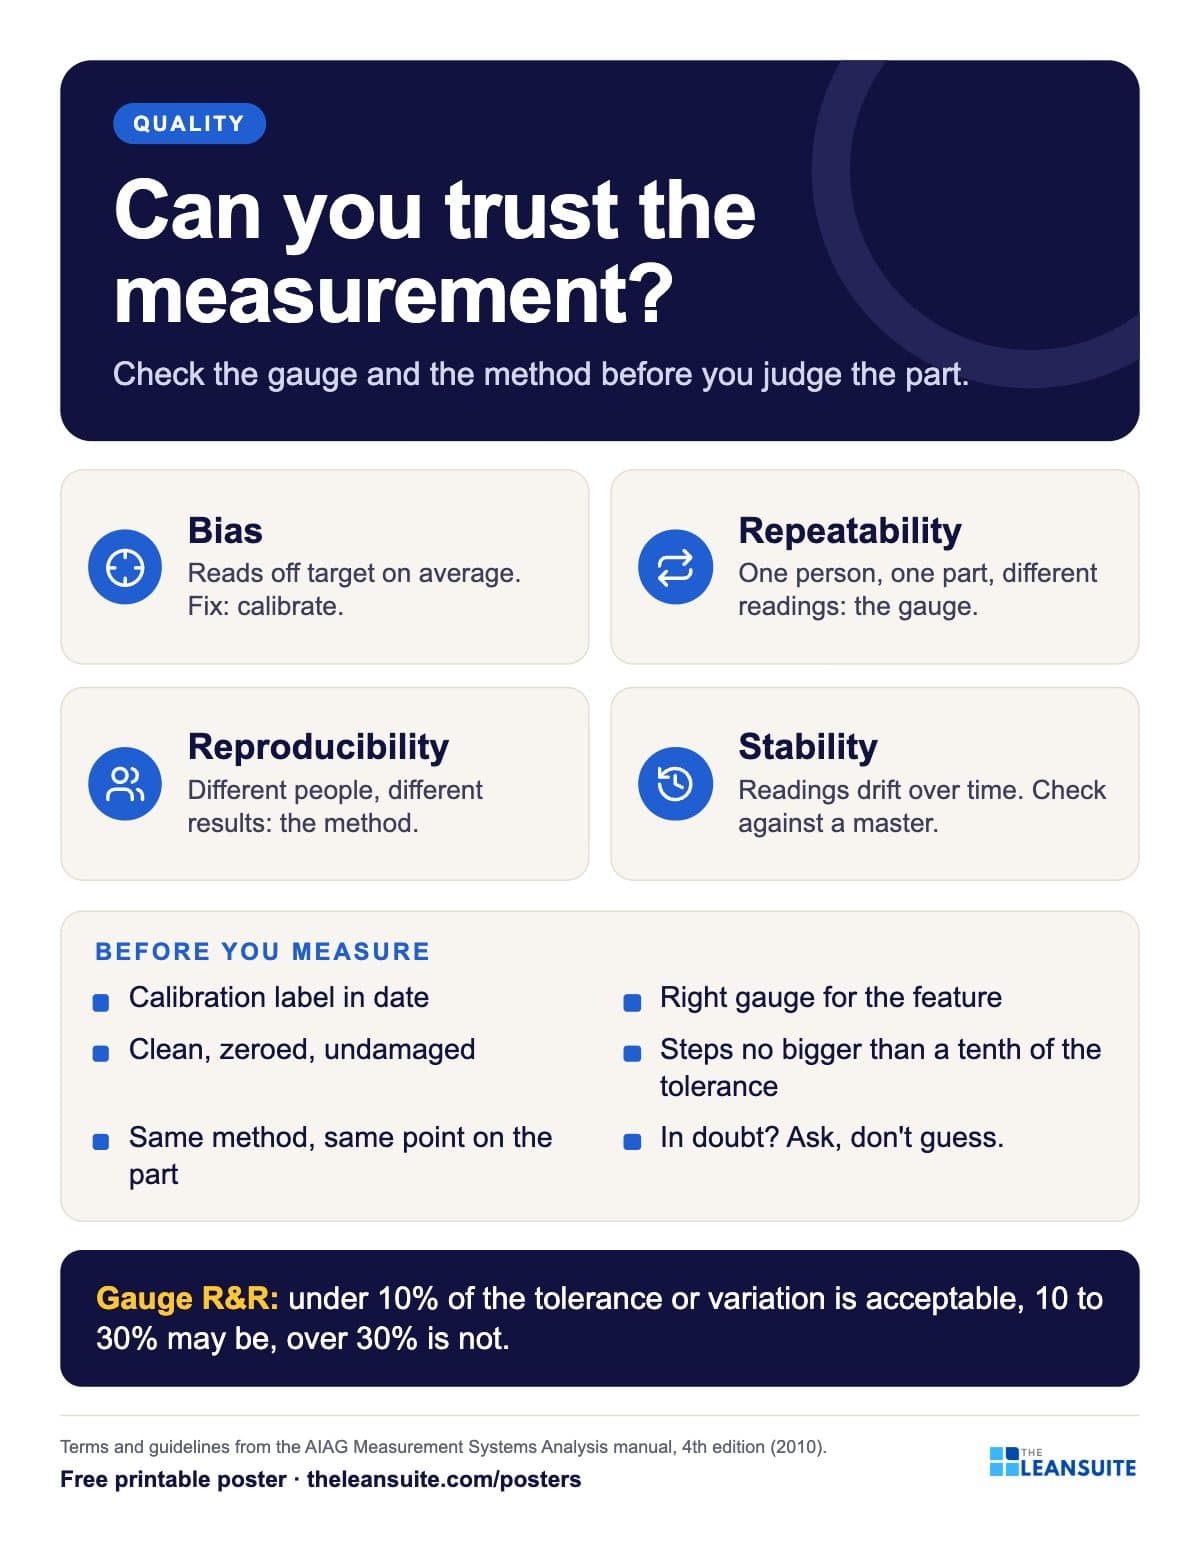 Measurement system basics poster
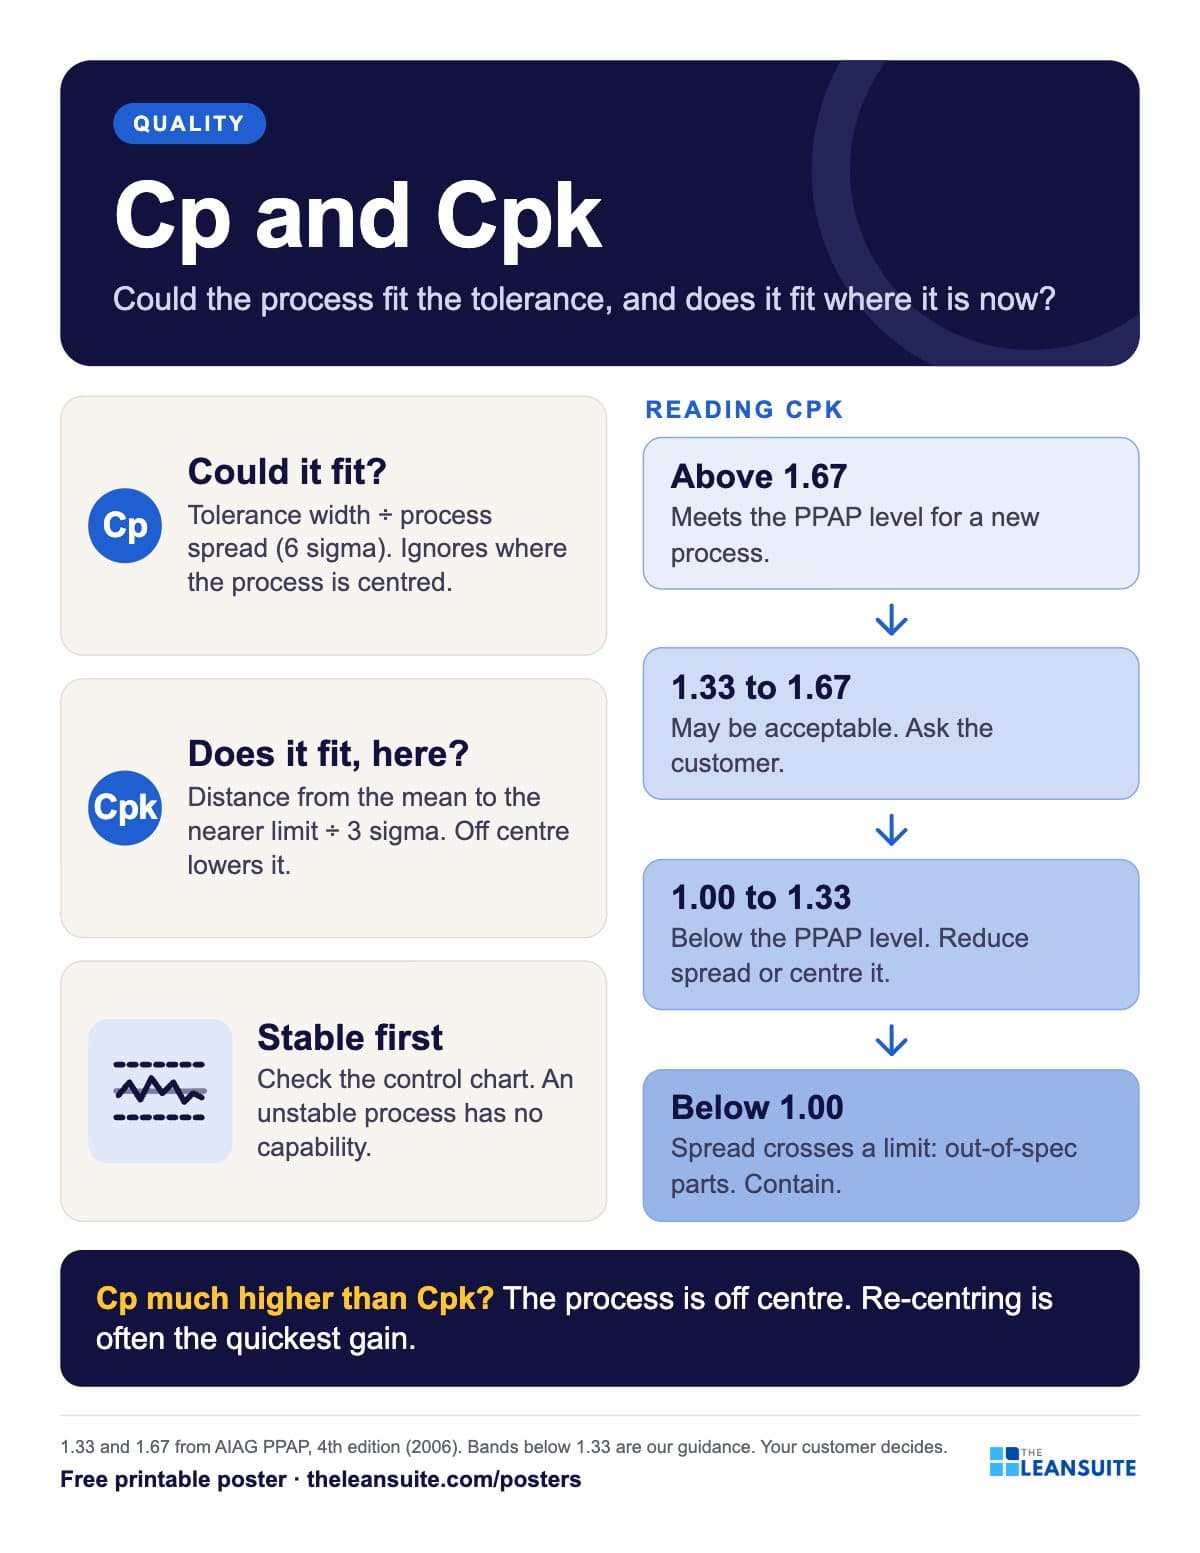 Cp and Cpk process capability poster
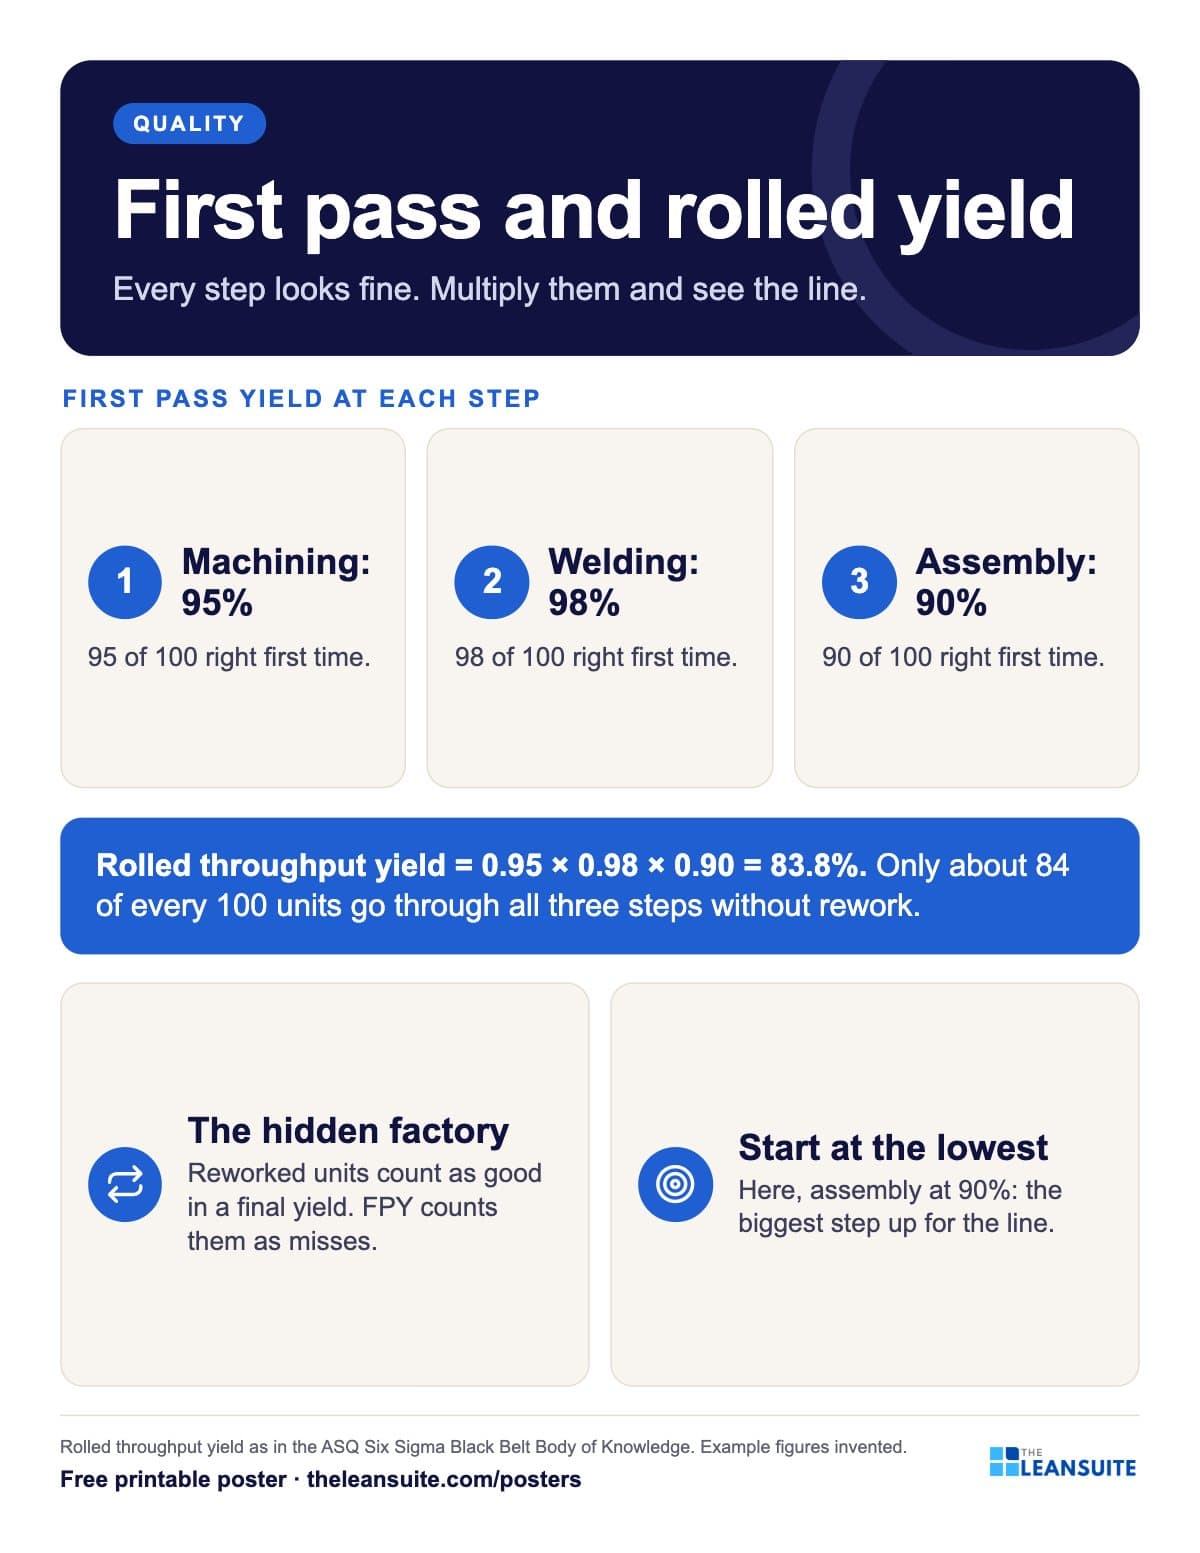 First pass yield and rolled throughput yield poster
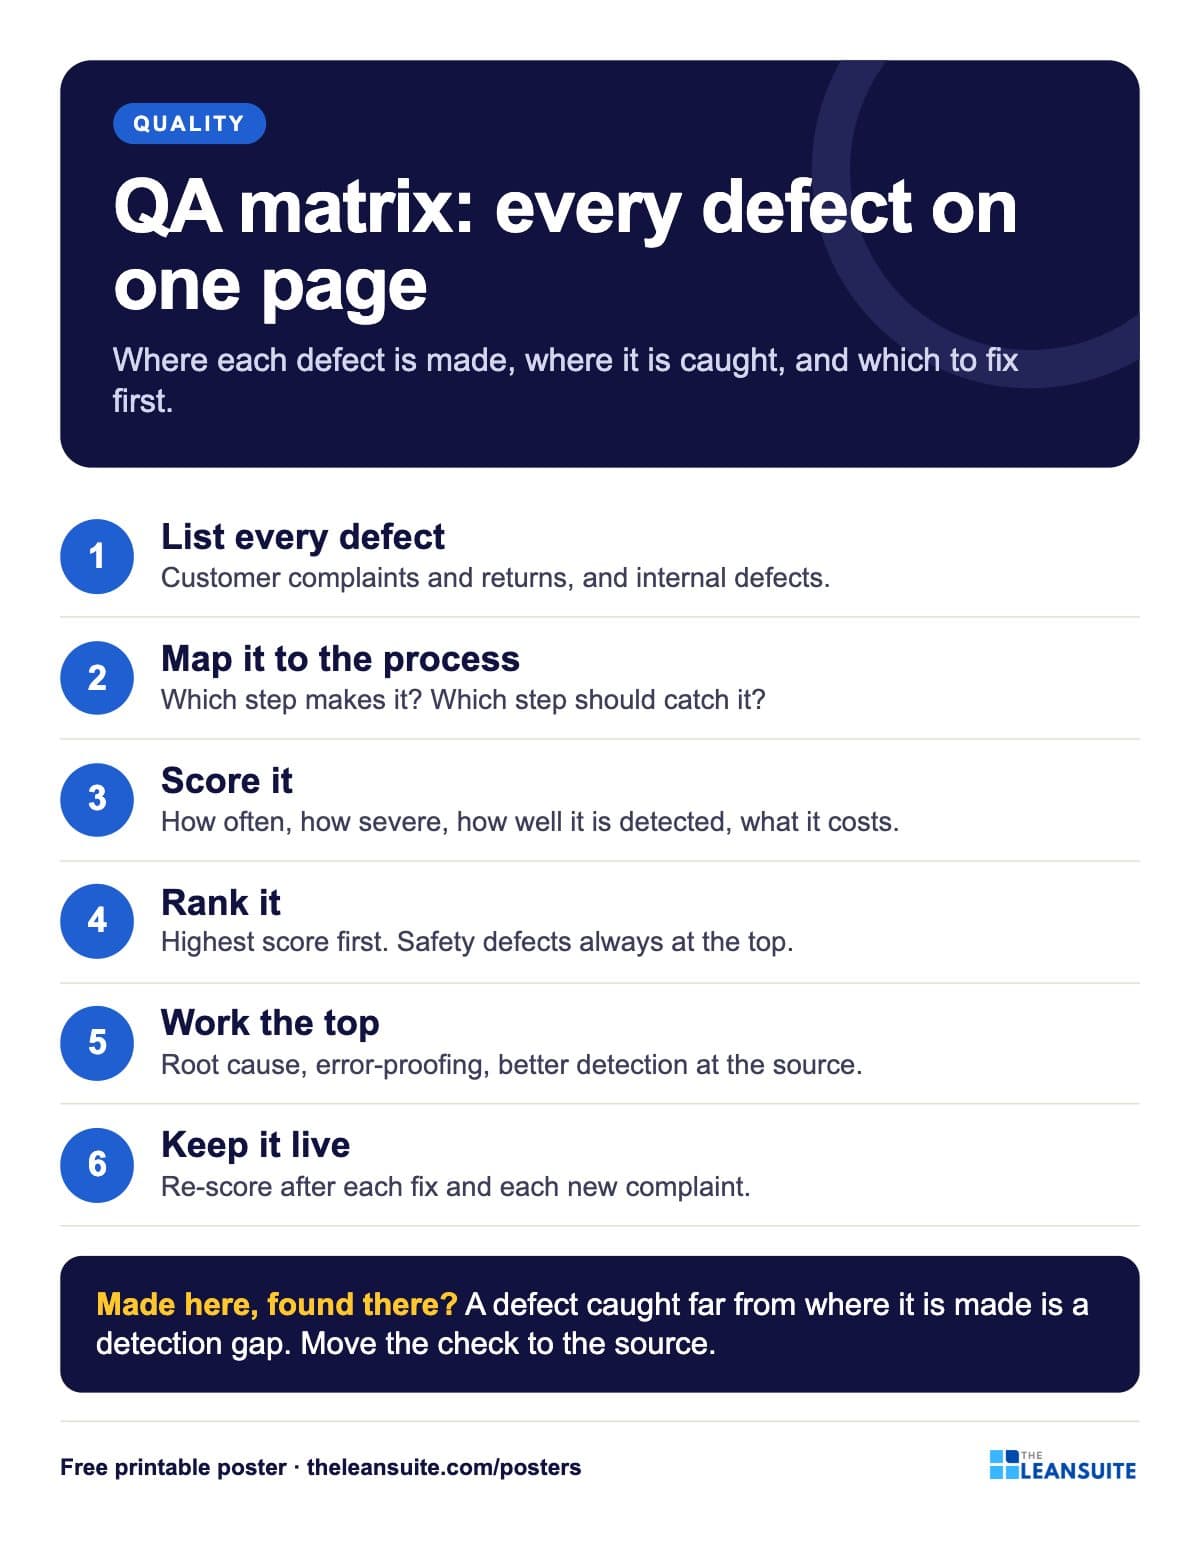 QA matrix poster
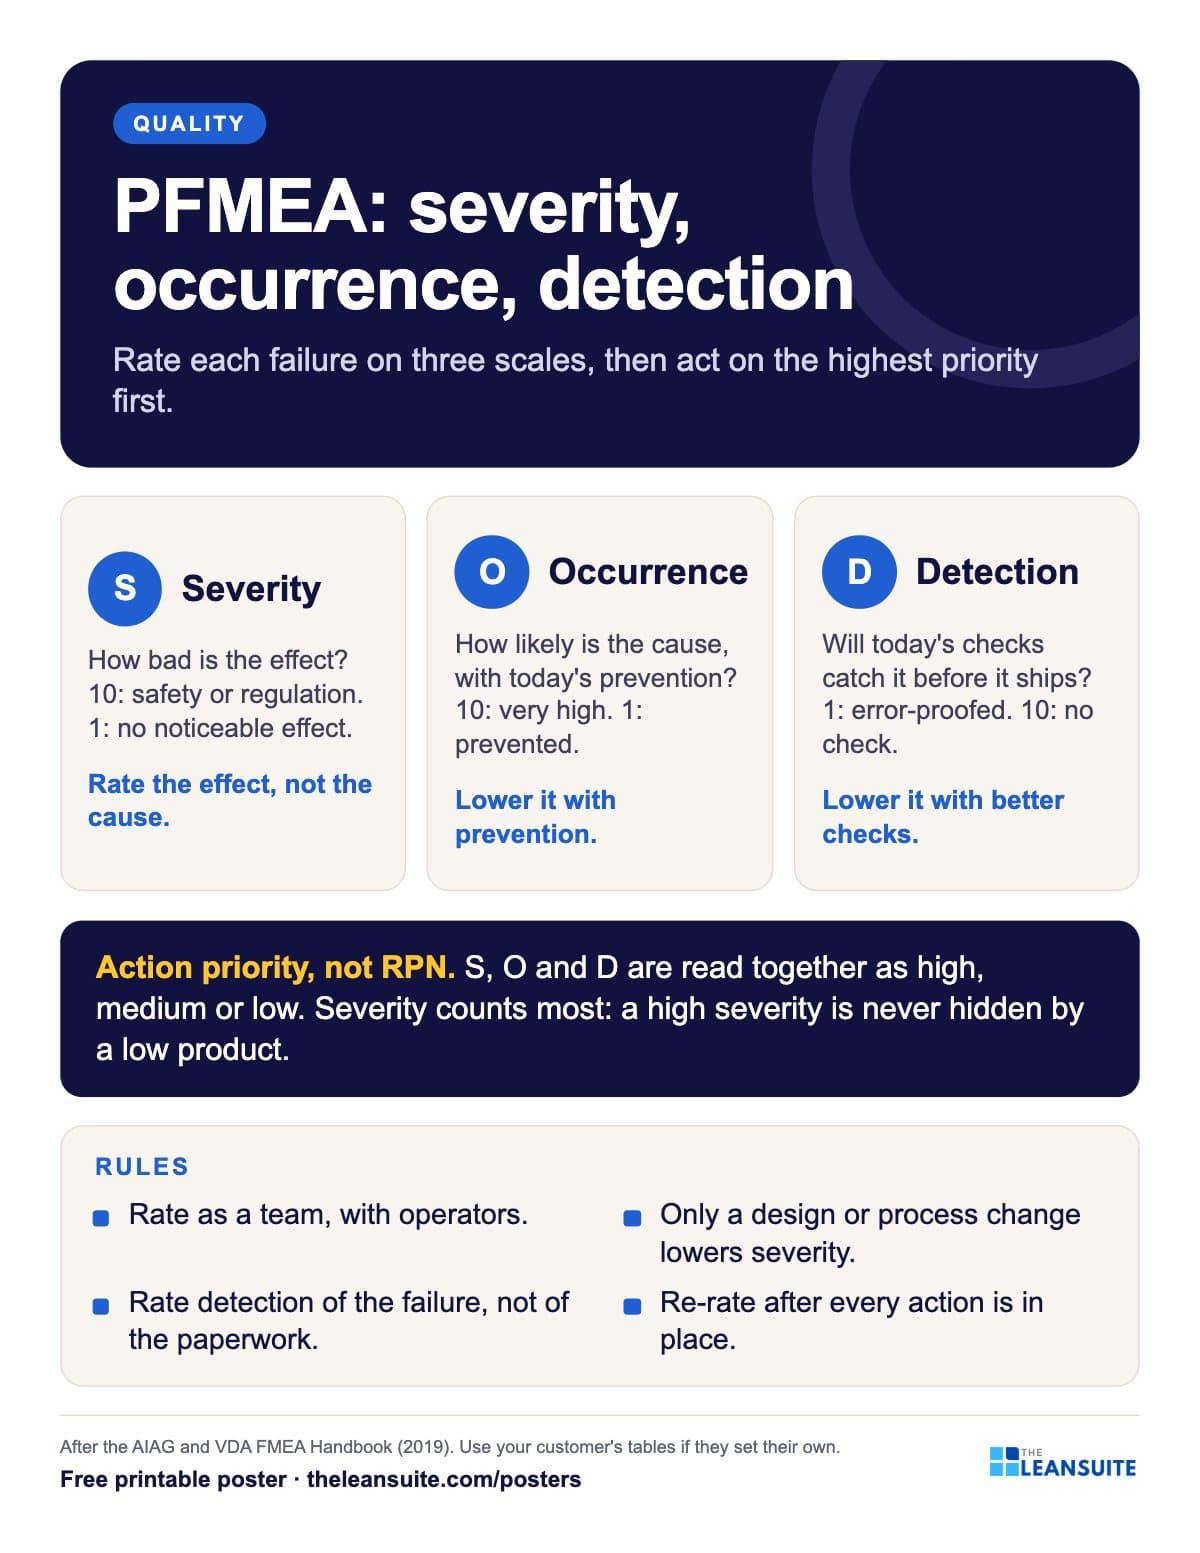 PFMEA severity, occurrence and detection poster
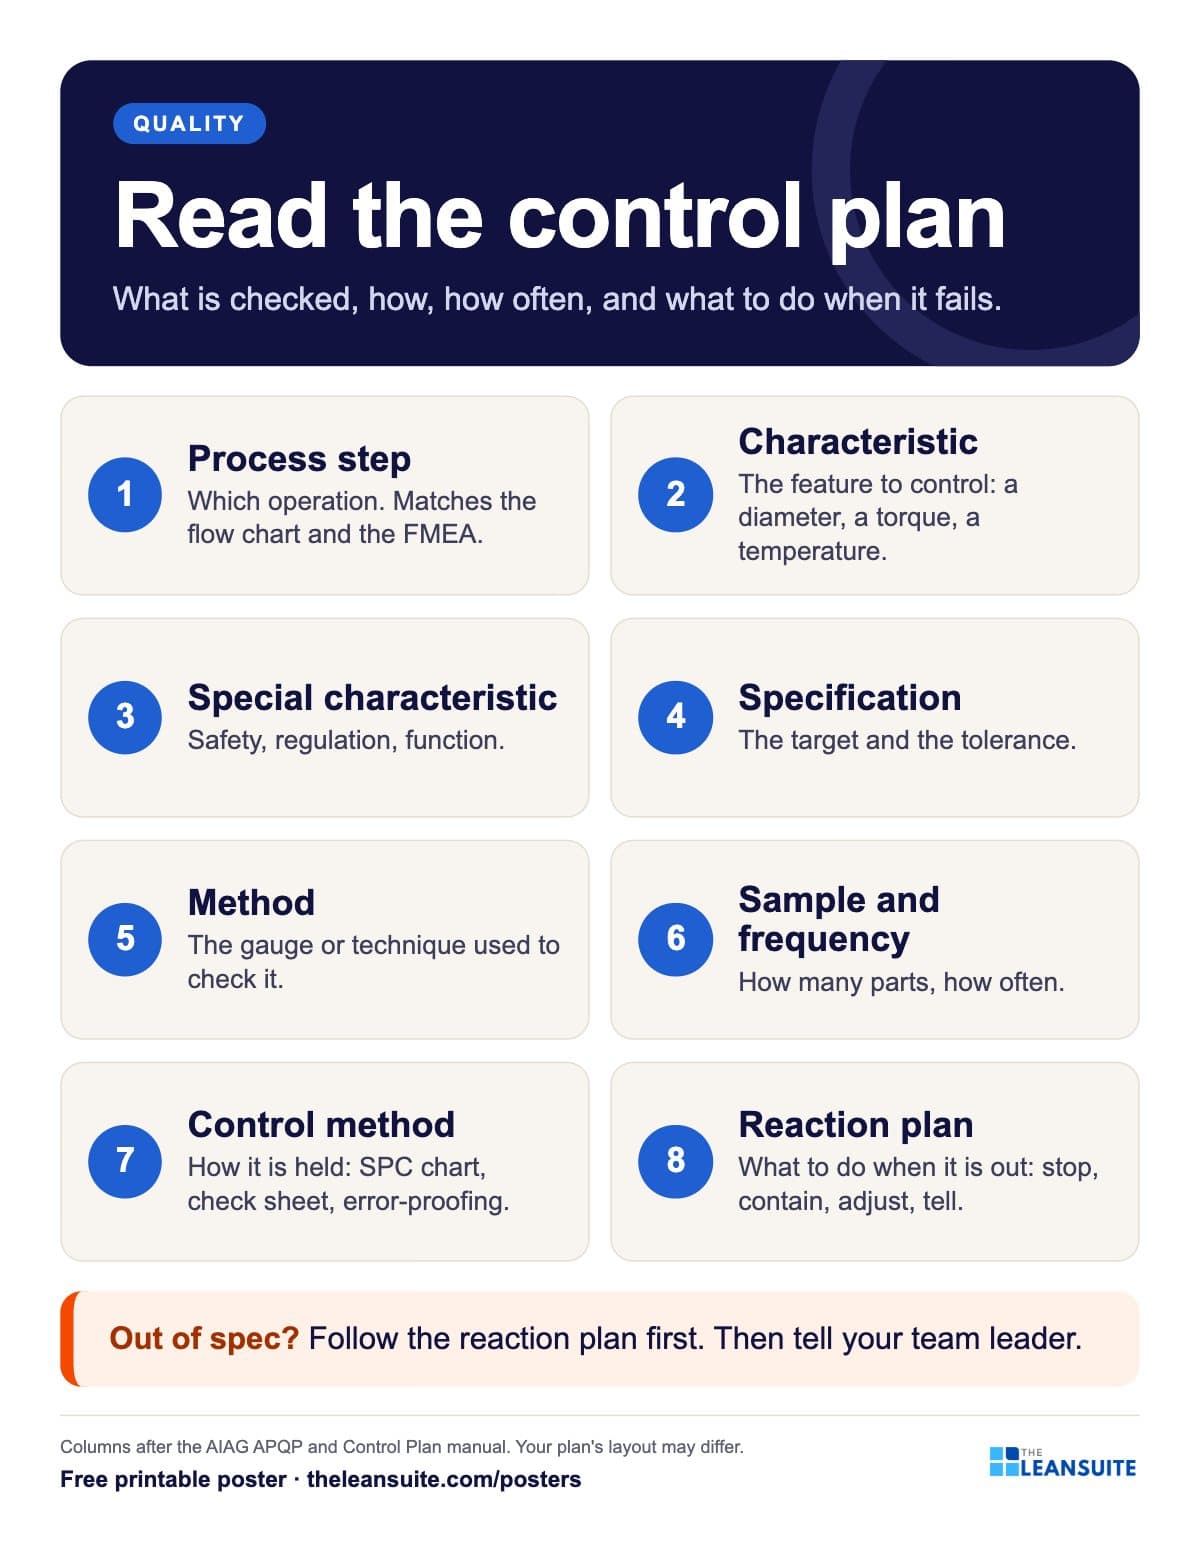 How to read a control plan poster
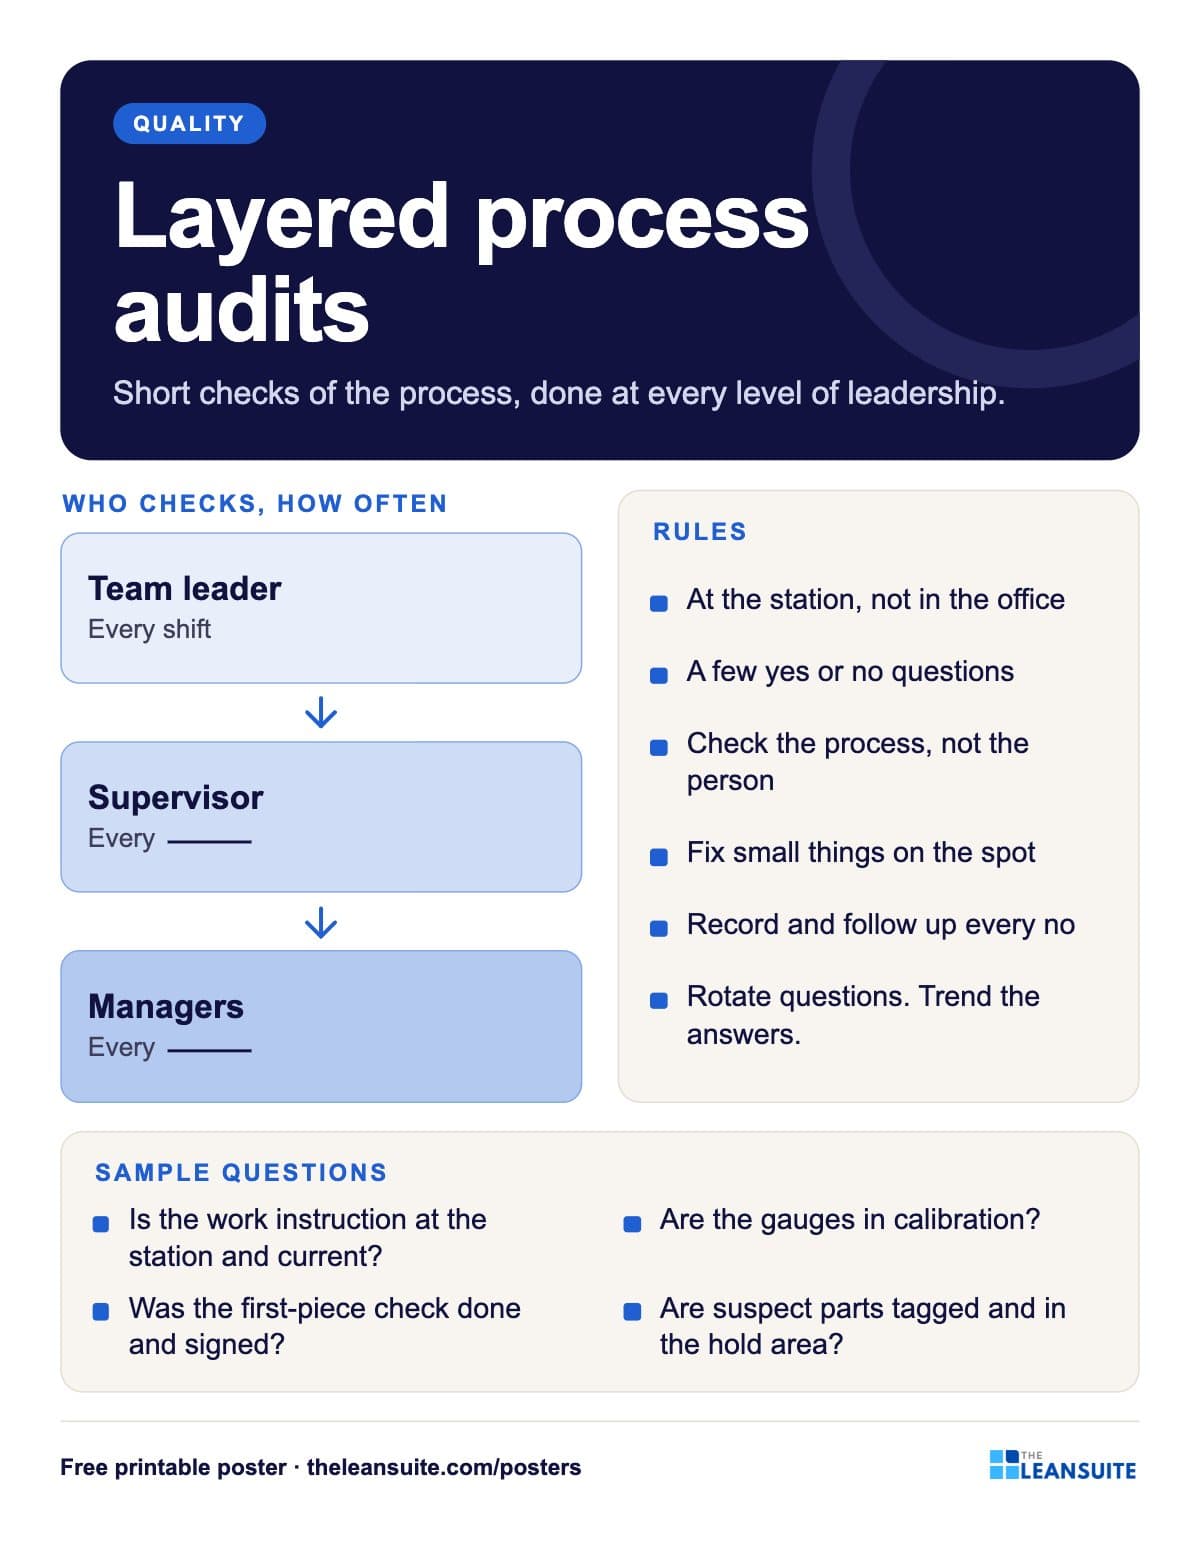 Layered process audit poster
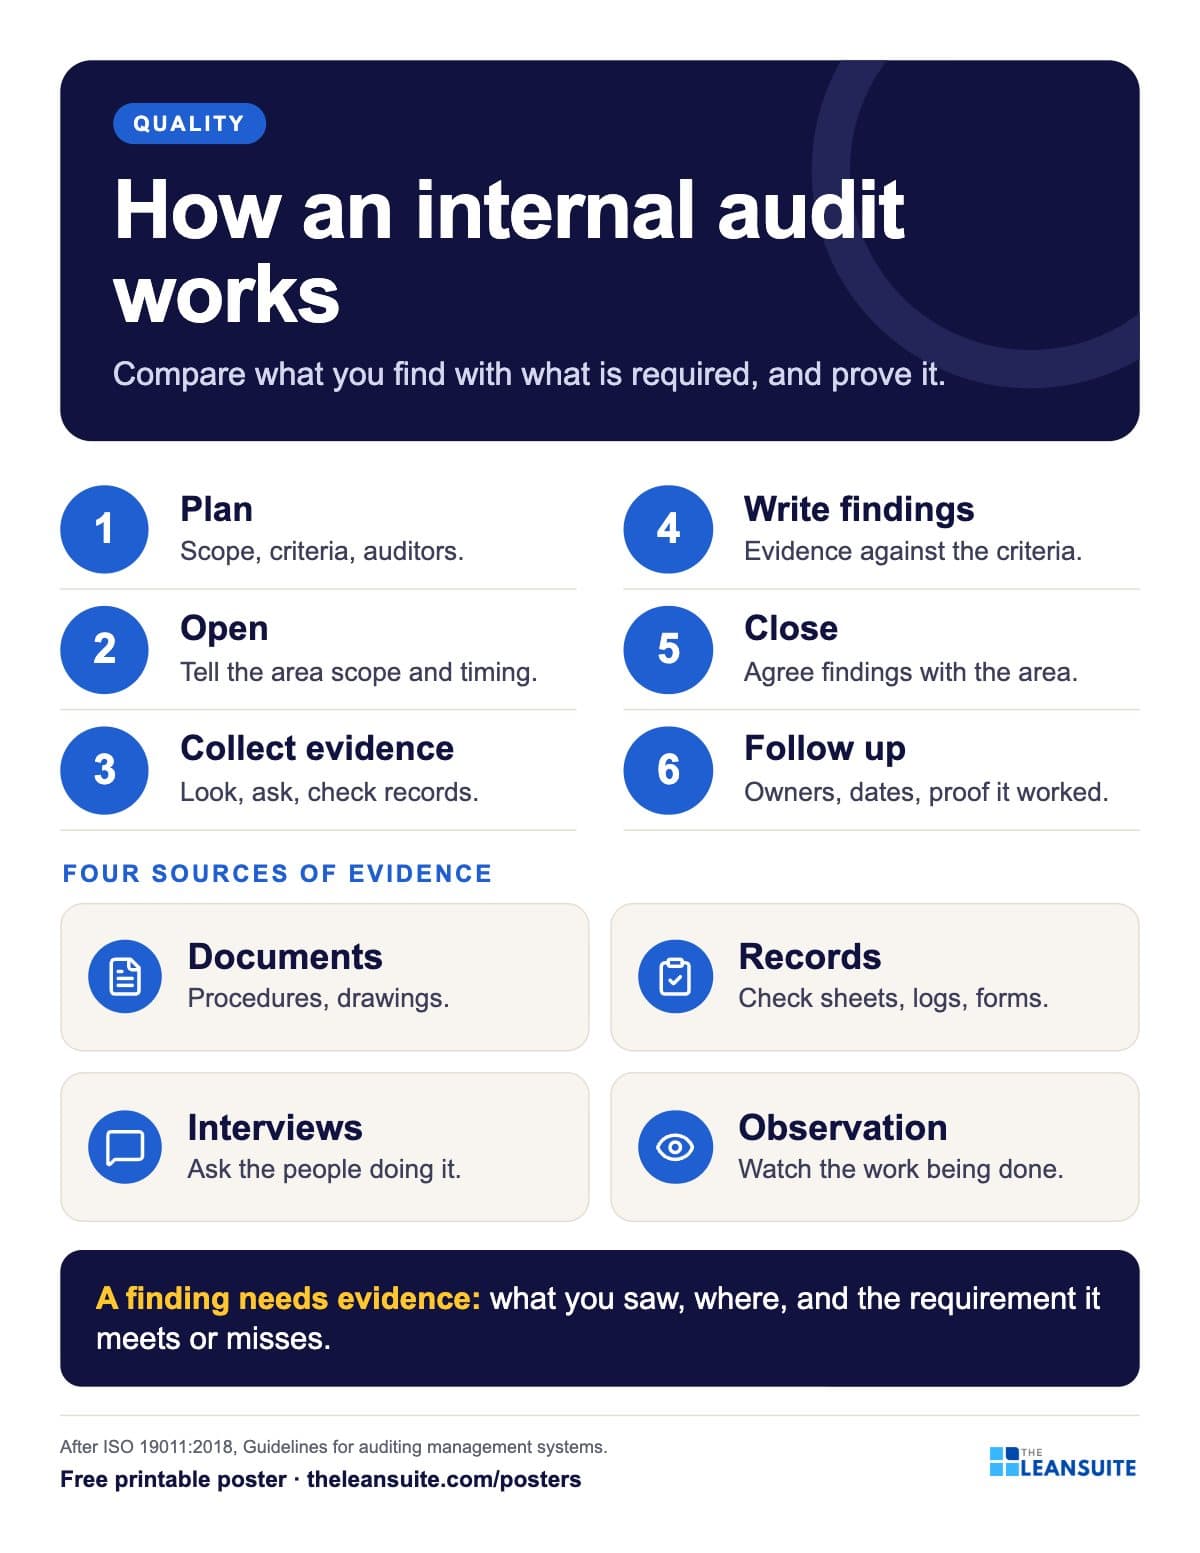 Internal audit steps poster
 Audit score 0 to 5 poster
 Reactive, preventive, proactive poster
A poster reminds. A routine makes it stick.
See how plants run their audits, improvements and follow-ups in LeanSuite, on a call built around your own problem.
Book a 45-minute demo