

Quality poster
Updated · Free to print and share
Cp and Cpk process capability poster
Process capability compares the spread of a stable process with its tolerance. Cp asks whether the spread could fit inside the tolerance; Cpk asks whether it does fit, where the process is centred now. This poster gives both in words, the rule that capability only means something for a stable process, and how to read Cpk using the acceptance levels in the AIAG PPAP manual: below 1.33 does not meet them, 1.33 to 1.67 may, above 1.67 does.
Download the poster
The PNG is free to download now. The print-ready vector PDFs open after a short form, once.
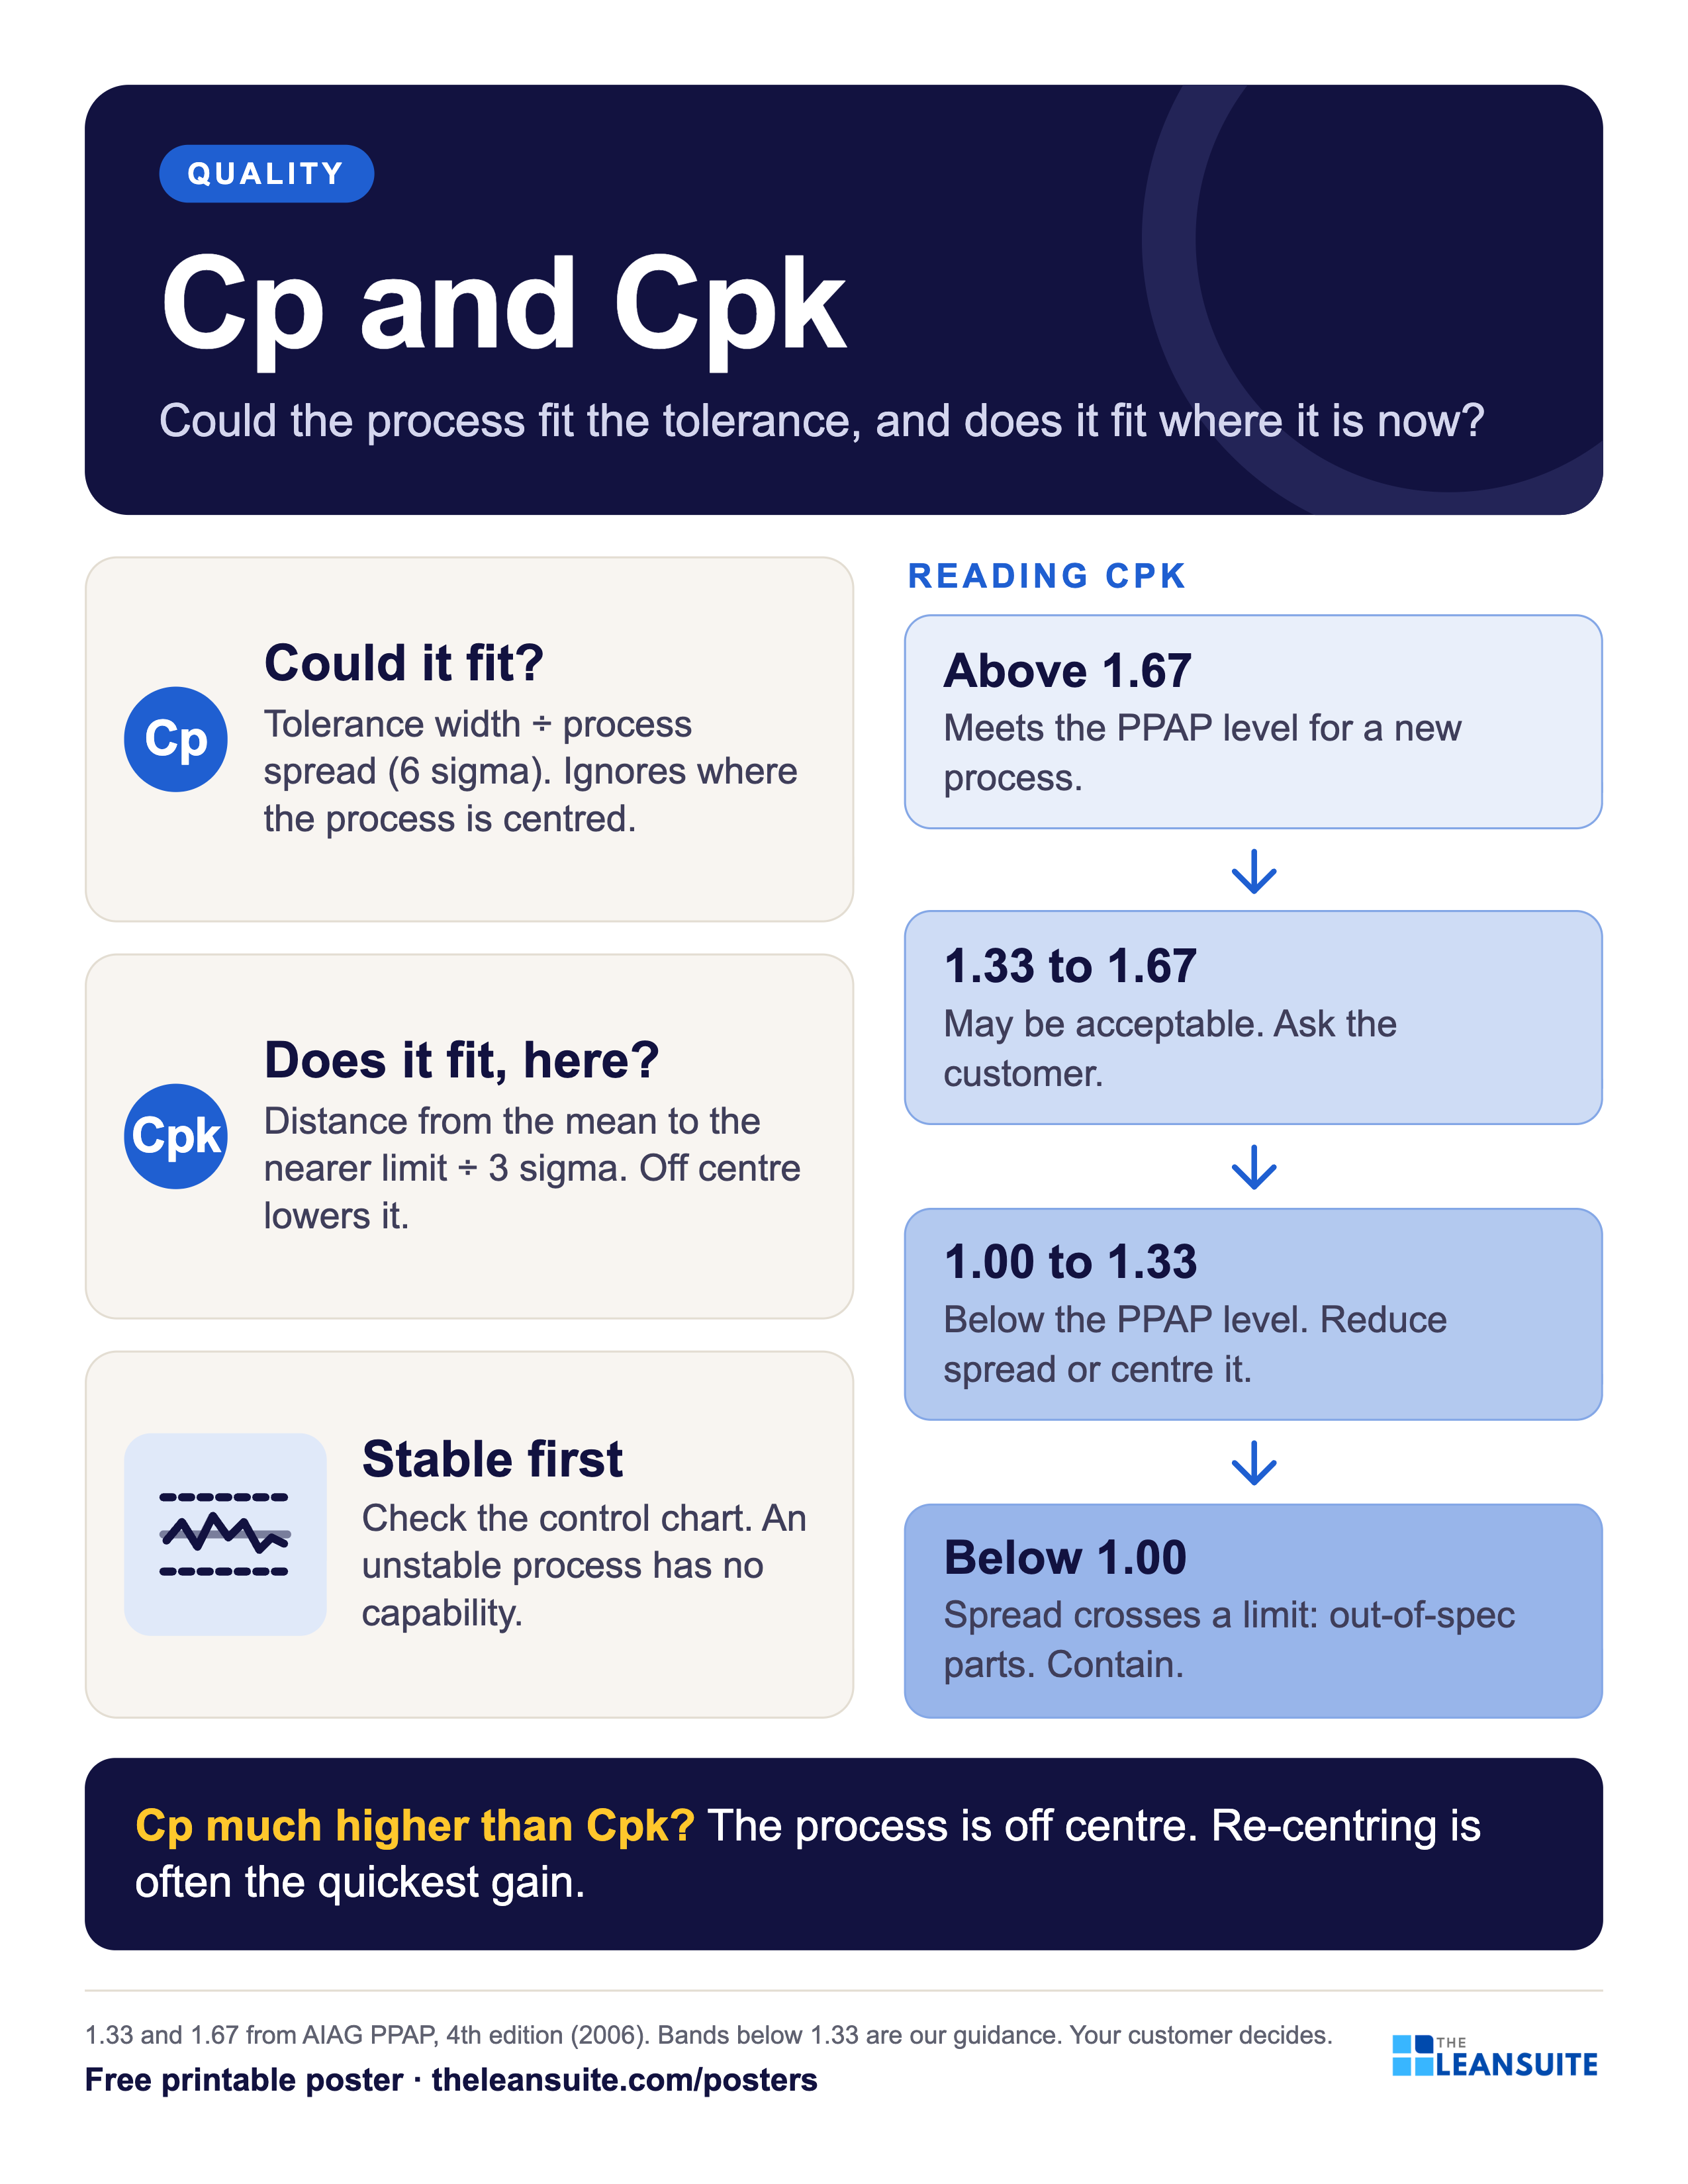
Free to print and share with your team. Enter your name and work email once to download.
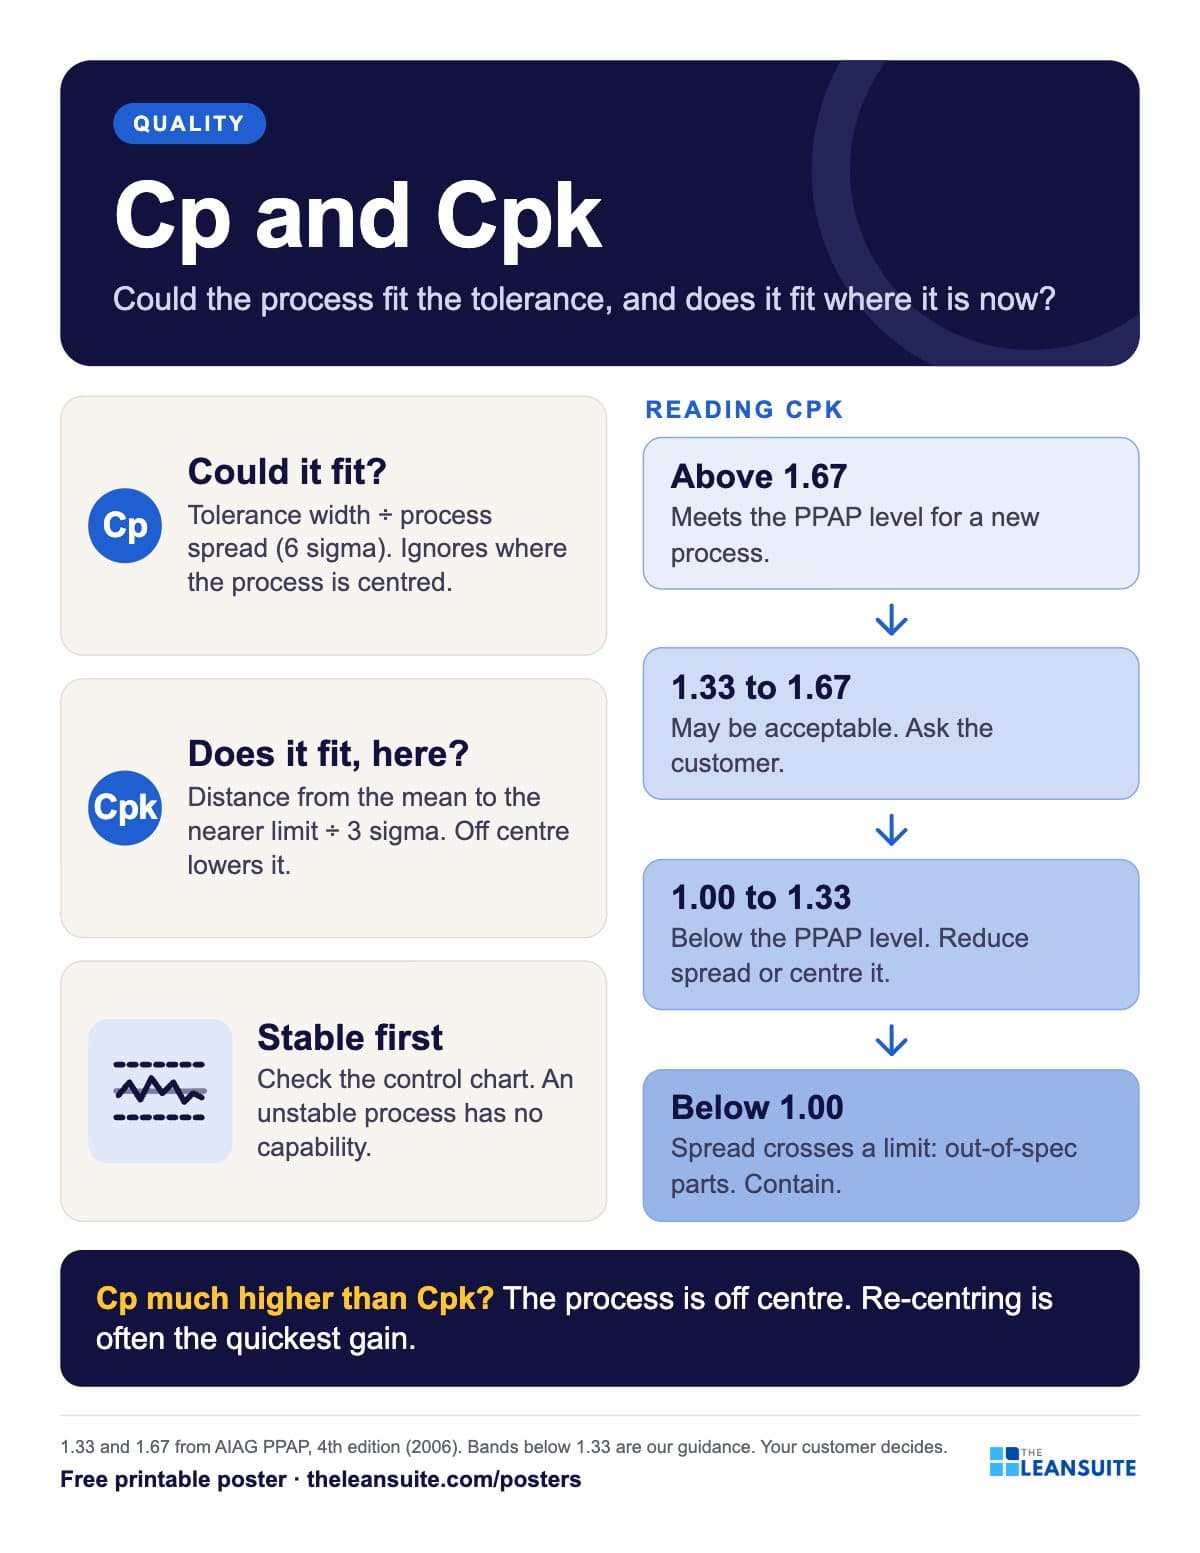 The two indexes explained in words, a stability rule, and a ladder for reading Cpk from below 1.00 to above 1.67.
The words on the poster
Cp and Cpk
Could the process fit the tolerance, and does it fit where it is now?
- Could it fit? Tolerance width ÷ process spread (6 sigma). Ignores where the process is centred.
- Does it fit, here? Distance from the mean to the nearer limit ÷ 3 sigma. Off centre lowers it.
- Stable first Check the control chart. An unstable process has no capability.
Reading Cpk
- Above 1.67 Meets the PPAP level for a new process.
- 1.33 to 1.67 May be acceptable. Ask the customer.
- 1.00 to 1.33 Below the PPAP level. Reduce spread or centre it.
- Below 1.00 Spread crosses a limit: out-of-spec parts. Contain.
- Cp much higher than Cpk? The process is off centre. Re-centring is often the quickest gain.
1.33 and 1.67 from AIAG PPAP, 4th edition (2006). Bands below 1.33 are our guidance. Your customer decides.
On the floor
How to use it
Putting the Cp and Cpk process capability poster to work
- 1
Hang it in the quality office or the lab where capability studies are reviewed.
- 2
Check the control chart before quoting a Cpk: an unstable process has no capability.
- 3
Compare Cp and Cpk: a big gap means the process is off centre, which is often the easier fix.
- 4
Pair it with the free Cpk study sheet and PPAP checklist.
Which size to print
- 24 x 36 in or A2: a main wall or team board, read from a few metres away.
- 18 x 24 in or A3: a station or notice board. The A3 file also fits 11 x 17 in paper.
- Letter or A4: a clipboard, binder or handout, on any office printer.
Every PDF is vector, so it stays sharp at full size. Nothing runs to the edge of the page, so no bleed is needed.
Sources and notes
- AIAG, Production Part Approval Process (PPAP), 4th edition (2006): acceptance criteria for initial process studies, index above 1.67 meets, 1.33 to 1.67 may be acceptable, below 1.33 does not meet. The poster's two bands below 1.33 (1.00 to 1.33, below 1.00) are its own guidance, not PPAP levels.
- Douglas C. Montgomery, Introduction to Statistical Quality Control (Wiley): Cp = (USL minus LSL) ÷ 6 sigma, Cpk = the smaller of (USL minus mean) and (mean minus LSL), ÷ 3 sigma.
Templates, decks and guides to go with it
- Process capability (Cpk) study sheet25 subgroups of readings with Cp, Cpk, Pp and Ppk worked out, control limits to check stability, and a histogram.
- PPAP checklistThe 18 PPAP elements with owner, due date and status, the five submission levels and a readiness count.
- X-bar and R control chart template25 subgroups with means and ranges, control limits from A2, D3 and D4, signal flags, both charts and a reaction log.
- Topic: Quality managementEvery guide we have on the subject, sorted.
More quality posters
All posters PDCA cycle poster
 5 whys poster
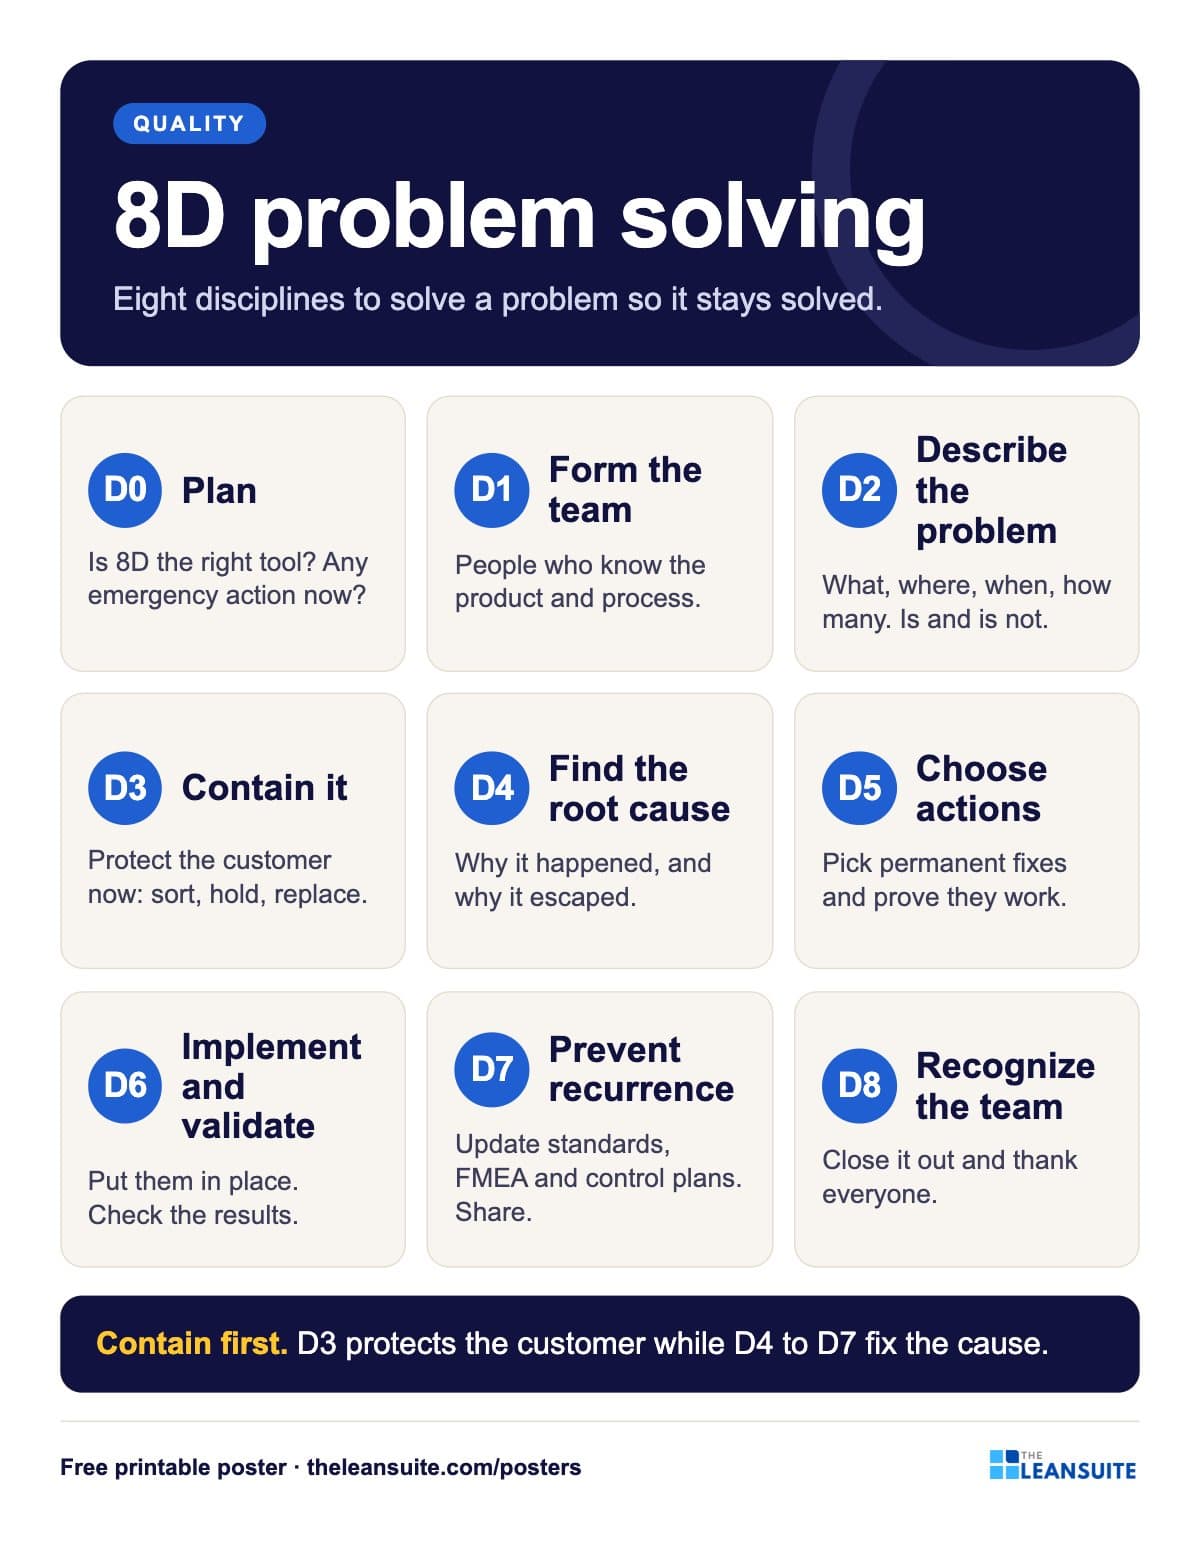 8D problem solving poster
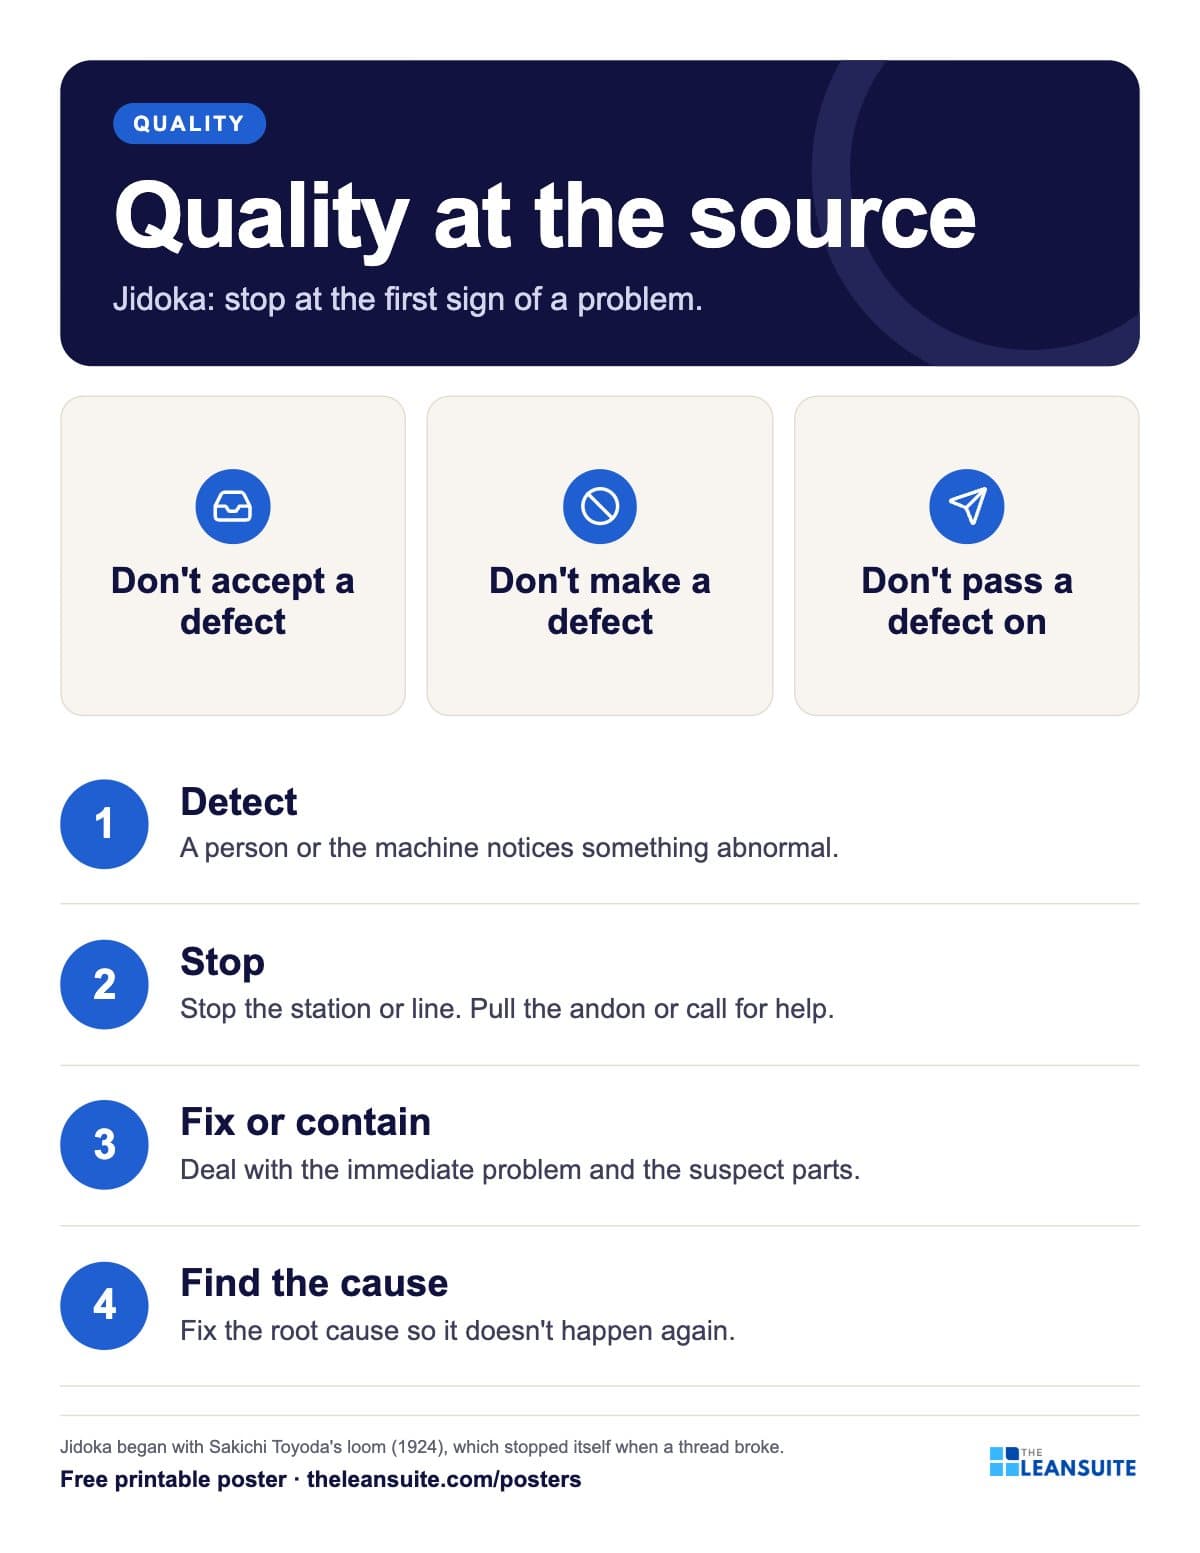 Jidoka and quality at the source poster
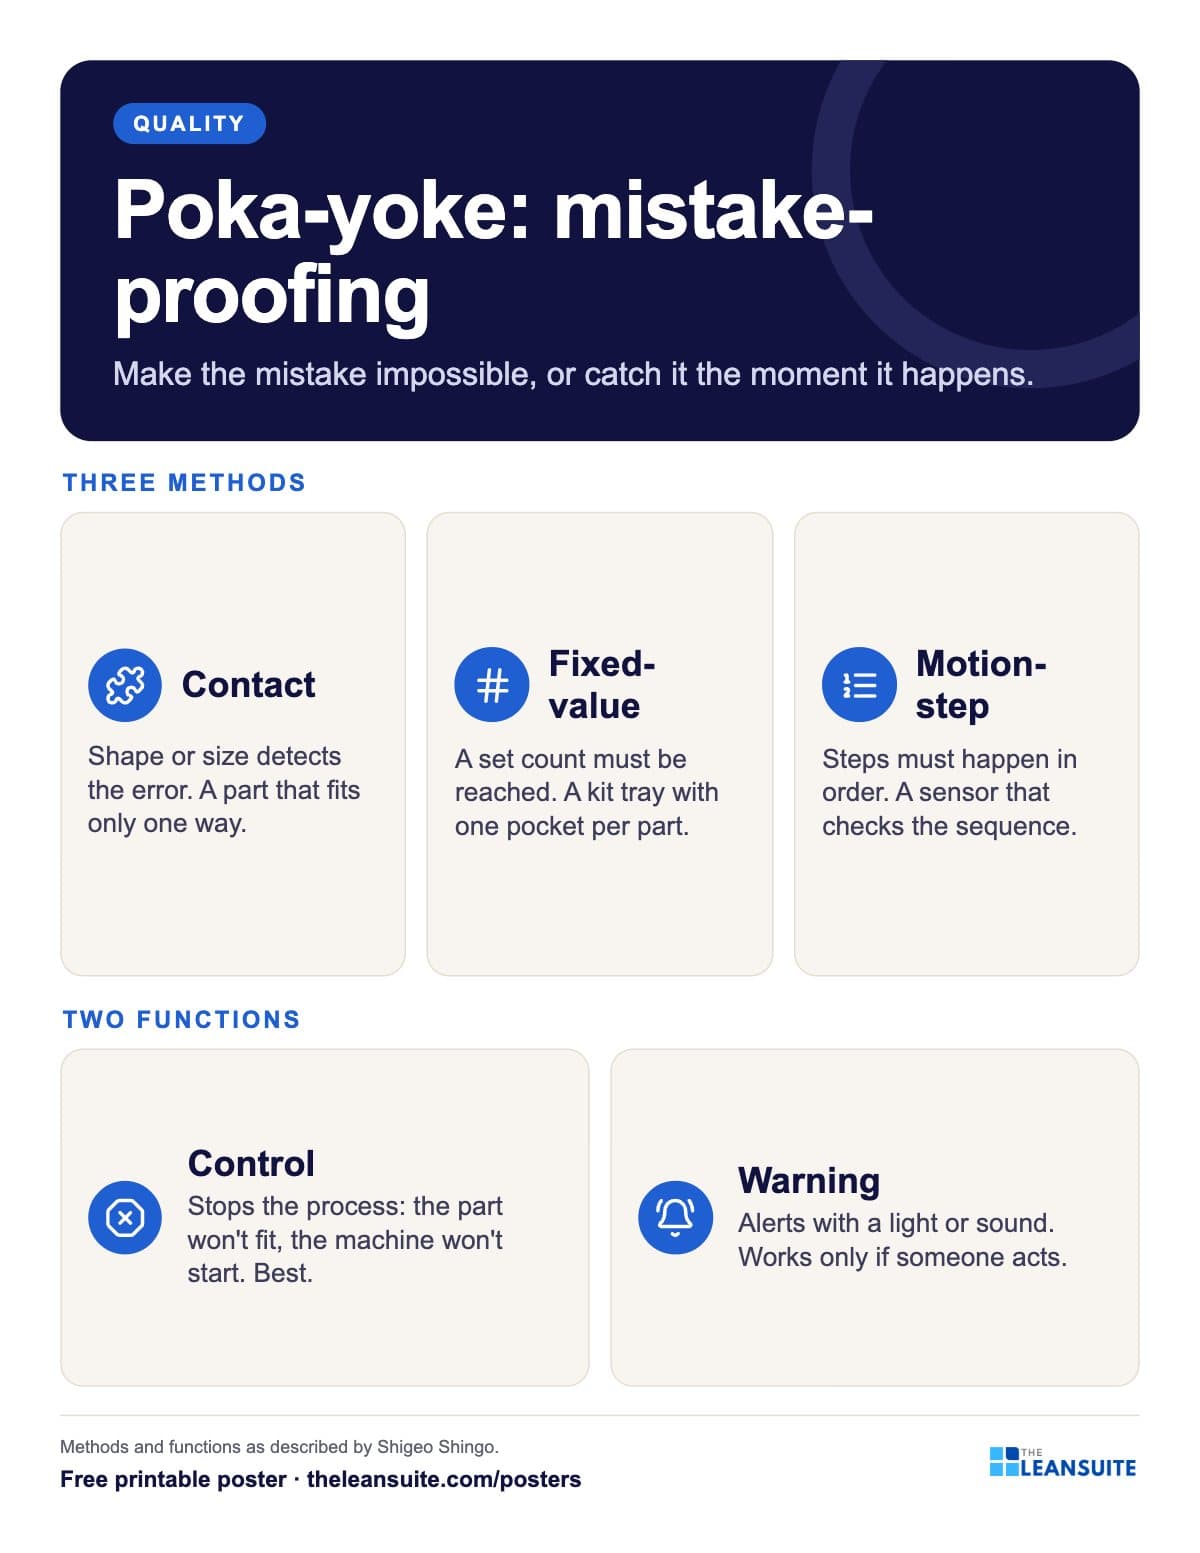 Poka-yoke types poster
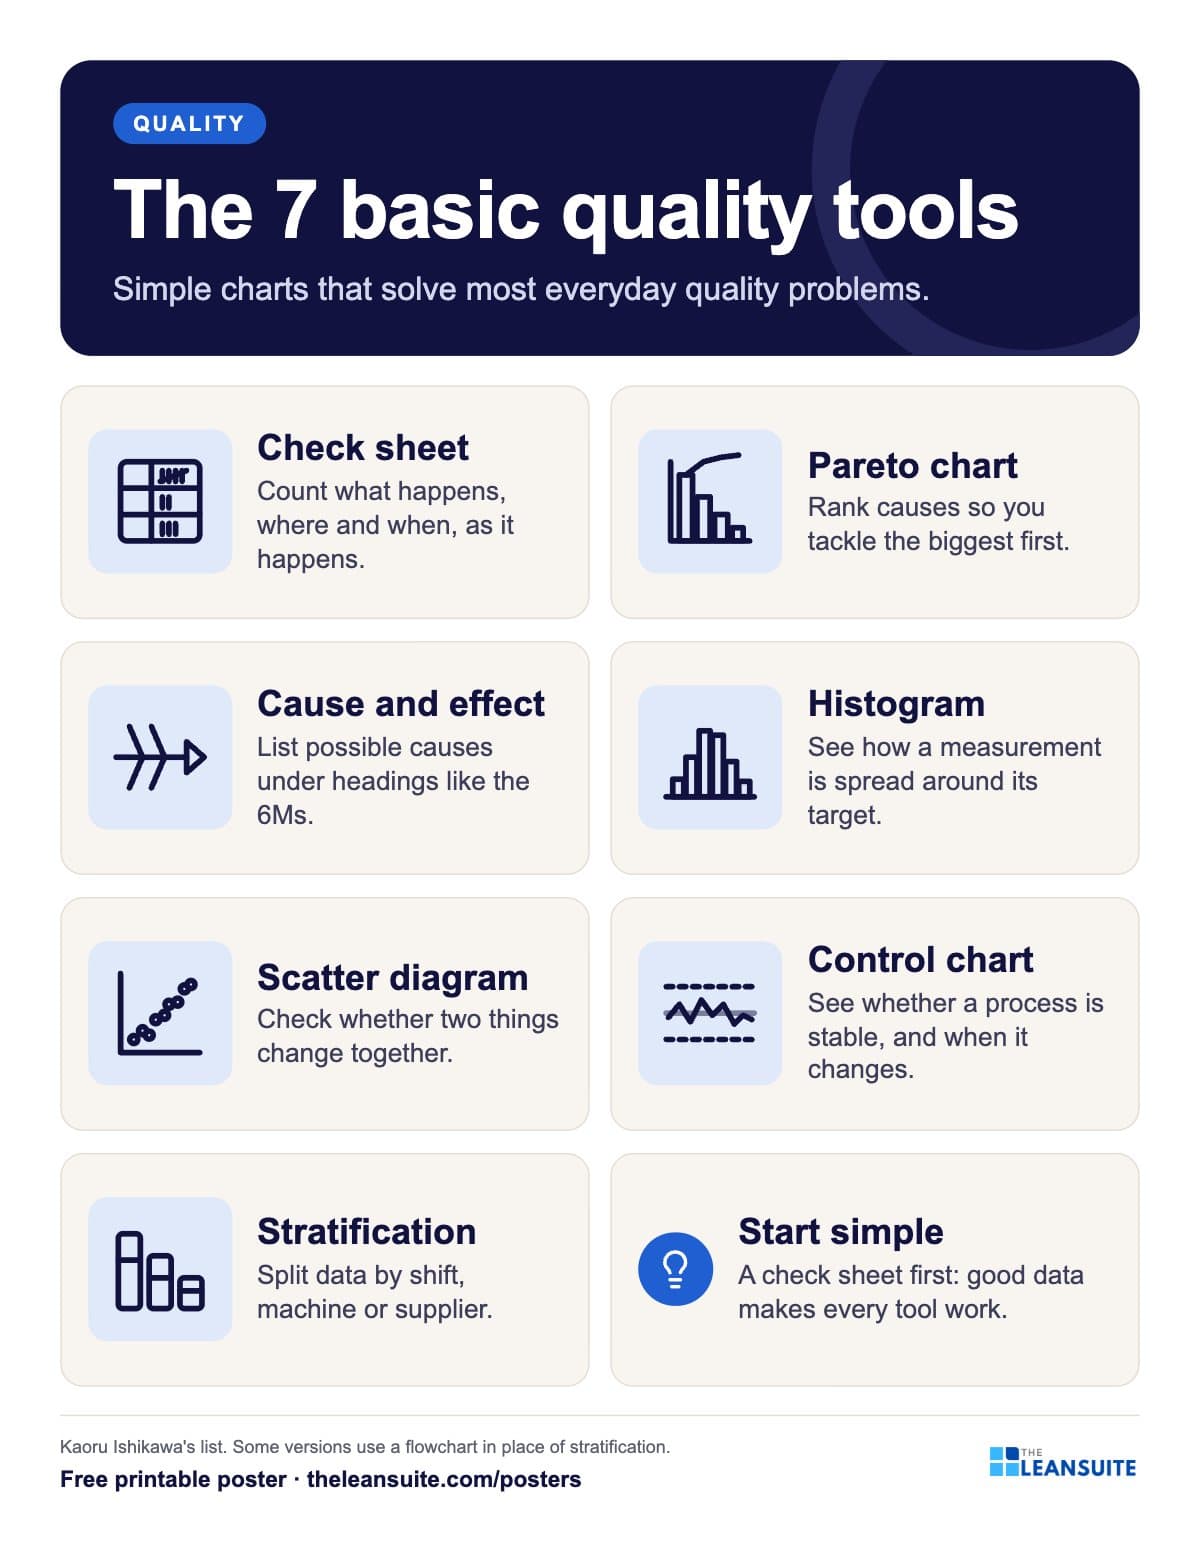 7 basic quality tools poster
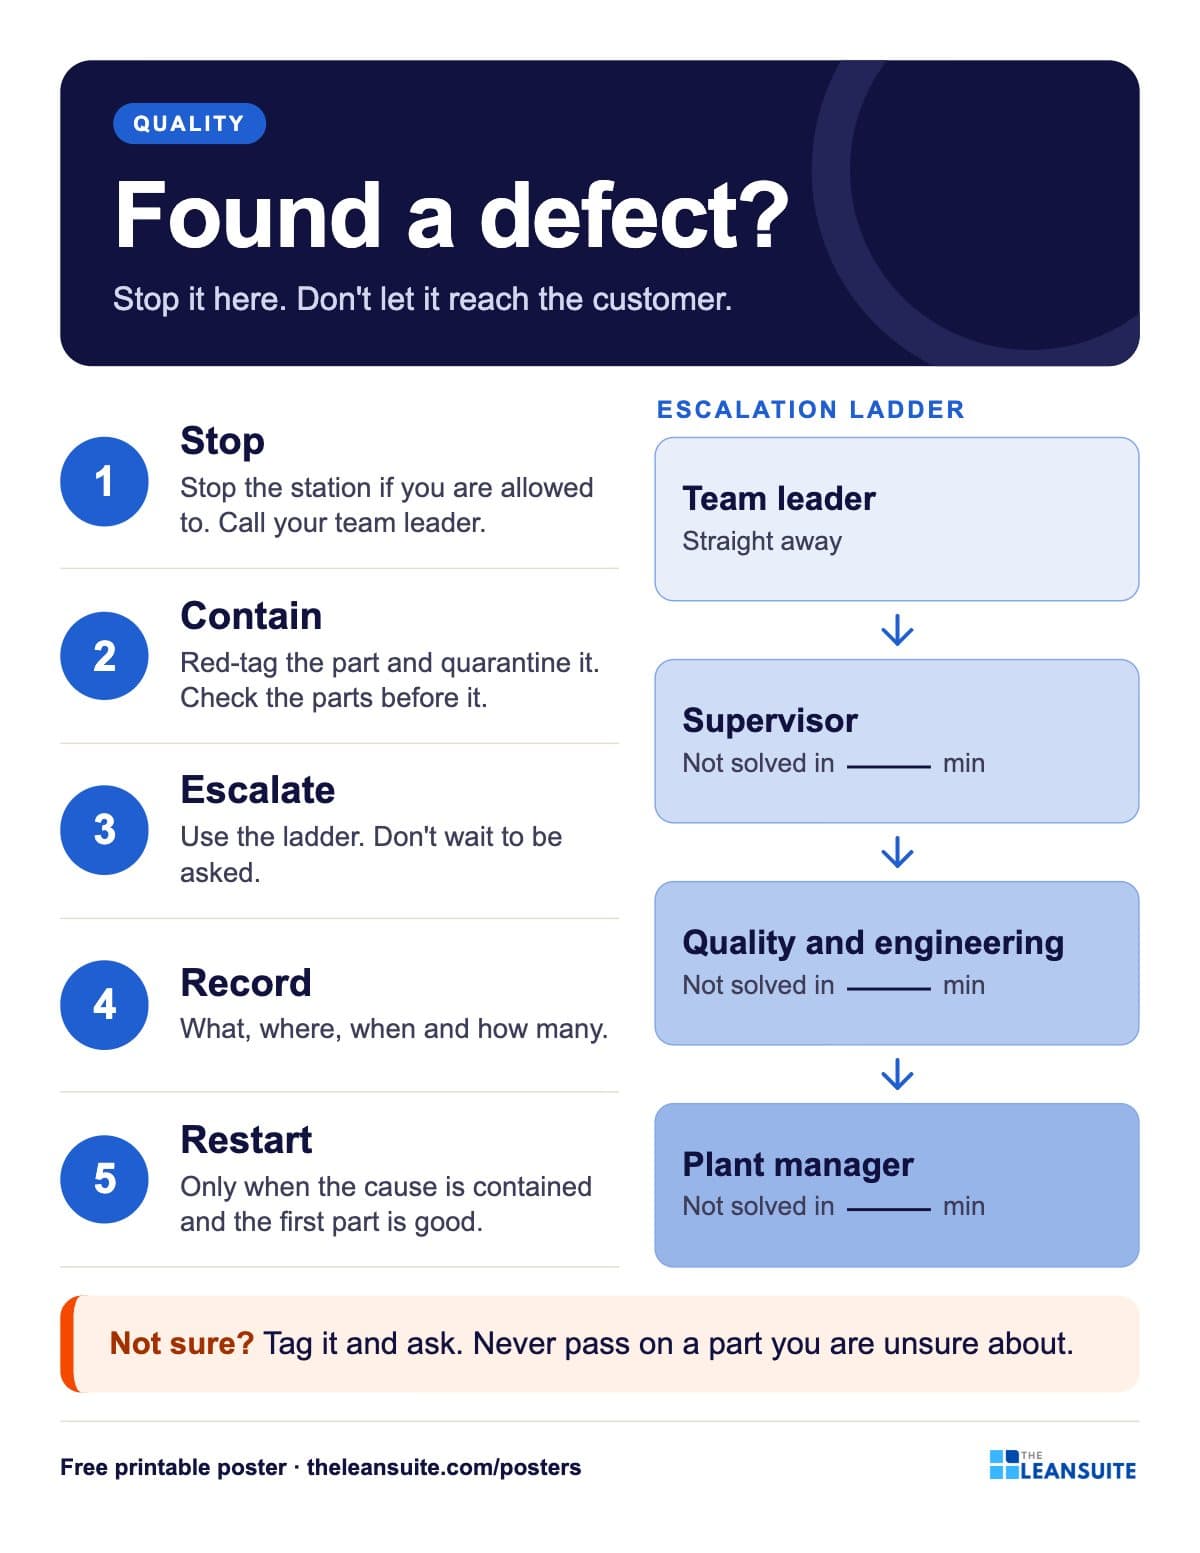 Defect escalation poster (red tag and stop the line)
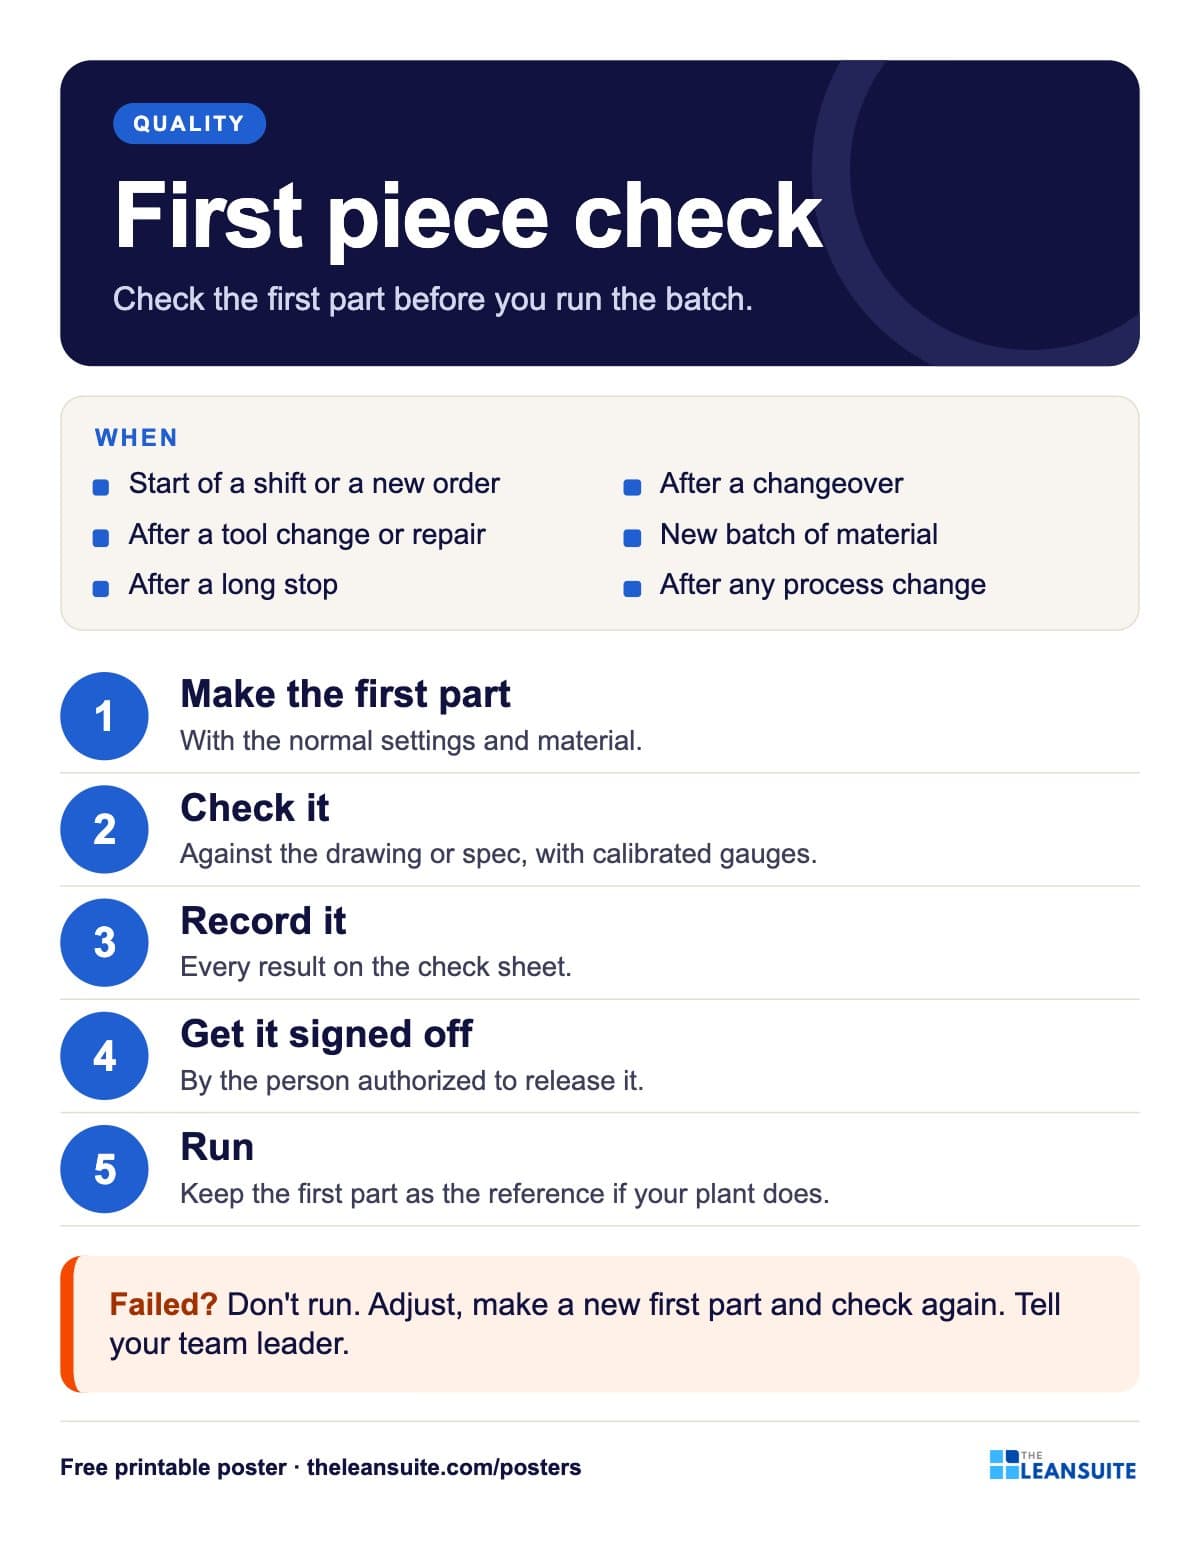 First piece (first article) check poster
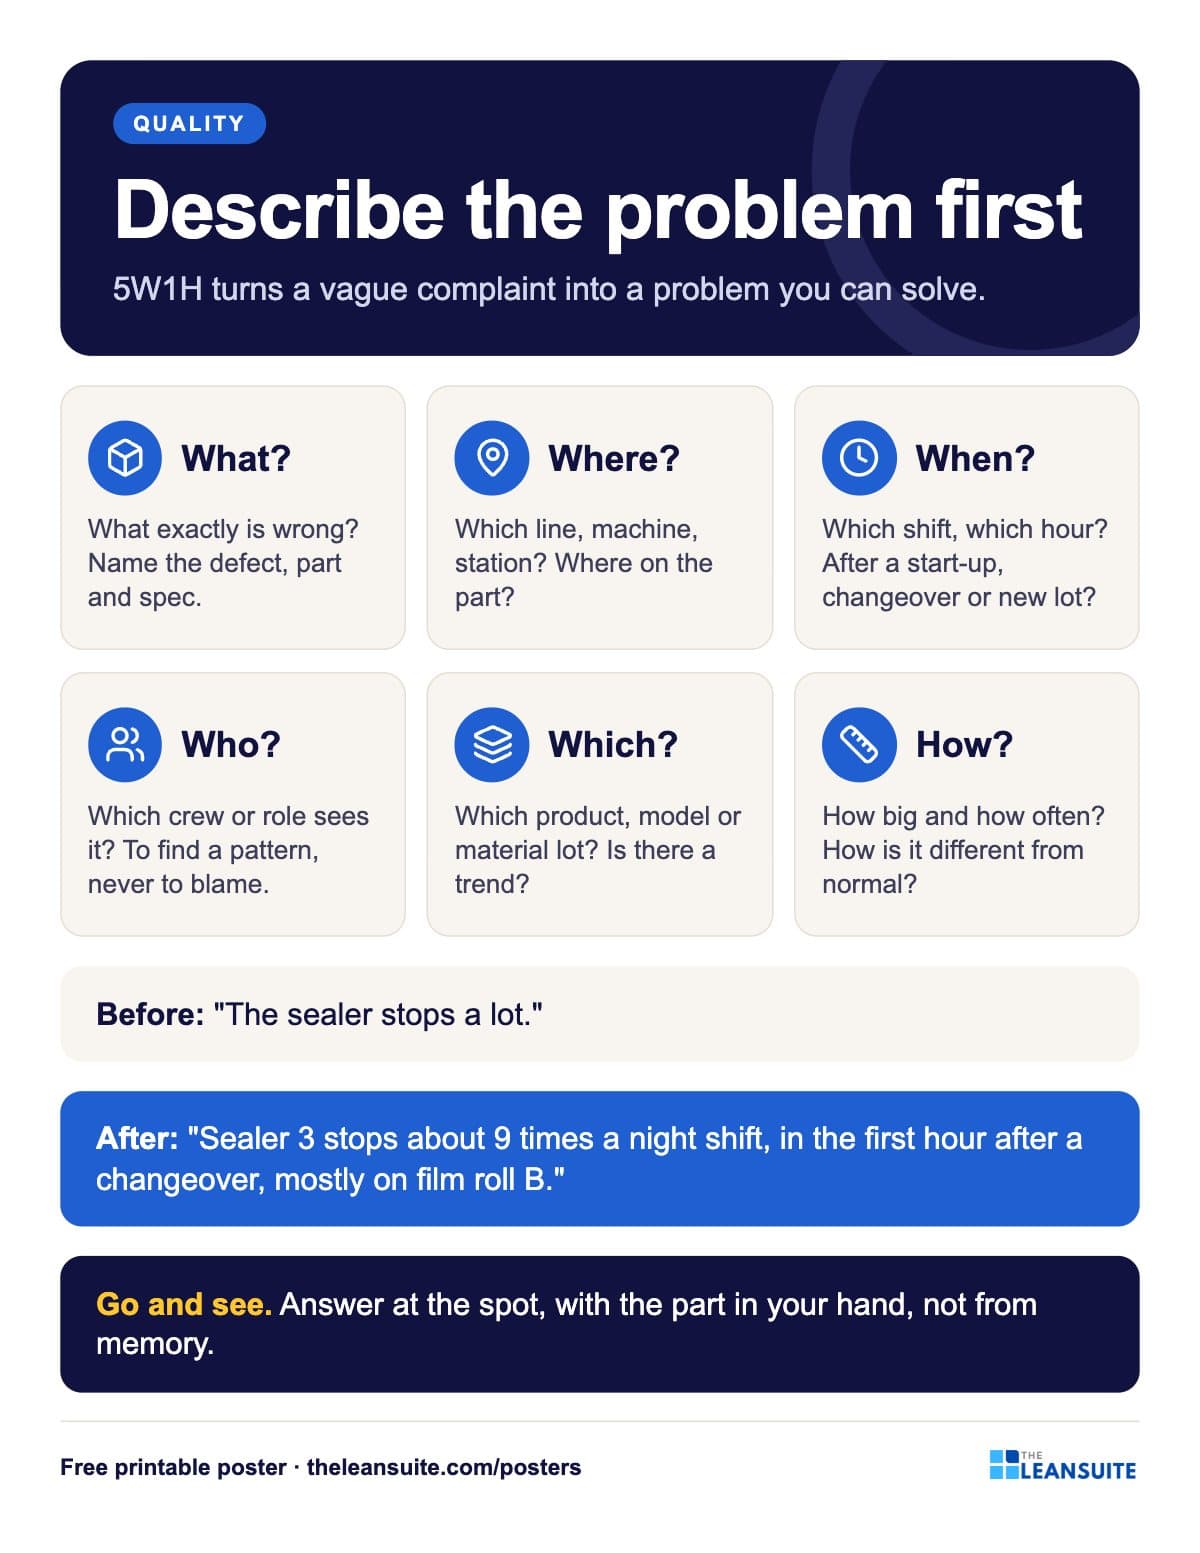 5W1H problem description poster
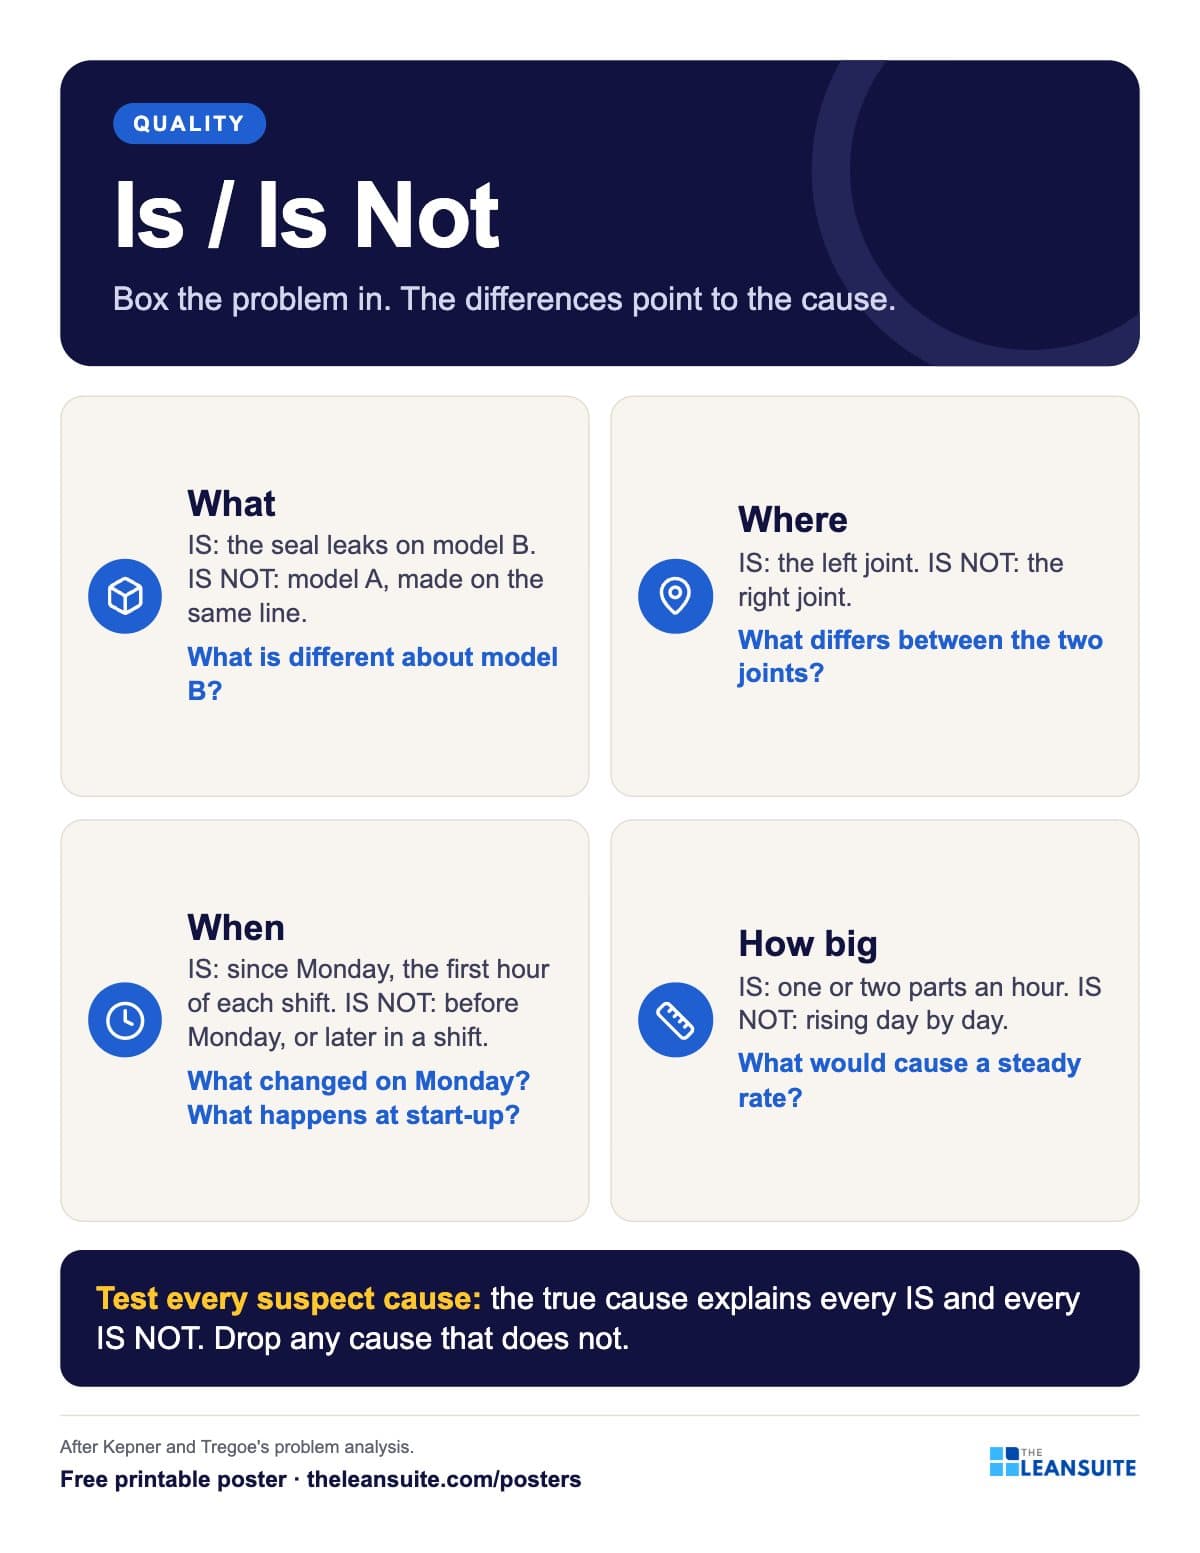 Is / Is Not analysis poster
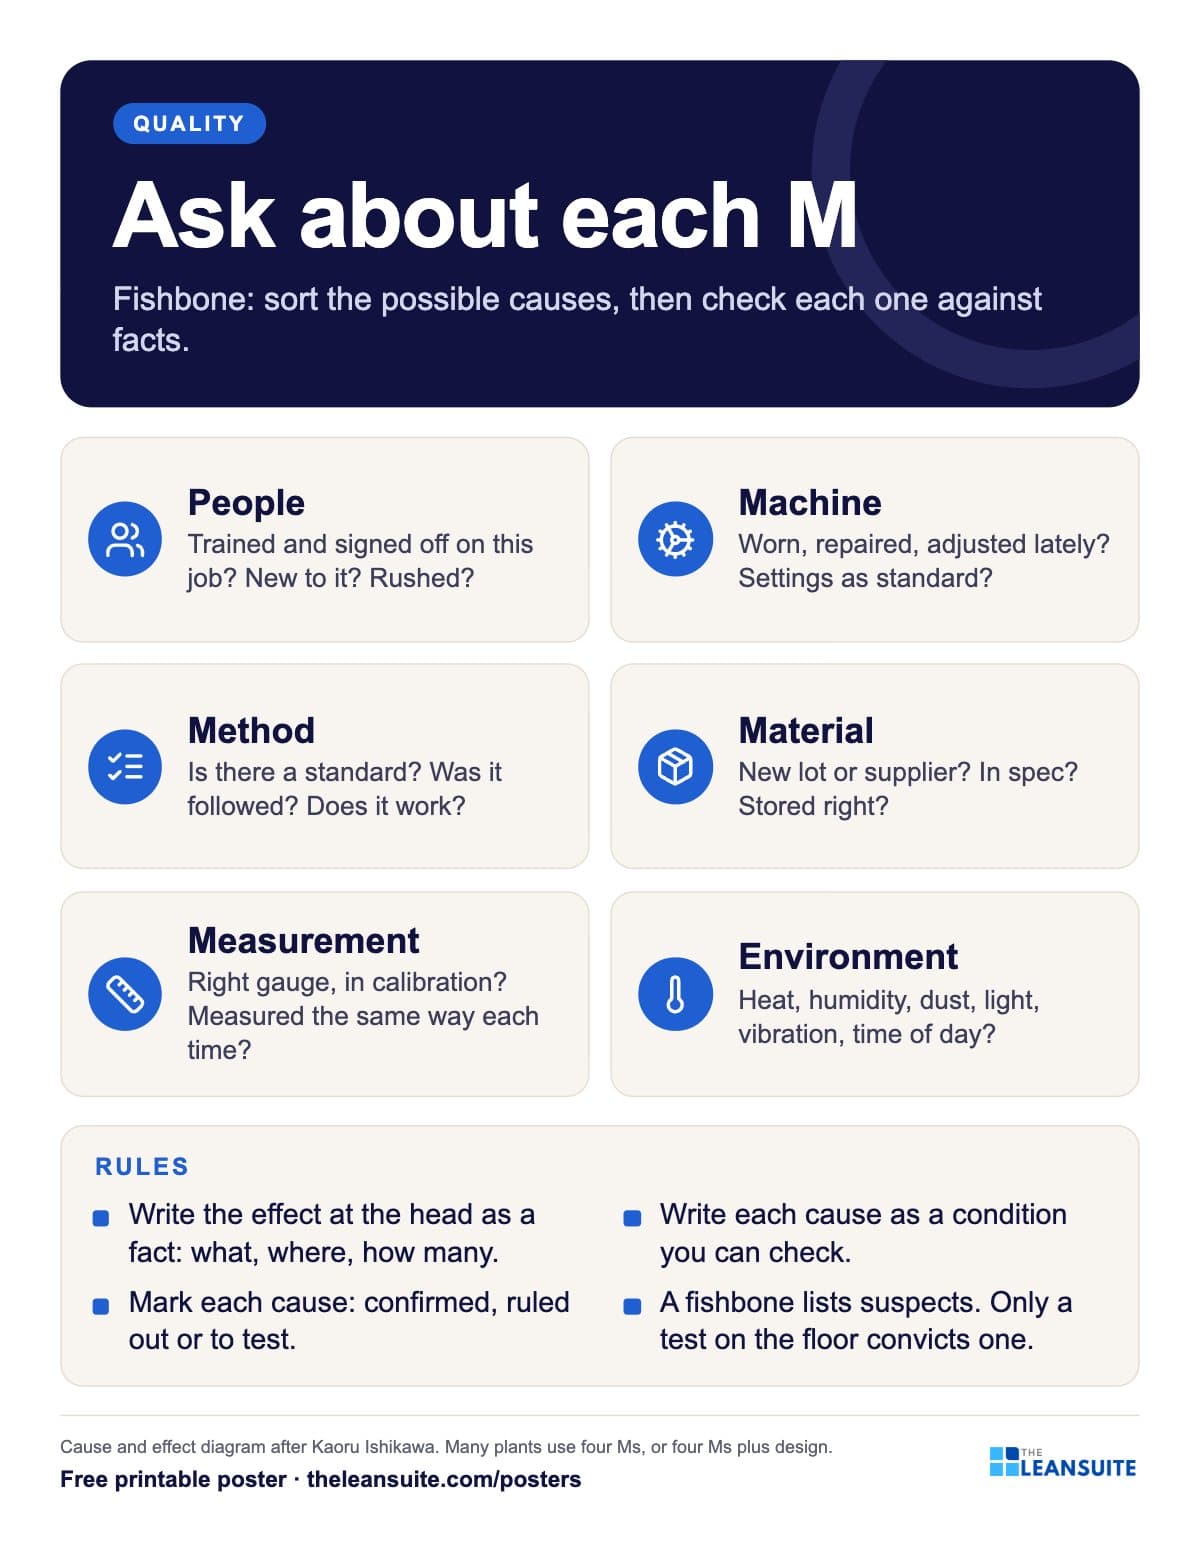 Fishbone 6M questions poster
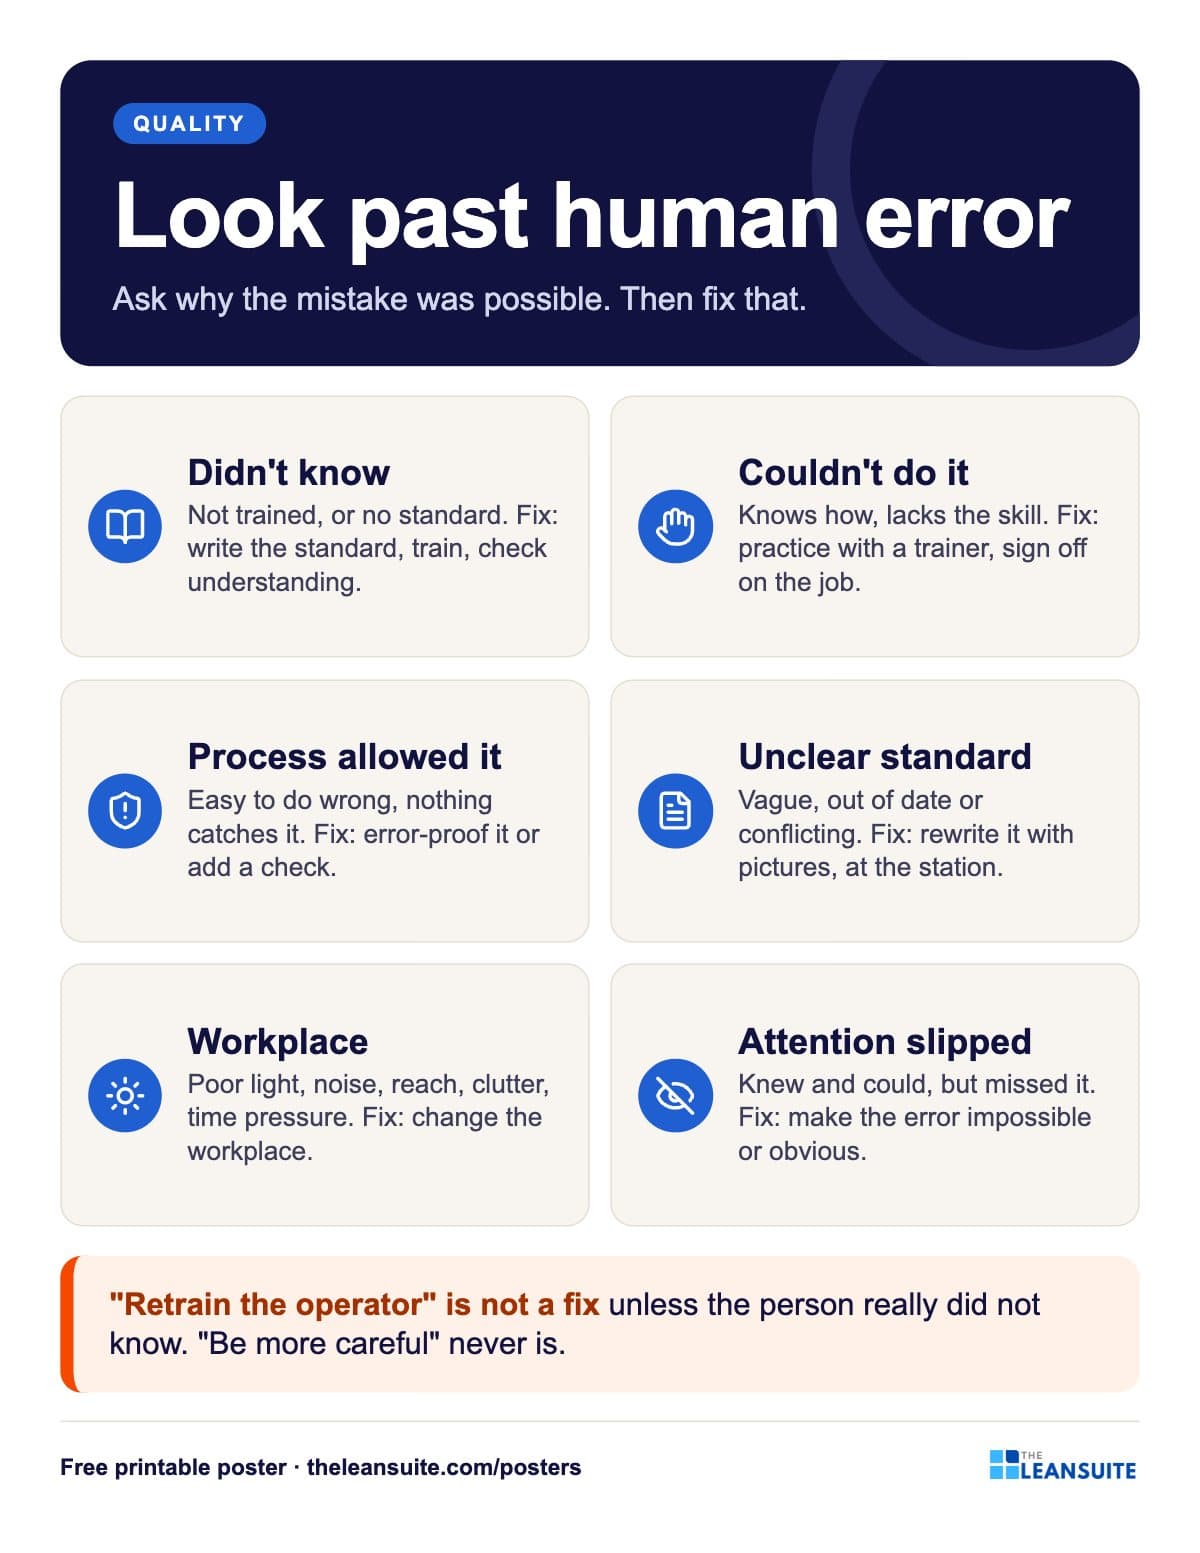 Human error root causes poster
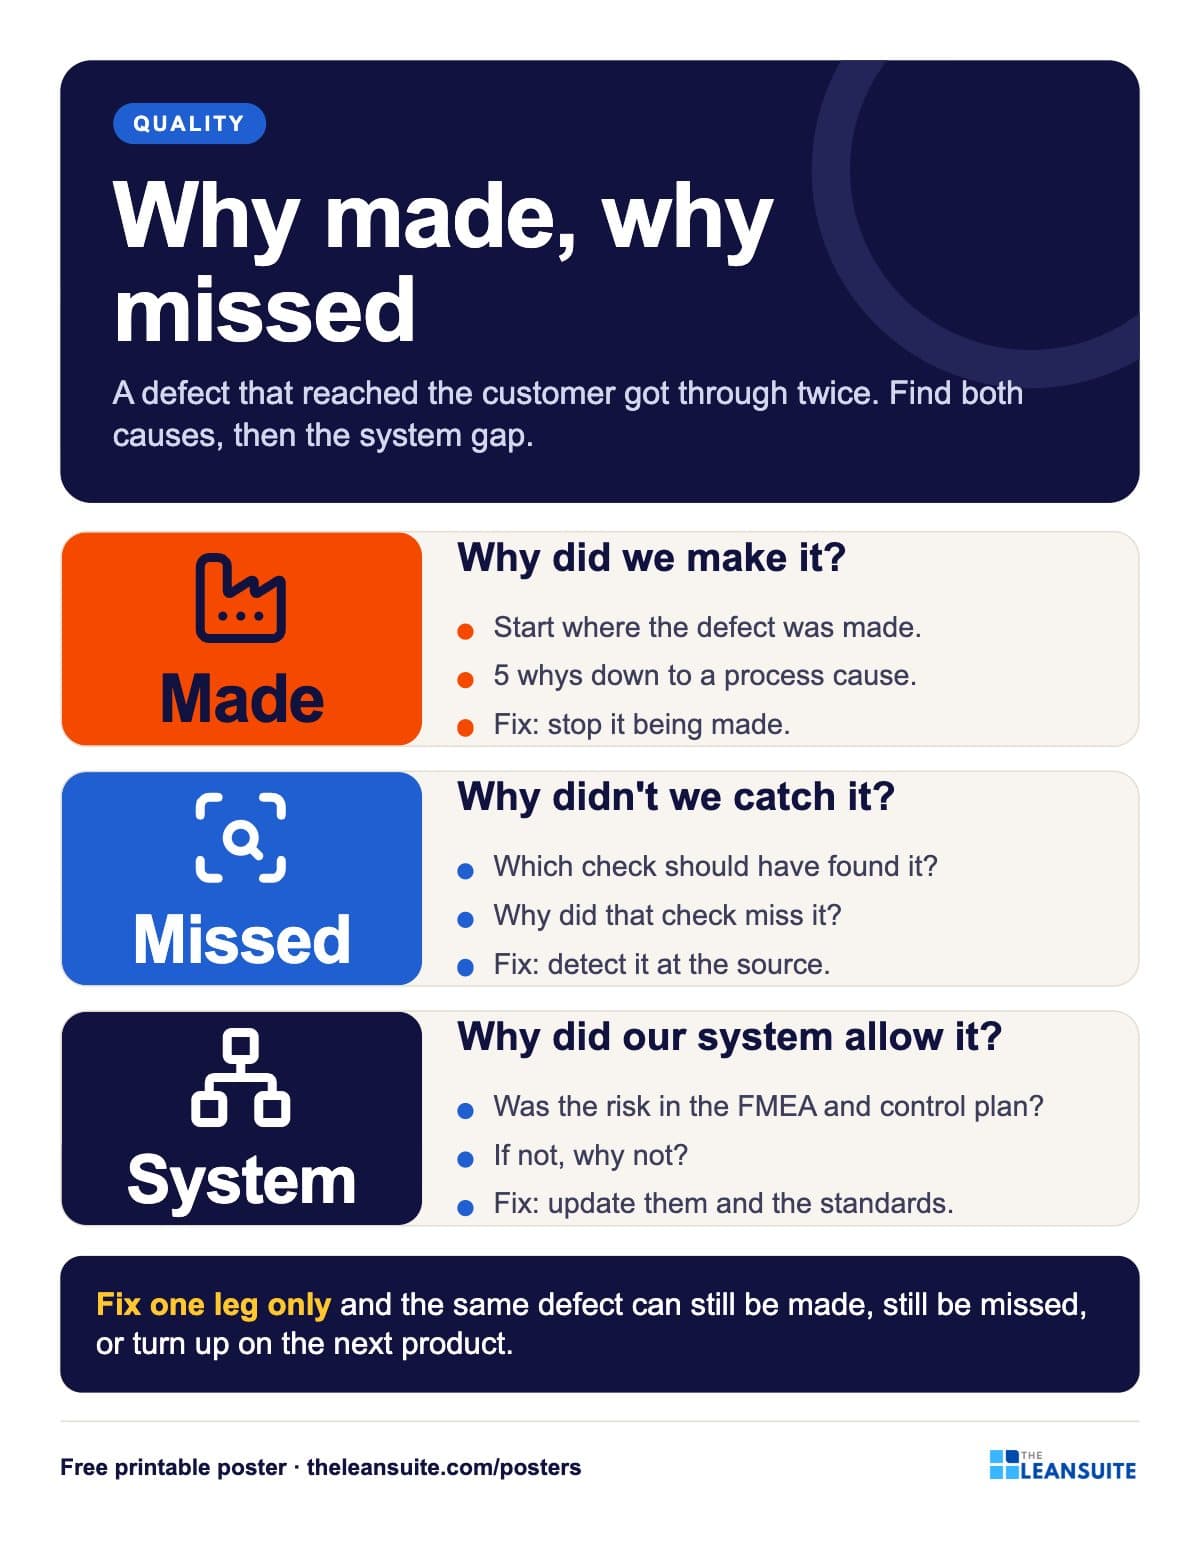 Why made, why missed poster
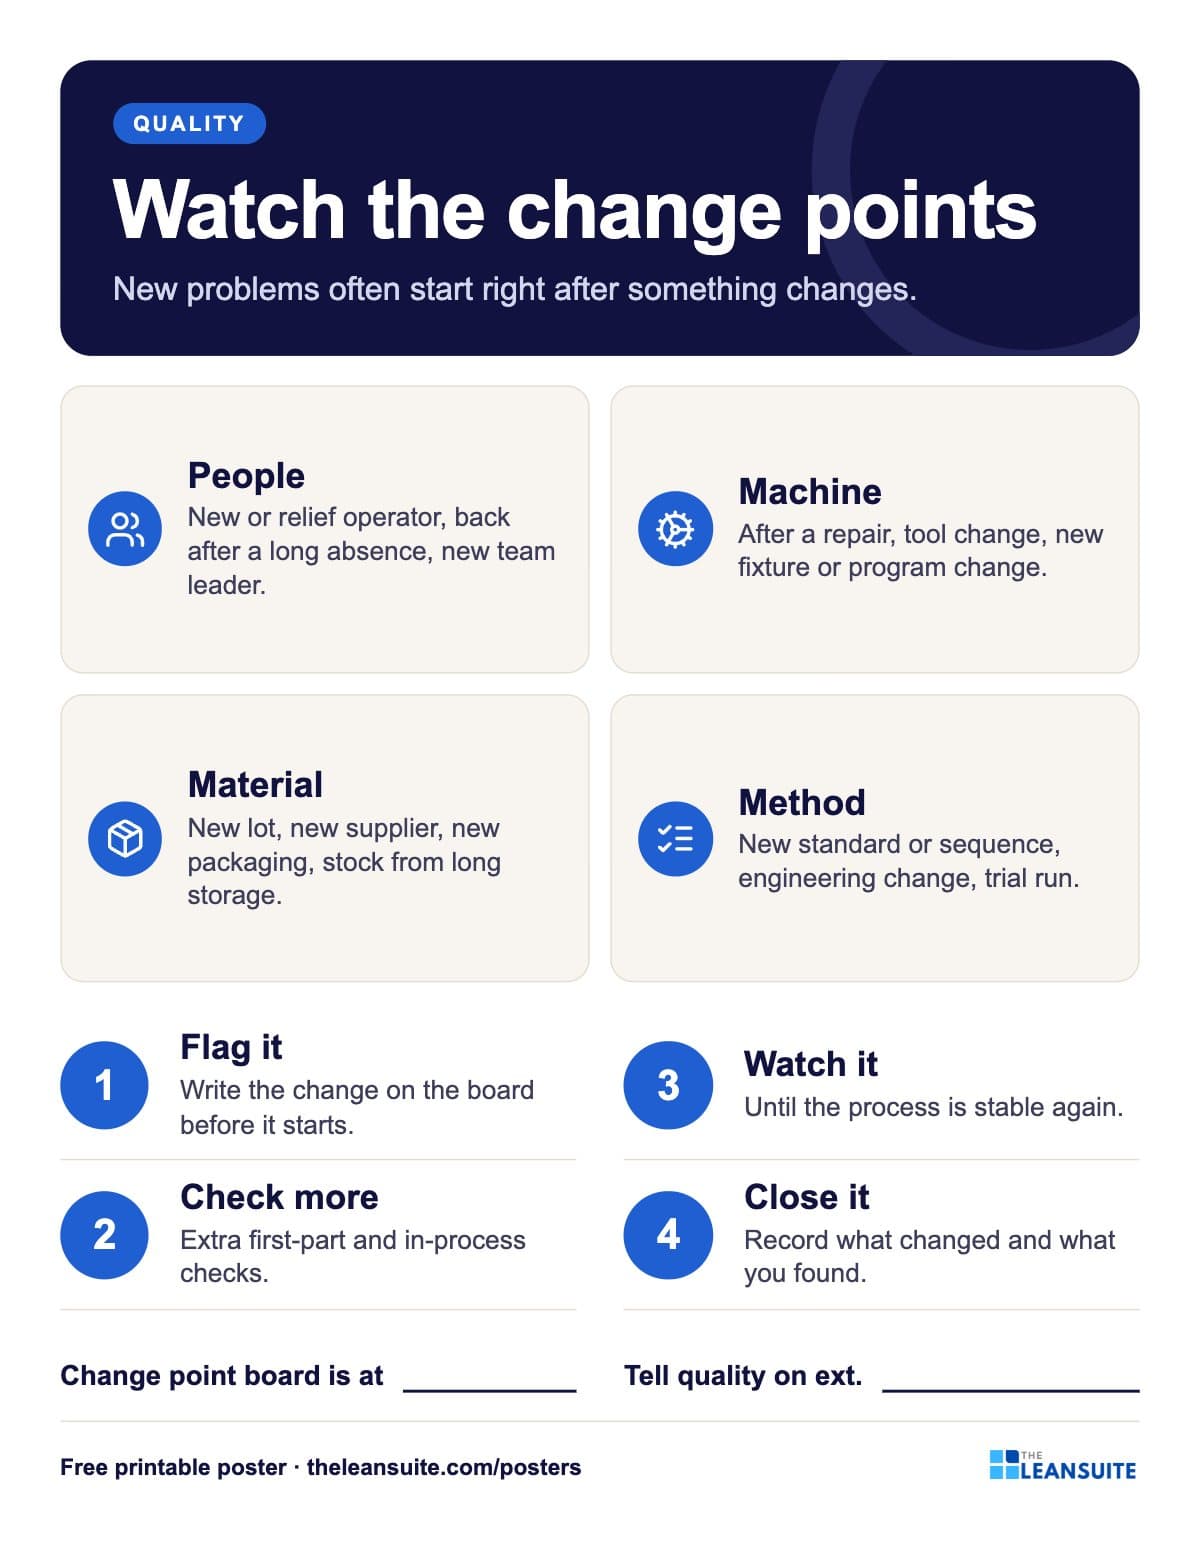 4M change points poster
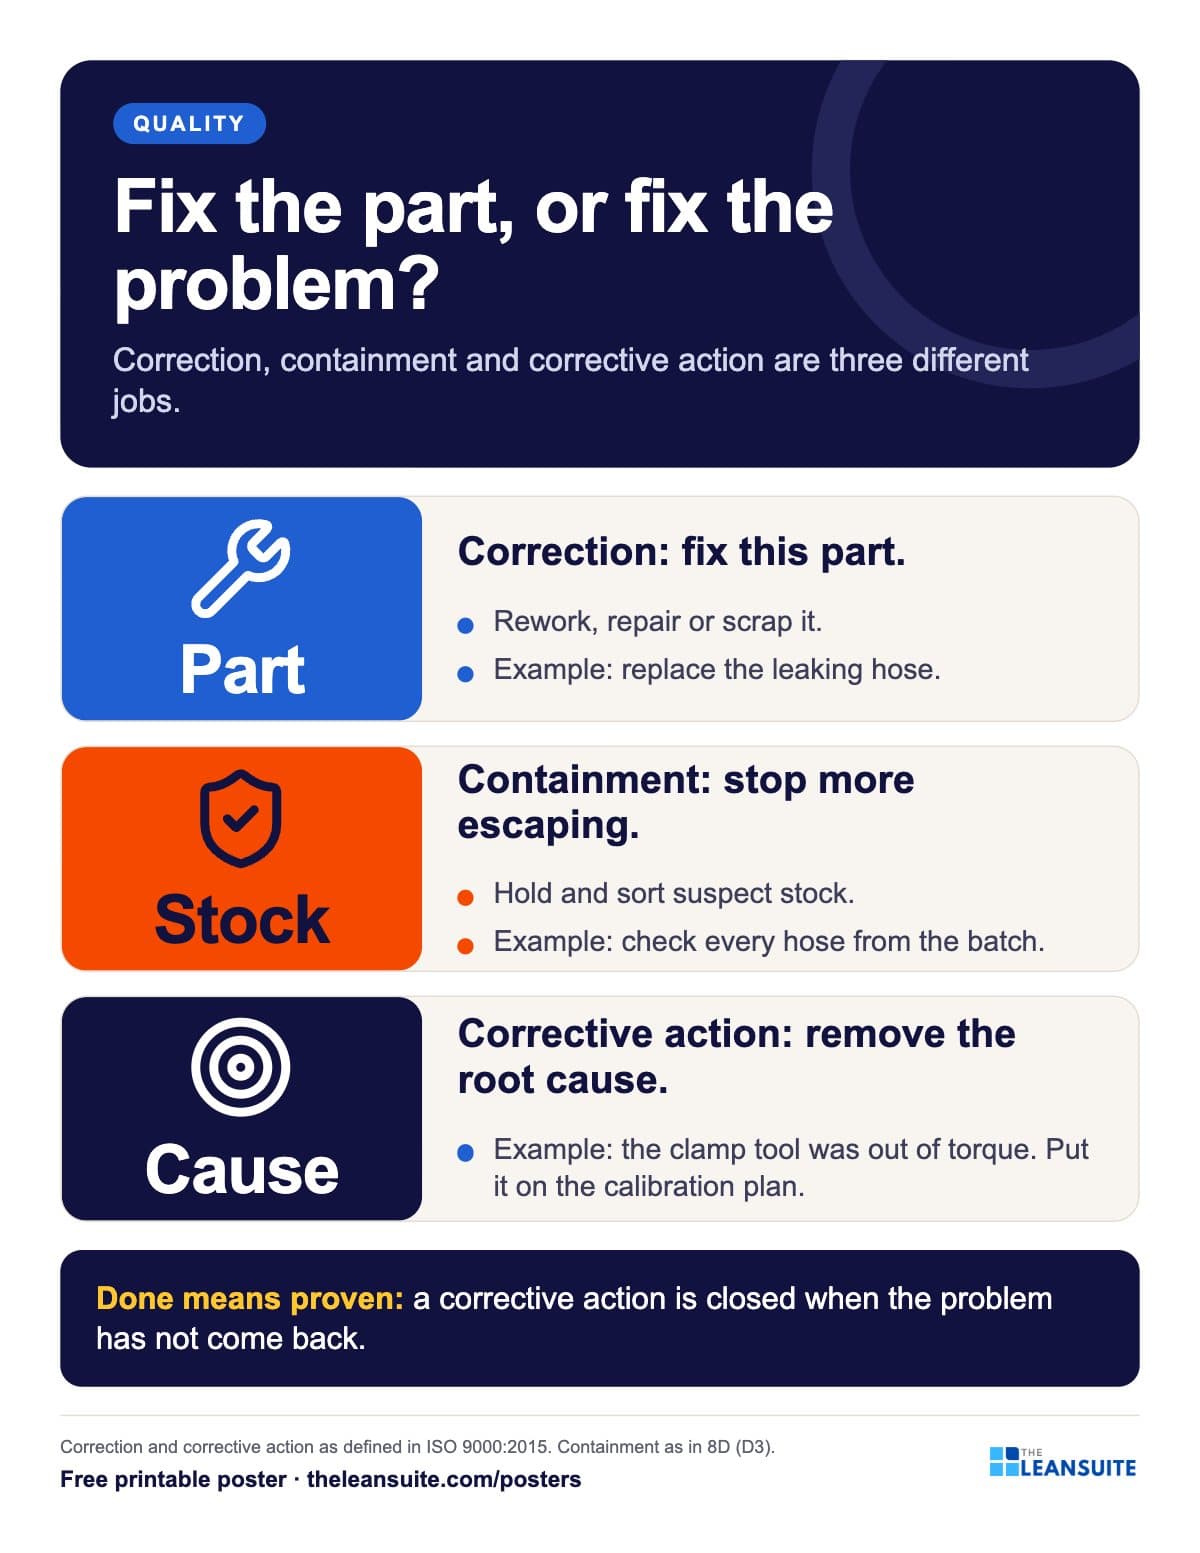 Correction vs corrective action poster
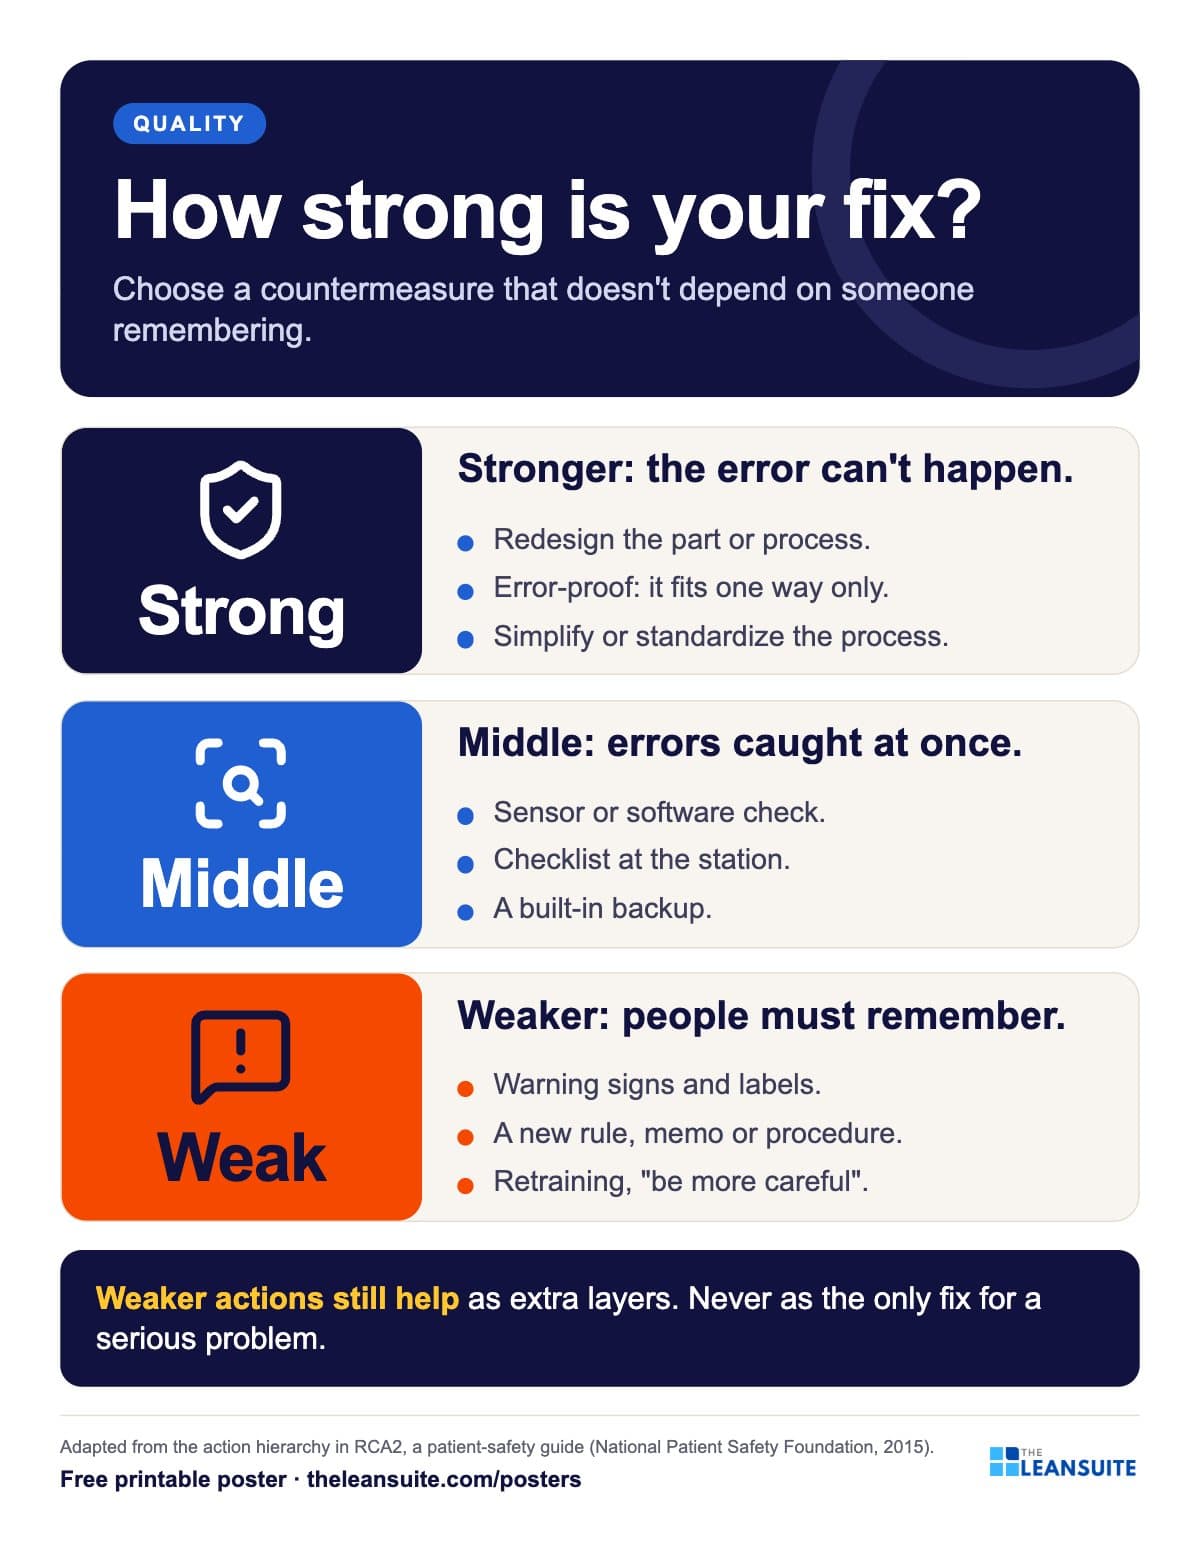 Strong and weak countermeasures poster
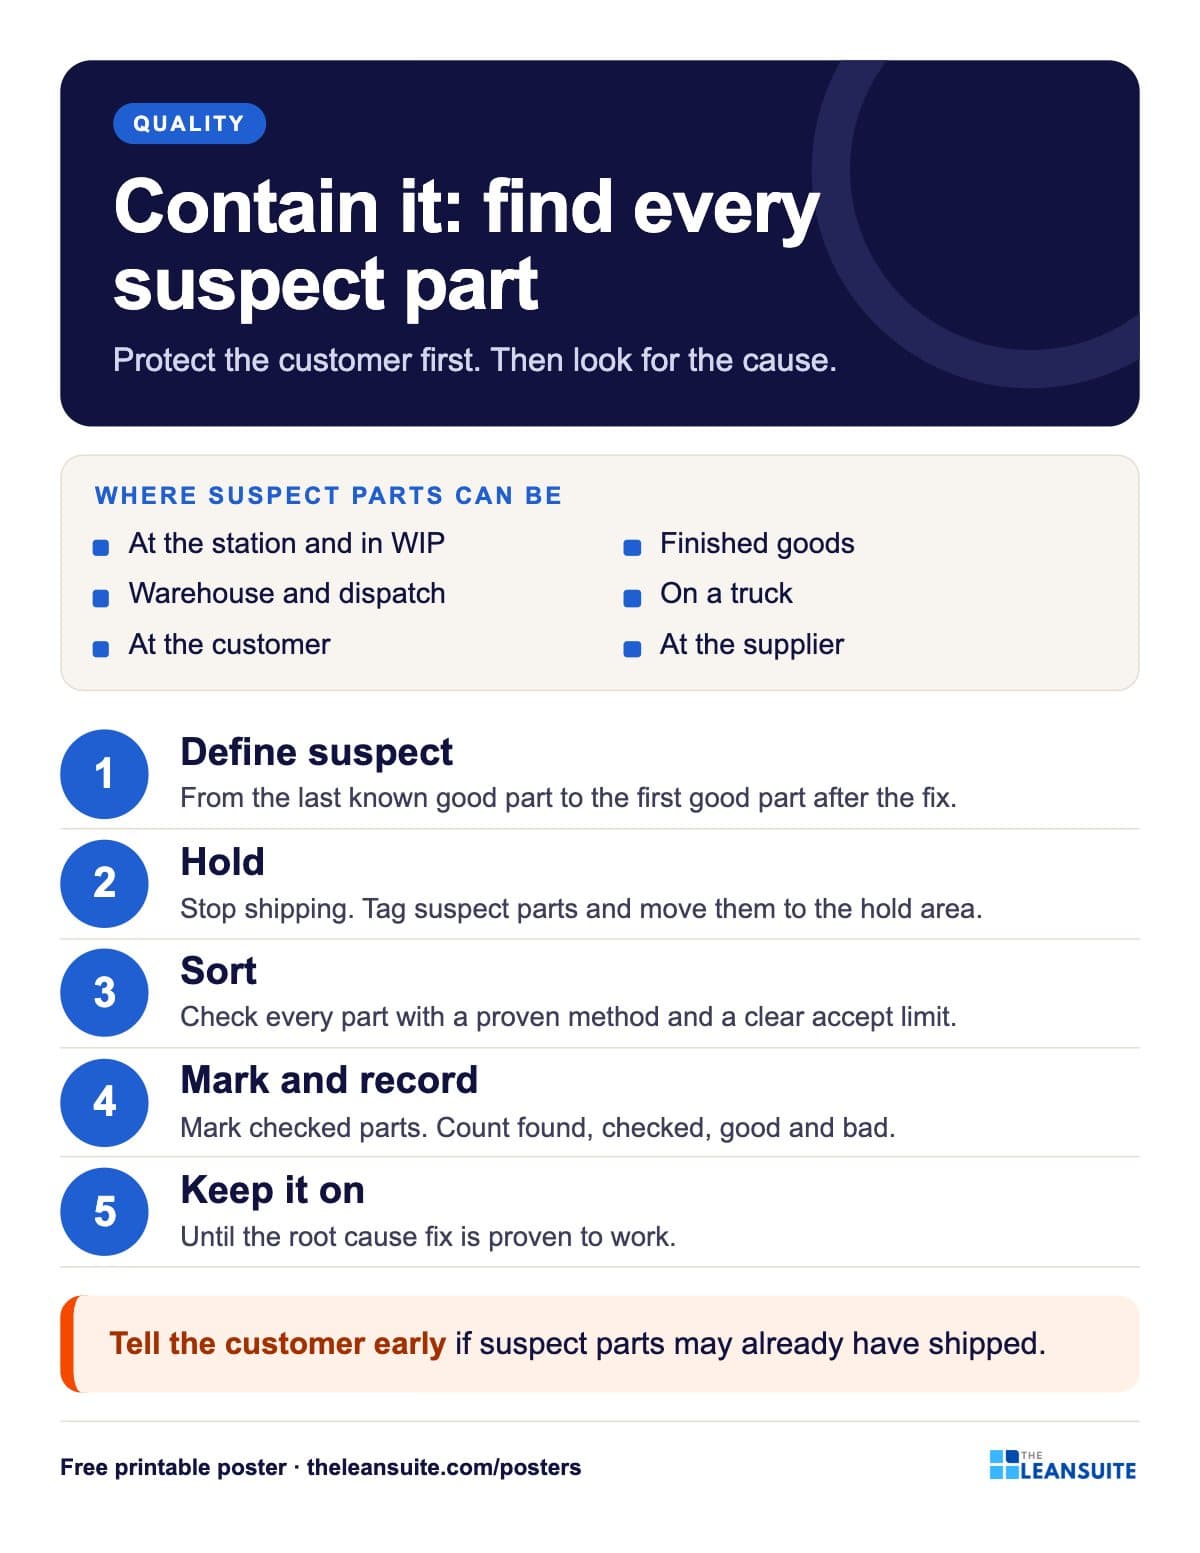 Containment actions poster
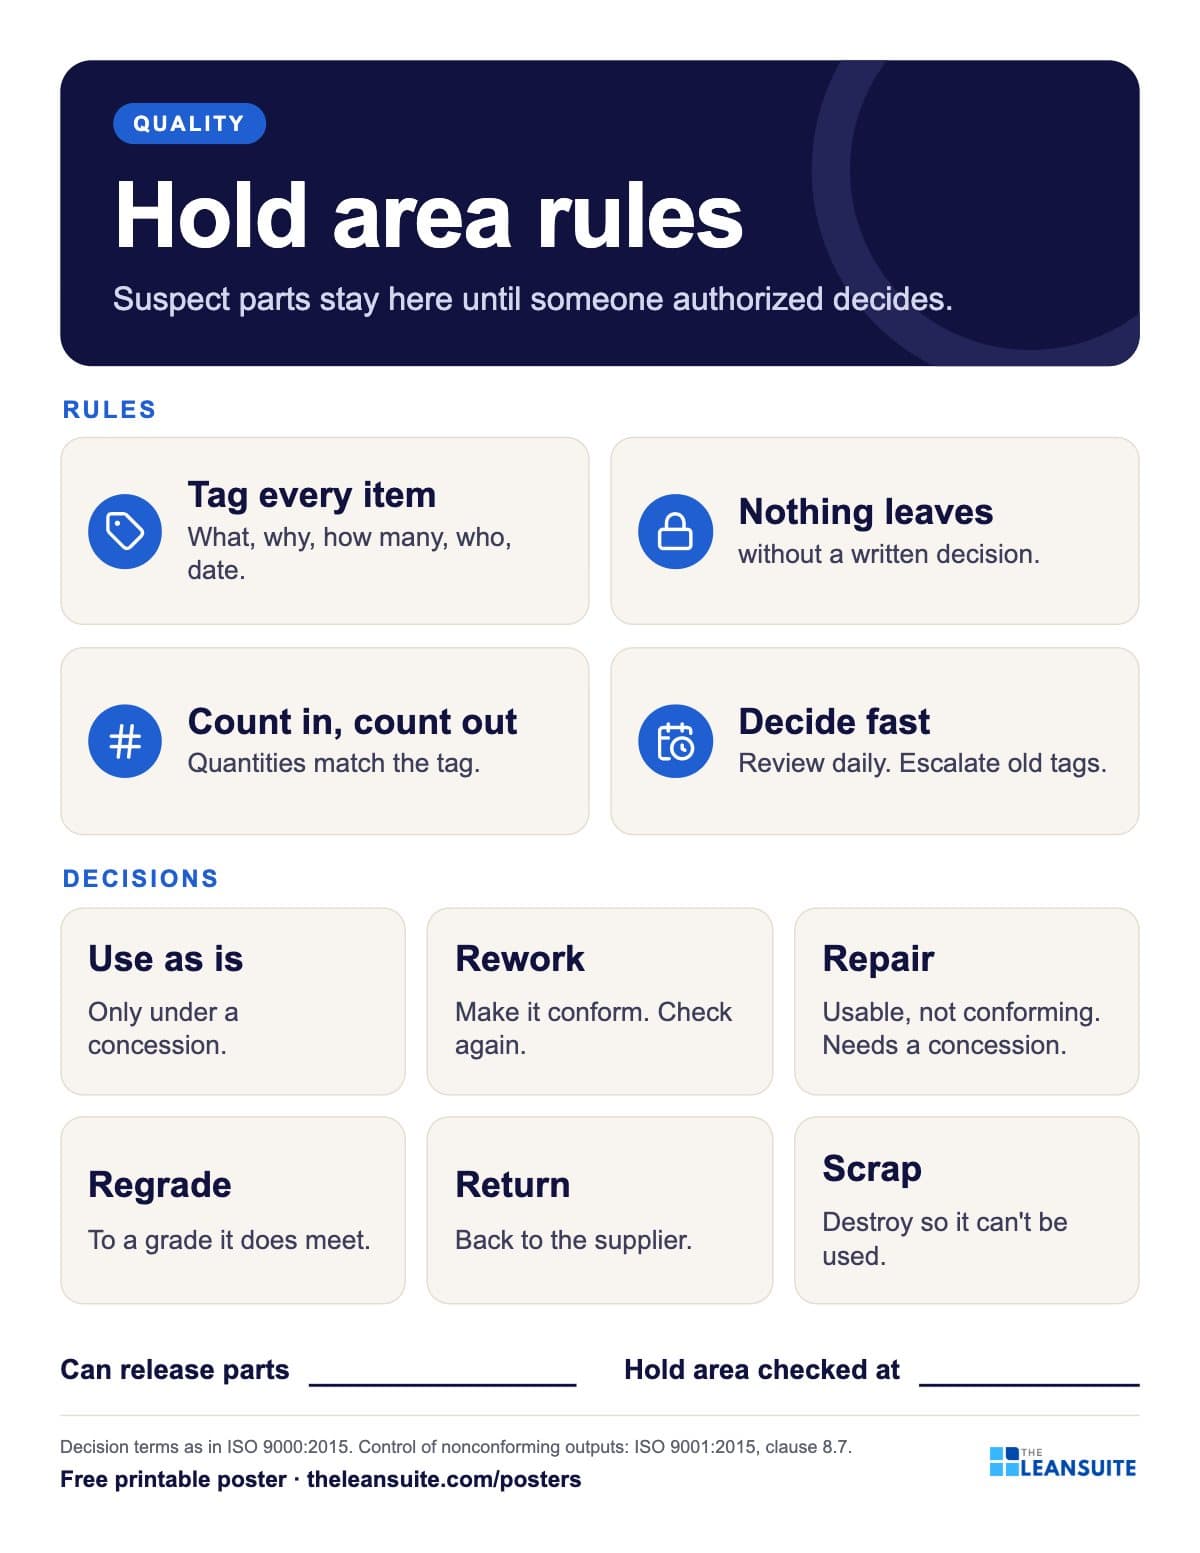 Hold area (quarantine) rules poster
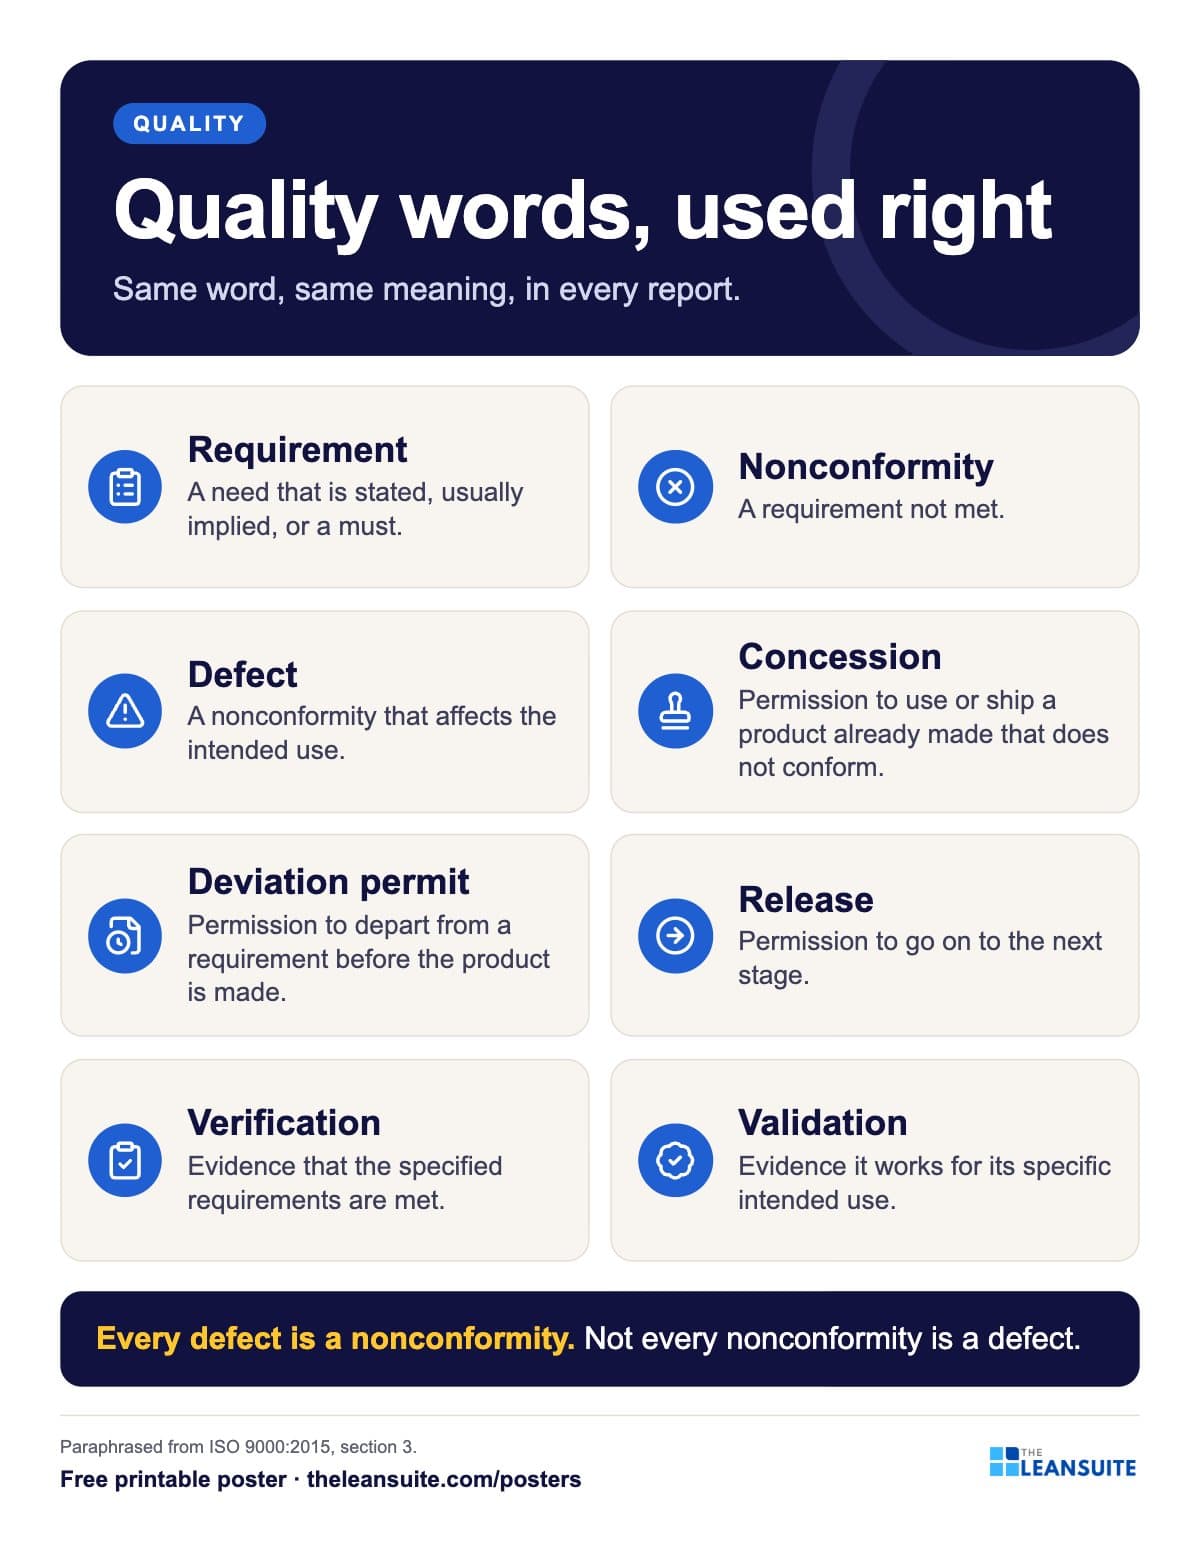 Quality terms poster (nonconformity, defect, concession)
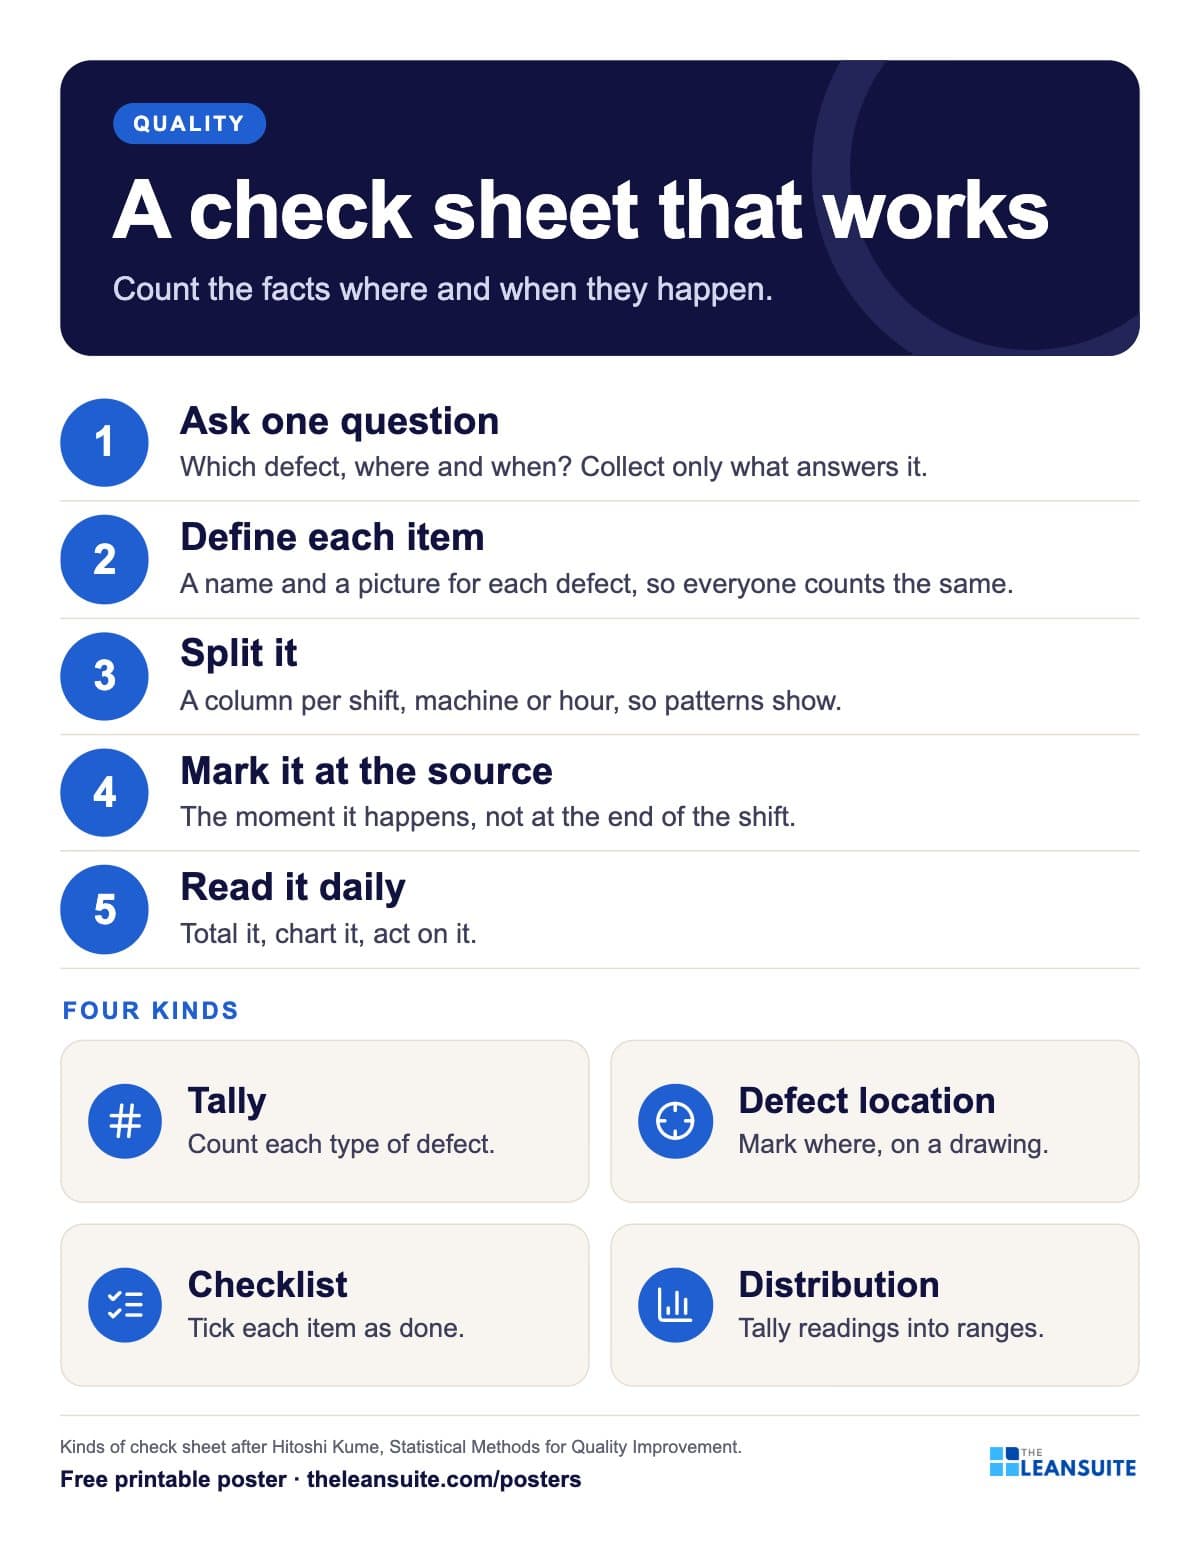 Check sheet poster
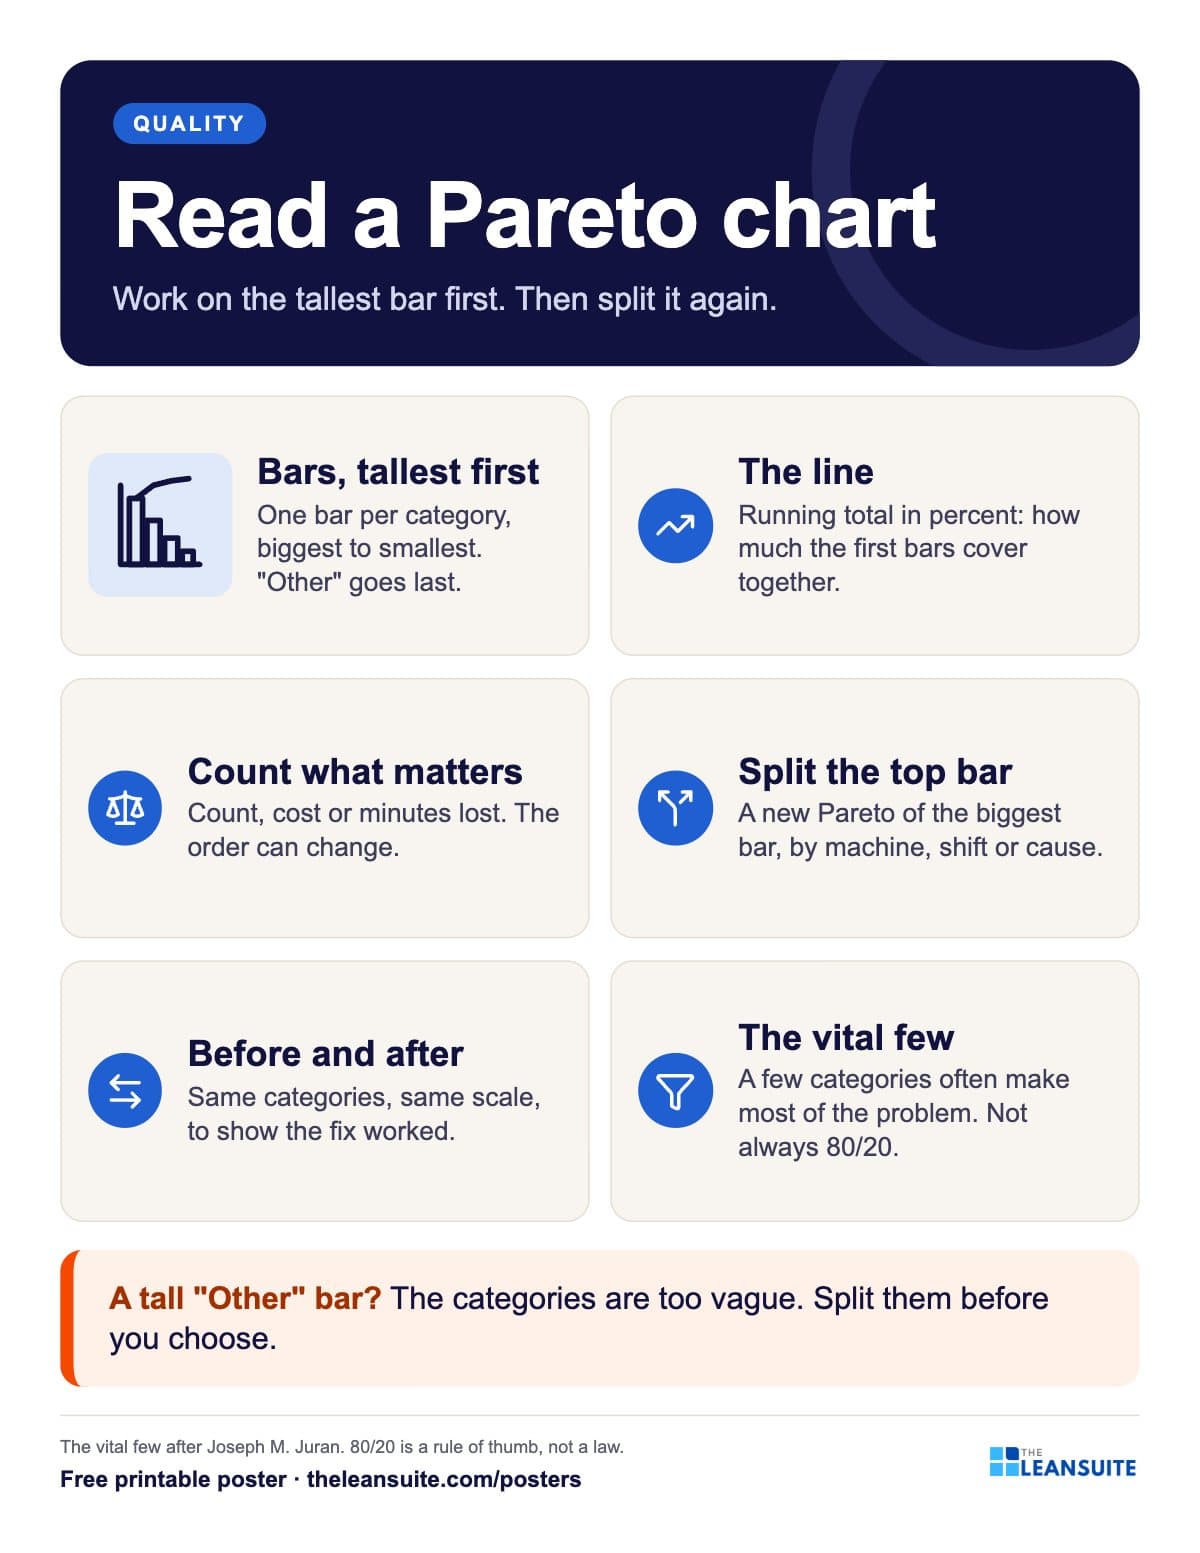 How to read a Pareto chart poster
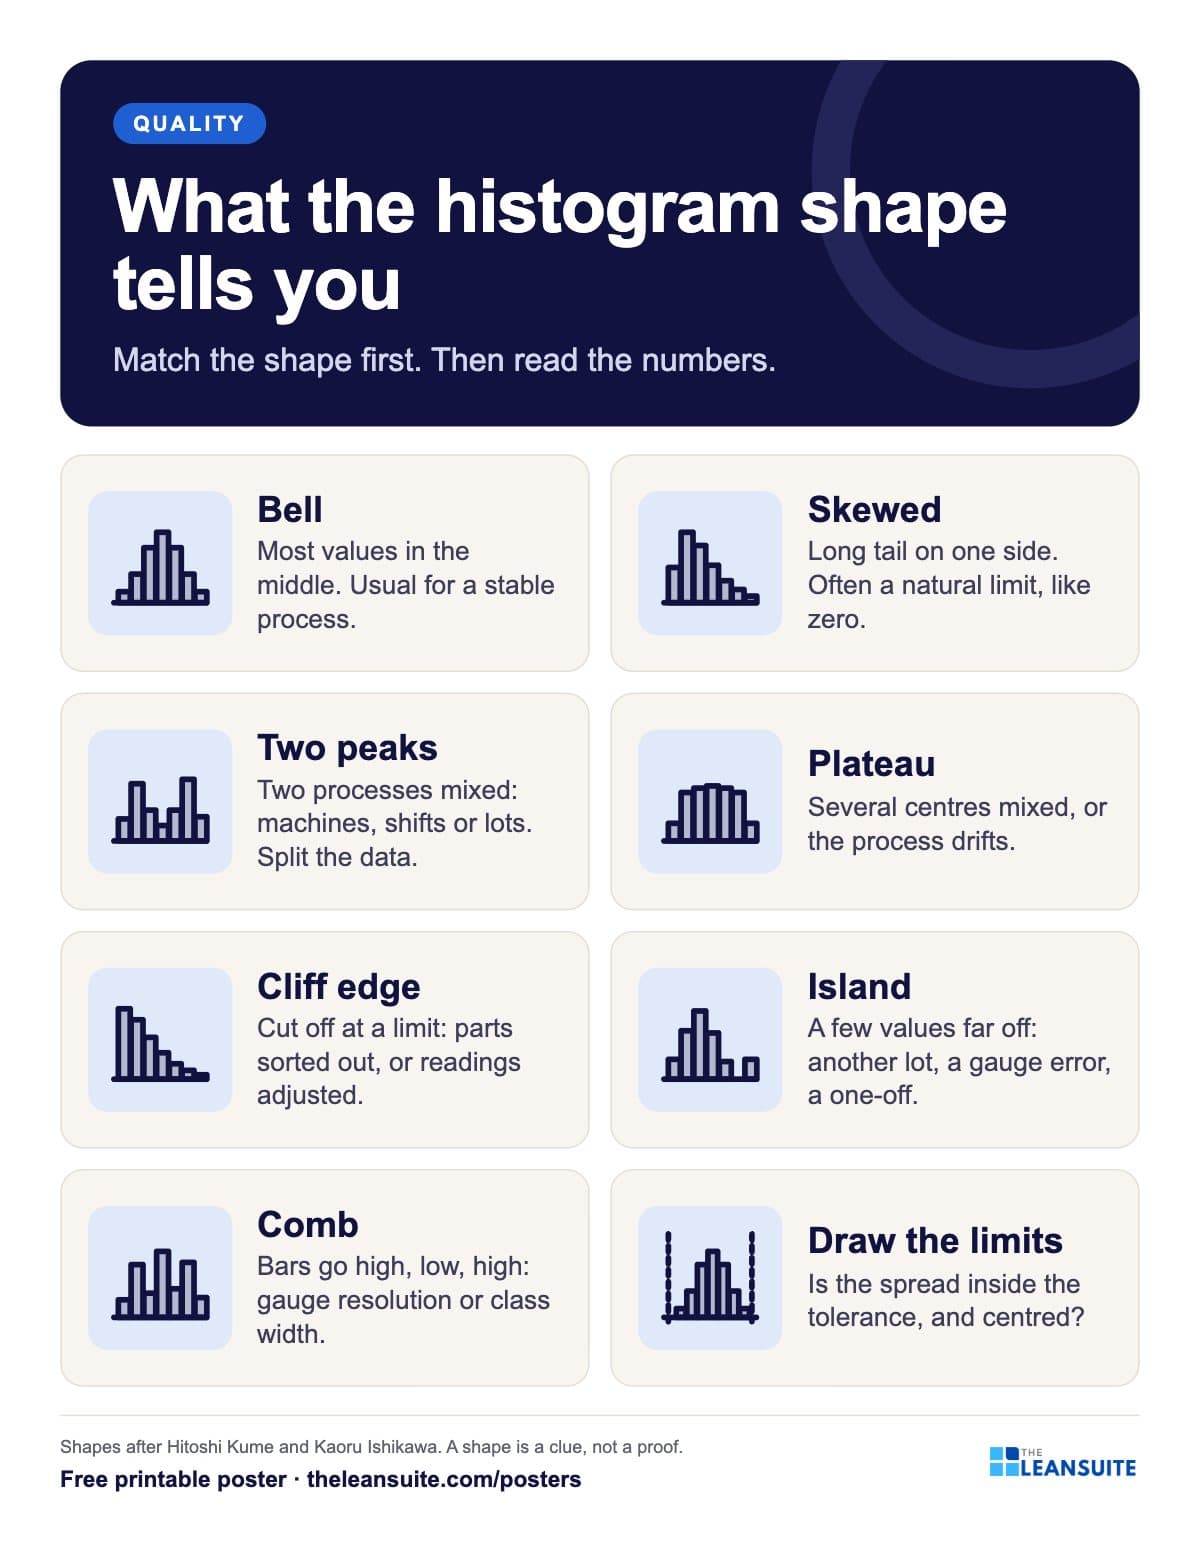 Histogram shapes poster
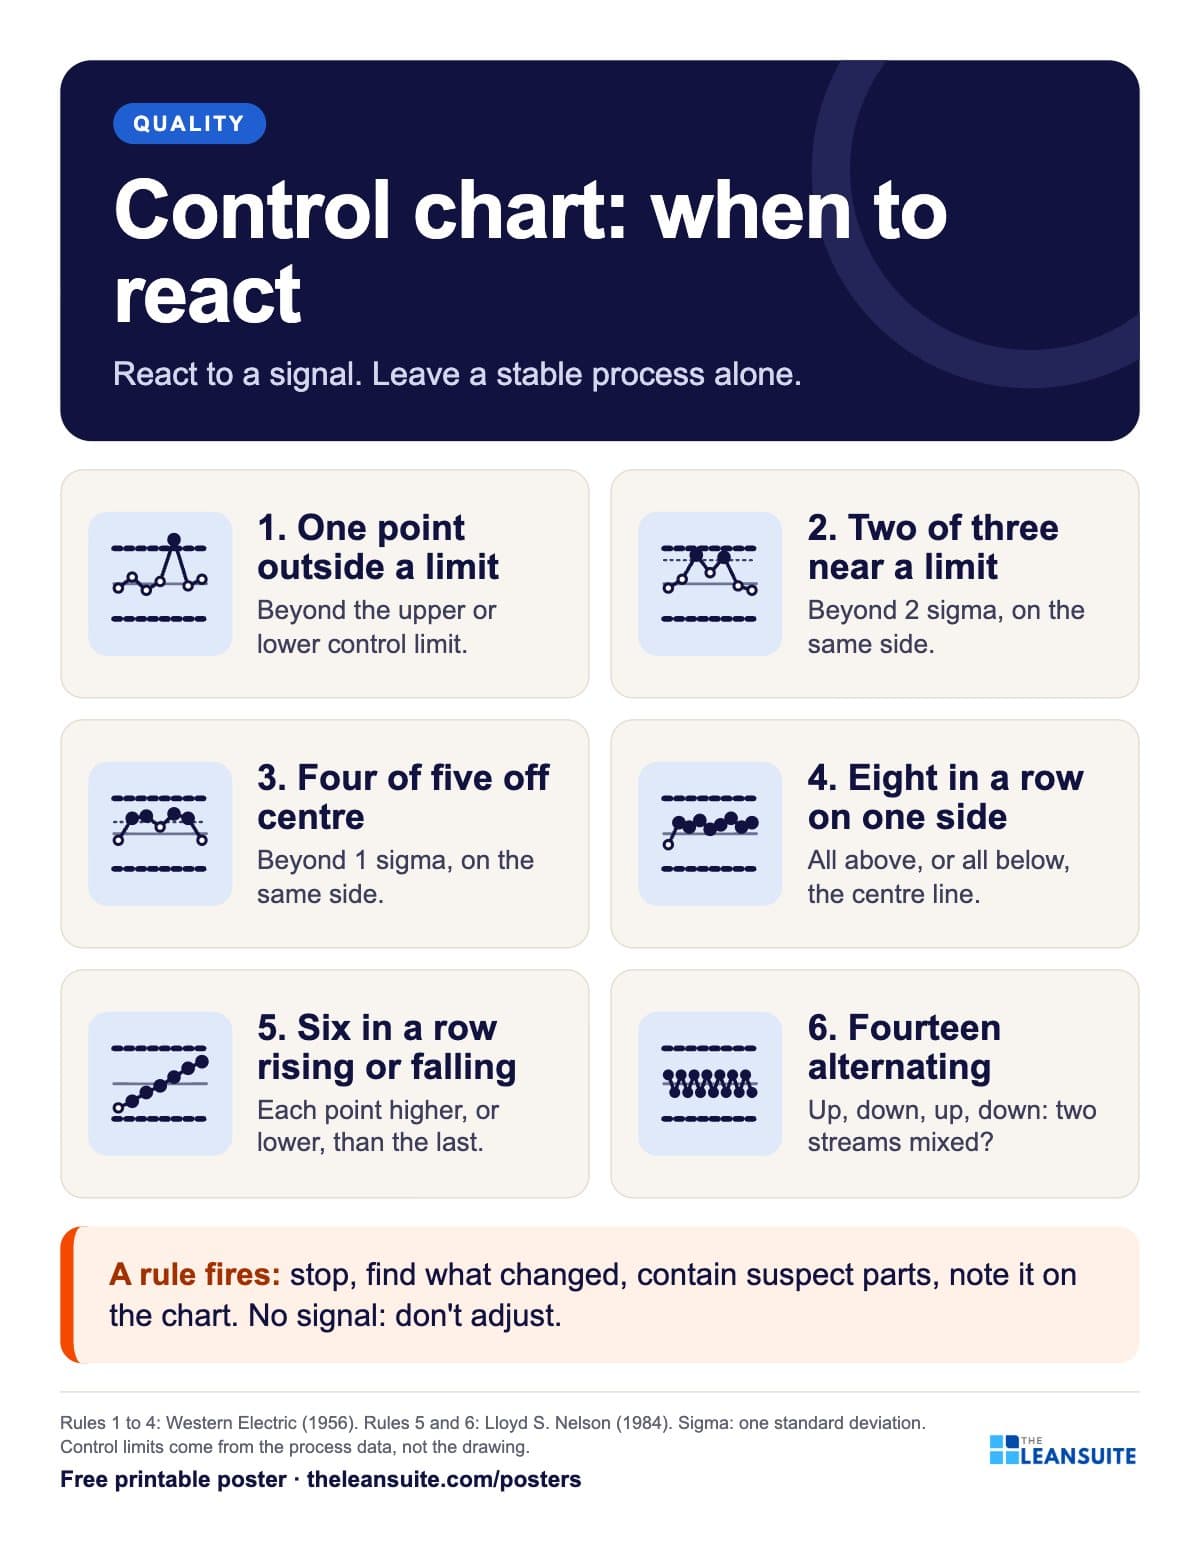 Control chart rules poster (when to react)
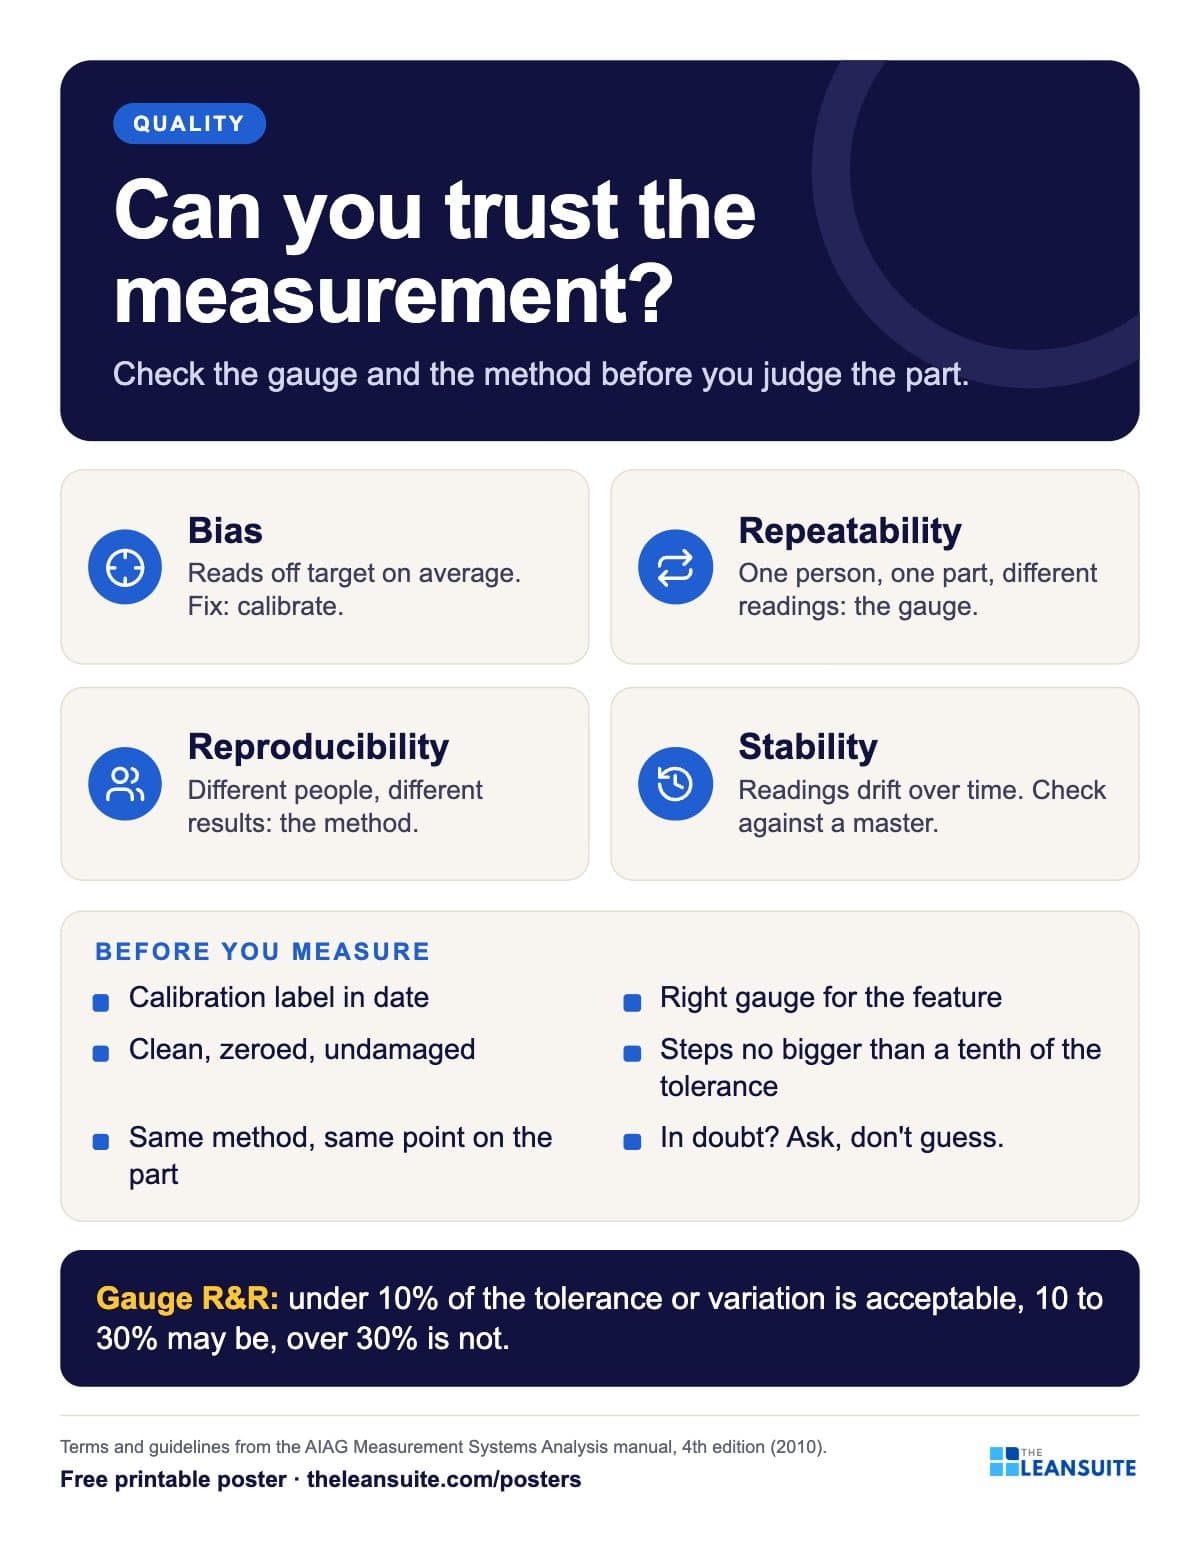 Measurement system basics poster
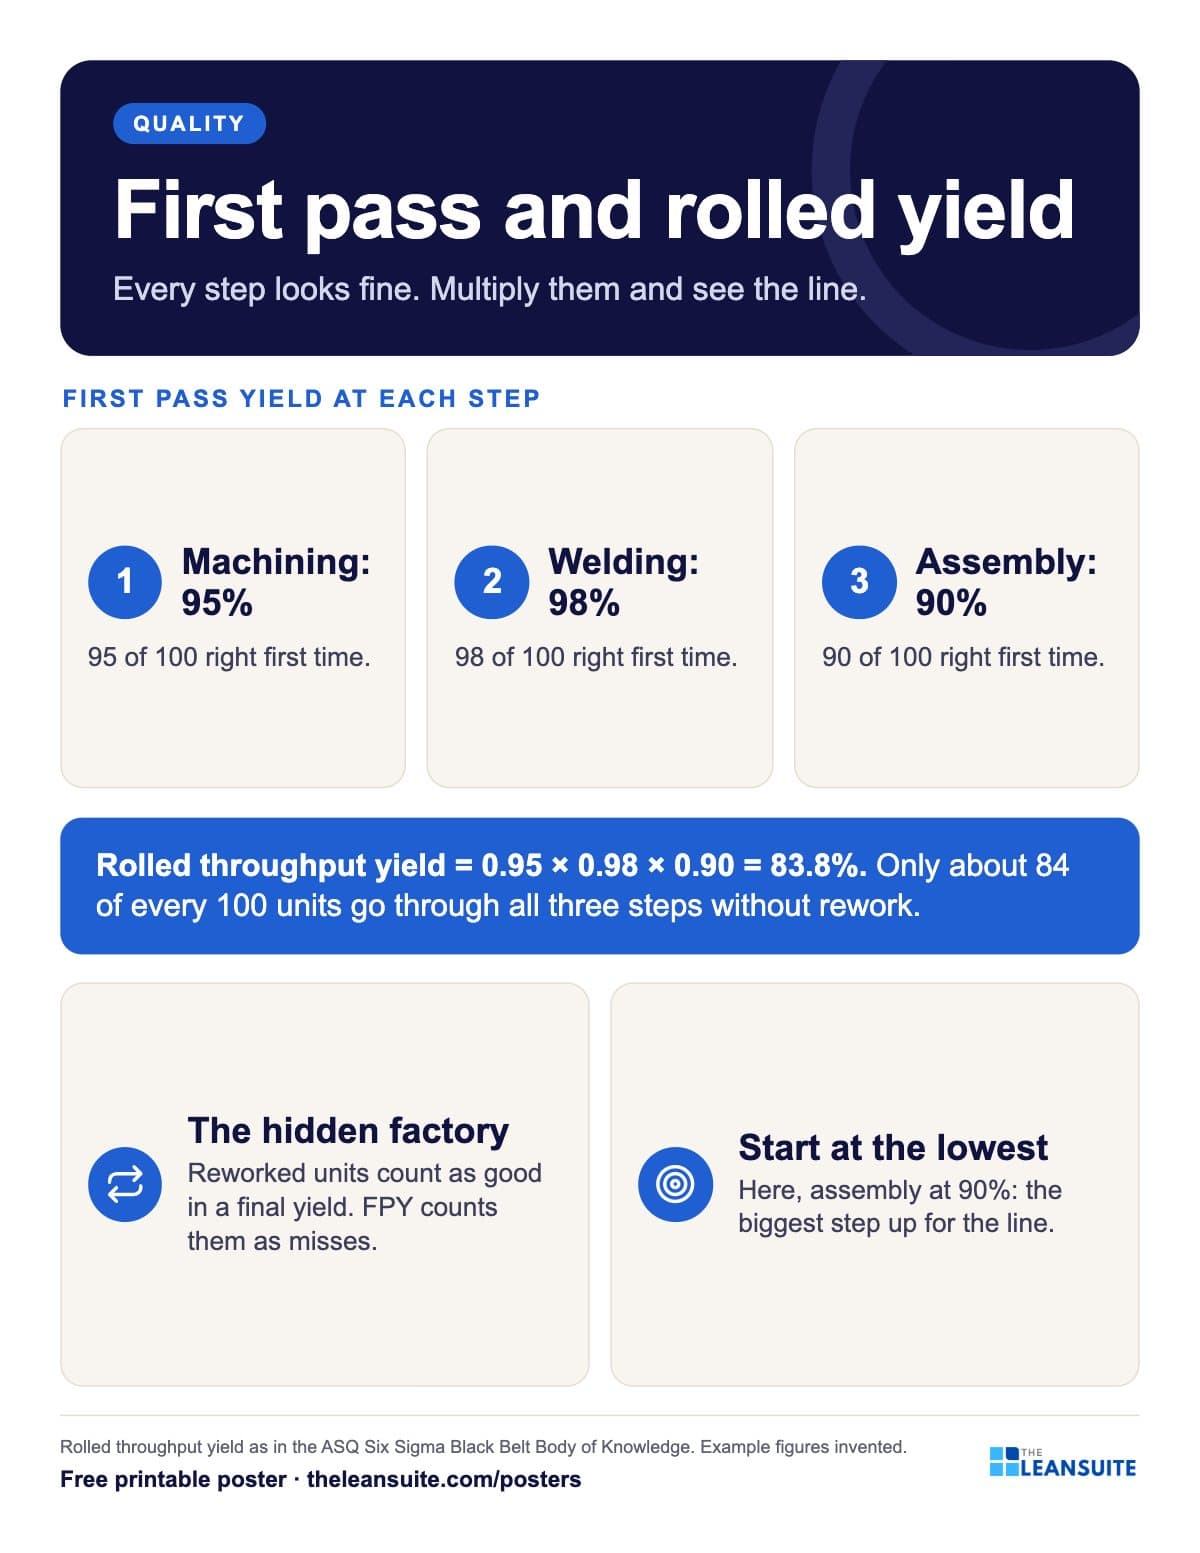 First pass yield and rolled throughput yield poster
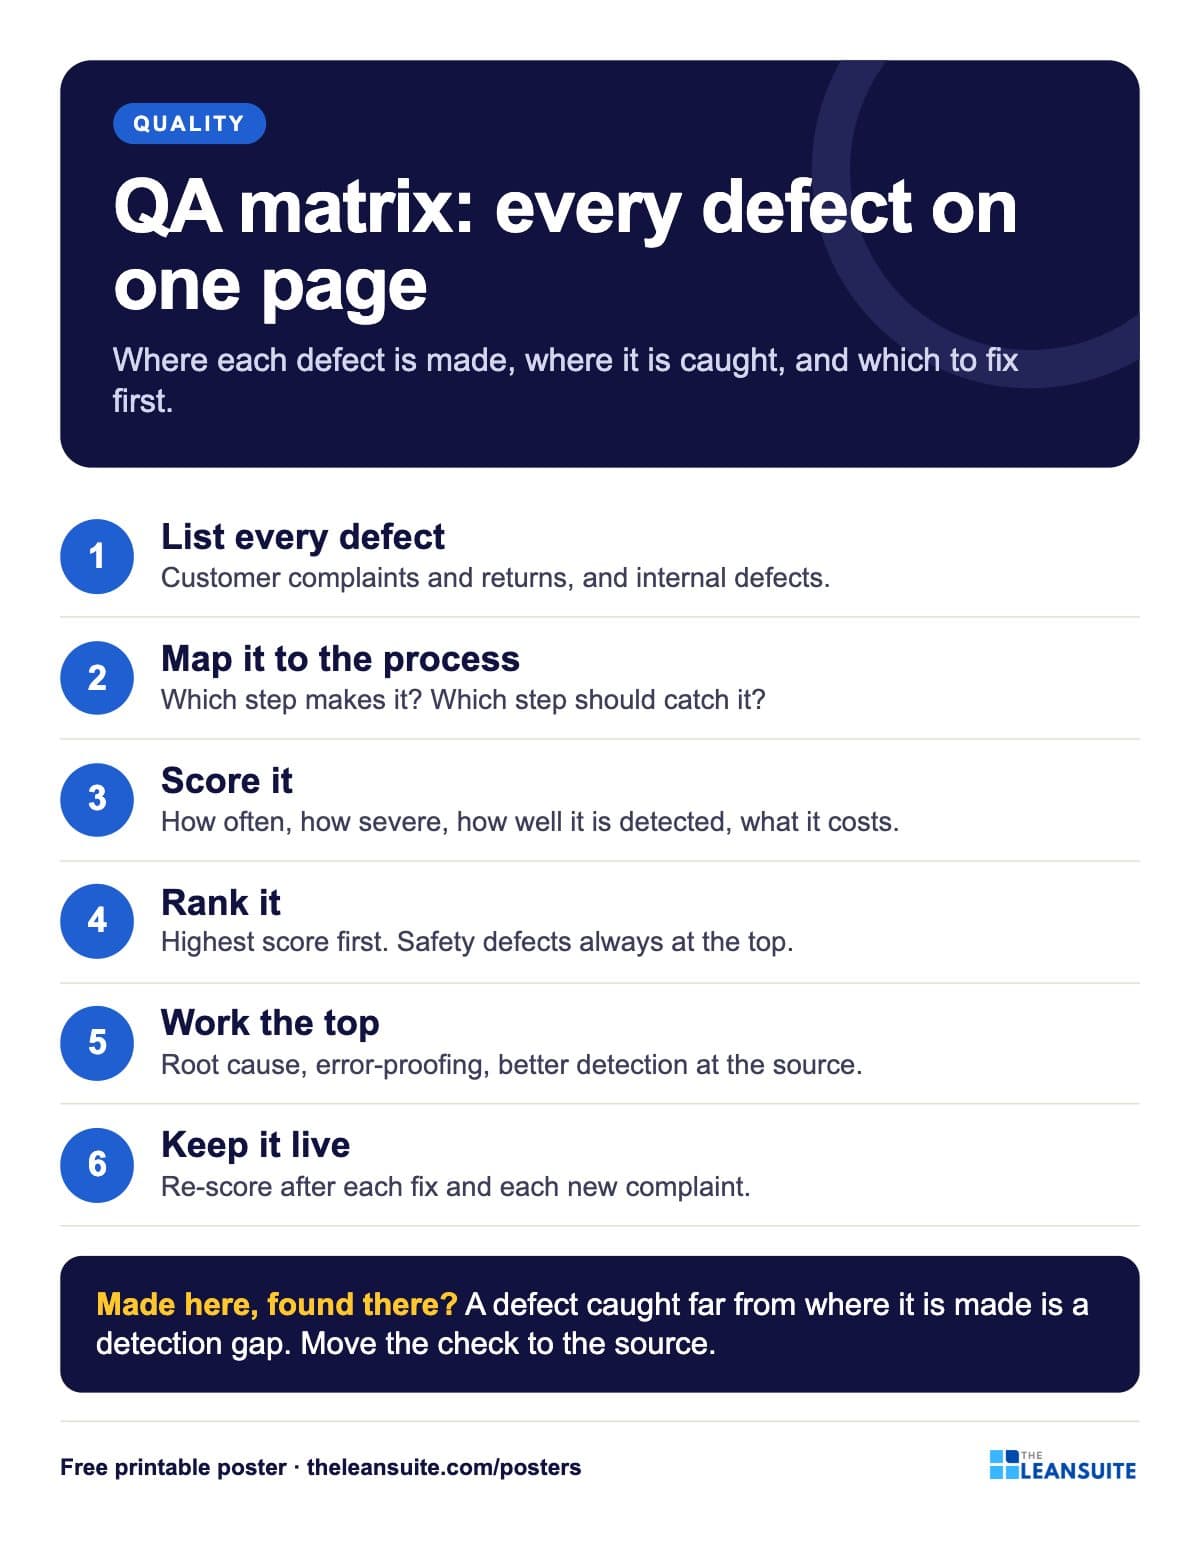 QA matrix poster
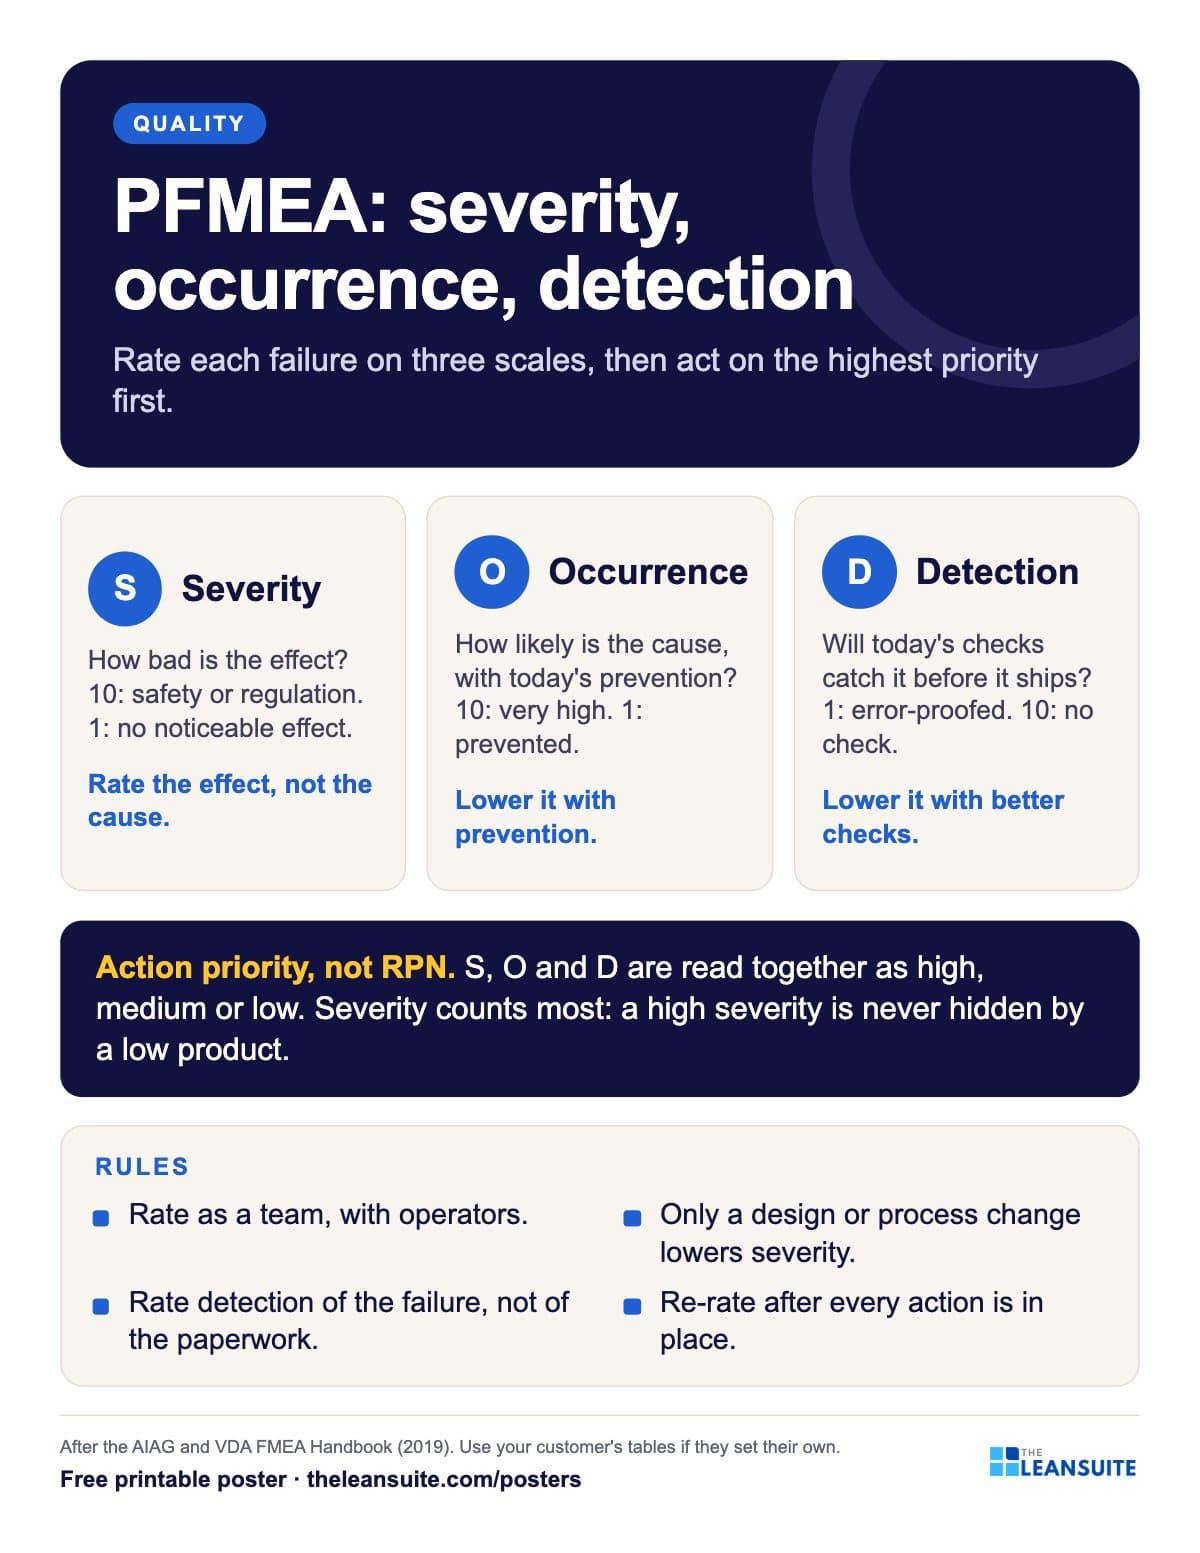 PFMEA severity, occurrence and detection poster
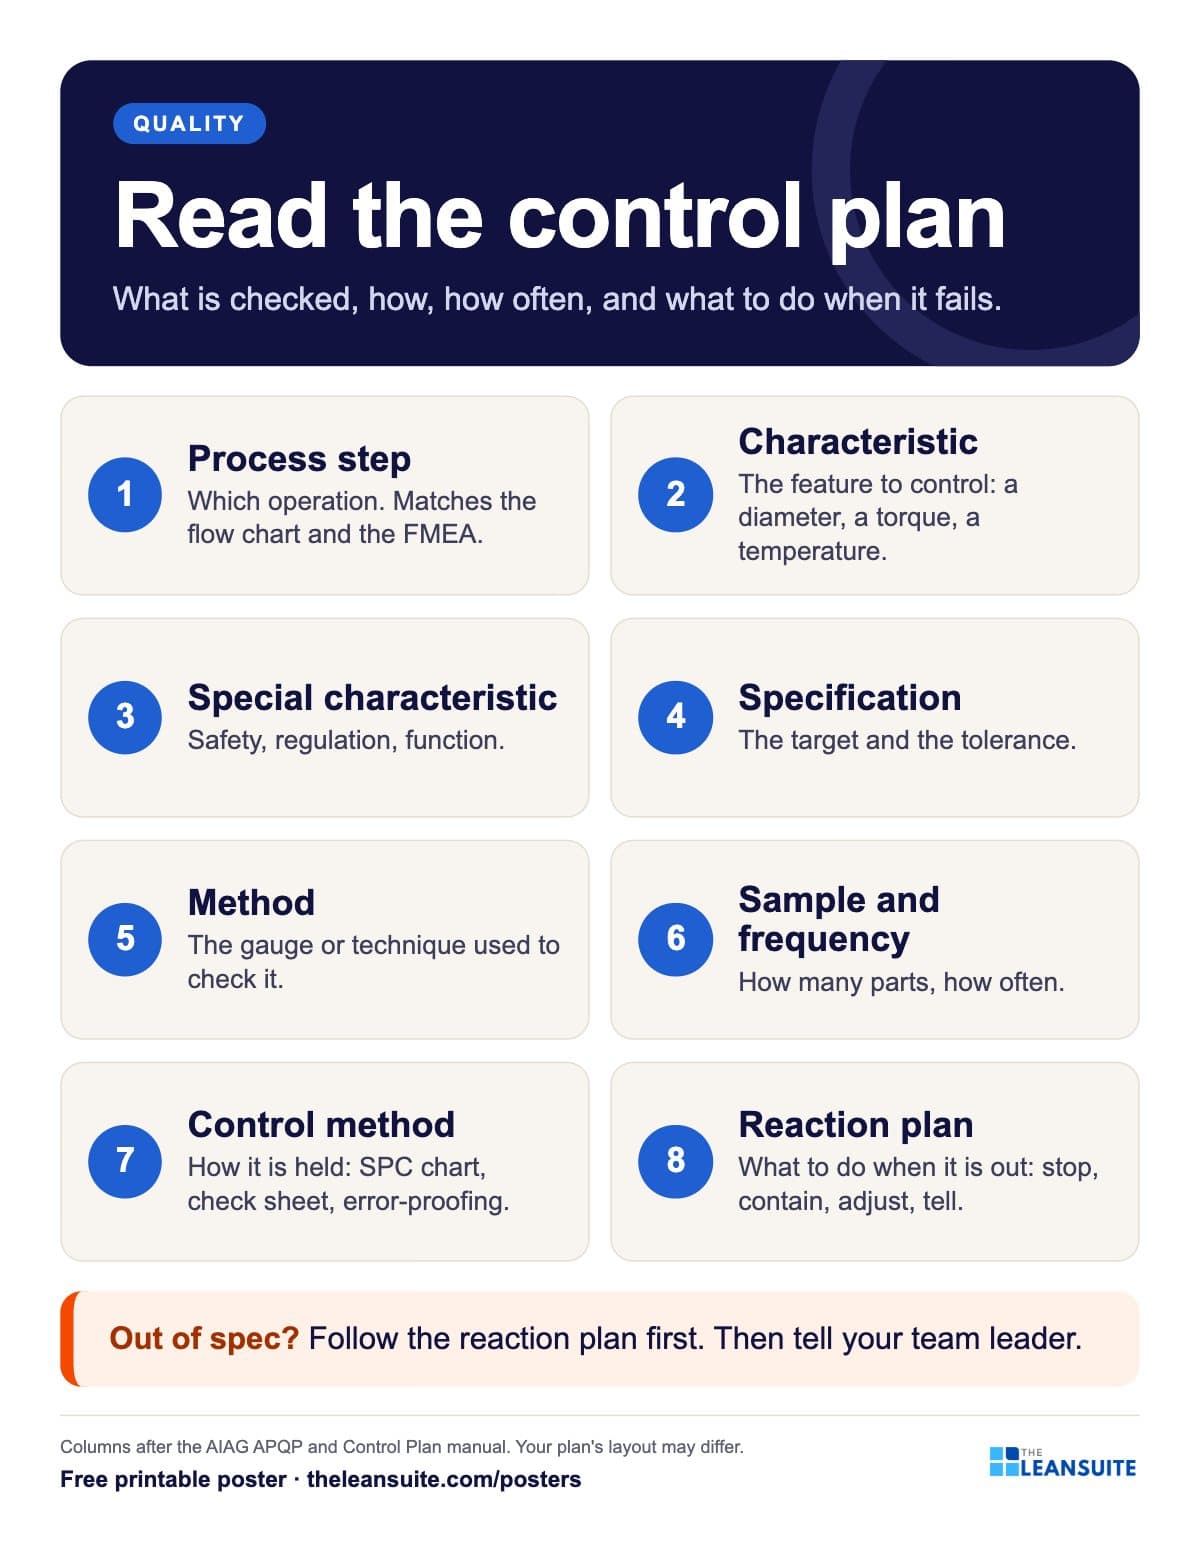 How to read a control plan poster
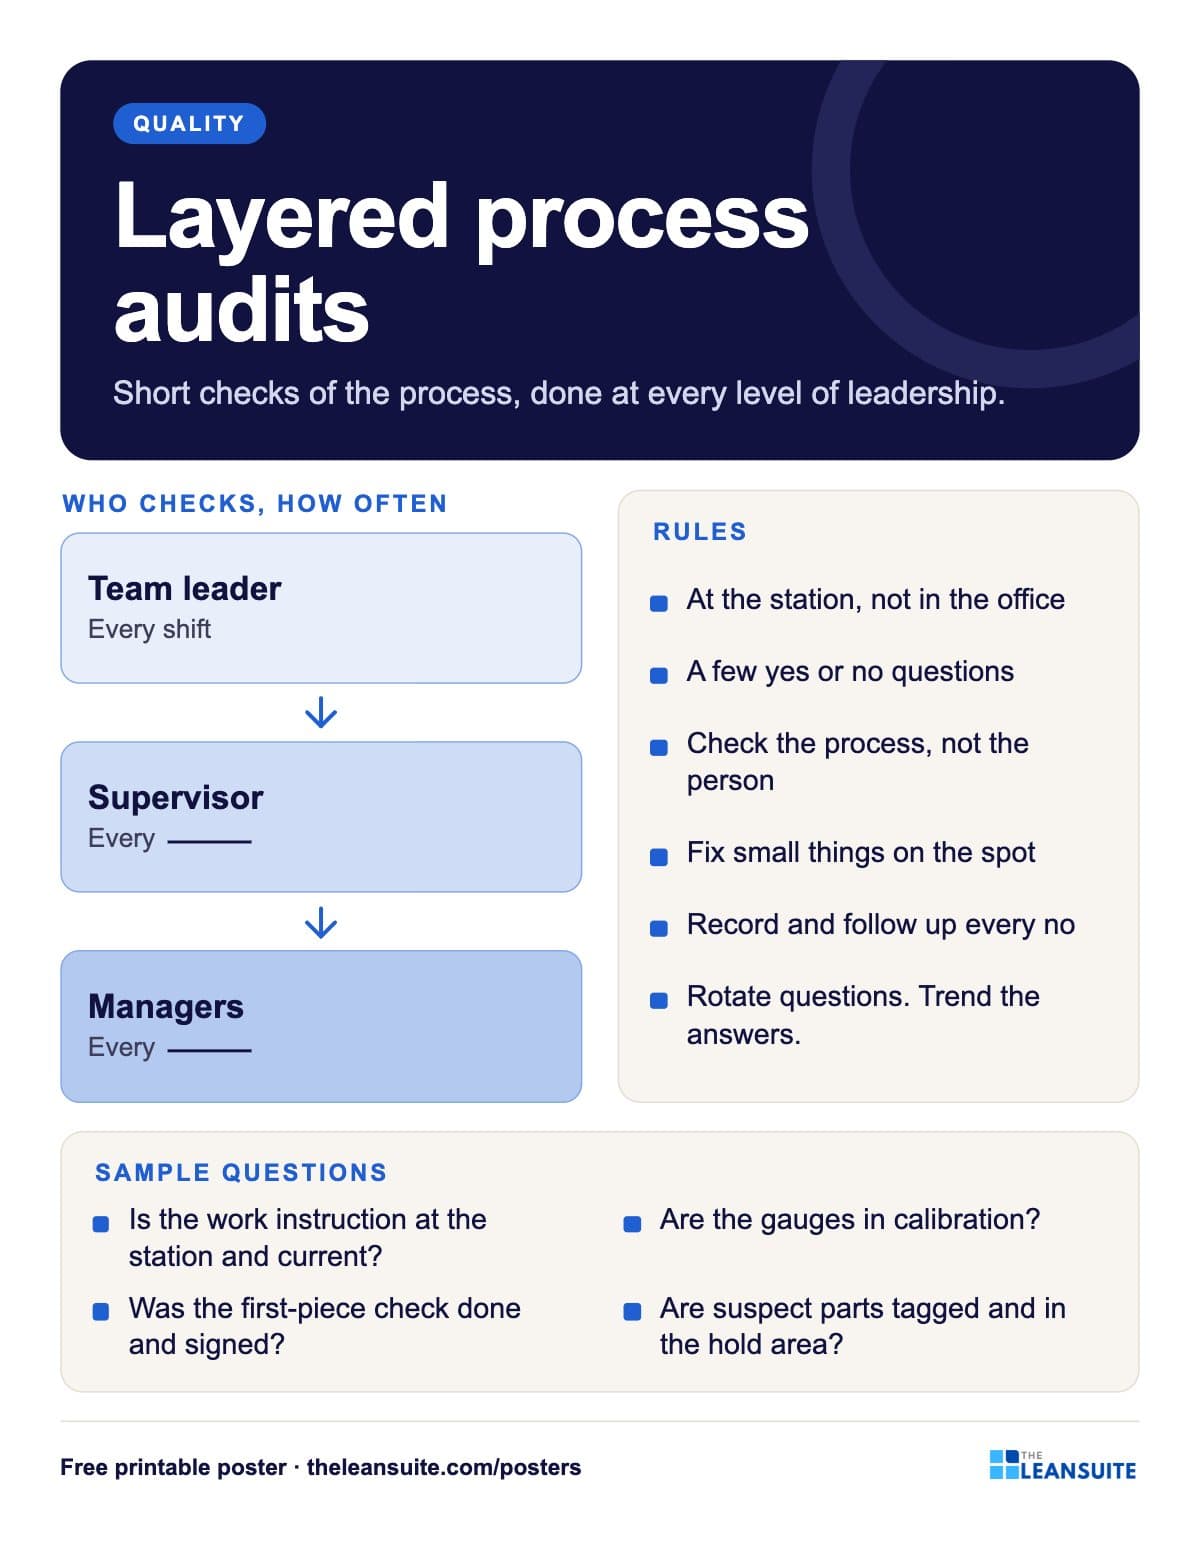 Layered process audit poster
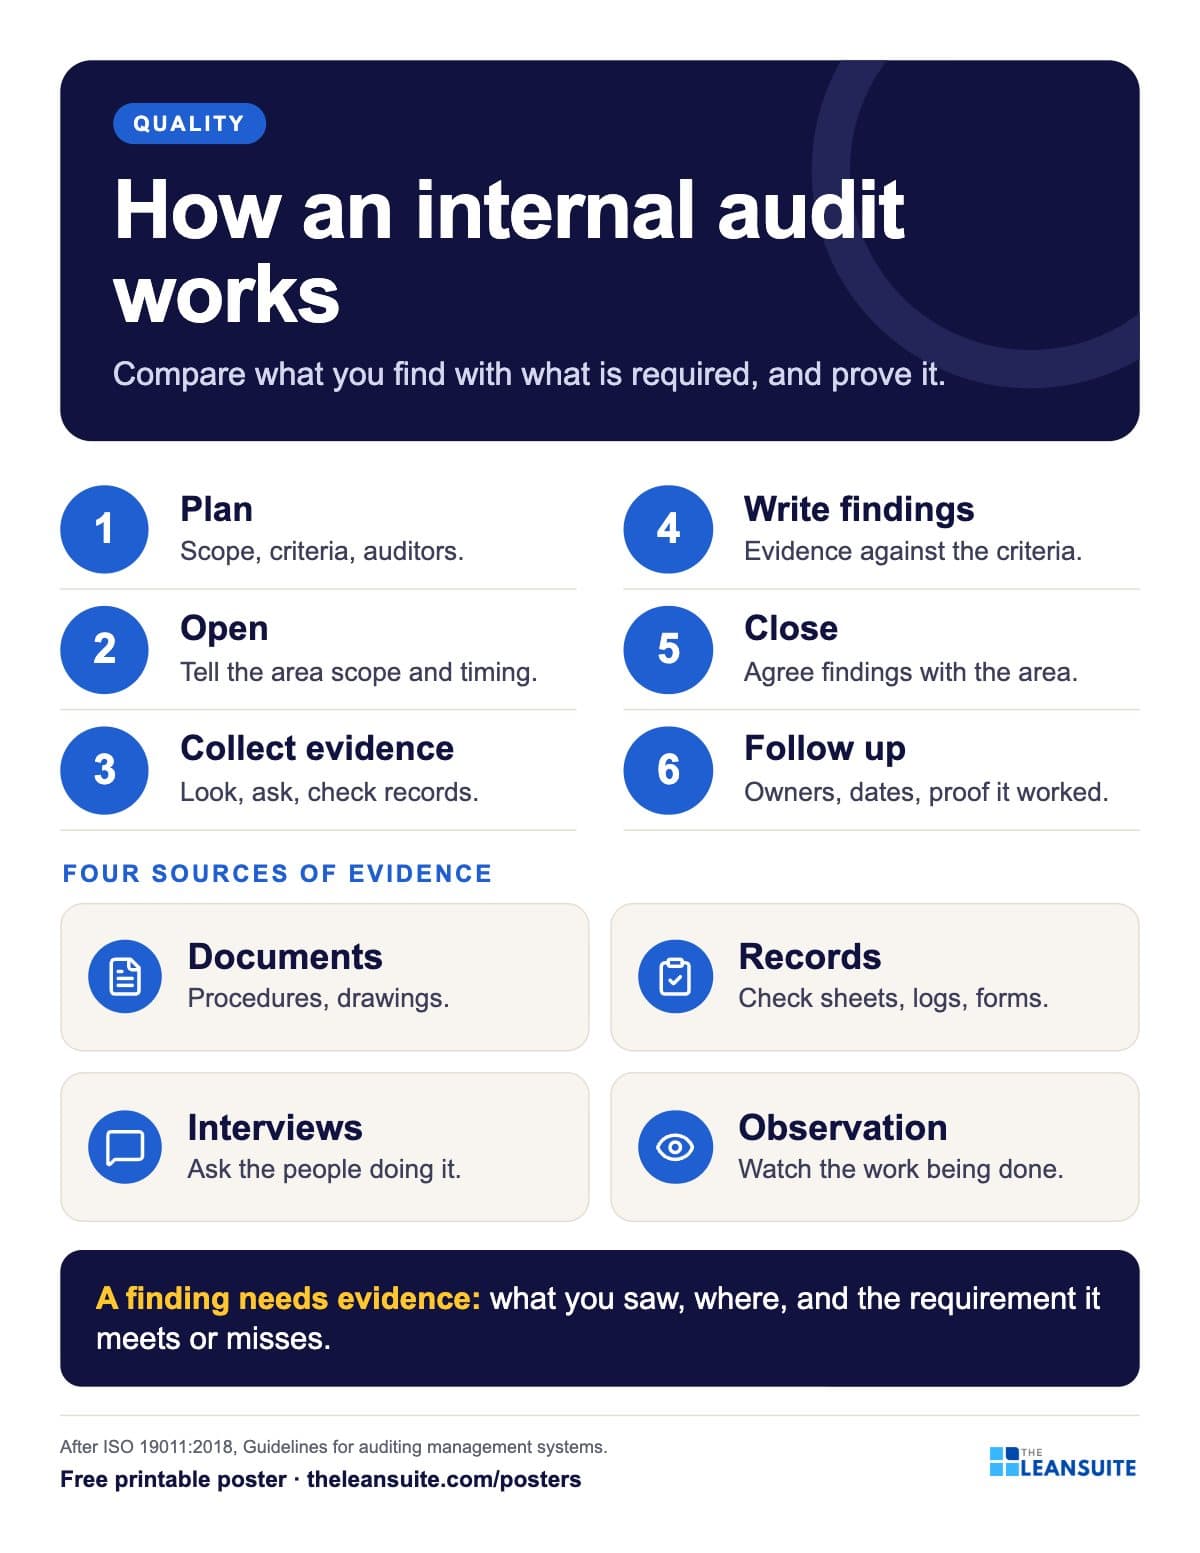 Internal audit steps poster
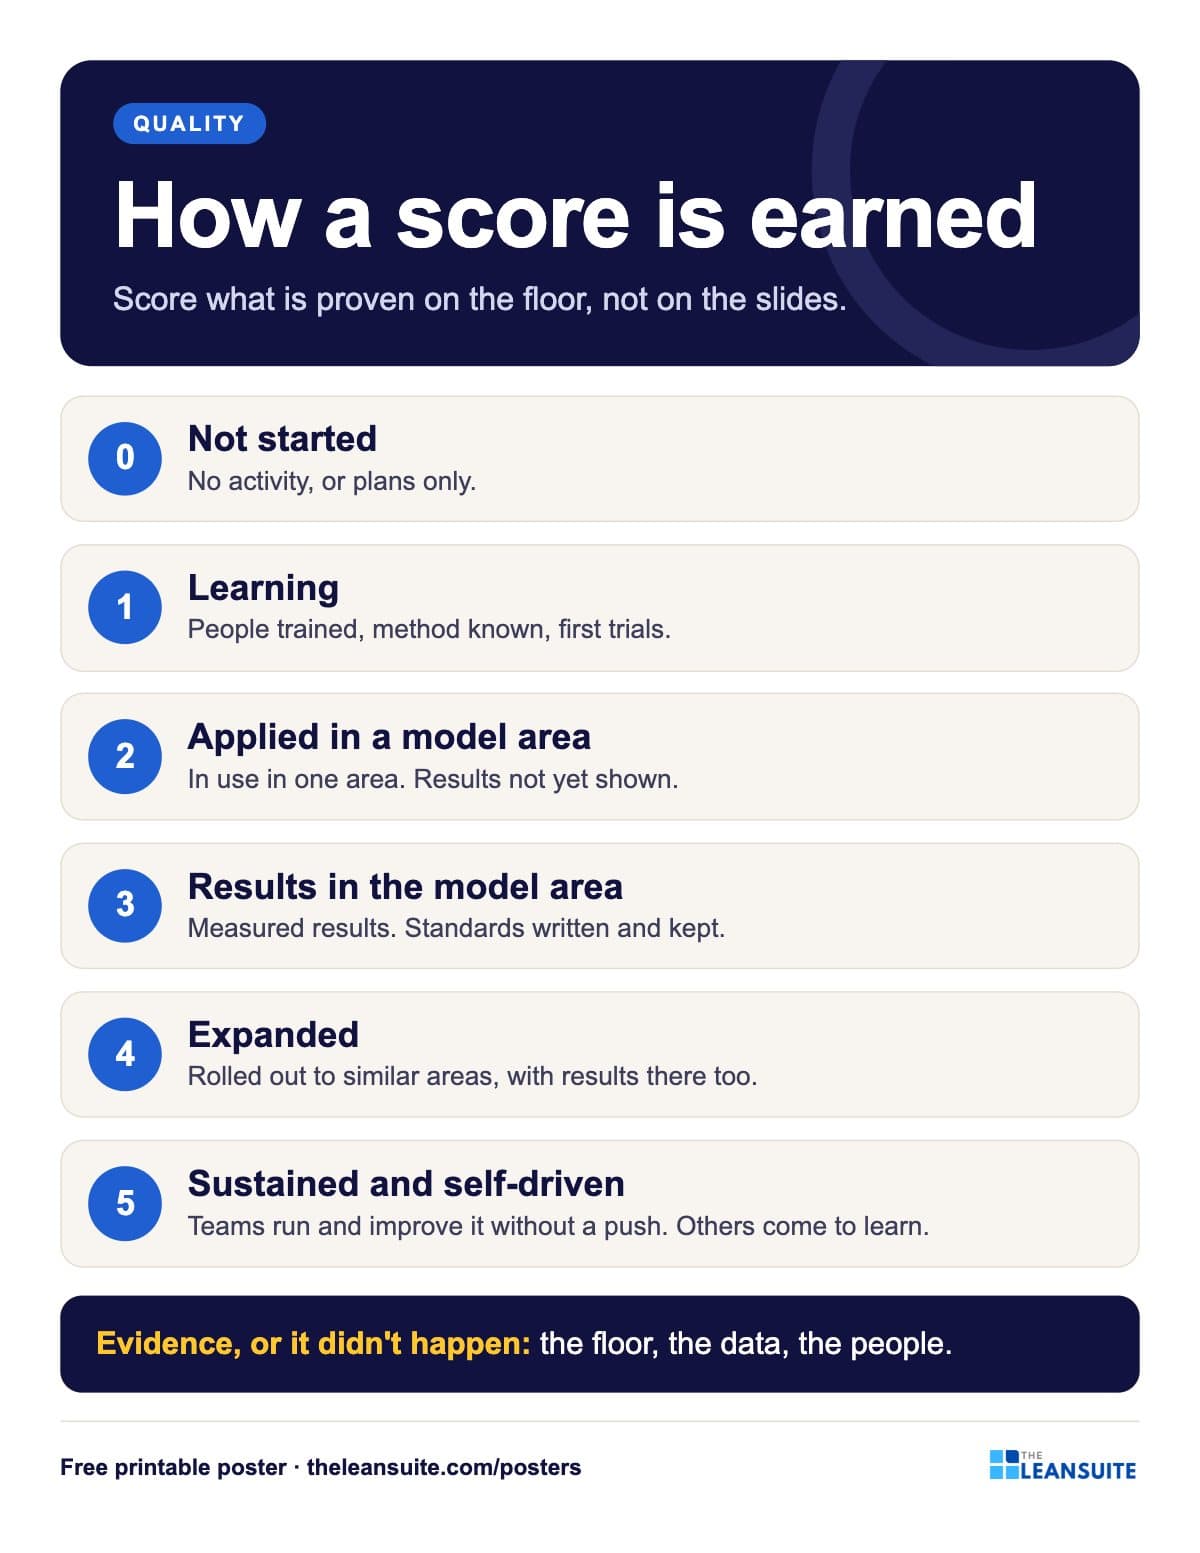 Audit score 0 to 5 poster
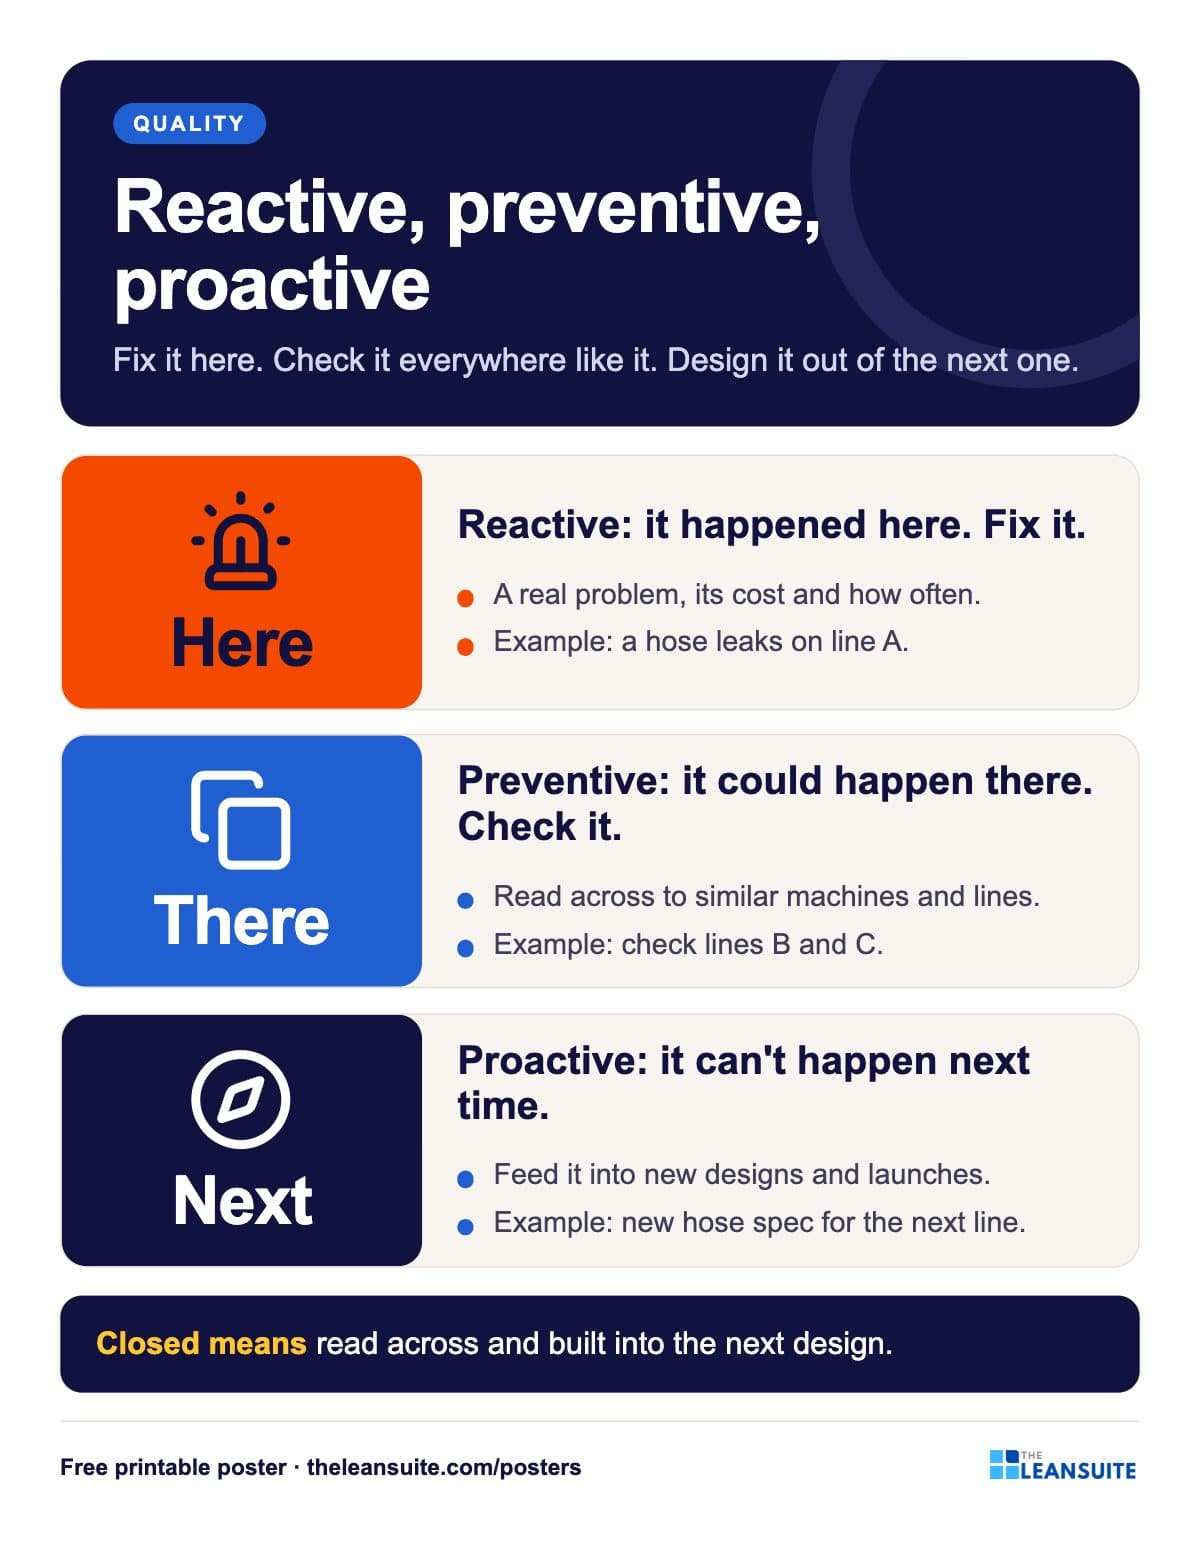 Reactive, preventive, proactive poster
A poster reminds. A routine makes it stick.
See how plants run their audits, improvements and follow-ups in LeanSuite, on a call built around your own problem.
Book a 45-minute demo