
Free training deck
Updated · About 45 minutes
MSA and Gage R&R training presentation
Measurement system analysis (MSA) is the set of studies that show how much of the variation in your data comes from the gauge and the people using it, instead of from the parts. Gage R&R is the best known of them. This free deck teaches it in about 45 minutes. Its 19 editable slides cover the five properties of a measurement system, repeatability against reproducibility, how to set up a study, the formulas for GRR, %GRR and the number of distinct categories, a worked example, how to read the result, attribute gauges, bias, linearity and stability, the common mistakes, a 15-minute mini study to run on the floor and four check questions with answers. Every slide has speaker notes.
Free to use: print it, copy it and edit it for your team. Enter your name and work email once to download.
 The title MSA and Gage R&R, can you trust the measurement, on a navy background with the LeanSuite logo.
A look inside
What is in the 19 slides
For quality technicians, inspectors, operators who measure, process and quality engineers, supplier quality staff. Widescreen, in plain language, with speaker notes on every slide.
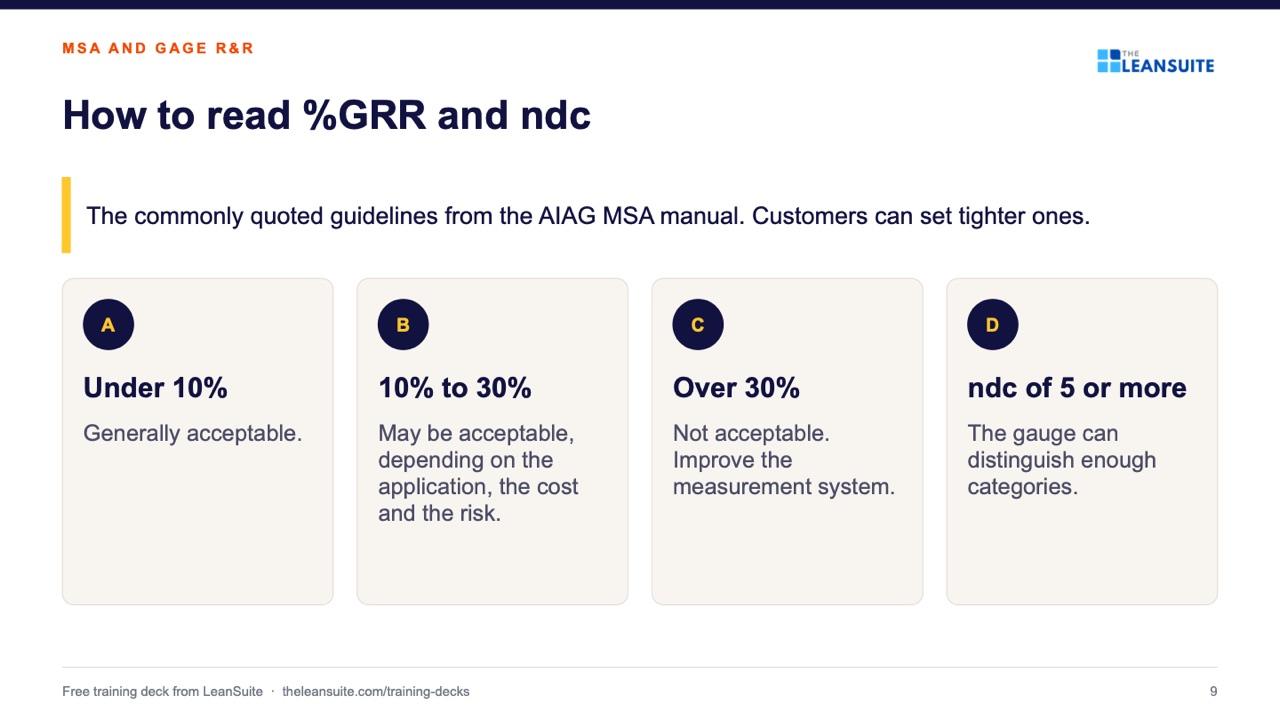
Slide 9: How to read %GRR and ndc 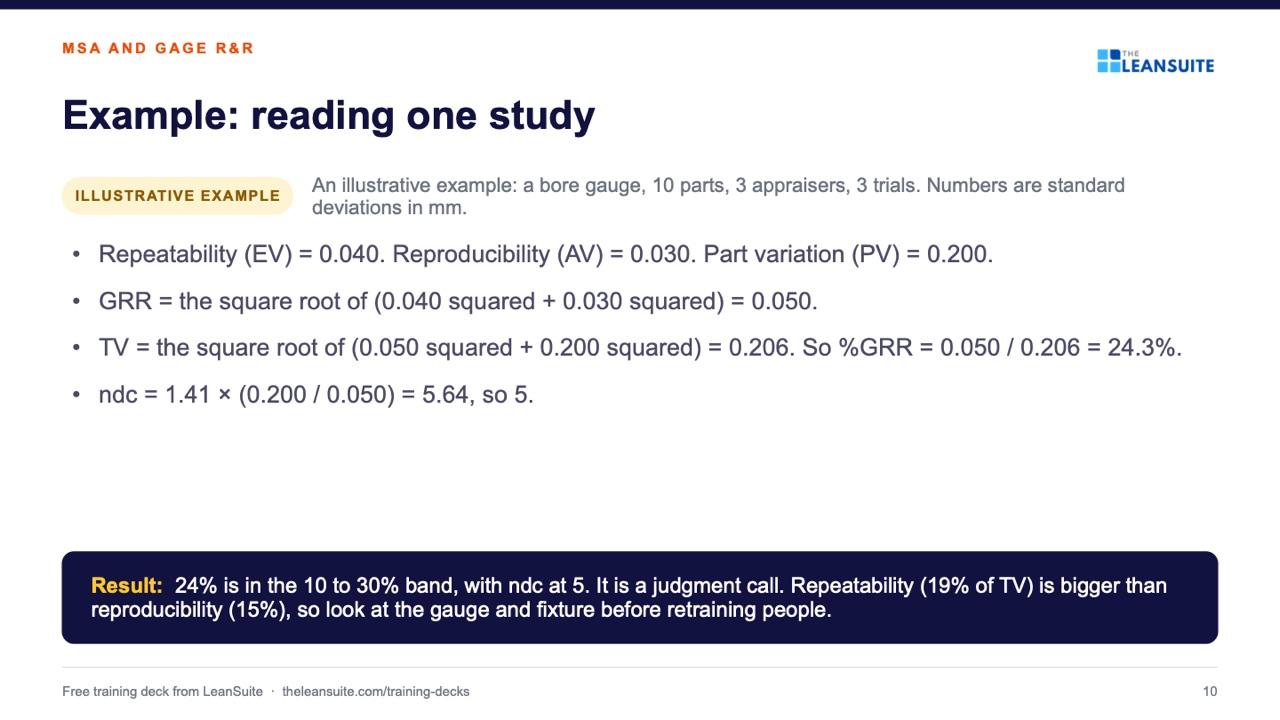
Slide 10: Example: reading one study 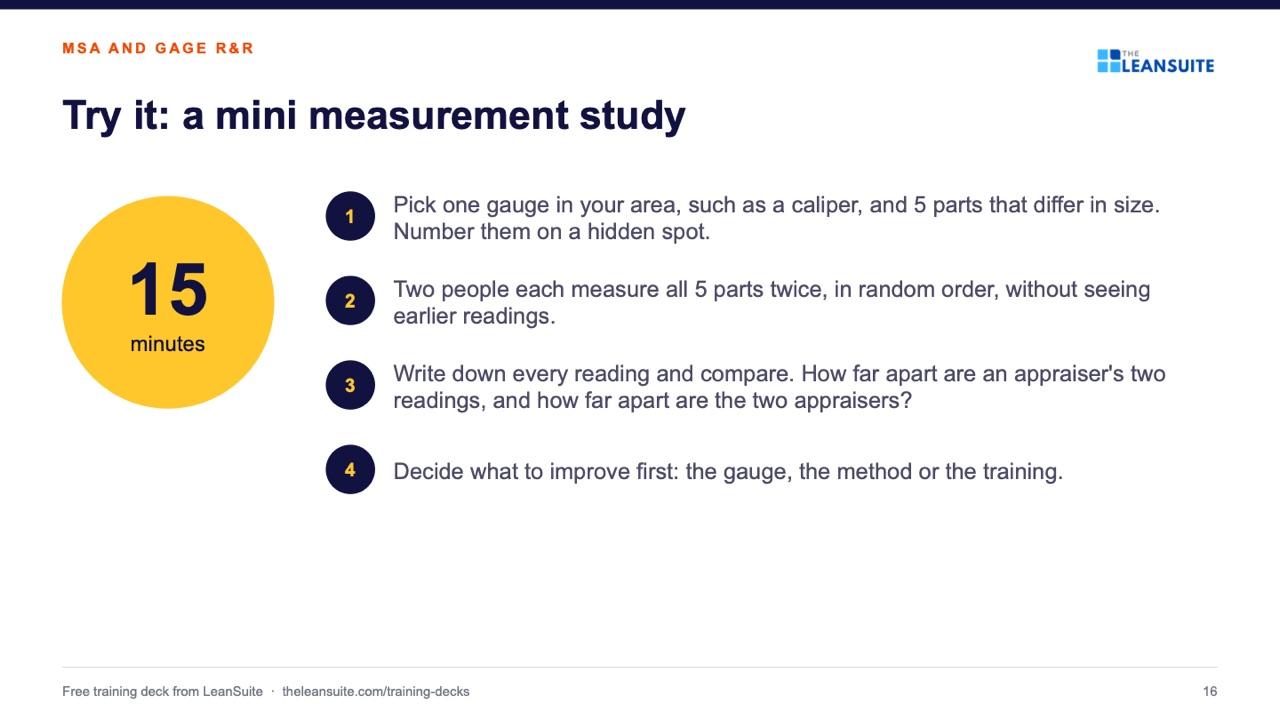
Slide 16: Try it: a mini measurement study
- 1MSA and Gage R&R: can you trust the measurement?Cover
- 2AgendaWhy measurement needs its own study · The five properties of a measurement system · How a gage R&R study works and how to read it · Attribute gauges and the other studies · Mistakes, activity and check questions
- 3What MSA is and why it comes firstEvery number you see is the part plus the measurement. MSA finds out how much is the measurement.
- 4Five properties of a measurement systemThree are about location (are readings centered on the truth) and two are about spread.
- 5Repeatability and reproducibilityGage R&R measures these two together. Add them up and you get the gage R&R (GRR).
- 6Before you run the studyCheck the gauge resolution. A common rule of thumb is that one reading step should be no more than one tenth of the tolerance or the process variation.
- 7A common study designThe AIAG manual describes several methods. This is the usual crossed study.
- 8The results and the formulasGRR = the square root of (repeatability squared + reproducibility squared).
- 9How to read %GRR and ndcThe commonly quoted guidelines from the AIAG MSA manual. Customers can set tighter ones.
- 10Example: reading one studyAn illustrative example: a bore gauge, 10 parts, 3 appraisers, 3 trials. Numbers are standard deviations in mm.
- 11What to do with the resultRepeatability bigger than reproducibility: look at the gauge, the fixture, the resolution and wear.
- 12Attribute gauges: go or no-goWhen the answer is pass or fail rather than a number, a variable gage R&R does not apply.
- 13Bias, linearity and stabilityGage R&R covers the spread. These studies cover location.
- 14When to run a studyFor any gauge named in a control plan, before the process is approved.
- 15Common mistakesTen parts from one batch, all nearly the same, so the gauge looks worse than it is.
- 16Try it: a mini measurement studyA 15-minute team activity
- 17Check your understanding4 check questions
- 18AnswersThe answers, to discuss
- 19Key points and next stepsNext: pick one gauge in your area that has never been studied and run the mini study.
The 45-minute session, slide by slide
- Slides, about: 30 minutes
- Activity (slide 16): 15 minutes
Present · 15 slides
- 1MSA and Gage R&R: can you trust the measurement?
- 2Agenda
- 3What MSA is and why it comes first
- 4Five properties of a measurement system
- 5Repeatability and reproducibility
- 6Before you run the study
- 7A common study design
- 8The results and the formulas
- 9How to read %GRR and ndc
- 10Example: reading one study
- 11What to do with the result
- 12Attribute gauges: go or no-go
- 13Bias, linearity and stability
- 14When to run a study
- 15Common mistakes
Do the activity · 1 slide
- 16Try it: a mini measurement study
Check and follow up · 3 slides
- 17Check your understanding
- 18Answers
- 19Key points and next steps
About 30 minutes of slides and 15 minutes of activity. Present: slides 1 to 15 (MSA and Gage R&R: can you trust the measurement?; Agenda; What MSA is and why it comes first; Five properties of a measurement system; Repeatability and reproducibility; Before you run the study; A common study design; The results and the formulas; How to read %GRR and ndc; Example: reading one study; What to do with the result; Attribute gauges: go or no-go; Bias, linearity and stability; When to run a study; Common mistakes). Do the activity: slide 16 (Try it: a mini measurement study). Check and follow up: slides 17 to 19 (Check your understanding; Answers; Key points and next steps).
How to run it
Running the session
- 1
Prepare
Read the speaker notes once and swap the illustrative example for one from your own area if you have it. Print the PDF if people like a handout.
- 2
Present
The slides take about 30 minutes. Every slide has notes, so you can talk from them rather than read the slide.
- 3
Do the activity
Pick one gauge in your area, such as a caliper, and 5 parts that differ in size. Number them on a hidden spot. The activity slide takes the team through it step by step; allow 15 minutes.
- 4
Check and follow up
Ask the check questions before showing the answers, then agree one next step with an owner and a date before people leave.
The check questions
- 1. What do repeatability and reproducibility each measure?
- Repeatability is the variation when one appraiser measures the same part with the same gauge several times. Reproducibility is the variation between different appraisers using the same gauge on the same parts.
- 2. Why must the parts in a study cover the range of the process?
- If all the parts are nearly alike, part variation is tiny, so the gauge variation looks large next to it and %GRR is overstated.
- 3. In the AIAG guidelines, which %GRR is generally acceptable, and which is not?
- Under 10% is generally acceptable and over 30% is not. In between depends on the application, the cost and the risk.
- 4. Is a gauge that is in calibration always good enough?
- No. Calibration checks the gauge against a standard. MSA checks how the whole measurement system performs in use, so a calibrated gauge can still fail a gage R&R.
Templates and guides to go with it
- Gage R&R study sheet10 parts, 2 or 3 appraisers, 2 or 3 trials: EV, AV, GRR, PV, %GRR and ndc by the average and range method.
- MSA study workbookBias, linearity and stability study sheets for a gauge, with the arithmetic done and a guide to which study when.
- Gauge calibration logA gauge register with next due dates and status, a calibration record with as-found and as-left readings, and the steps when a gauge fails.
- Topic: Quality managementEvery guide we have on the subject, sorted.
Read more
Terms in this deck
FAQ
MSA and Gage R&R training presentation: common questions
Measurement system analysis. It is the set of studies, such as bias, linearity, stability and gage R&R, that show how much of the variation in your data comes from the measurement system instead of the parts.
The AIAG guidelines call a %GRR under 10% generally acceptable, 10% to 30% possibly acceptable depending on the application, and over 30% not acceptable, with ndc of 5 or more. Customers can set their own limits, so check yours.
About 45 minutes: roughly 30 minutes of slides, a 15-minute mini measurement study and the check questions.
The AIAG Measurement Systems Analysis reference manual, fourth edition (2010), as publicly described. If your customer requires another edition or its own acceptance values, use theirs.
Yes. The PowerPoint file is fully editable, including the speaker notes. Many teams replace the illustrative bore gauge example with a gauge from their own plant.
More free training decks
- 5S training presentationSort, set in order, shine, standardize and sustain in 16 slides, with a 15-minute sort activity and a quiz.View deck
- Kaizen training presentationWhat kaizen is, its principles, PDCA and four steps to a first improvement in 17 slides, with an activity and a quiz.View deck
- Autonomous maintenance training presentation: the 7 stepsThe 7 steps of jishu hozen, who does what and how step audits work, in 19 slides with notes and a quiz.View deck
- 8 wastes of lean training presentationValue vs waste, the 8 wastes (TIMWOODS) with examples, muda, mura and muri and a waste walk, in 17 slides.View deck
- Gemba walk training presentationGo see, ask why, show respect: how to plan, run and follow up a gemba walk, in 16 slides with a practice walk.View deck
- Root cause analysis training presentation: 5 whys and fishboneDefine, contain, the 5 whys, the fishbone diagram and verifying the cause, in 18 slides with a team activity.View deck
- TPM training presentation: the 8 pillarsWhat TPM is, the six big losses, OEE and the 8 pillars, in 19 slides with a loss-spotting activity.View deck
- Manufacturing excellence pillars training presentationThe 20 pillars, cost deployment, the 7-step approach, model areas and audits, in 17 slides.View deck
- Obeya room training presentationWhat an obeya is, what goes on its walls and how to run the meetings, in 15 slides with a design activity.View deck
- DMAIC training presentationDefine, measure, analyze, improve and control, with the main tools of each phase, in 16 slides.View deck
- SMED training presentationInternal and external setup, the four SMED stages and how to halve a changeover, in 16 slides.View deck
- FMEA training presentationDFMEA and PFMEA, severity, occurrence and detection, RPN and action priority, in 16 slides.View deck
- Kanban training presentationPull instead of push: how a kanban loop works, the card types, the rules and how to size it, in 16 slides.View deck
- Lockout tagout (LOTO) training presentationHazardous energy, lockout versus tagout and the six steps in order, with a walk-round activity, in 17 slides.View deck
- Quality management system (QMS) training presentationWhat a quality management system is, the ISO 9001 clauses, procedures and records, corrective action and audits, in 18 slides.View deck
- SPC and Cpk training presentationCommon and special cause variation, X-bar and R limits, reading signals, Cp and Cpk, with worked numbers, in 19 slides.View deck
- PPAP and APQP training presentationThe five APQP phases, gates, the 18 PPAP elements, the five submission levels and the capability criteria, in 19 slides.View deck
- OEE training presentationHow to calculate OEE and read the six big losses in 19 slides, with one worked shift, a 20-minute exercise and a quiz.View deck
- Leader standard work training presentationWhat leader standard work is, the routine at each level, five steps to build it and how to keep it going, in 19 slides with an exercise and a quiz.View deck
- Daily management and tier meetings training presentationTier meetings, boards, huddles and escalation in 19 slides, with a worked example, a 20-minute huddle exercise and a quiz.View deck
- 5 Whys training presentationOhno's machine example, how to ask good whys, when to stop and where the method falls short, in 20 slides with a team exercise.View deck
- A3 problem solving training presentationThe seven boxes, the three kinds of A3, how to write and coach one, with two worked example slides and a 30-minute exercise, in 20 slides.View deck
- Poka-yoke (mistake-proofing) training presentationMistakes versus defects, the contact, fixed-value and motion-step methods, control and warning devices and how to design and test one, in 18 slides.View deck
- Layered process audit (LPA) training presentationWhat a layered process audit is, the layers, how to write and ask good questions, handle a no and read the results, in 19 slides.View deck
- Standard work training presentationTakt time, work sequence and standard WIP, how to write a standard with the operators and how to keep it alive, in 18 slides.View deck
- Value stream mapping (VSM) training presentationHow to map the current state, read lead time, design the future state with the eight questions and turn it into a plan, in 19 slides.View deck
- TWI job instruction training presentationThe four steps of TWI job instruction and the job breakdown sheet, from the original wartime card, with a worked example and a practice session.View deck
- 8D problem solving training presentationD0 to D8, containment, the root cause and the escape point, proving a fix and preventing repeats, in 20 slides with a team exercise.View deck
- Forklift safety training presentationOperator training rules, stability and load center, travel and dock rules and the daily exam, each tied to 29 CFR 1910.178, in 20 slides.View deck
- Hazard communication (HazCom, GHS) training presentationLabels, the eight GHS pictograms, the 16 SDS sections, employee training and the 2026 and 2028 dates, each tied to 29 CFR 1910.1200, in 20 slides.View deck
- New-hire safety orientation training presentationA day-one safety orientation for plants and warehouses: reporting, emergencies, PPE, chemicals, machines and trucks, with the OSHA paragraph behind each, in 17 slides.View deck
- 4M change management training presentationMan, machine, material and method changes, rating the risk, extra checks, the change point board and closing a change, in 19 slides.View deck
Training is the start. Keeping it going is the hard part.
See how plants run their audits, improvements and follow-ups in LeanSuite, on a call built around your own problem.
Book a 45-minute demo