

Lean playbook · Pulp and paper
Lean playbook for pulp and paper mills
Short answer
Start lean in a pulp or paper mill on the paper machine, because it is usually the bottleneck and every minute it stops is lost for the whole mill. Count what you lose: breaks by position and cause, grade change time, broke and steam per tonne. Operator care rounds and breakdown analysis cut breaks, SMED shortens grade changes and a defect tally by position cuts broke. Mills already run on TPM, so the job is to make the routines the same on every crew and to write down what the senior crews know before they retire.
Last updated:
7 problems on the floor, and the lean methods for each
Each problem says what it looks like, which methods address it, the first moves to make and the number to watch. Pick the one or two that cost your plant most; you do not need all of them at once.
Where a pulp and paper mill loses time and quality
Wood yard and pulping
Bleaching and stock preparation
Finishing and shipping
Across the whole line
Sheet breaks and unplanned downtime
A break stops the reel and the machine makes broke until the sheet is threaded and settled again. The crew threads up and moves on, and the break log says where it broke but rarely why.
In LeanSuite
Log lost production by cause, from breakdowns and changeovers to material shortages, and use it to fix maintenance and scheduling. Escalate the recurring breakdown into a Kaizen or A3 project in one click and fix the root cause.
First moves
- Log every break for four weeks with the position, time to thread up and the crew's best guess at the cause.
- Chart breaks by position and cause as a Pareto, and pick the top position.
- Run a breakdown analysis with a 5 Whys on every break at that position, with operators and maintenance together.
- Turn each confirmed cause into a fix with an owner, and track breaks per day on the shift board.
Number to watch: Breaks per day by position, and minutes lost to breaks per day.
Operator care rounds that vary by crew
Showers, doctors, felts, bearings, pumps and steam traps are checked on rounds, but the rounds are ticked at the end of the shift and each crew does them its own way. Small leaks and worn parts are noticed only when they fail.
In LeanSuite
Digital CILR checklists put each machine's clean, inspect, lubricate and retighten routine on the operator's Daily Standard Work in LeanSuite, so small problems are caught before they become breakdowns. In LeanSuite, operators raise AM tags from the equipment's QR code during CILR checks.
First moves
- Write a one-page round for each section of the machine with the operators, with photos of the good condition and the limits to check.
- Make every abnormality a tag with a photo, and review the open tags at the daily meeting with maintenance.
- Teach each check as a one-point lesson, so all crews look at the same points the same way.
- Audit a sample of rounds each week against the standard, on the machine.
Number to watch: Rounds completed on time, and abnormality tags raised and closed per week.
Slow grade changes
Basis weight, color or furnish changes make off-grade paper until moisture and caliper settle. Each crew runs the change its own way, and setpoints, chemicals and the winder plan are prepared after the change starts instead of before.
In LeanSuite
Every checklist logs how long each step took, so the Kaizen module shows which steps to attack.
First moves
- Record the last five grade changes from the start of the change to the first on-spec reel, with what was done and when.
- Move preparation before the change: stock, chemicals, setpoints, winder plan and lab checks.
- Agree one sequence with all crews, write it down and time every change against it.
- Sequence the grade wheel so each change is as small as possible.
Number to watch: Grade change time, from the start of the change to the first reel in spec.
Off-grade reels and broke
Holes, spots, wrinkles, moisture streaks and out-of-spec basis weight are found at the reel, the winder or the customer. Broke goes back to the pulper, so fiber, steam and machine time are paid for twice.
In LeanSuite
The QA Matrix gives each defect an AA, A, B or C priority from where it was caught, its severity, cost and recurrence. Put a cost on defects by capturing scrap, rework, warranty claims and inspections, then rank quality projects by what they are worth.
First moves
- Record broke by cause and by where it was found: breaks, grade changes, startups and defects.
- Tally reel defects by type and cross-direction position, so a repeating spot points at one shower, doctor or felt.
- Put basis weight and moisture on a control chart by reel and react to signals, not to every reading.
- Run a root cause analysis on the biggest broke cause, and write the fix into the round or the operating standard.
Number to watch: Broke %: broke tonnes divided by tonnes produced at the reel.
Steam, energy and water use
The dryer section uses most of the mill's steam. Failed steam traps, poor condensate return, open hood doors, compressed air leaks and running showers add cost every hour and are found on walks, then forgotten.
In LeanSuite
Complete a gemba walk checklist on a phone or tablet with photos and comments, and turn findings into tags, actions or Kaizens. LeanSuite's KPI dashboards for manufacturing track every KPI against its target, with RAG ranges, KPI trees and live huddle boards, so operators and the plant manager act on the same numbers.
First moves
- Track steam per tonne and power per tonne by grade, every day, next to production.
- Walk the machine and the utilities once a week for leaks, failed traps, open doors and running showers, and tag each find.
- Fix the tags in order of cost, and check the trend after each fix.
Number to watch: Steam per tonne of saleable paper, by grade.
Lockout and confined-space work
Rolls, steam, hydraulics and chemicals all store energy, and chests, tanks and digesters must be entered for cleaning and repair. Procedures in an old binder and permits filled in from memory are where things go wrong, most of all at shutdowns with contractors on site.
In LeanSuite
Lean Creator runs photo-verified isolation steps, Skills Matrix limits lockouts to authorized people, and KPIs & Dashboards show compliance for every machine.
First moves
- Write machine-specific lockout procedures with photos of every isolation point, starting with felt, wire and doctor changes.
- Use a written entry permit for every confined space, with atmosphere tests, an attendant and a rescue plan.
- Brief contractors on the mill's lockout and entry rules before a shutdown, and audit a sample of lockouts each week.
Number to watch: Lockouts audited and passed, and near misses reported and closed per month.
Experienced crews retiring
Machine tenders and back tenders with decades on the machine know how it sounds before a break and what to do at a grade change. When they retire, that knowledge leaves with them unless it is written down and taught.
Lean methods
In LeanSuite
A live, color-coded view of who is qualified for each job or area, built from skill levels and procedure sign-offs, not an old spreadsheet. Film the senior technician once and the same footage drafts the procedure.
First moves
- Make a skills matrix per crew and mark every position fewer than two people can run.
- Write job breakdown sheets with the senior operators for threading, grade changes and break recovery, including the reasons behind each key point.
- Pair each senior operator with a successor and sign the successor off with the four-step job instruction method.
Number to watch: Positions covered by at least two signed-off people on every crew.
More small fixes in the maintenance, production and safety sections of the kaizen idea bank.
A 90-day starting plan
One line or product family, two problems, measured before and after. The point of the first 90 days is a result the plant believes and a method it can repeat, not a plant-wide program.
The 90 days, with the gate that ends each stage
- Days 1 to 30See the losses on the paper machineDone when: You have baseline numbers on the board and two problems with an owner each.
- Days 31 to 60Fix the top two lossesDone when: Each fix has a written standard and a before-and-after number.
- Days 61 to 90Make it stick, then spread itDone when: The gains have held for a month and the next section has its baseline.
Days 1 to 30
See the losses on the paper machine
Get a true baseline on the bottleneck machine before changing anything.
- Name a lead and a sponsor, and agree the losses to measure with every crew.
- Measure for four weeks: breaks by position and cause, grade change times, broke by cause and steam per tonne.
- Start a short meeting at a board by the machine at each shift change, so crews hand over the same picture.
- Walk the machine with operators and maintenance, and list what slows them down.
- Choose the two biggest losses to work on first.
Days 31 to 60
Fix the top two losses
Run focused improvements on the two problems and check them against the baseline.
- Run breakdown analysis on every break at the worst position, with operators and maintenance together.
- Write the operator care round for that section and start it on every crew.
- Run a SMED workshop on the most frequent grade change, with one person from each crew.
- Write each new method down as a standard or a one-point lesson as soon as it works.
Days 61 to 90
Make it stick, then spread it
Check the new standards hold on every crew, then copy them to the next section or machine.
- Audit the new standards on every crew with short layered audits.
- Train every operator on the changes and update the skills matrix.
- Compare the machine's numbers with the baseline and share the result with the mill.
- Pick the next section or machine, copy what worked and start again at day one.
The KPIs to track
Track them per line and shift, on a board the team sees every day. Set targets from your own baseline, not from someone else's plant.
| KPI | What it tells you | How to measure it | Free help |
|---|---|---|---|
| Time efficiency | How much of the calendar the machine spent making paper, and what took the rest. | Hours on the reel making paper divided by total hours, with breaks, grade changes, felt and wire changes and shutdowns as the losses. | - |
| OEE | Time, speed and quality losses in one number, so the biggest one stands out. | Time efficiency times speed against the grade's target speed times saleable tonnes divided by tonnes produced at the reel. | OEE calculator |
| Breaks per day | Whether the machine is getting more reliable, and where it breaks. | Count of sheet breaks per 24 hours, by position (wet end, press, dryers, size press, reel). | Equipment downtime log (MTTR and MTBF) |
| Broke % | How much paper is made twice. | Broke tonnes divided by tonnes produced at the reel, by cause: breaks, grade changes, startups and defects. | Scrap rate calculator |
| Grade change time | How long a change makes off-grade paper, and whether the standard is followed. | Minutes from the start of the change until moisture and basis weight are in spec, for every change, by grade pair. | SMED changeover calculator |
| Steam per tonne | The drying energy behind each tonne, and whether leaks and losses are growing. | Tonnes of steam to the machine divided by tonnes of saleable paper, per day and grade. | Energy use and EnPI tracker |
| PM compliance | Whether planned maintenance is done on time or keeps slipping. | Preventive maintenance tasks done on time divided by tasks due, per month. | Maintenance KPI tracker |
Worked example: what sheet breaks cost a paper machine
A made-up paper machine makes 30 tonnes an hour and runs 350 days a year. In four weeks (28 days) the crews log 112 breaks, and each one costs 25 minutes from the break to saleable paper again. By position: press section 48, dryer section 30, wet end 20 and size press 14.
The calculation, step by step
Example numbersBreaks a day = breaks logged ÷ days
- Breaks a day =112 ÷ 28= 4
Tonnes lost = breaks × minutes per break ÷ 60 × tonnes an hour
- A day =4 × 25 ÷ 60 × 30= 50 tonnes
- Breaks a year =4 × 350= 1,400
- A year =1,400 × 25 ÷ 60 × 30= 17,500 tonnes
Lost to breaks a year17,500 tPareto: share of breaks at the worst position
- All positions =48 + 30 + 20 + 14= 112
- Press section =48 ÷ 112= 42.9%
If breakdown analysis halves the press section breaks
24 fewer breaks every 28 days.
- Breaks avoided a year =24 ÷ 28 × 350= 300
- Tonnes a year =300 × 25 ÷ 60 × 30= 3,750 tonnes
- Share of break losses =3,750 ÷ 17,500= 21.4%
Tonnes won back a year3,750 t
By the numbers
Public figures for this industry or for the wider sector it belongs to, each linked to the report or government table it comes from and checked against it on October 9, 2026. More in our lean manufacturing statistics and benchmark charts.
2.4
Paper manufacturing recorded 2.4 injury and illness cases per 100 full-time workers in 2024, and 1.6 cases with days away, restricted or transferred, against 2.7 and 1.7 for all manufacturing.
Total recordable and DART cases per 100 full-time workers, U.S. private industry, 2024 data from the Survey of Occupational Injuries and Illnesses.
Source: U.S. Bureau of Labor Statistics, Table 1. Incidence rates of nonfatal occupational injuries and illnesses by industry and case types, 2024 (2024 data, table updated January 22, 2026)
16×
Plants in the top quarter for relying on reactive maintenance had 3.3 times more downtime and 16 times more defects than plants in the bottom quarter.
Same NIST survey. NIST notes the link is an association, not proof of cause.
Source: NIST, Economics of Manufacturing Machinery Maintenance: A Survey and Analysis of U.S. Costs and Benefits (NIST AMS 100-34) (June 2020)
Injury and illness rate by industry, 2024
- Motor vehicles5.6
- Beverage and tobacco3.7
- Furniture3.5
- Food3.3
- Primary metals3.3
- Nonmetallic mineral products, incl. glass3.3
- Fabricated metal products3.2
- Transportation equipment3.2
- Motor vehicle parts2.9
- Plastics and rubber products2.8
- HVAC and refrigeration2.4
- Paper2.4This industry
- Machinery2.3
- All private industry2.3
- Electrical equipment and appliances2.0
- Printing1.6
- Chemicals1.6
Total recordable cases per 100 full-time workers, 2024: Motor vehicles 5.6, Beverage and tobacco 3.7, Furniture 3.5, Food 3.3, Primary metals 3.3, Nonmetallic mineral products, incl. glass 3.3, Fabricated metal products 3.2, Transportation equipment 3.2, Motor vehicle parts 2.9, Plastics and rubber products 2.8, All manufacturing 2.7, HVAC and refrigeration 2.4, Paper 2.4, Machinery 2.3, All private industry 2.3, Electrical equipment and appliances 2, Printing 1.6, Chemicals 1.6.
Free templates, calculators and buyer's guides
Templates (23)
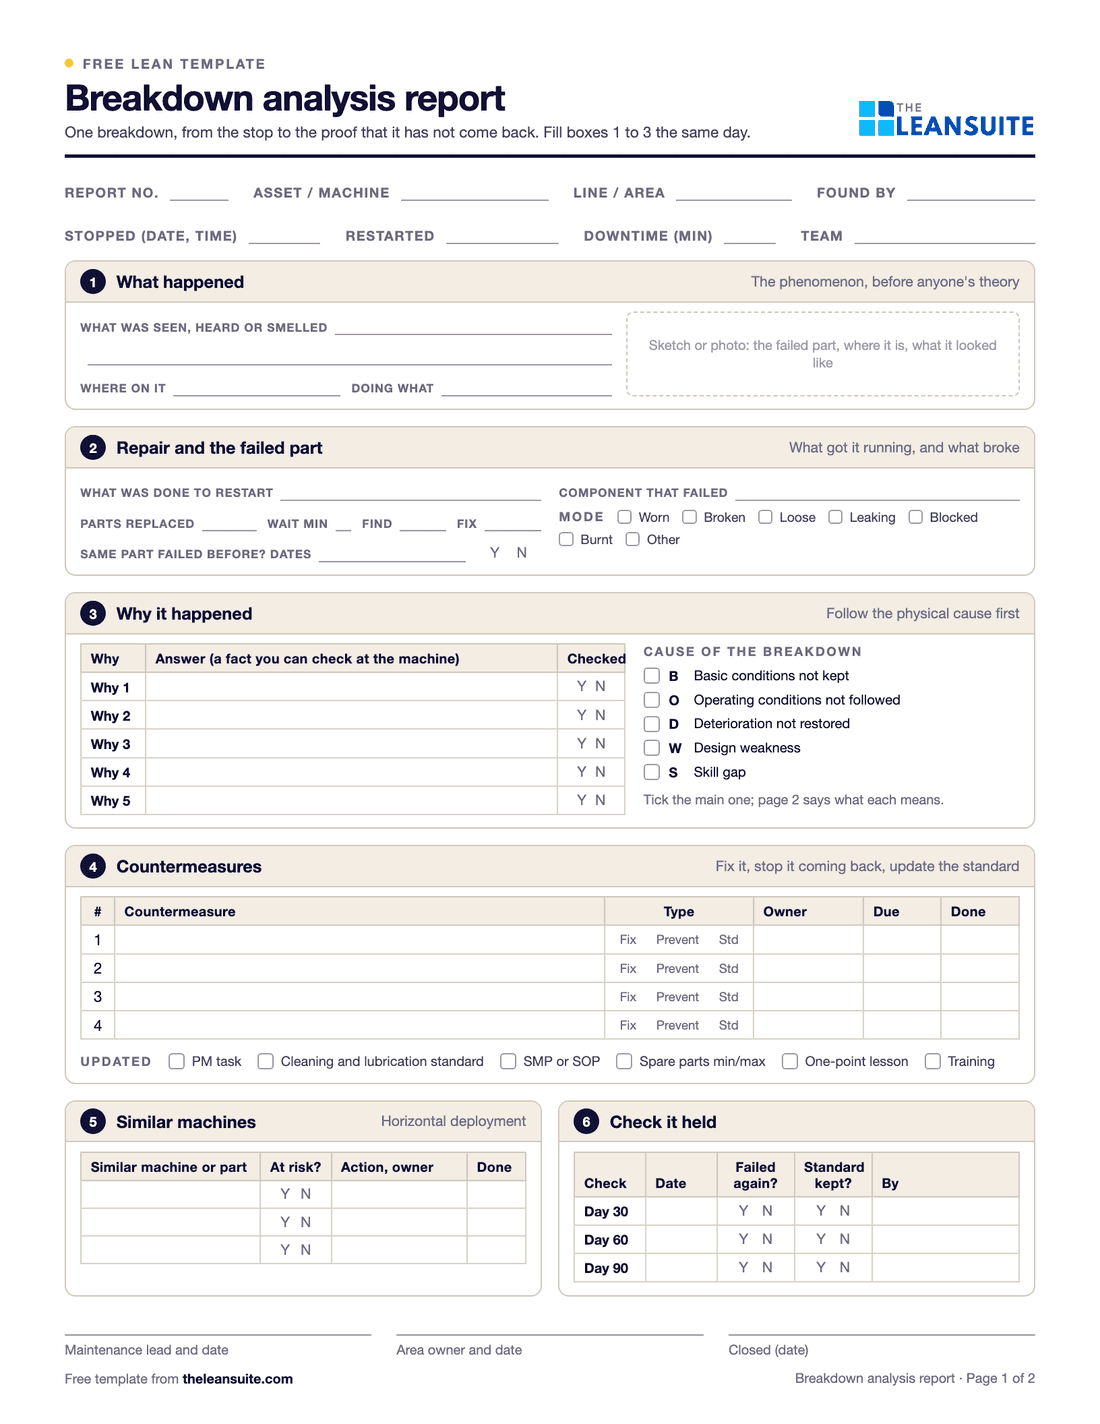 PDF and ExcelBreakdown analysis reportOne equipment breakdown from the stop to the 90-day check, plus a breakdown log with repeat flags, MTBF and MTTR by asset and a Pareto of causes.
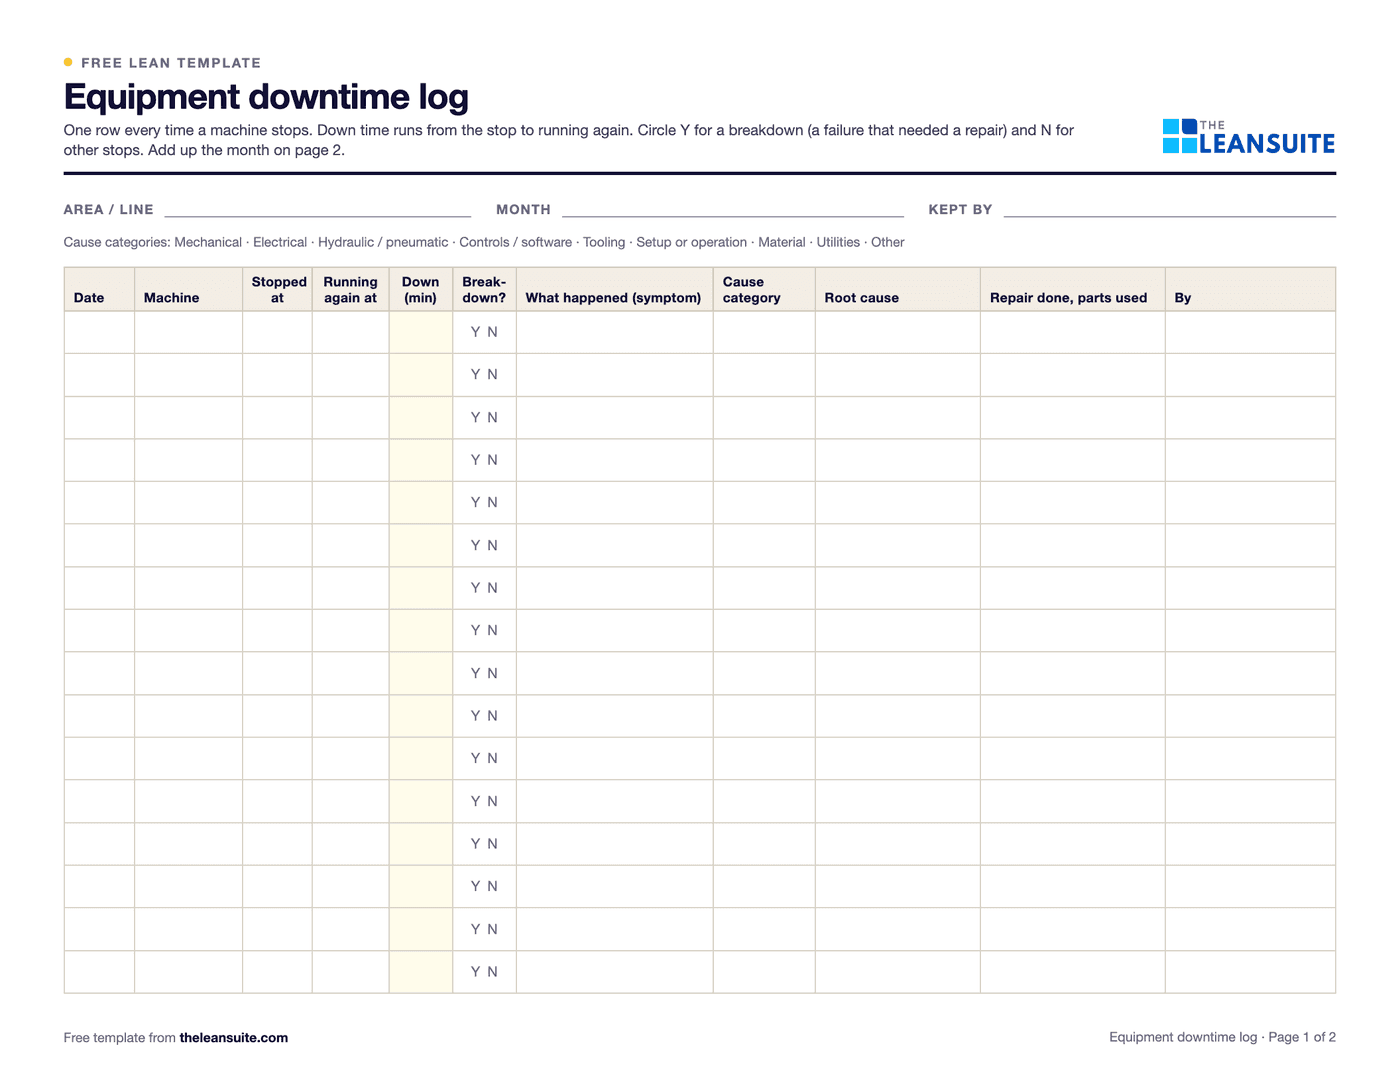 PDF and ExcelEquipment downtime log (MTTR and MTBF)A breakdown and downtime log, with MTTR, MTBF and downtime by machine and cause worked out in Excel.
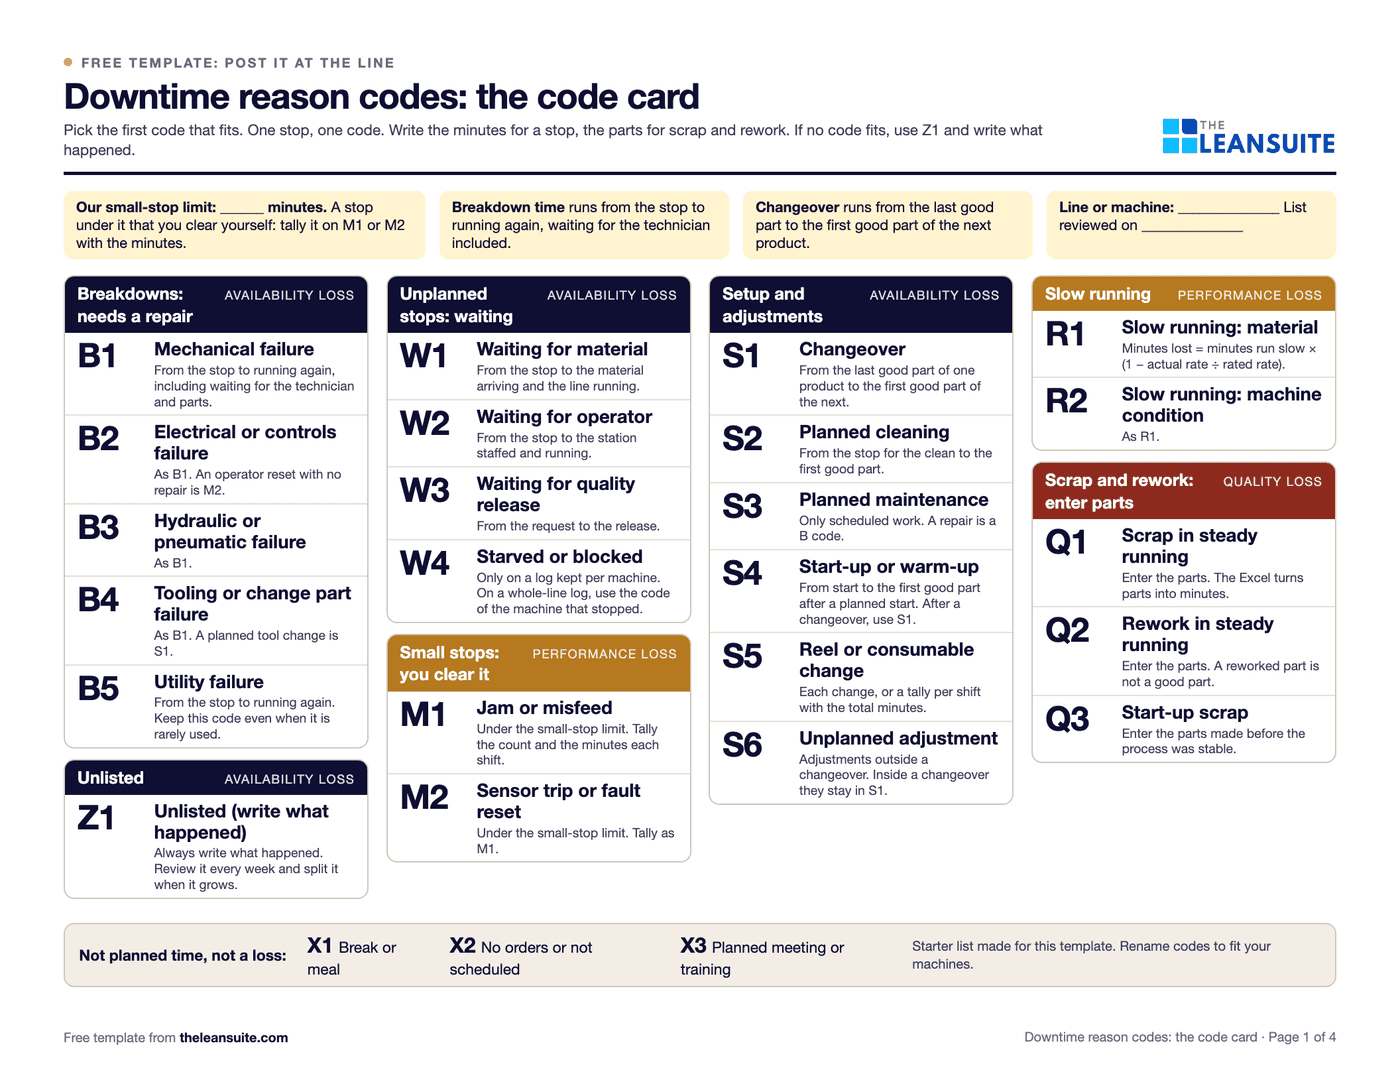 PDF and ExcelDowntime reason codes template26 starter codes mapped to the six big losses, a log with drop-downs, a Pareto by code and by loss, and a code card for the line.
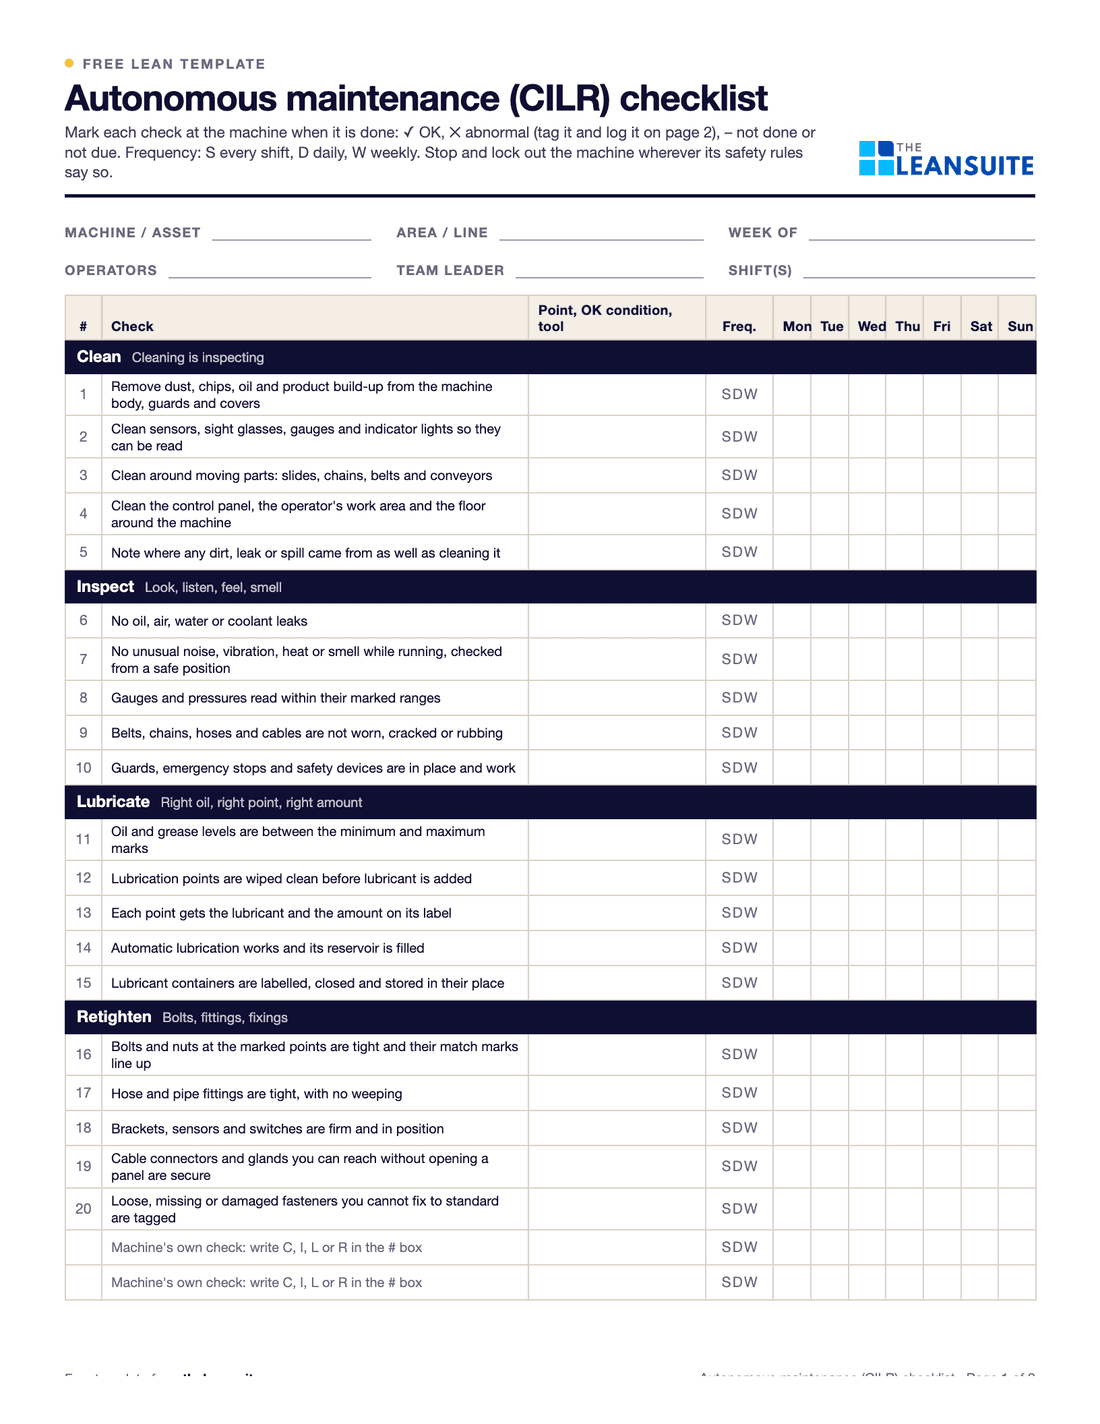 PDF and ExcelAutonomous maintenance (CILR) checklist20 clean, inspect, lubricate and retighten checks with a box per day, an abnormality log and sign-off.
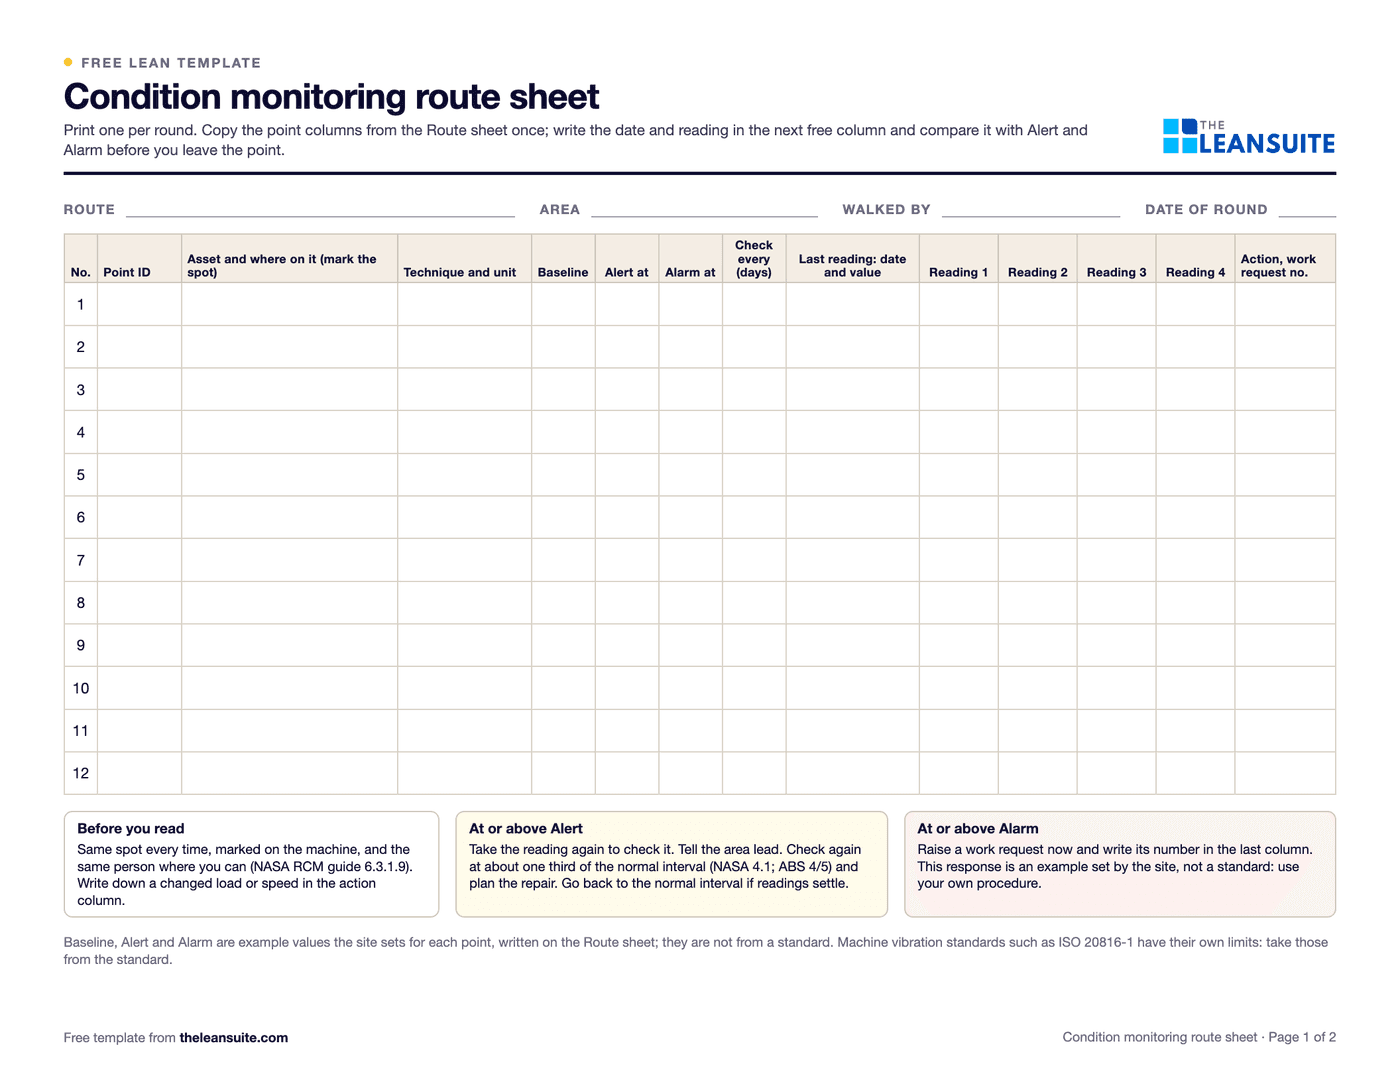 PDF and ExcelCondition monitoring route sheetA route of measuring points with baselines, alert and alarm limits, a check interval from the P-F interval, readings with rising and overdue flags, and an exceptions list worst first.
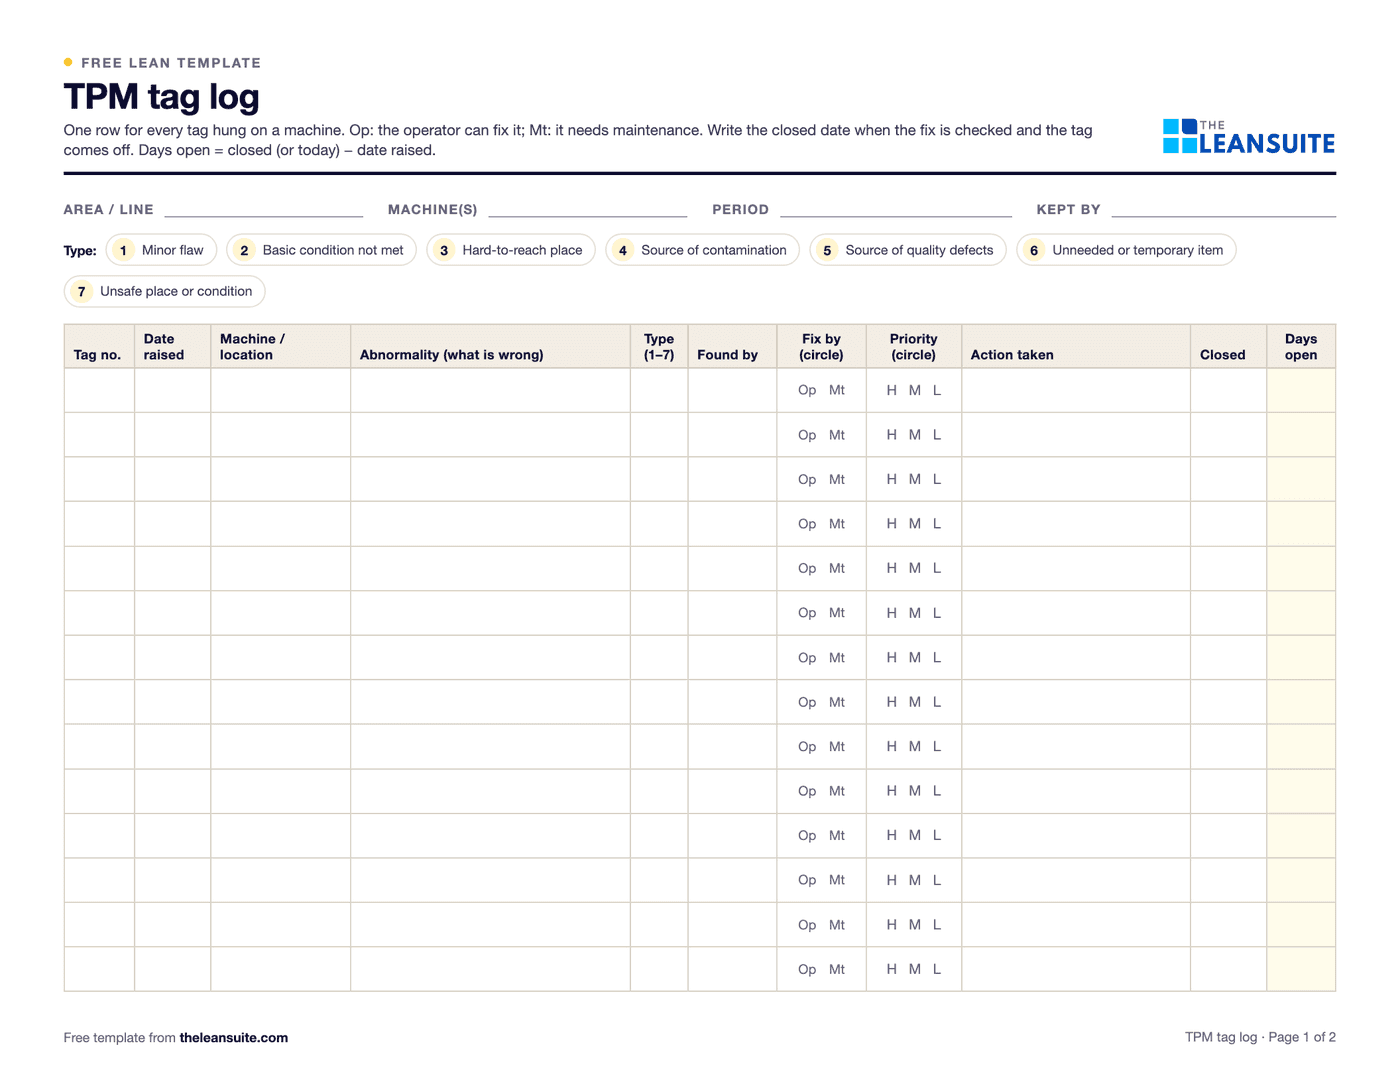 PDF and ExcelTPM tag logEvery abnormality tag with type, who fixes it, priority and dates, with days open and counts by type and week.
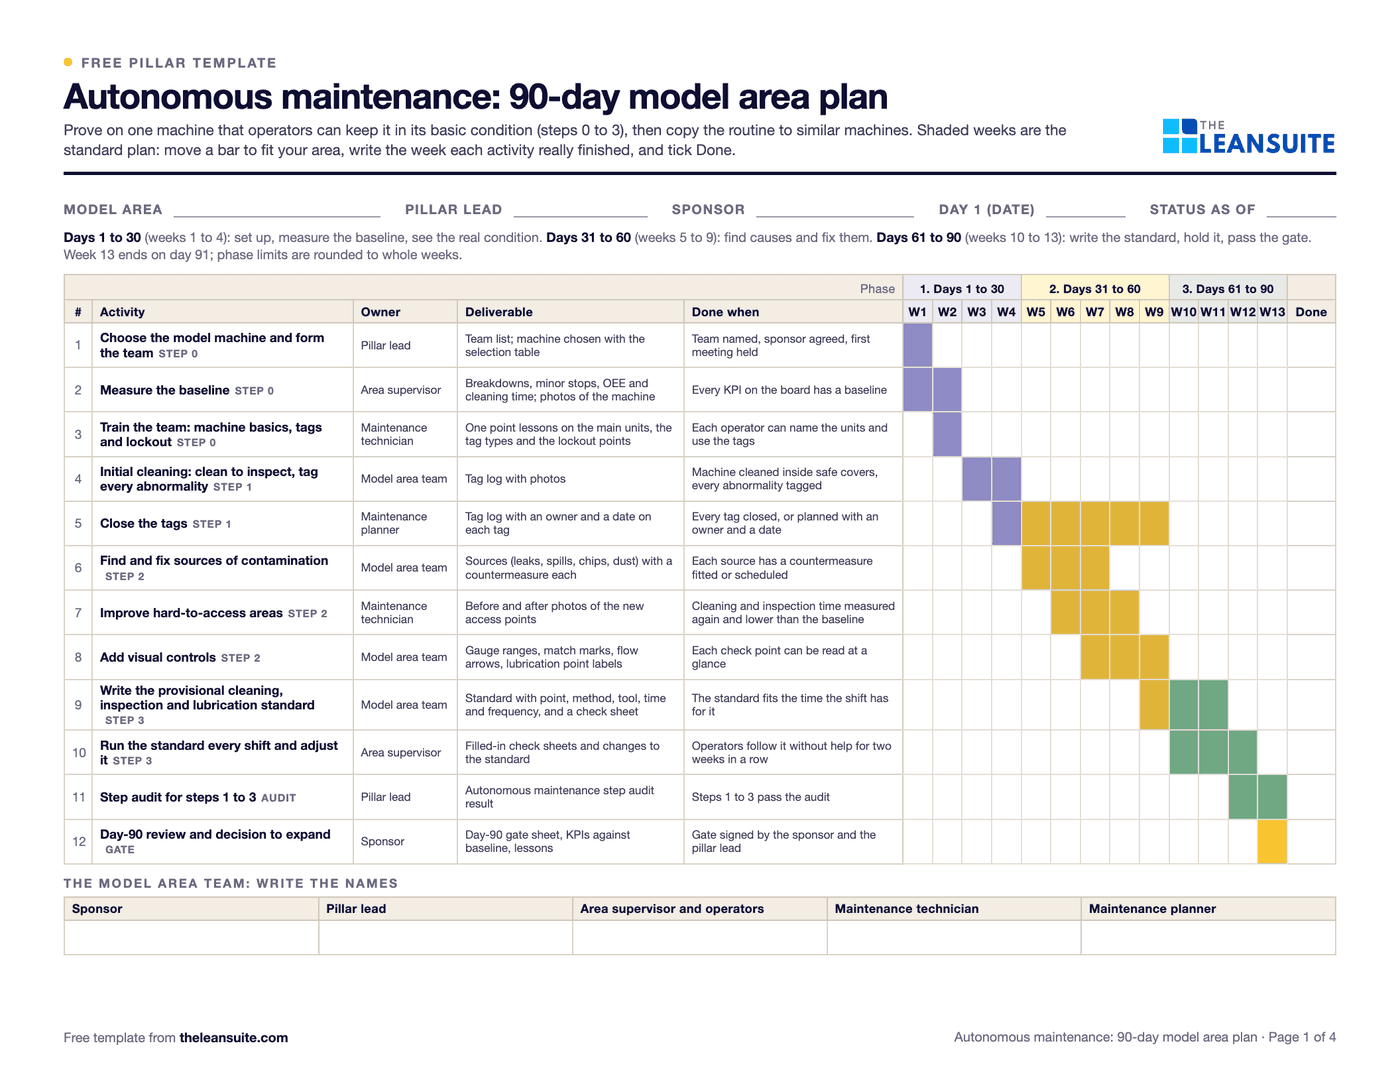 PDF and ExcelAutonomous maintenance 90-day model area planAM steps 0 to 3 on one model machine in 13 weeks, a KPI board, the day-90 gate and expansion waves for months 4 to 12.
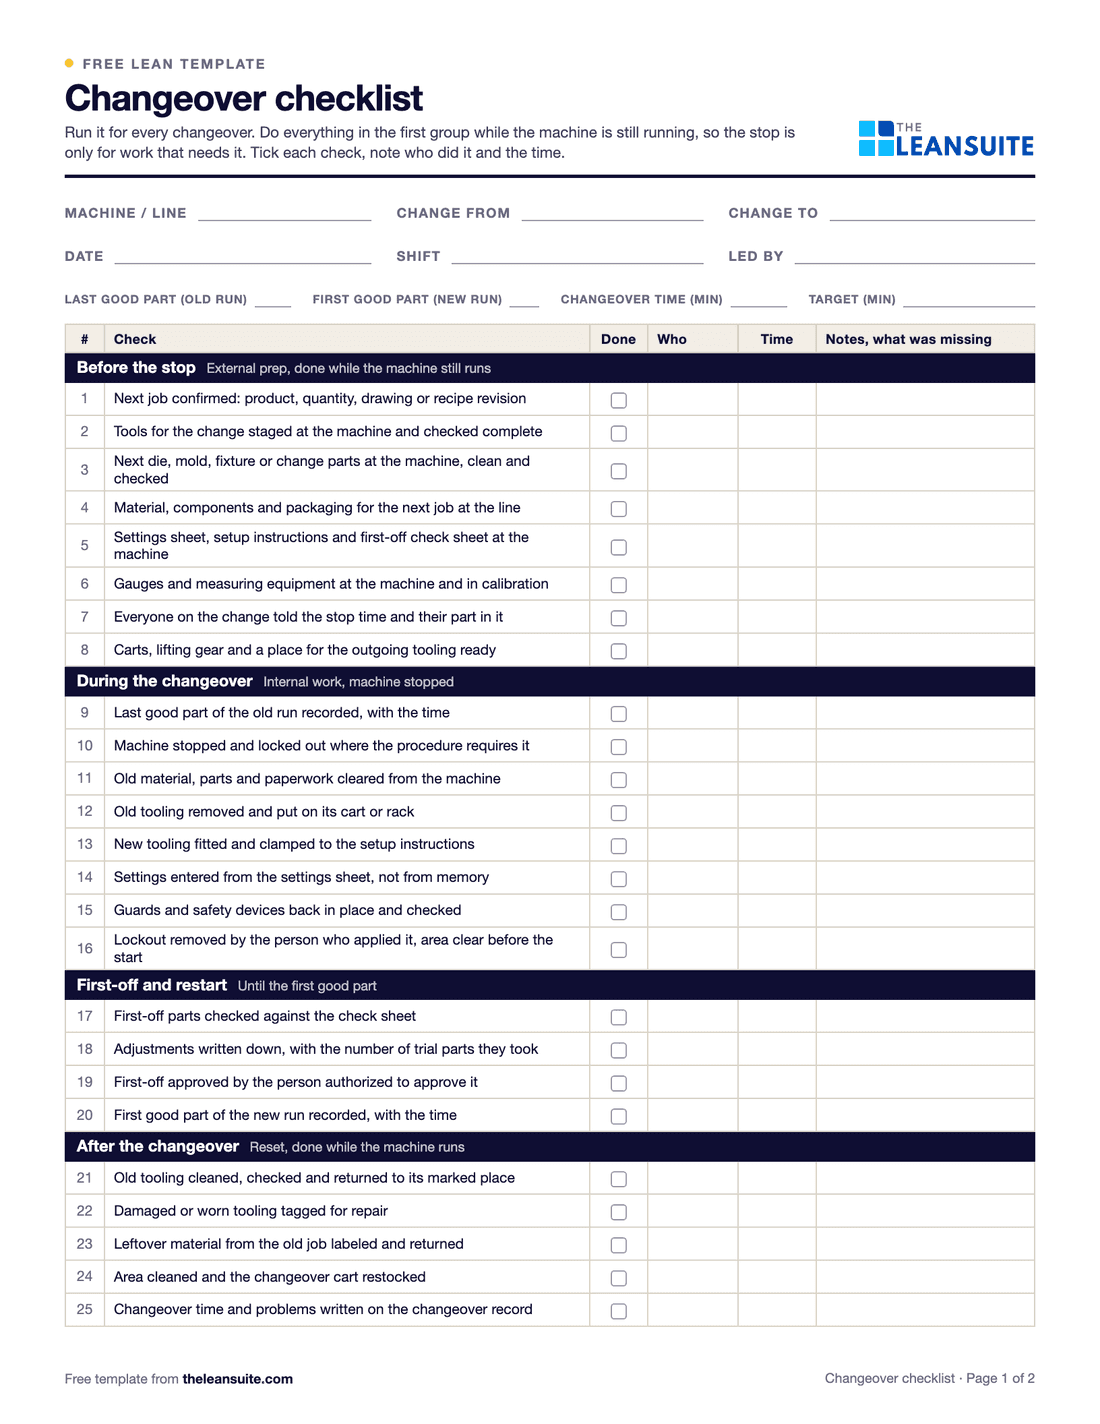 PDF and ExcelChangeover checklist25 checks for every changeover, a record of planned and actual times, and a log of changeover time against target.
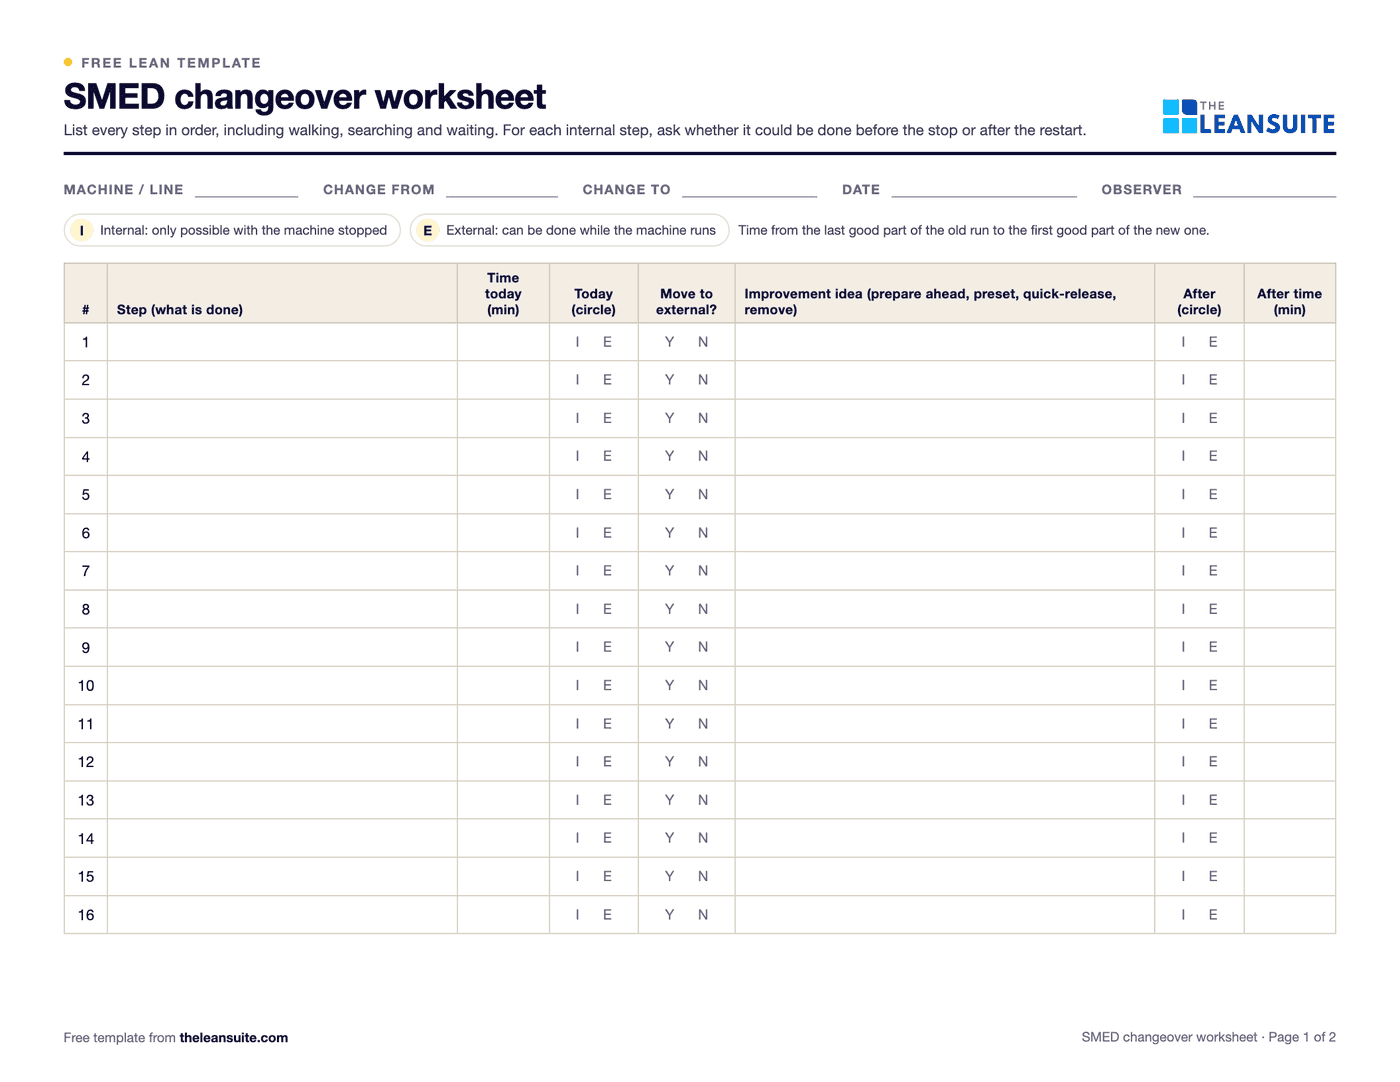 PDF and ExcelSMED changeover worksheetChangeover steps with times, internal or external, what can move, ideas and before/after totals.
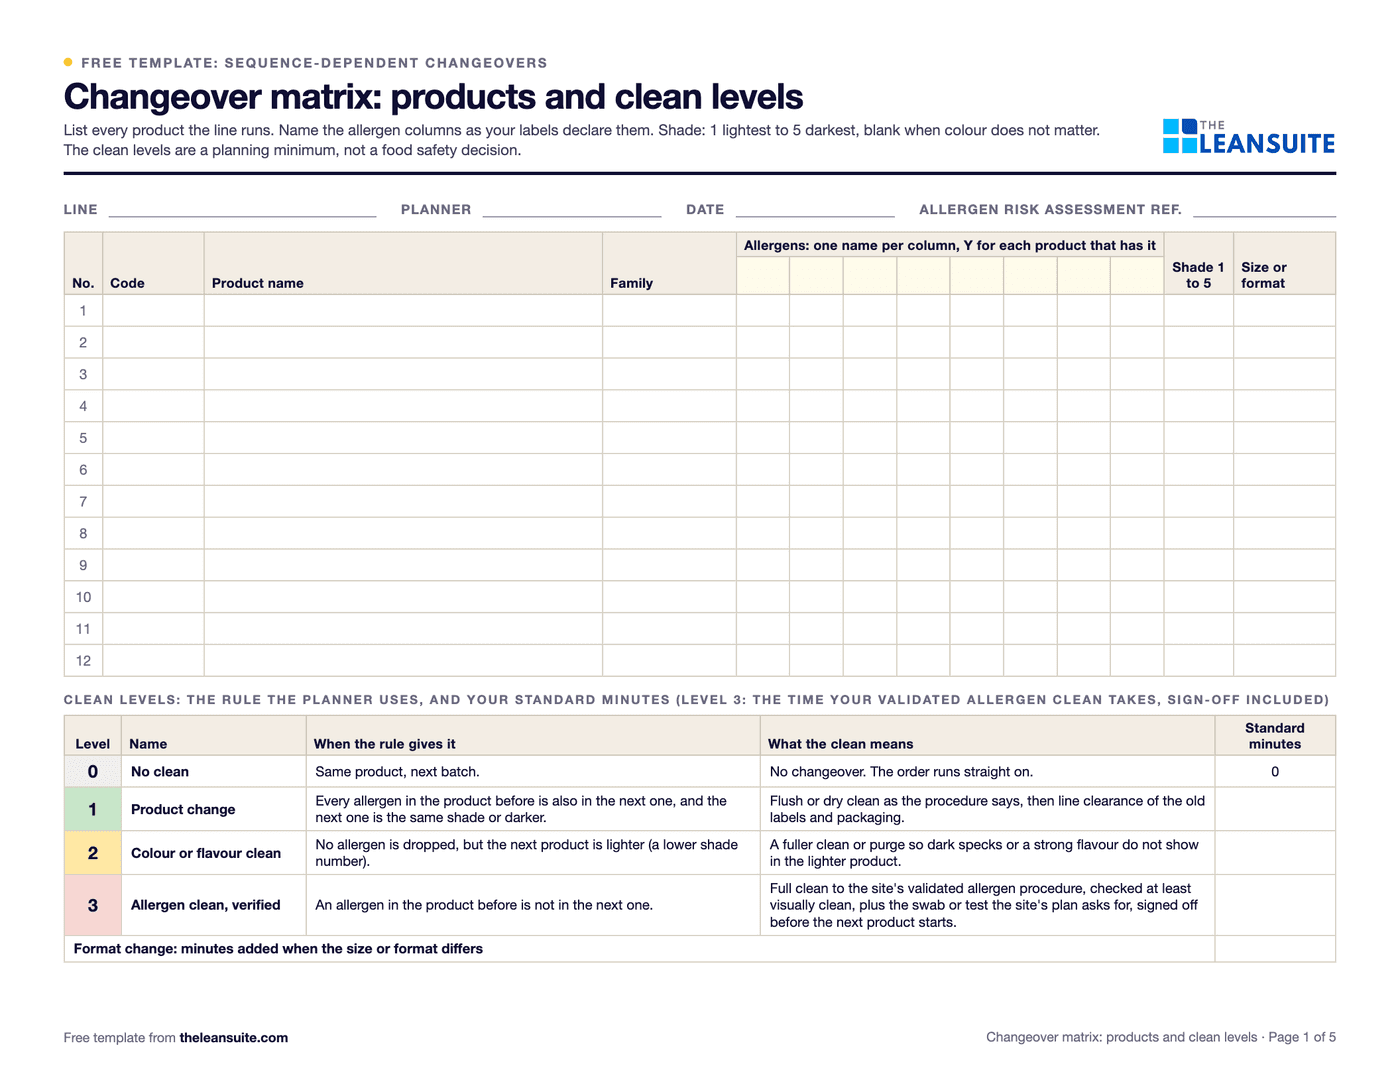 PDF and ExcelChangeover matrix templateA from-to matrix of changeover minutes with the clean each transition needs (allergen, colour, format), and a weekly planner that totals the order and suggests a shorter one.
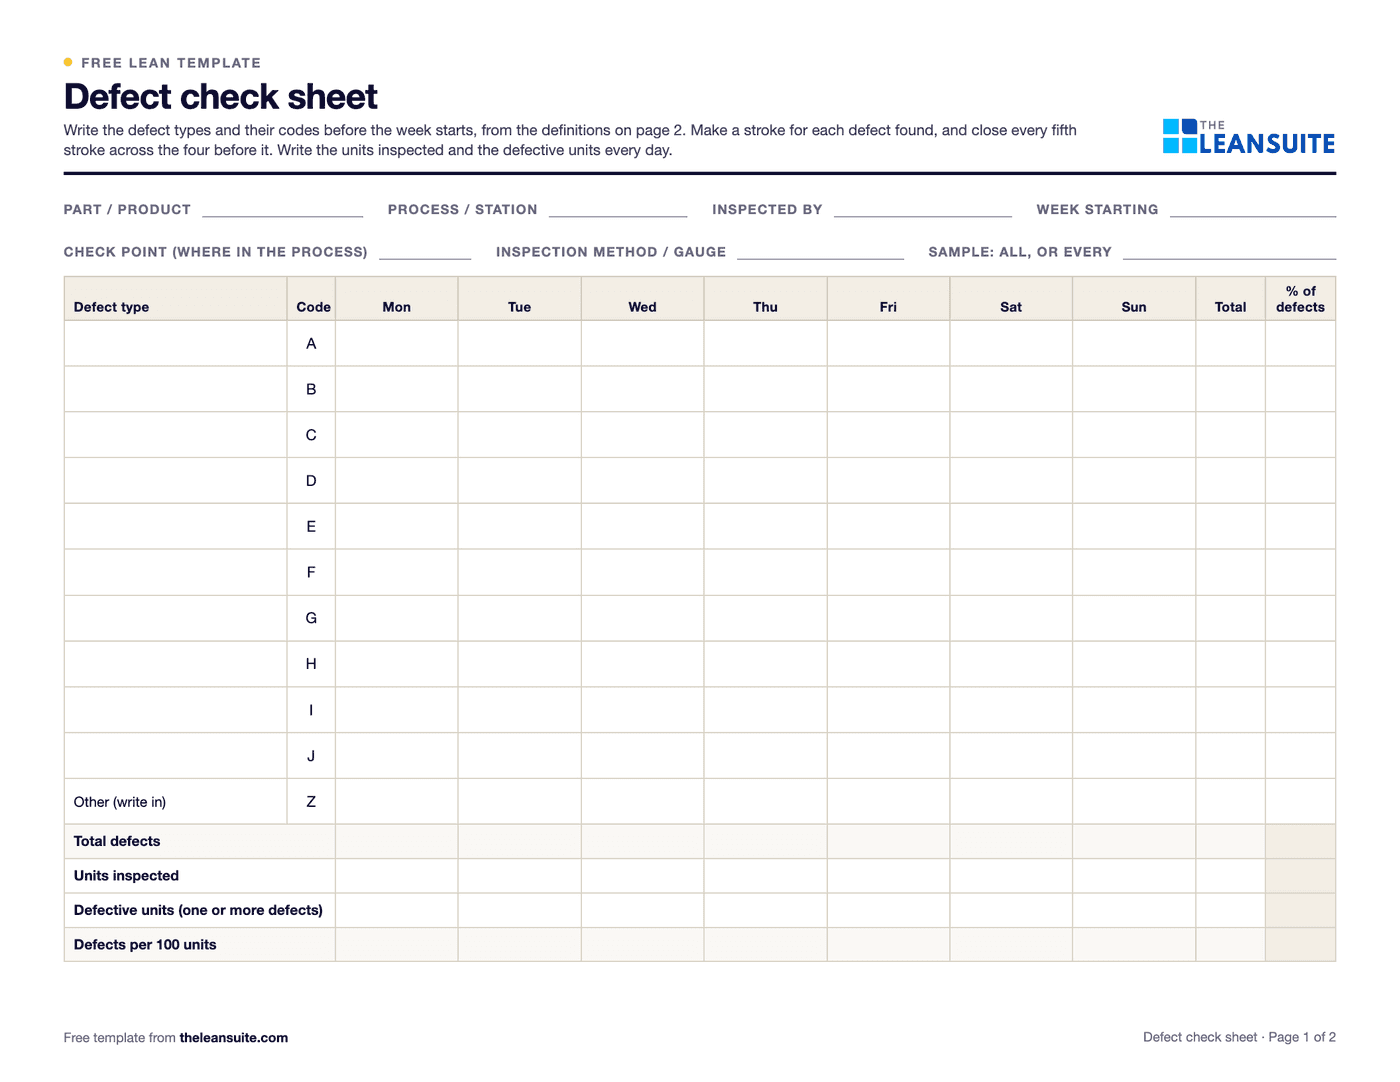 PDF and ExcelDefect check sheetTally defects by type and day, with units inspected, defect rates, a location sheet and the week's Pareto.
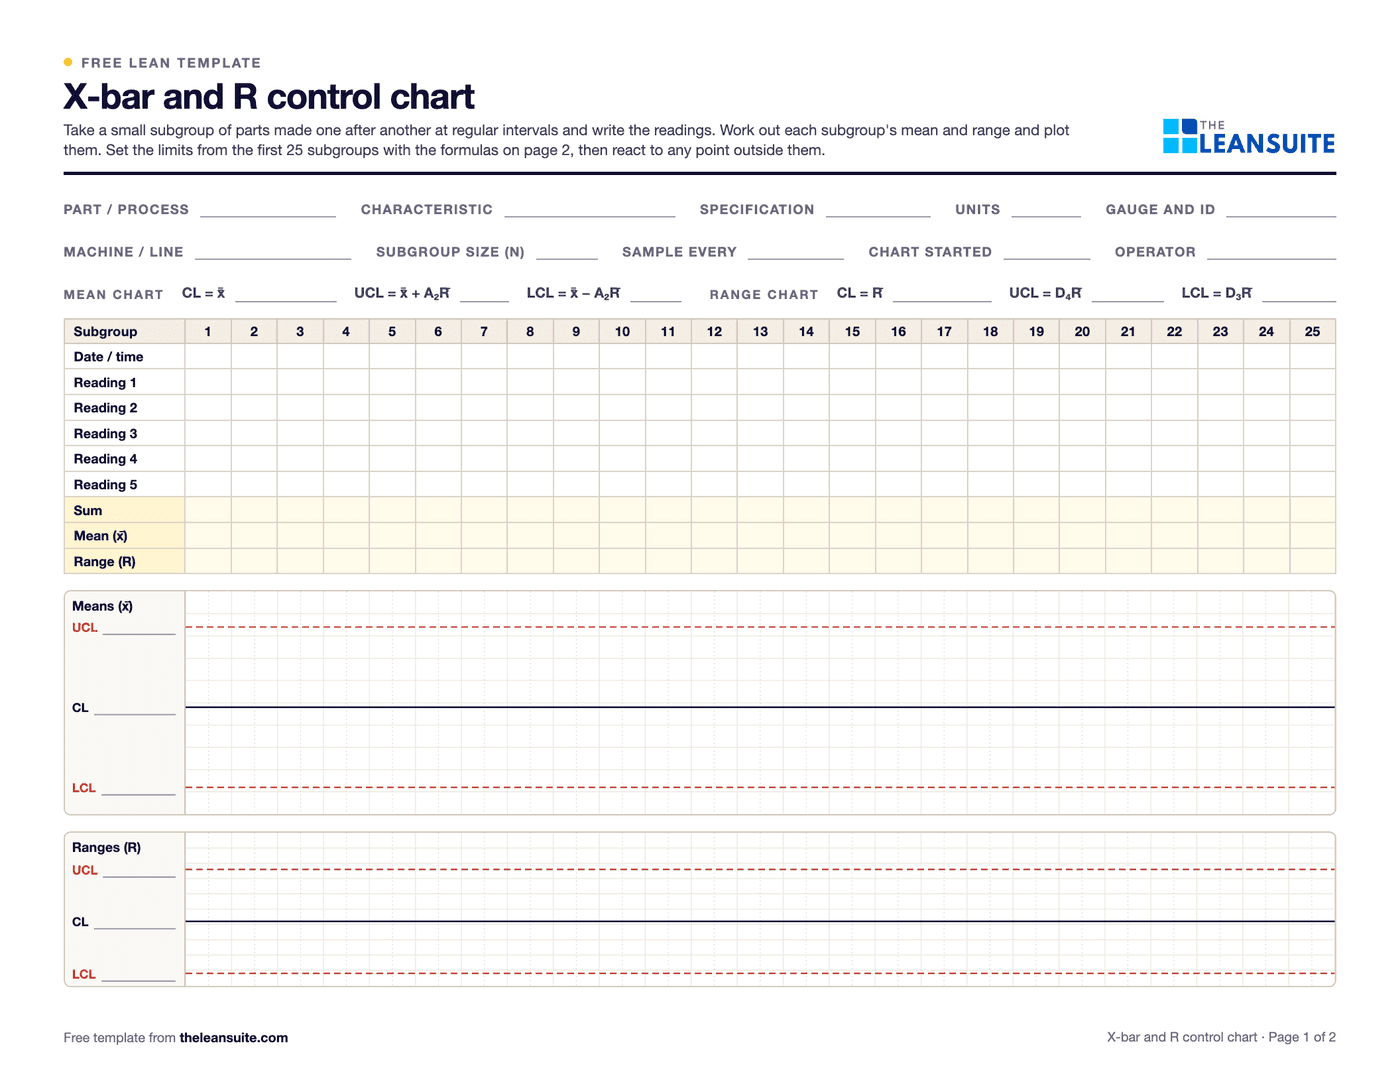 PDF and ExcelX-bar and R control chart template25 subgroups with means and ranges, control limits from A2, D3 and D4, signal flags, both charts and a reaction log.
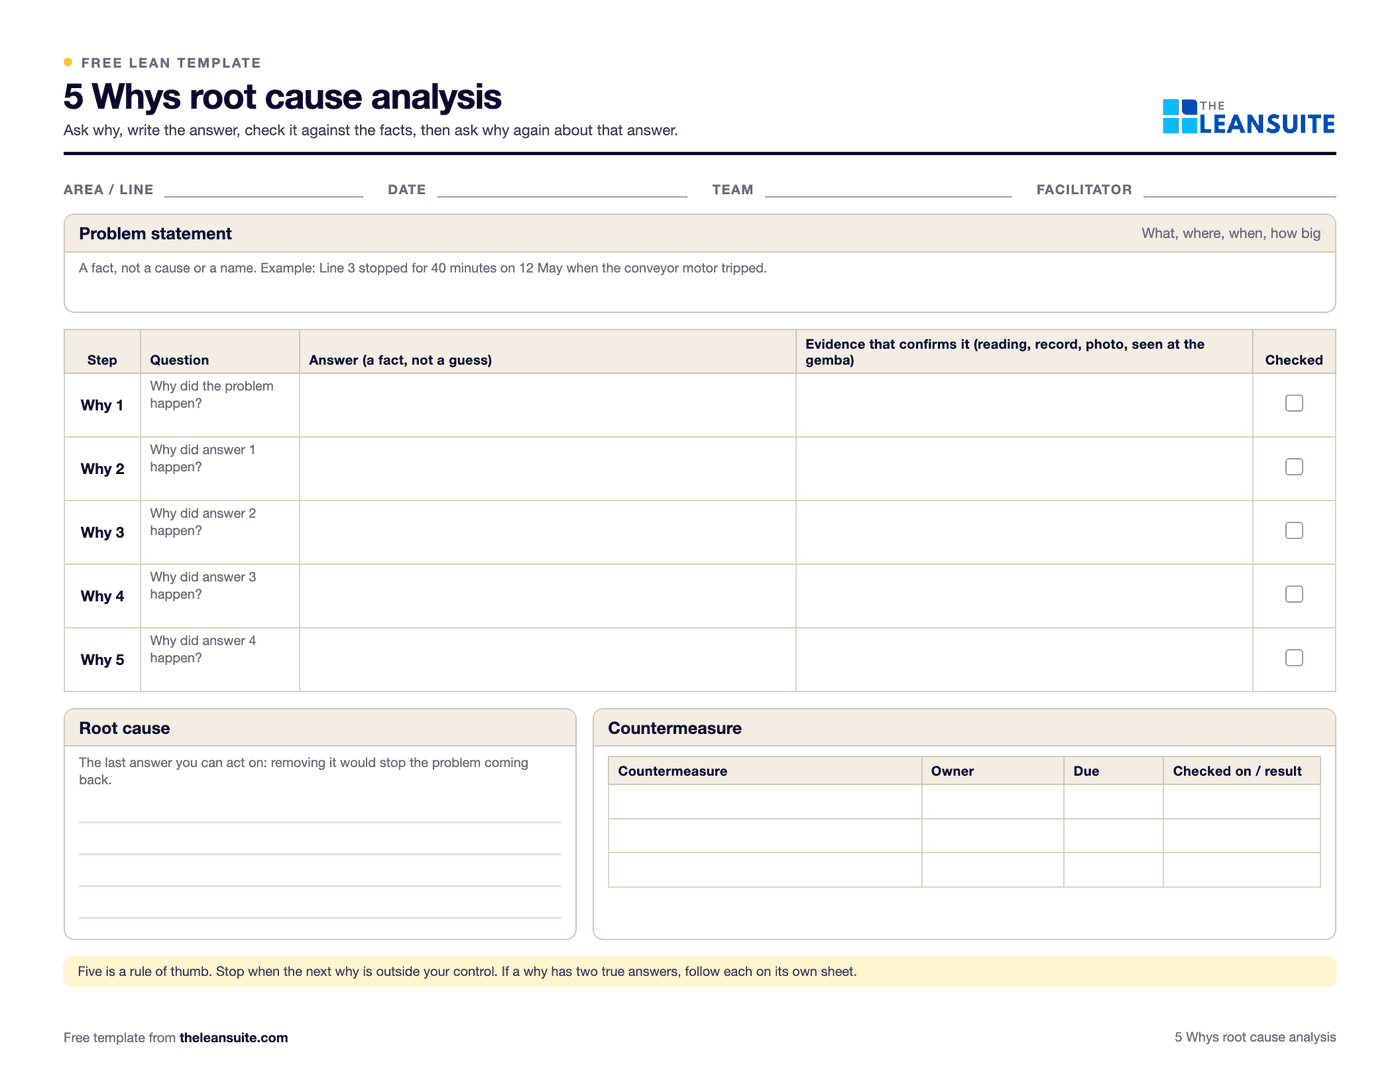 PDF and Excel and Word5 Whys templateA problem statement, a why chain that can branch, evidence for every answer, root causes and countermeasures that are checked.
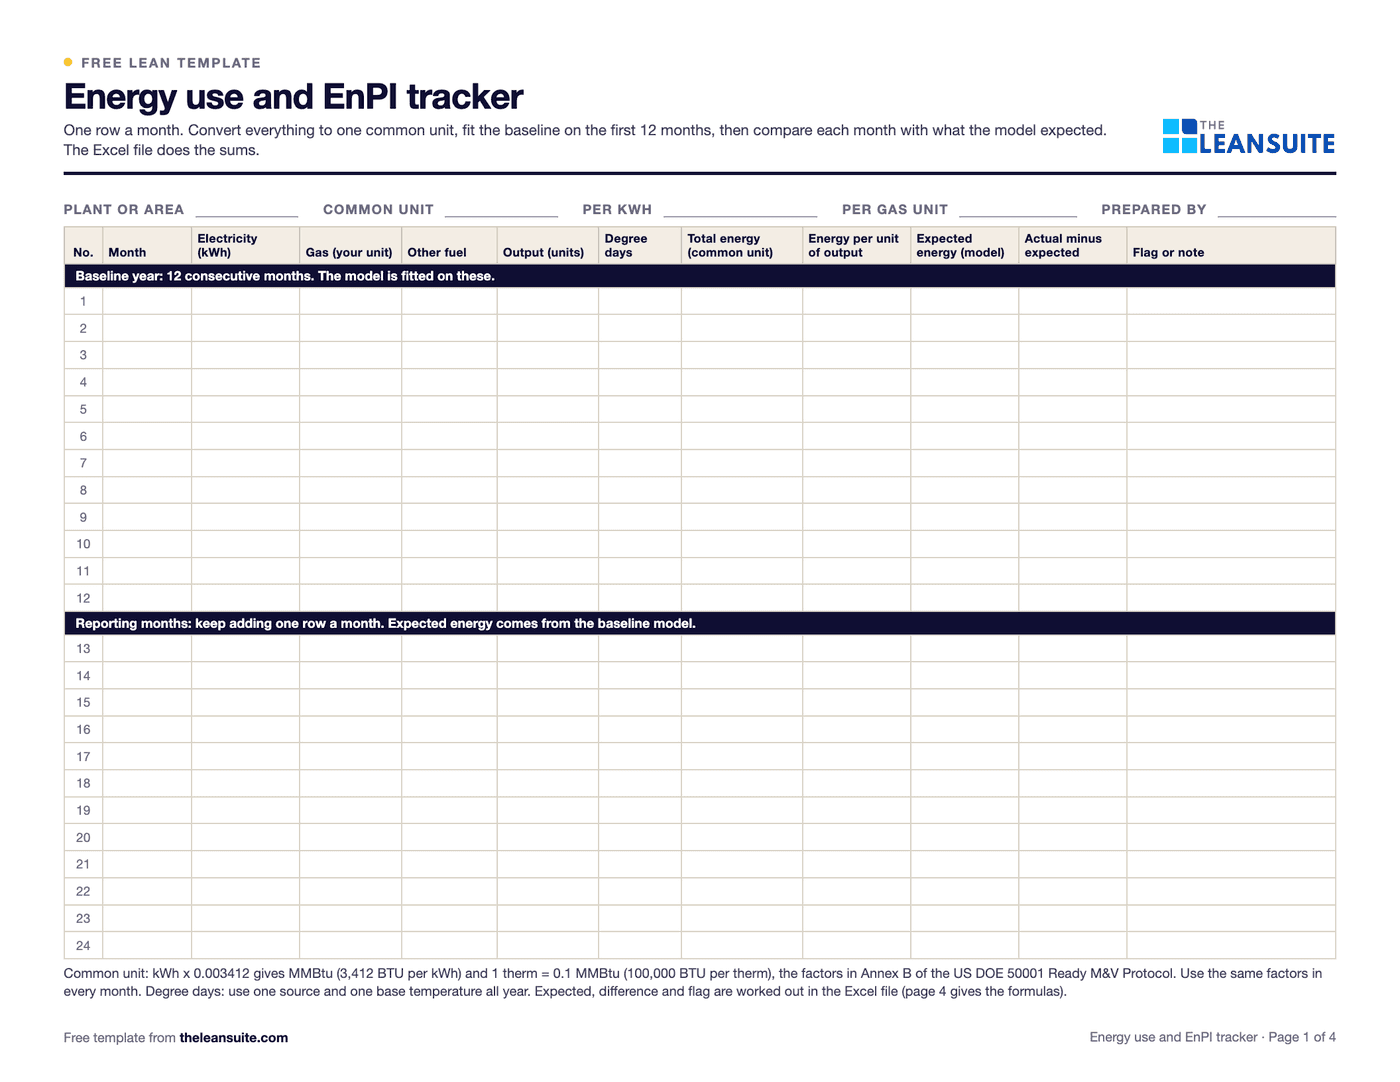 PDF and ExcelEnergy use and EnPI trackerMonthly electricity, gas and fuel in one unit, a 12-month regression baseline, expected against actual energy for each month, an EnPI ratio, the running saving and the tests that say whether the model can be trusted.
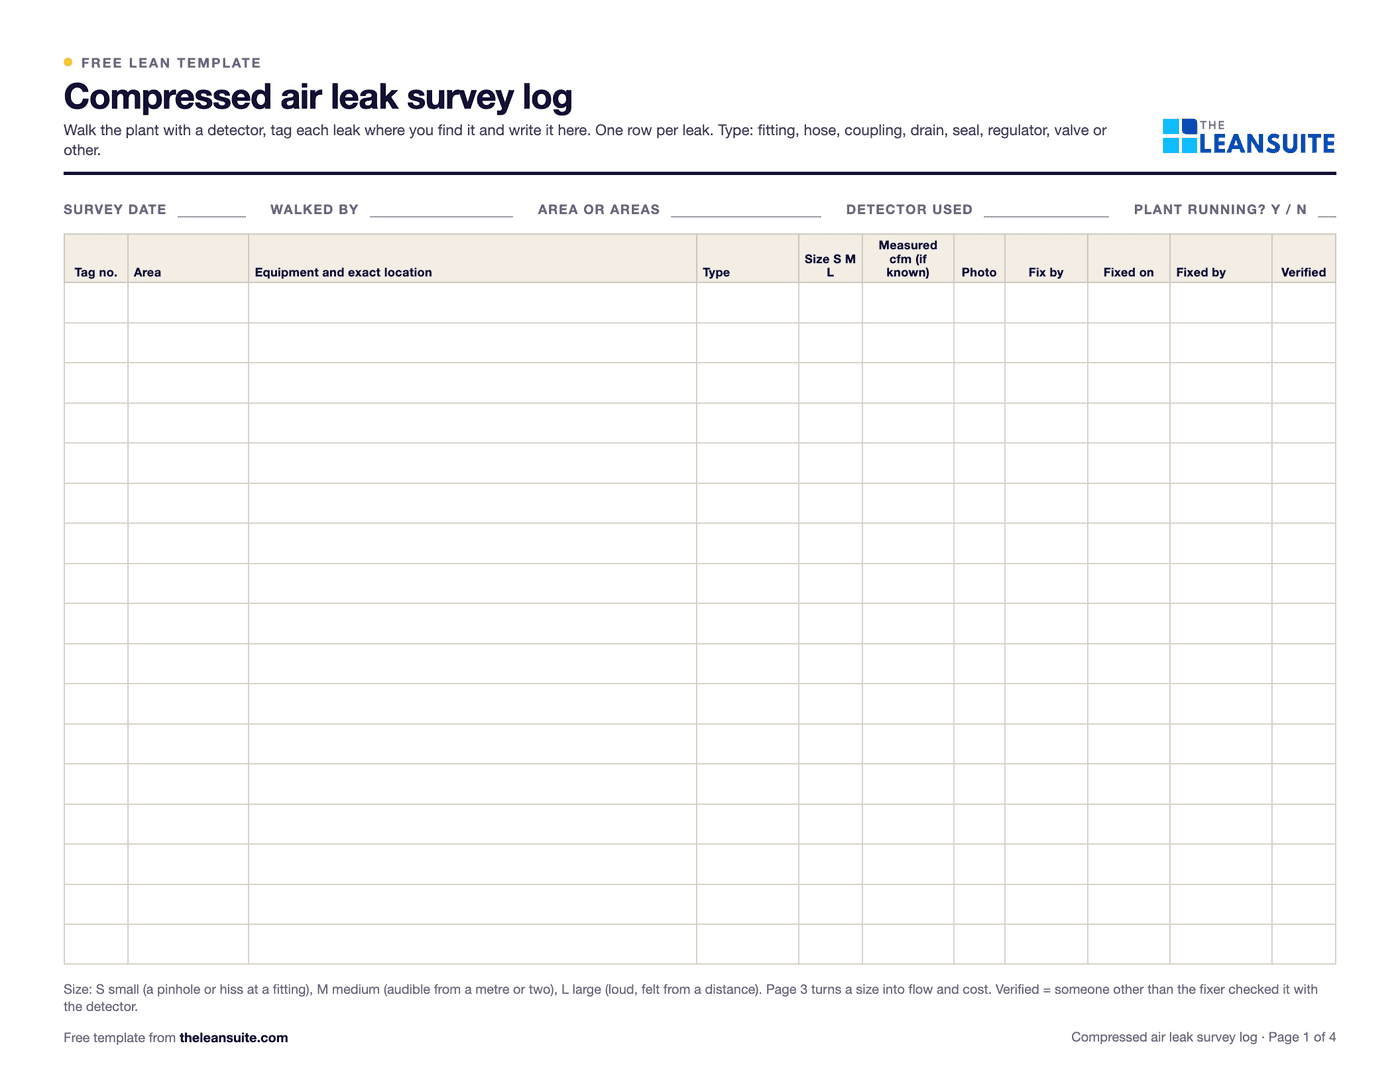 PDF and ExcelCompressed air leak survey logWalk sheet, printable leak tags and a tracker that puts an annual cost on every leak and follows it to a verified fix.
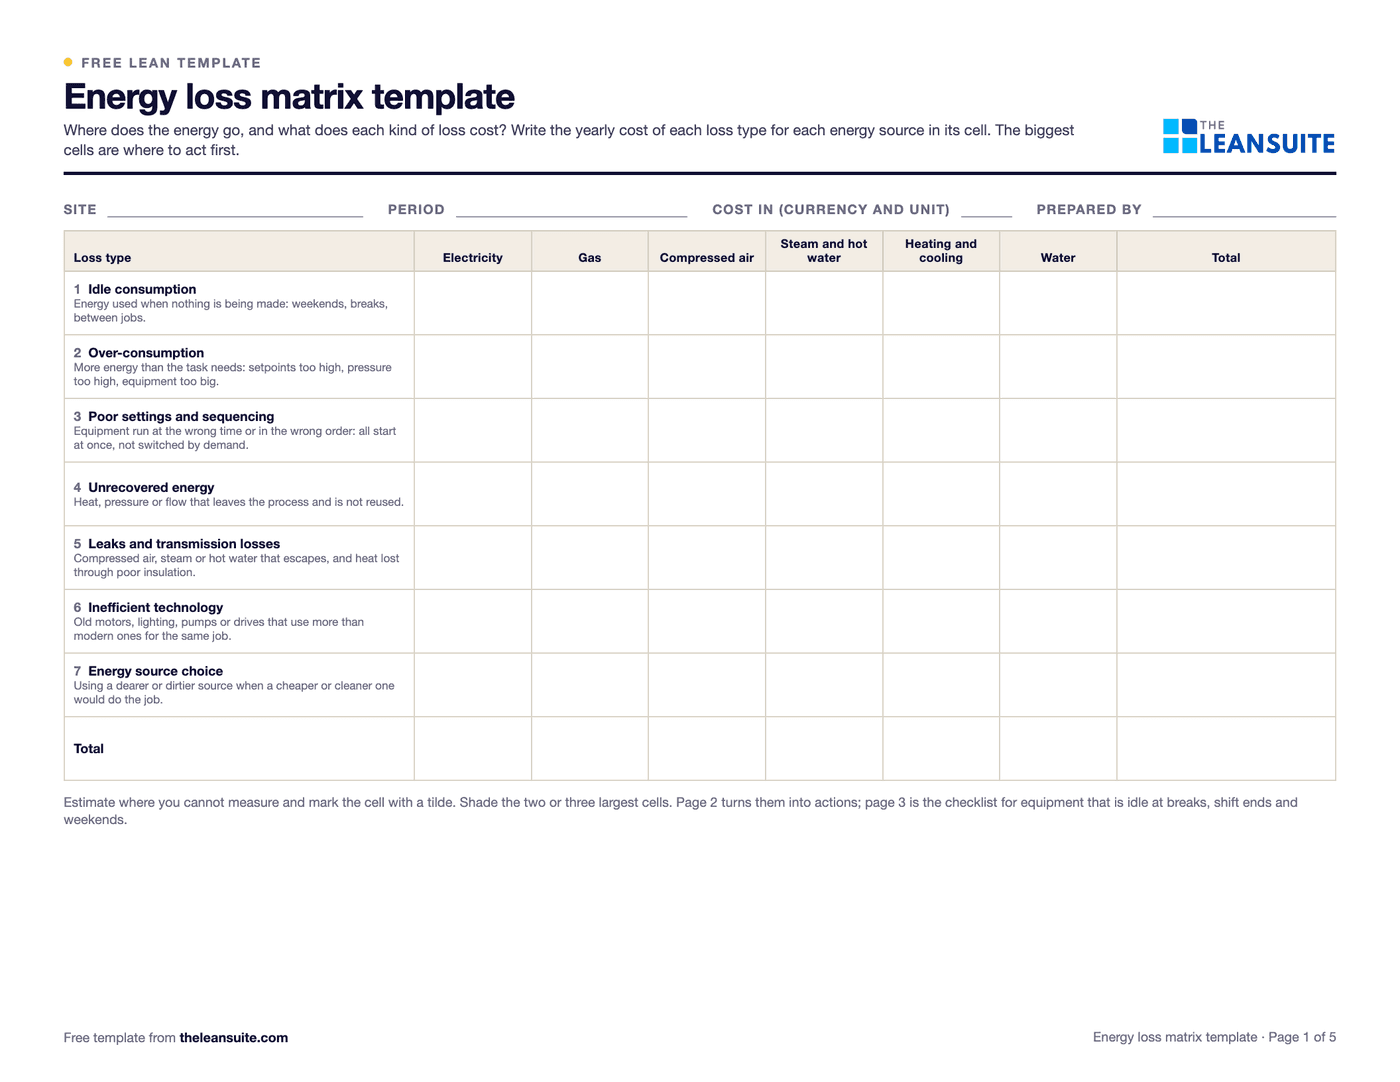 PDF and ExcelEnergy loss matrix templateSeven types of energy loss by six energy sources with a cost in each cell, an action plan and an idle-period shutdown checklist.
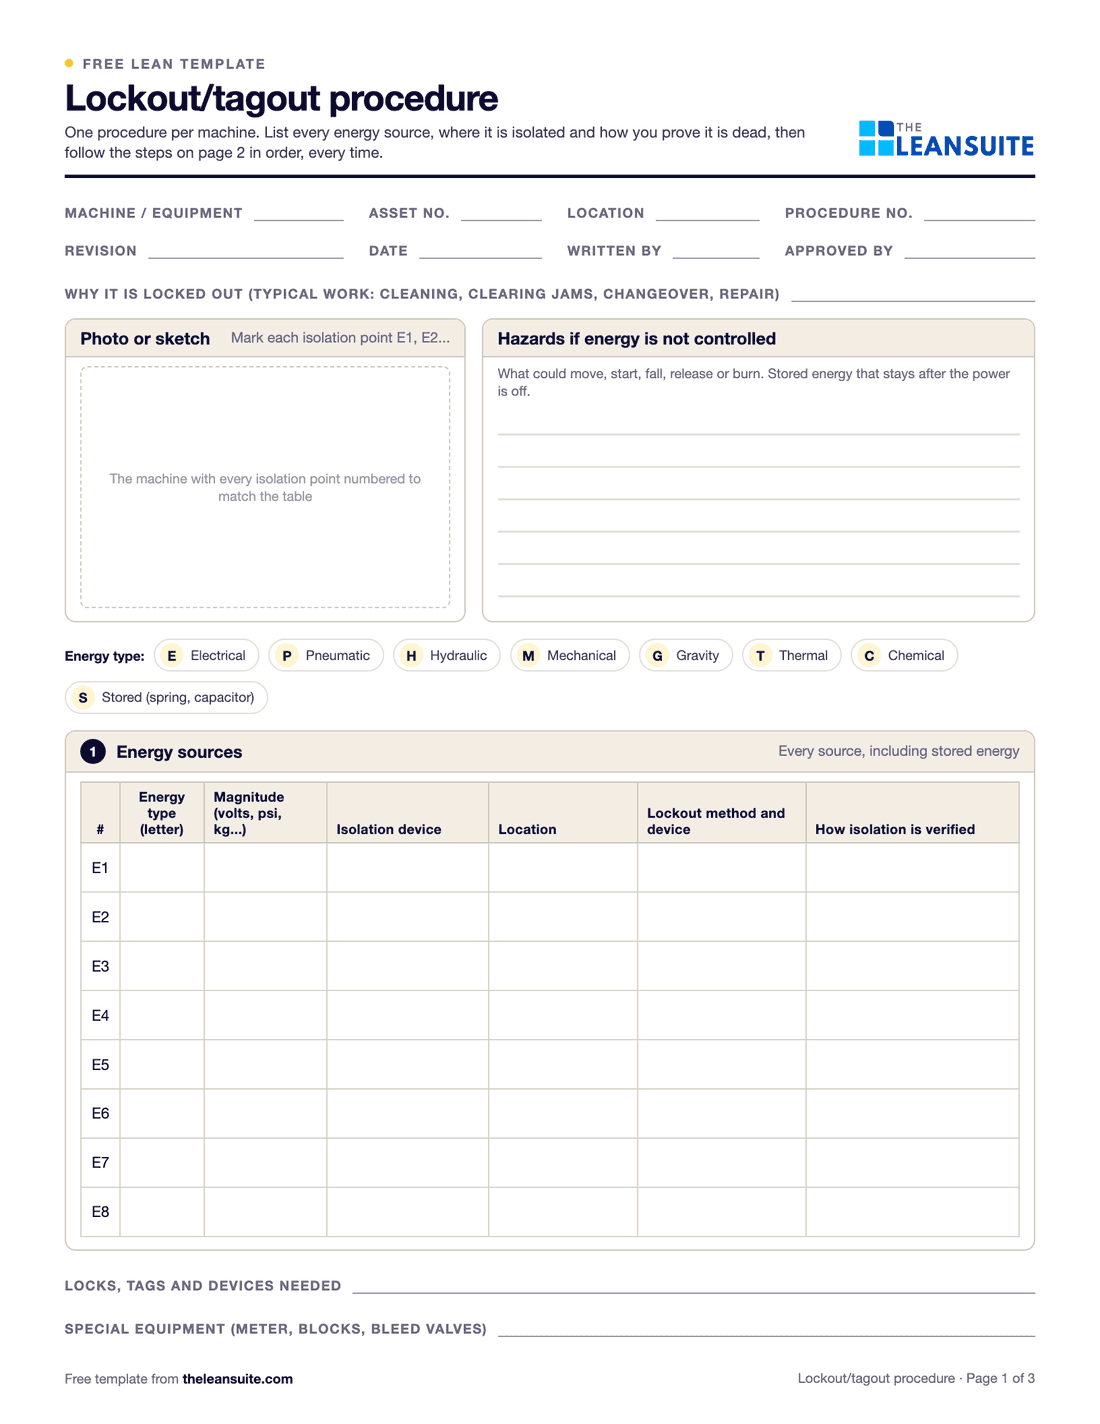 PDF and ExcelLockout/tagout (LOTO) procedure templateA machine-specific LOTO procedure: energy sources and isolation points, the steps from shutdown to restart, and the annual review.
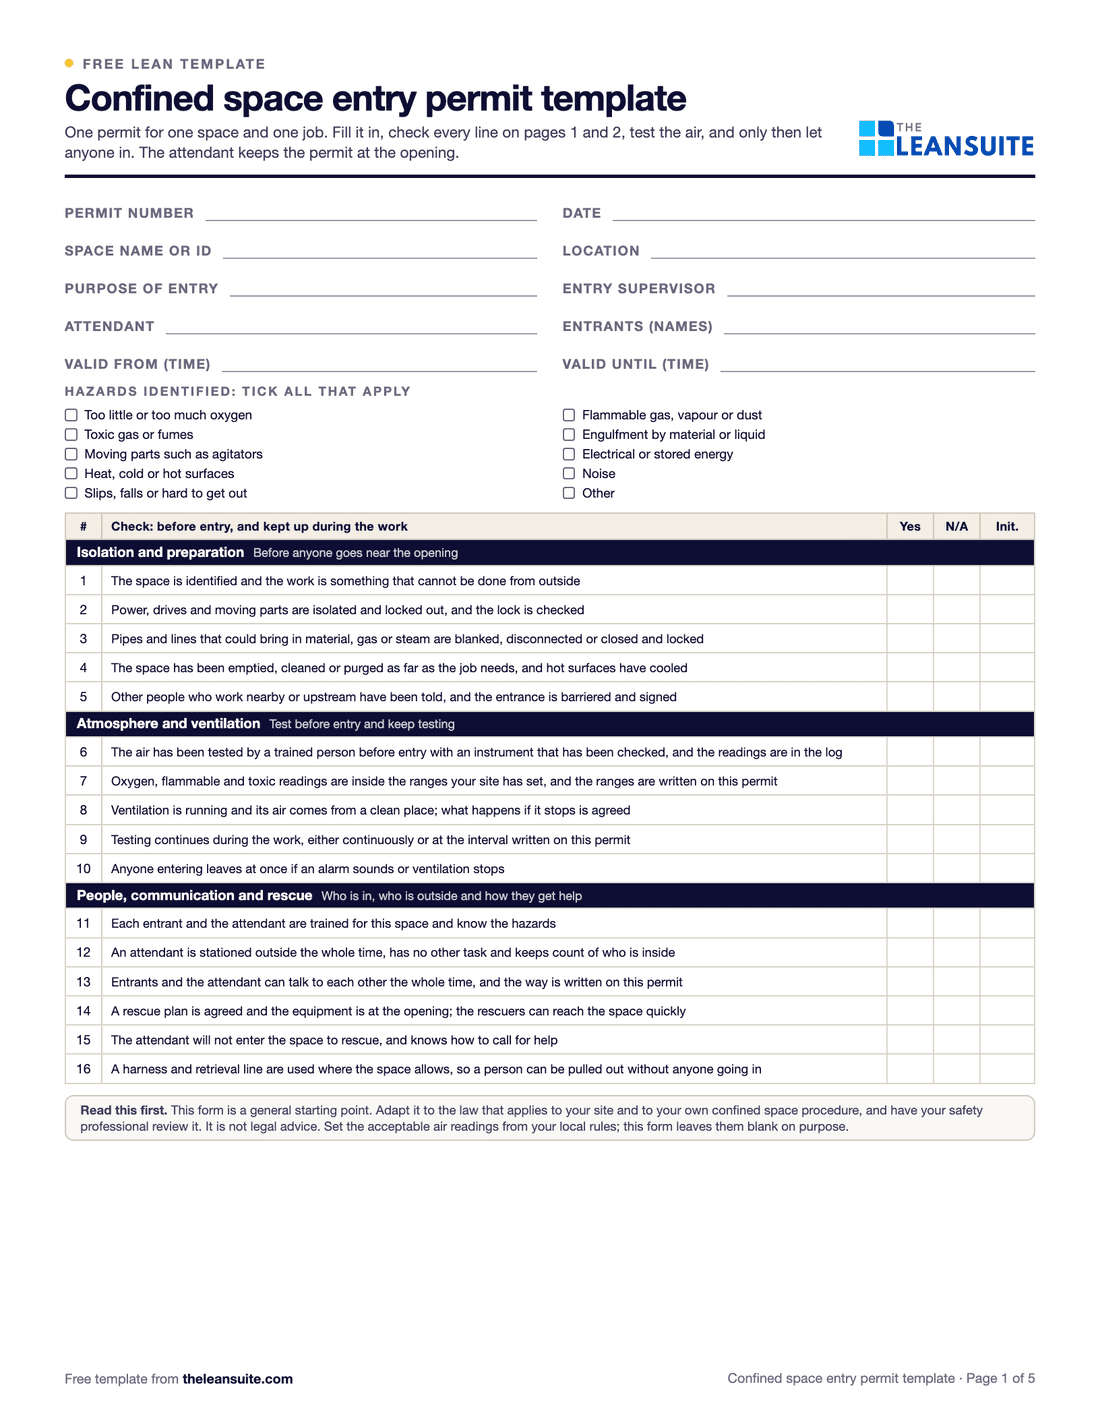 PDF and ExcelConfined space entry permit templateA confined space entry permit with checks, an air test log, an entry log and cancellation, plus an Excel register.
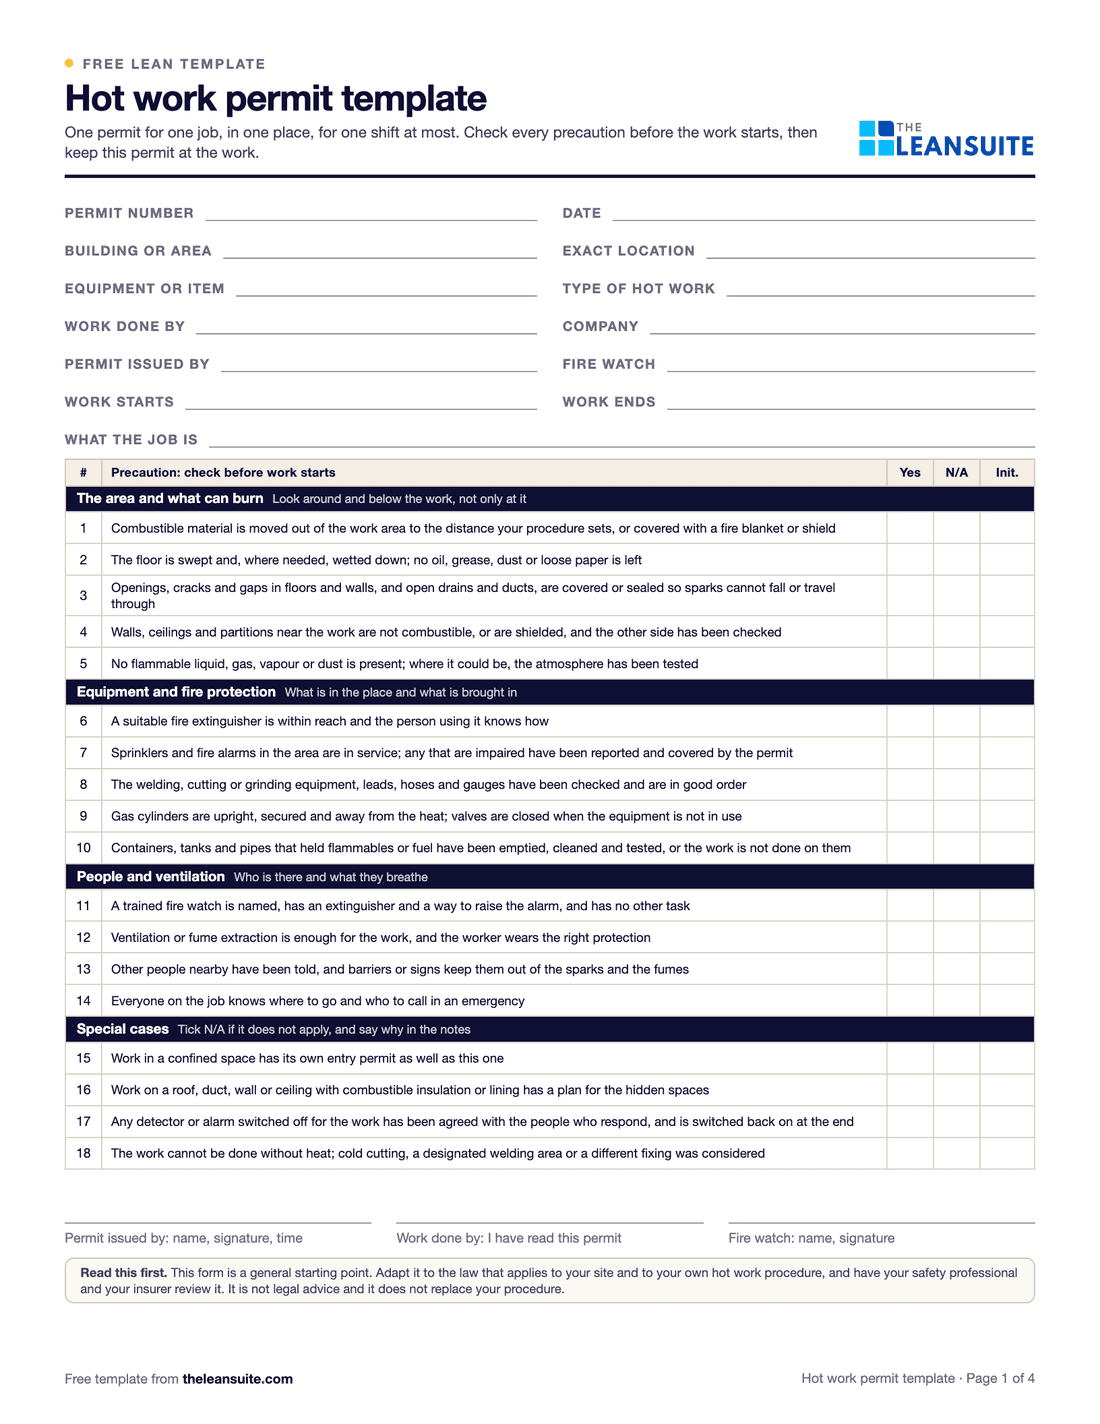 PDF and ExcelHot work permit templateA hot work permit with a precautions checklist, fire watch record and close-out, plus an Excel permit log.
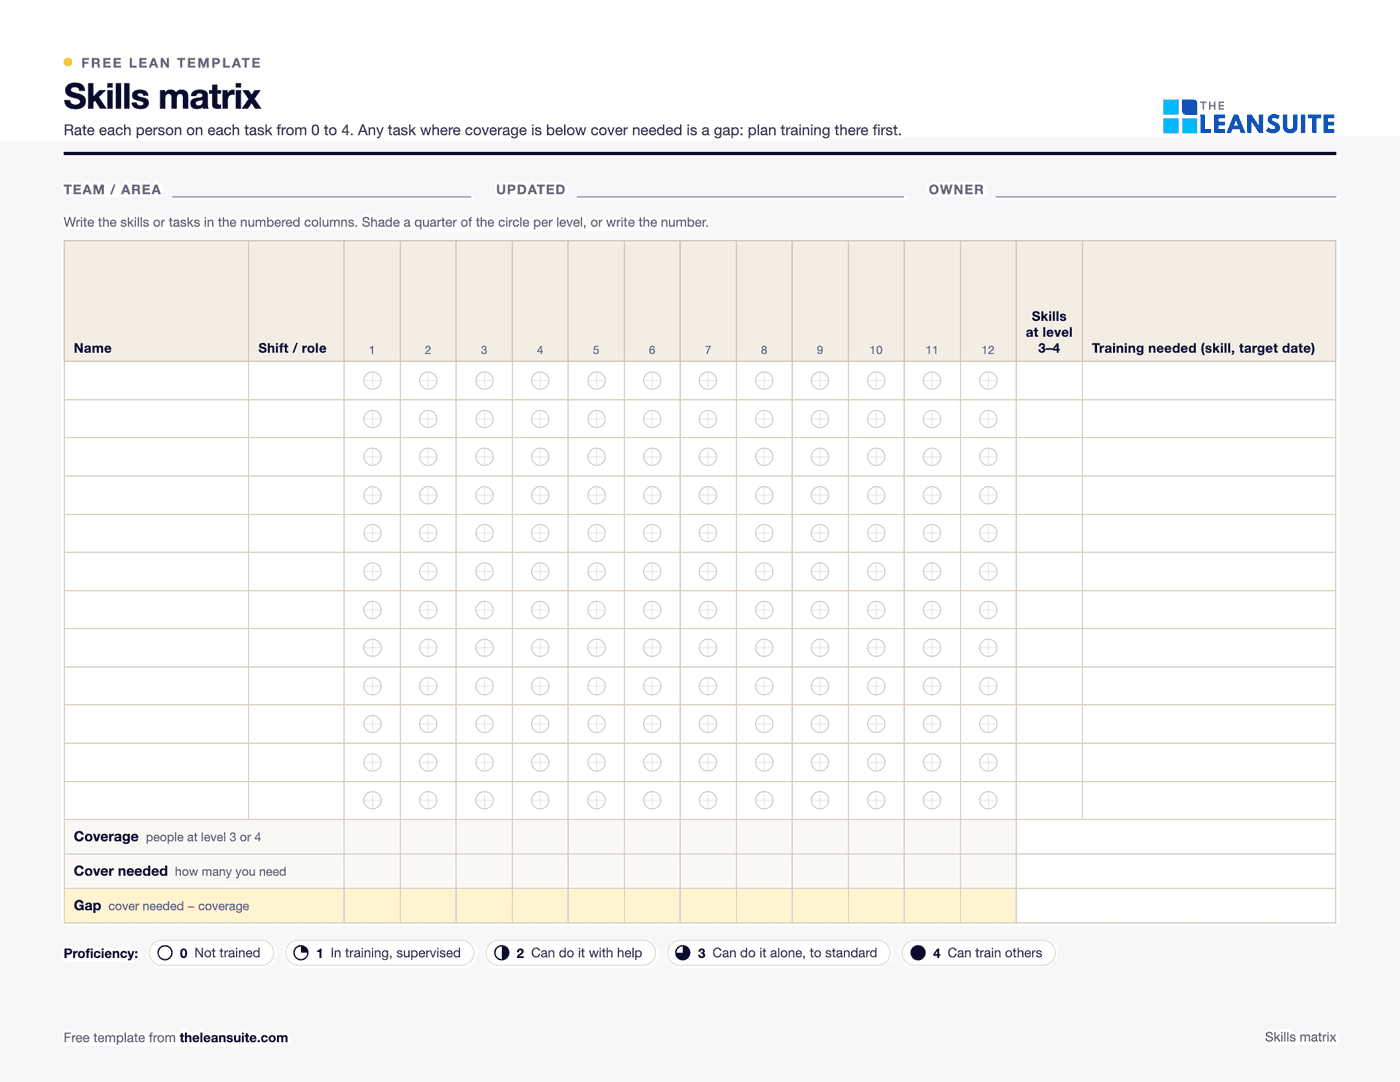 PDF and ExcelSkills matrix templatePeople by tasks on a 0 to 4 scale, coverage and gaps per task and shift, and a training plan that closes them.
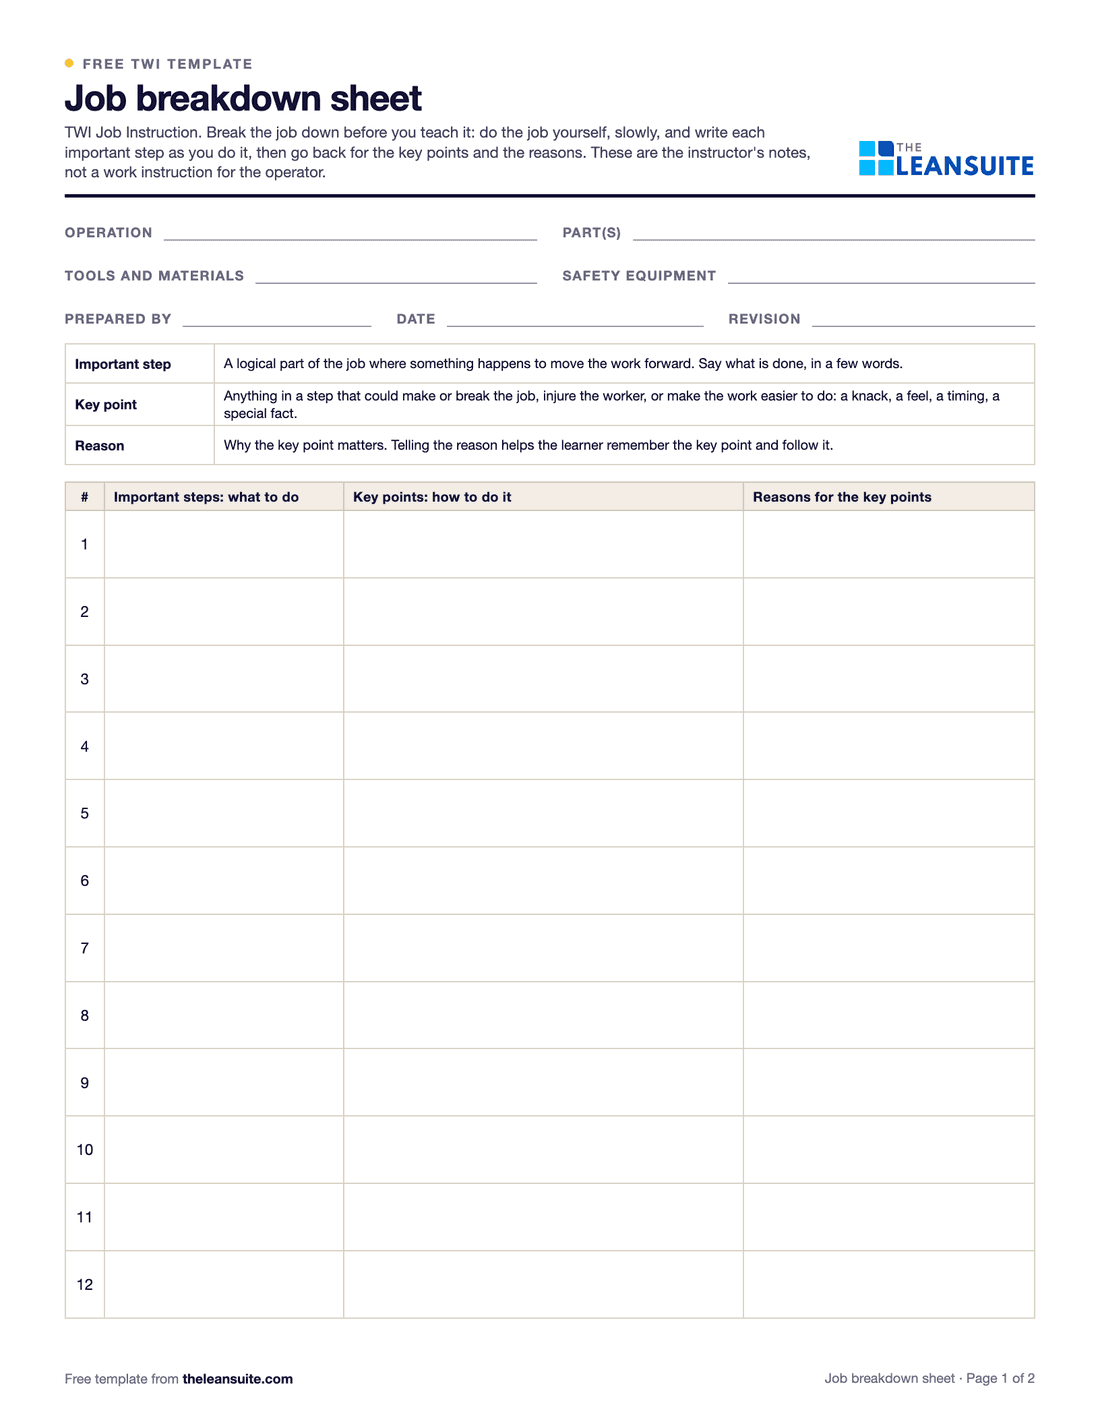 PDF and ExcelTWI job breakdown sheetThe TWI Job Instruction breakdown of a job into important steps, key points and reasons, with a worked example and the four steps.
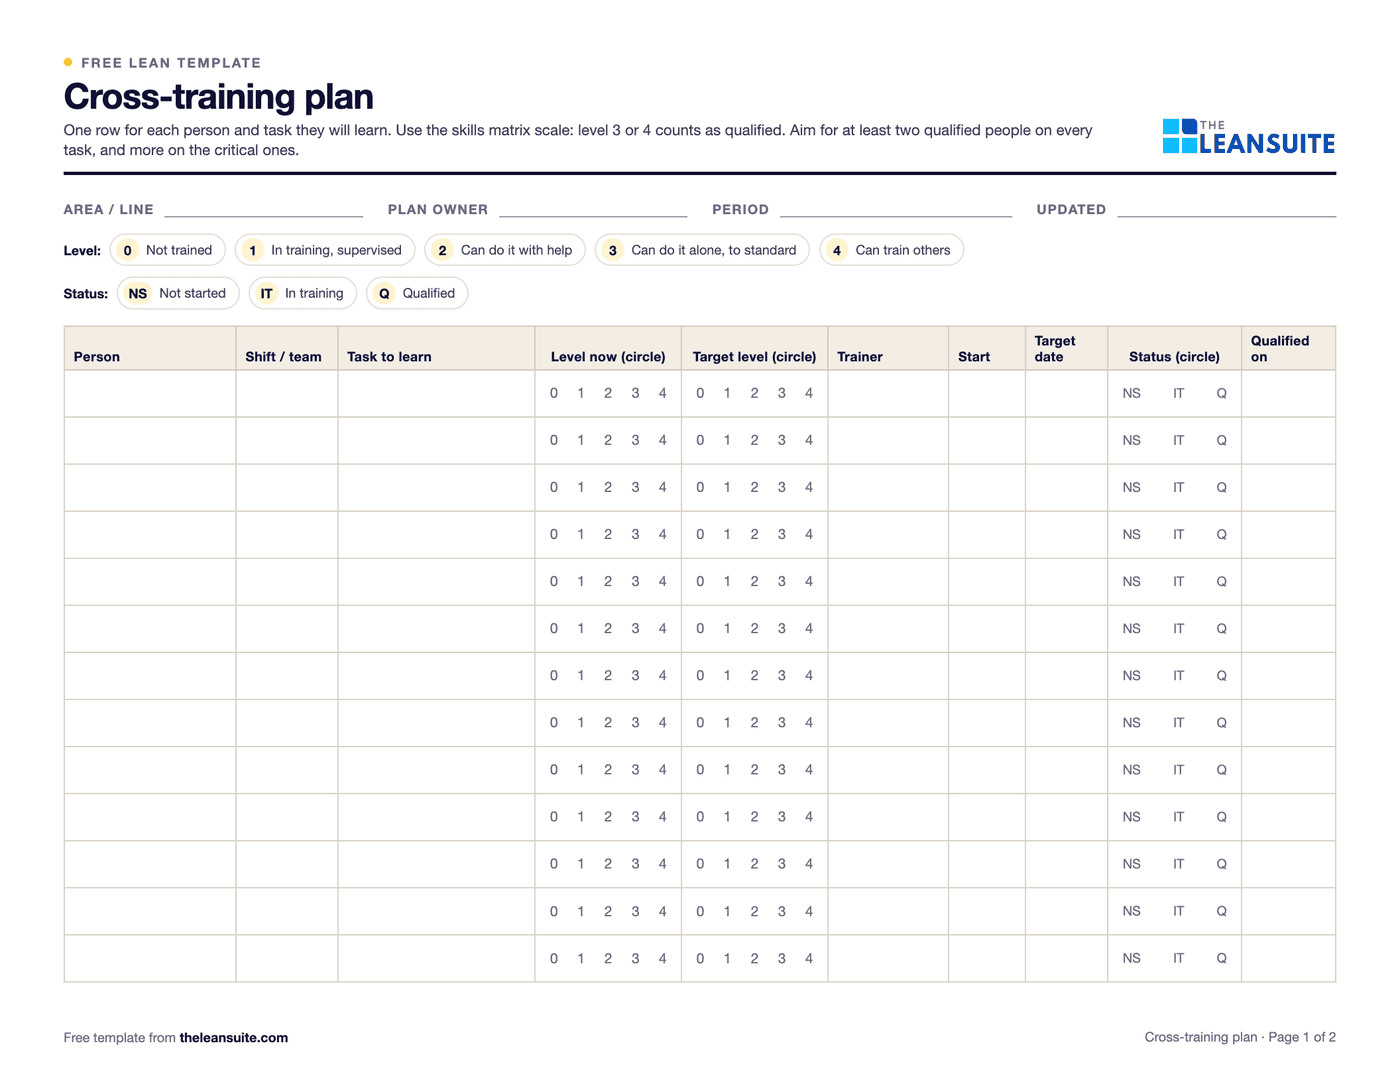 PDF and ExcelCross-training plan templateWho is learning which task, from and to which level, by when, and how many are qualified on each task.
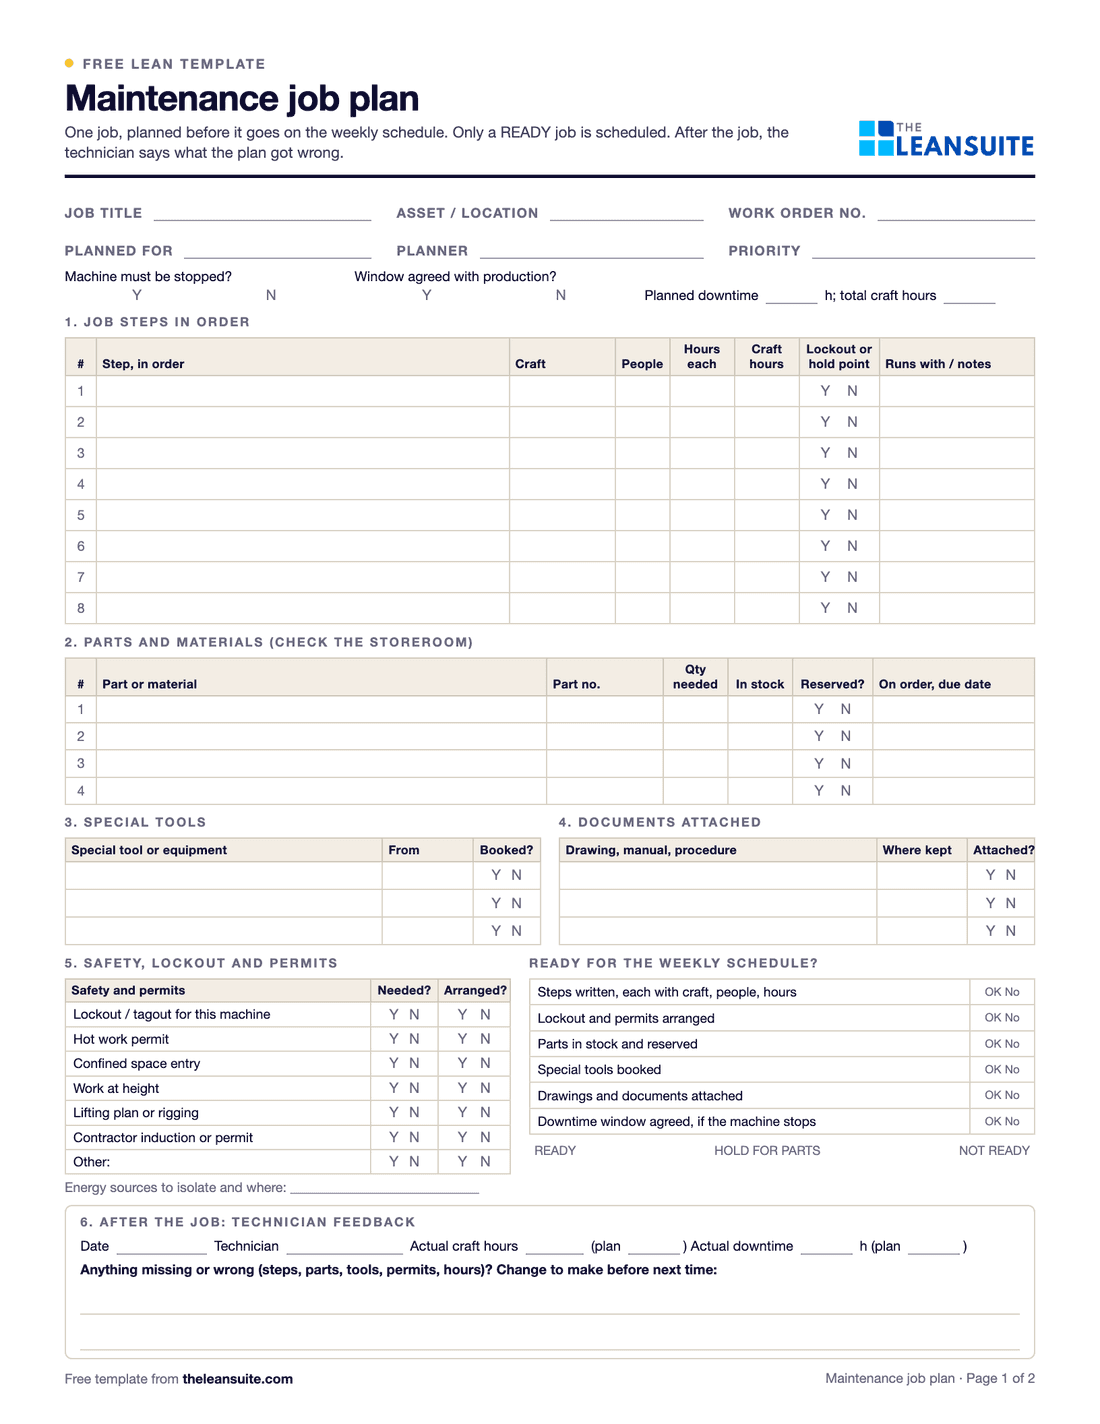 PDF and ExcelMaintenance job plan templateOne job planned on one sheet: steps and craft hours, parts checked against stock, tools, lockout and permits, documents, a ready check for the schedule, and technician feedback.
Calculators (7)
- Free calculatorMTBF and MTTR calculatorMean time between failures, mean time to repair and availability from operating time, failures and repair time.
- Free calculatorDowntime cost calculatorWhat an hour, an event and a year of unplanned downtime cost, from lost output, idle labour, scrap and overtime.
- Free calculatorSMED changeover calculatorTime saved by moving changeover steps from internal to external, capacity freed per week and the smaller batch it allows.
- Free calculatorScrap rate calculatorScrap rate, the cost of scrap per period and per year, and what reaching a target rate would save.
- Free calculatorFirst pass yield (FPY) calculatorFirst pass yield at each step and rolled throughput yield (RTY) across the whole process.
- Free calculatorCompressed air leak cost calculatorAir lost, kW and cost a year for each tagged leak from its size and the pressure, ranked so the biggest gets fixed first.
- Free calculatorOEE calculatorOverall equipment effectiveness from shift time, downtime, ideal cycle time and part counts.
Buyer's guides
LeanSuite pages for these problems
- Loss & Cost Management
- Professional Maintenance Tags
- CILR Checklists
- Autonomous Maintenance
- Autonomous Maintenance Tags
- SMED
- Non-Conformance (NCR)
- Lockout/Tagout (LOTO)
- Near Miss Reporting
- Job Cover Matrix
- Competency Management
- Standard Maintenance Procedures
How LeanSuite handles each of these is on the page for pulp and paper mills.
Whirlpool tackled project visibility and continuous improvement across 14 manufacturing plants with LeanSuite. Read the Whirlpool case study.
FAQ
Lean in pulp and paper mills: common questions
Log every break with its position and likely cause for a few weeks, chart them as a Pareto and attack the worst position first. Run a breakdown analysis with operators and maintenance on each break there, fix the confirmed causes, and add the checks that would have caught them to the operator care rounds. Track breaks per day by position on the shift board.
Mills need both, and they overlap. TPM covers the machine: operator care, planned maintenance and breakdown analysis. Lean adds the tools for flow and waste: SMED for grade changes, standard work across crews, visual boards and problem solving. Most mills start with TPM on the paper machine and add the lean tools as the losses point to them.
There is no single figure to aim for, because broke depends on the grade, the furnish and how often the machine changes grade. Split your own broke by cause (breaks, grade changes, startups and defects), track it per grade and set targets from your best weeks.
Start with a skills matrix per crew to find the positions only one or two people can run. Write job breakdown sheets with the senior operators for threading, grade changes and break recovery, including why each key point matters, and sign successors off with the four-step job instruction method.
Time efficiency on the paper machine, breaks per day by position, broke %, grade change time and steam per tonne. Add OEE and PM compliance once those are measured the same way on every crew.
See LeanSuite on your machine care and losses
Bring the routine you want to fix first. We will show you how LeanSuite handles it and what a 90-day pilot would cover.