

Lean playbook · Electronics and PCB assembly
Lean playbook for electronics and PCB assembly plants
Short answer
Start lean in an electronics plant on one SMT line, with losses you can count. Good ones are changeover time, defects per million opportunities at AOI and test, and first pass yield. SMED moves feeder setups off the running line. A defect tally by cause sends solder problems back to the printer and the profile, and a first article check stops a wrong part from running through a whole lot. Keep IPC-A-610 as the yardstick for what counts as a defect, and change nothing your customer has frozen without their approval.
Last updated:
7 problems on the floor, and the lean methods for each
Each problem says what it looks like, which methods address it, the first moves to make and the number to watch. Pick the one or two that cost your plant most; you do not need all of them at once.
Where an SMT and box build line loses time and quality
Kitting and feeder setup
SMT: paste print, placement and reflow
Through-hole, wave and selective solder
Test and box build
Across the whole line
Long SMT changeovers in high mix
The line stops while feeders are swapped, the stencil and program are changed and the first board is checked. Feeder carts are often loaded after the previous job ends, and a reel in the wrong slot shows up later at AOI.
In LeanSuite
Run each changeover as a visual checklist in Lean Creator and require a photo on the steps that matter most.
First moves
- Film one changeover from the last good board of the old job to the first good board of the new one, and list every step.
- Load and verify the feeders for the next job on a spare cart or offline while the current job runs.
- Group jobs that share parts so fewer feeders change, and keep the common parts in fixed slots.
- Write the new sequence down as standard work and time every changeover against it.
Number to watch: Changeover time, last good board to first good board, per job pair.
Solder defects fixed by hand instead of at the cause
AOI, X-ray and test find bridges, opens, insufficient solder, tombstones and voids, and a technician touches them up. The board ships, but the cause at the paste printer, the reflow profile or the pad design stays, and the same defect comes back next week.
In LeanSuite
Issue Management logs each defect where it is found.
First moves
- Tally every defect by type, board location and stage on a check sheet for two weeks.
- Make a Pareto of the tally and take the top defect to the stage that makes it, which is often the paste print.
- Check the paste print first: stencil condition, cleaning frequency, paste handling and support under the board.
- Fix the cause, then watch the same defect on the tally for two more weeks before you close it.
Number to watch: Defects per million opportunities at AOI, by defect type.
First article inspection on new jobs and revisions
Before a lot runs, the first board is checked against the bill of materials, the assembly drawing and the customer's IPC class: every part, value, polarity and orientation. When the check is slow or done from memory, either the line waits or a wrong part runs through the whole lot.
Lean methods
In LeanSuite
Build the first article check in Lean Creator as a checklist with number limits, required photos and signatures.
First moves
- Write a first article checklist per product family: part numbers and values against the BOM, polarity and orientation, solder joints to the class, and the program and stencil revision.
- Run it on the first board of every new job, new revision and changed setup, and hold the lot until it passes.
- Use a golden board or an approved photo where the customer allows one, so the check is a comparison, not a search.
- Record each failed item as a defect with its cause, so first article failures feed the same tally as AOI.
Number to watch: First article pass rate first time, and minutes from setup end to first article sign-off.
ESD control that slips between audits
Wrist straps, heel grounders, mats, ionizers, carts and ESD bags all need checking. A missed check rarely fails anything that day: the damage can be latent, so a board passes test and fails later in the field.
Lean methods
In LeanSuite
Build the ESD audit in Lean Creator, or let the AI draft it, and schedule it in Daily Standard Work to a person, a role or a machine, with a repeat rule.
First moves
- Mark the ESD protected areas on the floor and post what is required at each entrance.
- Log a wrist strap and footwear test at the start of every shift for every person in the area.
- Audit a sample of workstations each week against your ESD control plan, with a photo of each finding.
- Close each finding with an owner and a date, and track repeat findings by area.
Number to watch: ESD audit findings per week, and shift-start tests logged against the people in the area.
IPC certification held by too few people
Inspection, hand soldering and rework are often limited to people trained and certified to IPC-A-610, J-STD-001 or IPC-7711/7721. Certificates lapse, and when the certified people are on one shift, the others wait for an inspection or put someone uncertified on the job.
Lean methods
In LeanSuite
Competency Management keeps a live skills matrix whose levels update as people complete training and on-the-job sign-offs.
First moves
- List each role that needs a certificate and who holds one, with the expiry date, in a skills matrix by shift.
- Mark the roles with fewer than two certified people per shift and plan training for those first.
- Teach hand soldering and inspection with job instruction on your own boards, and sign each person off on the job.
- Put renewals on a calendar a few months before each certificate expires.
Number to watch: Roles with at least two certified people on every shift.
Test failures and no fault found
Boards that fail in-circuit or functional test queue at the repair bench. The technician finds a fault, or finds none and retests until the board passes. The cause is rarely written down, so repeat failures and no-fault-found returns never reach engineering.
In LeanSuite
Each non-conformance is captured with photos and routed to quality and engineering.
First moves
- Record every test failure with the failing test, the fault found and the repair, including no fault found.
- Limit retests: a board that fails twice goes to a technician, not back through the tester.
- Review the top failures each week with test, process and design engineering.
- Run a full root cause analysis, such as an 8D, for any failure that reaches a customer.
Number to watch: First pass yield at test, and the share of failures with no fault found.
Shortages found at kitting or on the line
A job is kitted, then a reel turns out short, a part is missing or a moisture-sensitive part has run past its floor life. The line waits or the job is split, the time lost is rarely logged, and the same shortages come back.
In LeanSuite
Log lost production by cause, from breakdowns and changeovers to material shortages, and use it to fix maintenance and scheduling.
First moves
- Kit and check the next job a full shift before it is due on the line, not at the changeover.
- Log every wait for parts with the part number and the cause, using fixed reason codes.
- Track moisture-sensitive parts by the time they have spent out of dry storage, with the limit on the label.
- Review the shortage log each week with planning and purchasing, and fix the top causes.
Number to watch: Line minutes lost to material each week, by cause.
More small fixes in the production, quality and warehouse sections of the kaizen idea bank.
A 90-day starting plan
One line or product family, two problems, measured before and after. The point of the first 90 days is a result the plant believes and a method it can repeat, not a plant-wide program.
The 90 days, with the gate that ends each stage
- Days 1 to 30See the losses on one SMT lineDone when: You have baseline numbers on the board and two problems with an owner each.
- Days 31 to 60Fix the top two lossesDone when: Each fix has a written standard and a before-and-after number.
- Days 61 to 90Make it stick, then spread itDone when: The gains have held for a month and the next line has its baseline.
Days 1 to 30
See the losses on one SMT line
Pick one line and get a true baseline before changing anything.
- Choose the line with the most changeovers or the most touch-up, and name a line lead and a sponsor.
- Measure for two weeks: changeover times, defects by type at AOI and test, first article results and minutes lost to material.
- Start a 15-minute meeting at the line board at the start of each shift.
- Check the skills matrix for the line: who is certified for inspection, soldering and rework on each shift.
- Choose the two biggest losses to work on first.
Days 31 to 60
Fix the top two losses
Run focused improvements on the two problems and check them against the baseline.
- Run a SMED workshop on the most frequent changeover and move feeder setup off the running line.
- Take the top solder defect from the Pareto to the stage that makes it and fix the cause there.
- Put the first article checklist in place for every new job and revision.
- Write each new method down as standard work or a one-point lesson as soon as it works.
Days 61 to 90
Make it stick, then spread it
Check the new standards hold on every shift, then copy them to the next line.
- Audit the new standards and the ESD controls on every shift with short layered audits.
- Train and sign off operators on the changes, and close the certification gaps found in days 1 to 30.
- Compare the line's numbers with the baseline and share the result with the plant.
- Pick the next line, copy what worked and start again at day one.
The KPIs to track
Track them per line and shift, on a board the team sees every day. Set targets from your own baseline, not from someone else's plant.
| KPI | What it tells you | How to measure it | Free help |
|---|---|---|---|
| First pass yield | The share of boards that pass AOI and test the first time, with no touch-up or repair. | Boards passing first time divided by boards started, at each inspection and test stage, per shift. | First pass yield (FPY) calculator |
| DPMO | Defects against the number of chances to make one, so boards of different sizes compare fairly. | Defects divided by (boards inspected times opportunities per board), times 1,000,000. Define opportunities once, for example parts plus solder joints, and keep the definition. | DPMO and sigma level calculator |
| Changeover time | How long the line is down between jobs, and whether the new standard is followed. | Last good board of one job to first good board of the next, for every changeover, by job pair. | SMED changeover calculatorChangeover matrix template |
| SMT line OEE | How much planned time made good boards at the rated speed, and whether availability, performance or quality loses most. | Availability times performance times quality, per shift, on the placement machine that sets the line's pace. | OEE calculator |
| Rework hours | The labor spent on touch-up and repair, which is capacity the line has already paid for once. | Touch-up and repair time per shift from the rework log, split by defect type. | Defect check sheet |
| Certified coverage | Whether inspection, soldering and rework can be staffed by certified people on every shift. | Roles with at least two people holding a current certificate per shift, from the skills matrix. | Skills matrix template |
| On-time delivery | Whether the losses above reach the customer as late orders. | Orders shipped complete by the promised date divided by orders due, per week. | - |
By the numbers
Public figures for this industry or for the wider sector it belongs to, each linked to the report or government table it comes from and checked against it on October 3, 2026. More in our lean manufacturing statistics and benchmark charts.
16×
Plants in the top quarter for relying on reactive maintenance had 3.3 times more downtime and 16 times more defects than plants in the bottom quarter.
Same NIST survey. NIST notes the link is an association, not proof of cause.
Source: NIST, Economics of Manufacturing Machinery Maintenance: A Survey and Analysis of U.S. Costs and Benefits (NIST AMS 100-34) (June 2020)
Injury and illness rate by industry, 2024
- Motor vehicles5.6
- Beverage and tobacco3.7
- Furniture3.5
- Food3.3
- Primary metals3.3
- Nonmetallic mineral products, incl. glass3.3
- Fabricated metal products3.2
- Transportation equipment3.2
- Motor vehicle parts2.9
- Plastics and rubber products2.8
- HVAC and refrigeration2.4
- Paper2.4
- Machinery2.3
- All private industry2.3
- Electrical equipment and appliances2.0
- Printing1.6
- Chemicals1.6
Total recordable cases per 100 full-time workers, 2024: Motor vehicles 5.6, Beverage and tobacco 3.7, Furniture 3.5, Food 3.3, Primary metals 3.3, Nonmetallic mineral products, incl. glass 3.3, Fabricated metal products 3.2, Transportation equipment 3.2, Motor vehicle parts 2.9, Plastics and rubber products 2.8, All manufacturing 2.7, HVAC and refrigeration 2.4, Paper 2.4, Machinery 2.3, All private industry 2.3, Electrical equipment and appliances 2, Printing 1.6, Chemicals 1.6.
Free templates, calculators and buyer's guides
Templates (23)
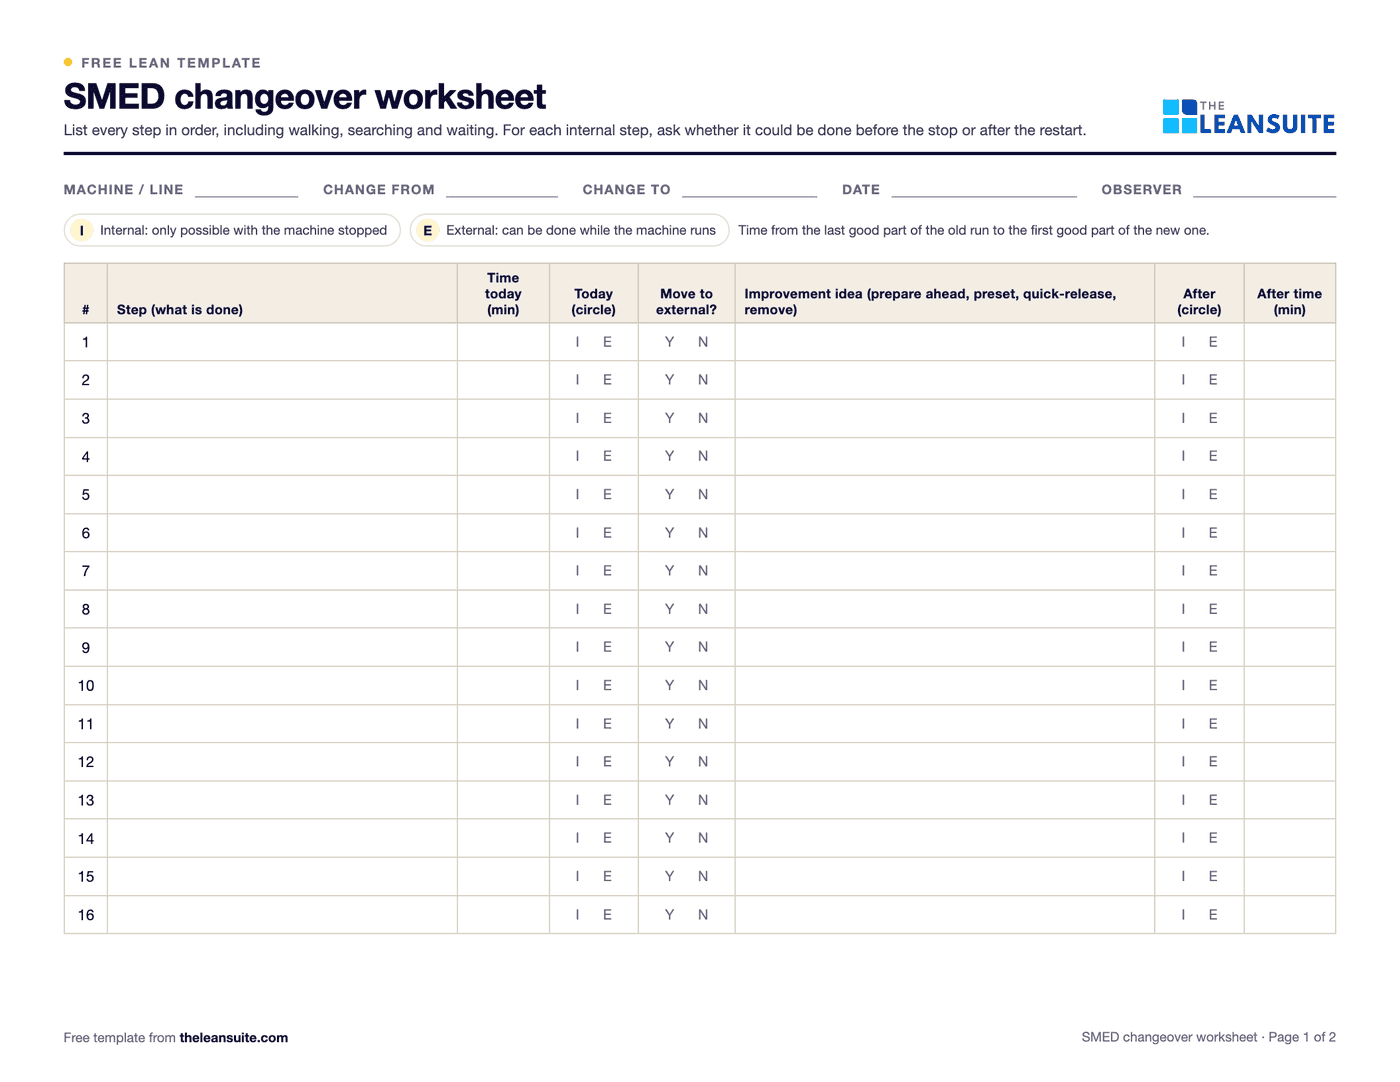 PDF and ExcelSMED changeover worksheetChangeover steps with times, internal or external, what can move, ideas and before/after totals.
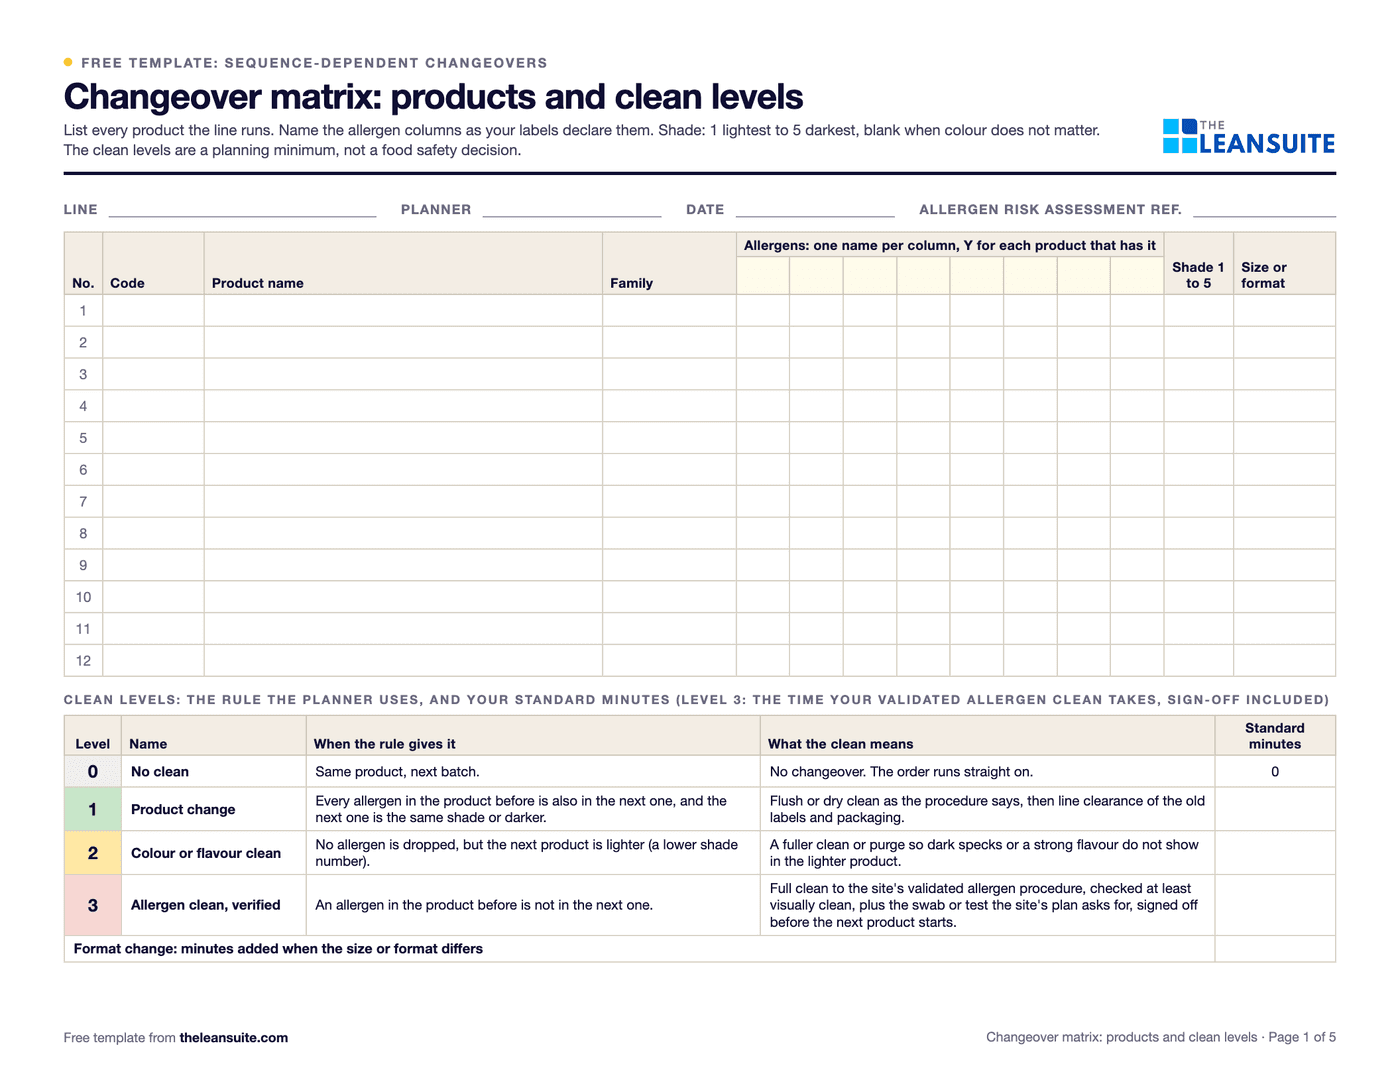 PDF and ExcelChangeover matrix templateA from-to matrix of changeover minutes with the clean each transition needs (allergen, colour, format), and a weekly planner that totals the order and suggests a shorter one.
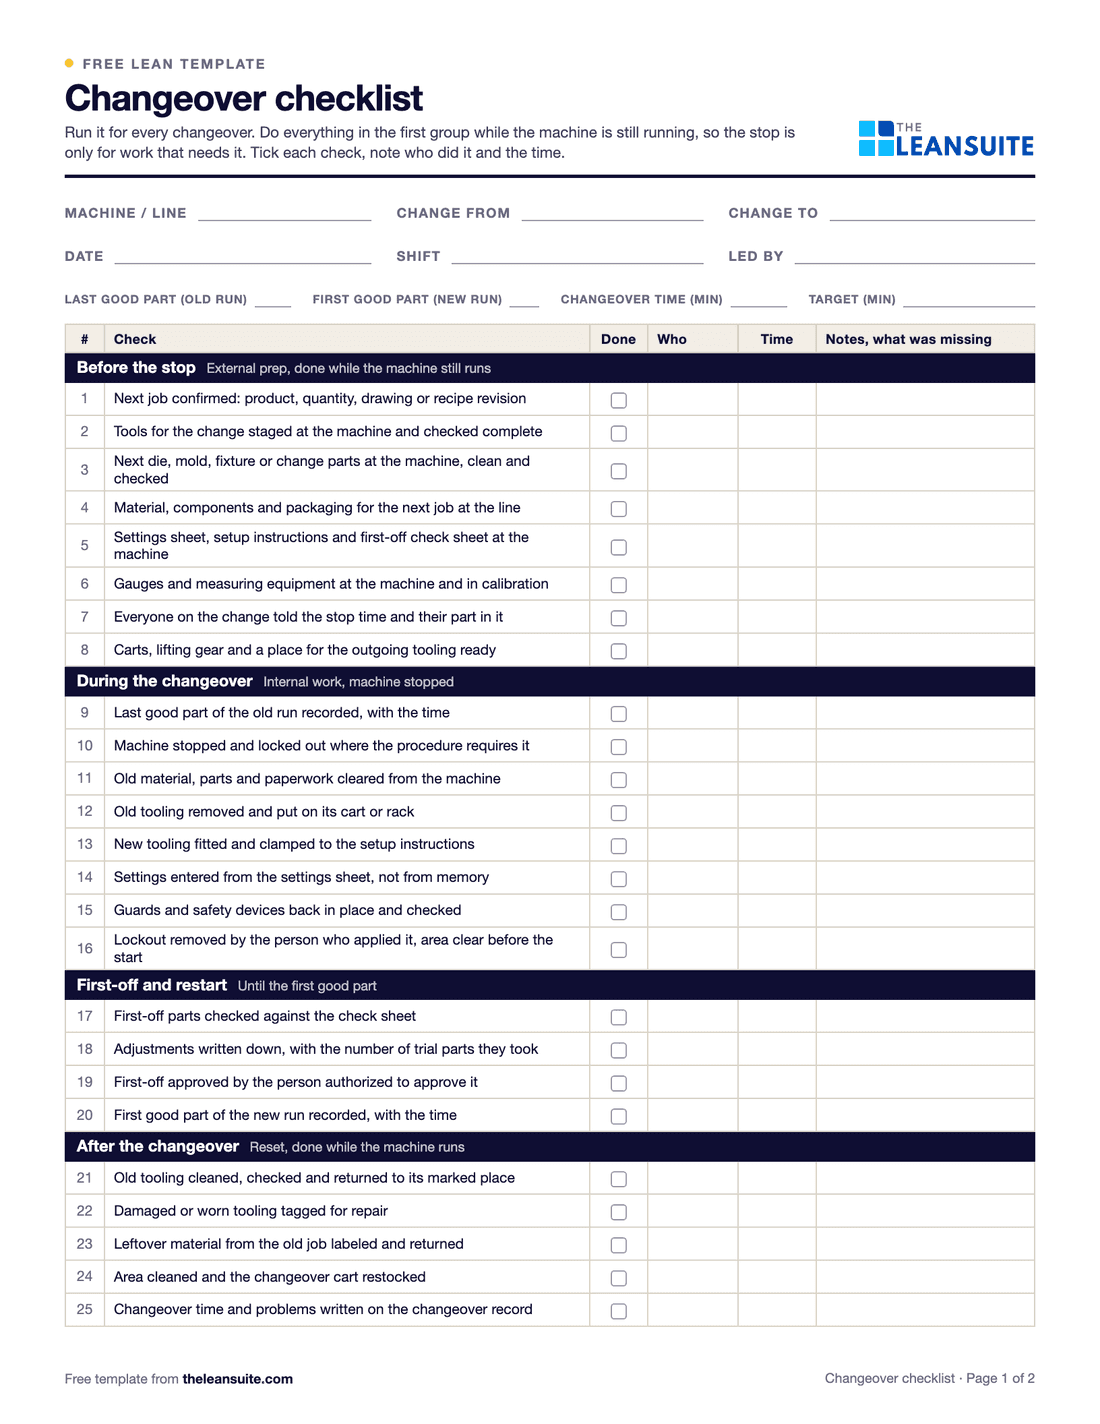 PDF and ExcelChangeover checklist25 checks for every changeover, a record of planned and actual times, and a log of changeover time against target.
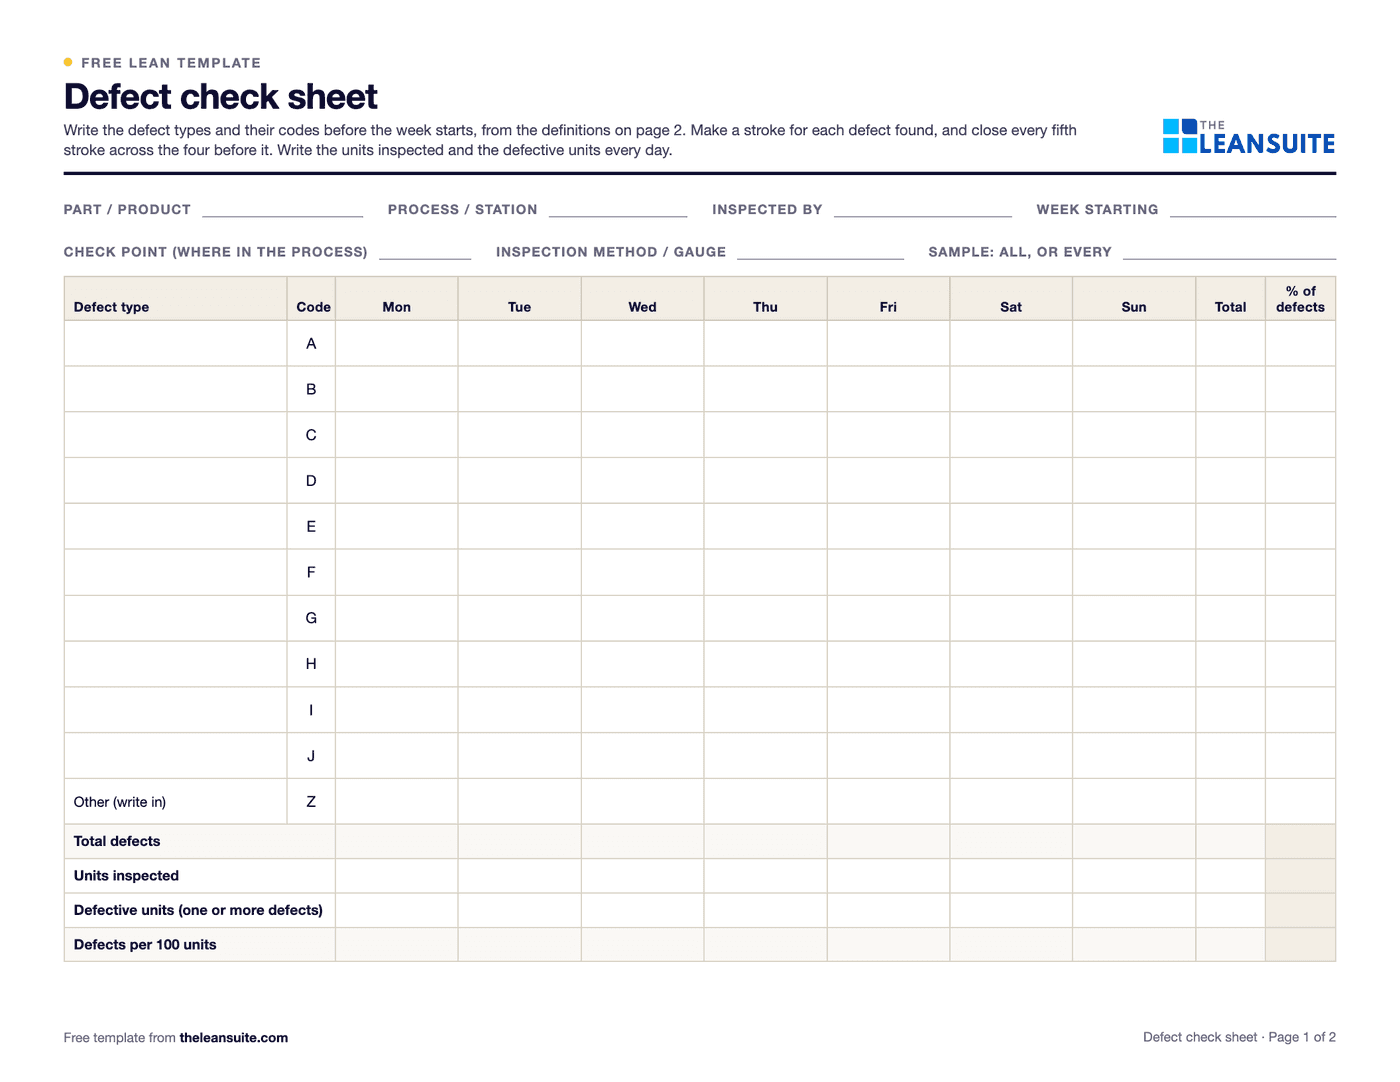 PDF and ExcelDefect check sheetTally defects by type and day, with units inspected, defect rates, a location sheet and the week's Pareto.
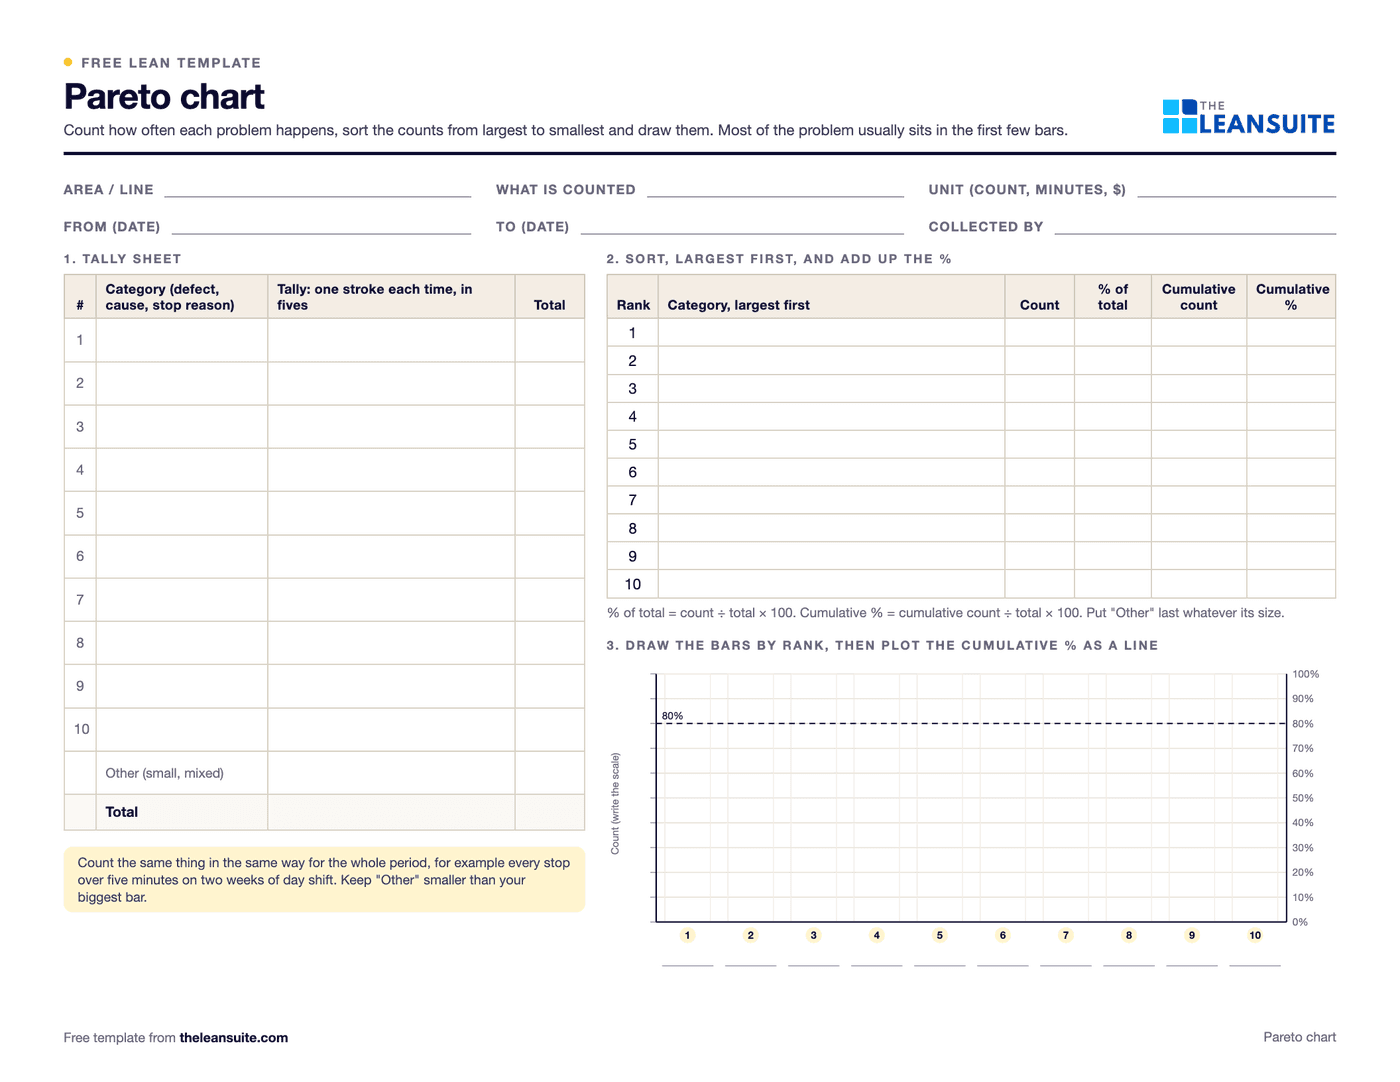 PDF and ExcelPareto chart templateA tally sheet, the Pareto by count and by cost with the cumulative line and the 80% cut, and a before and after comparison. Excel sorts and draws it.
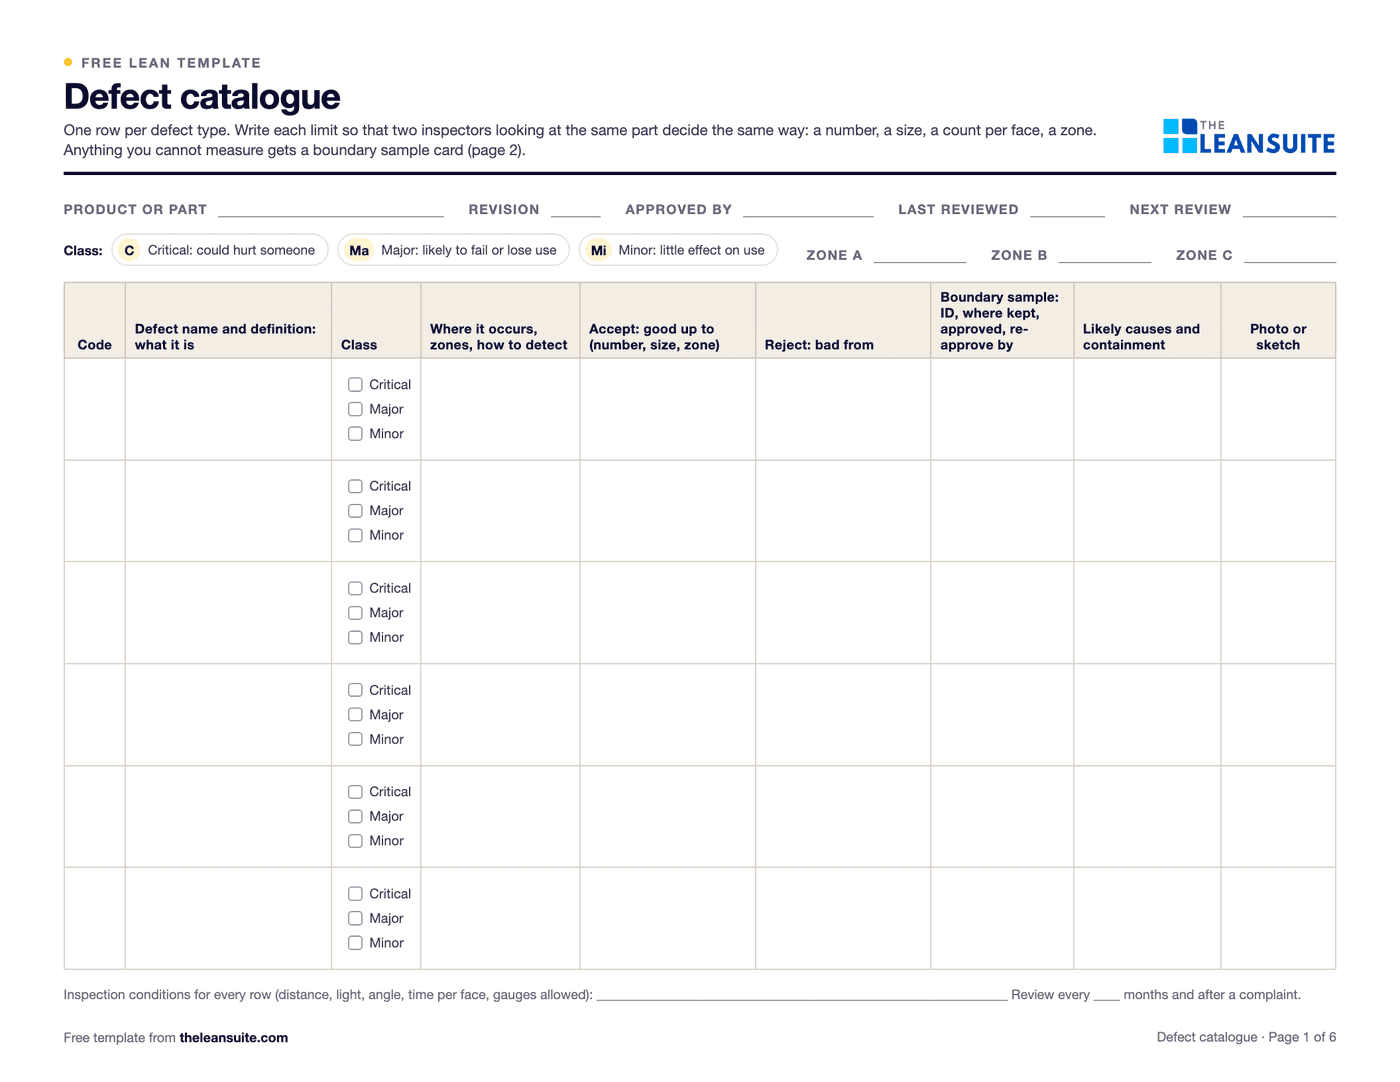 PDF and ExcelDefect catalogue template with boundary samplesEvery defect with a definition, a class and the reason for it, measured accept and reject limits by zone, boundary samples, a defect log with DPU and Pareto, and an inspector agreement check.
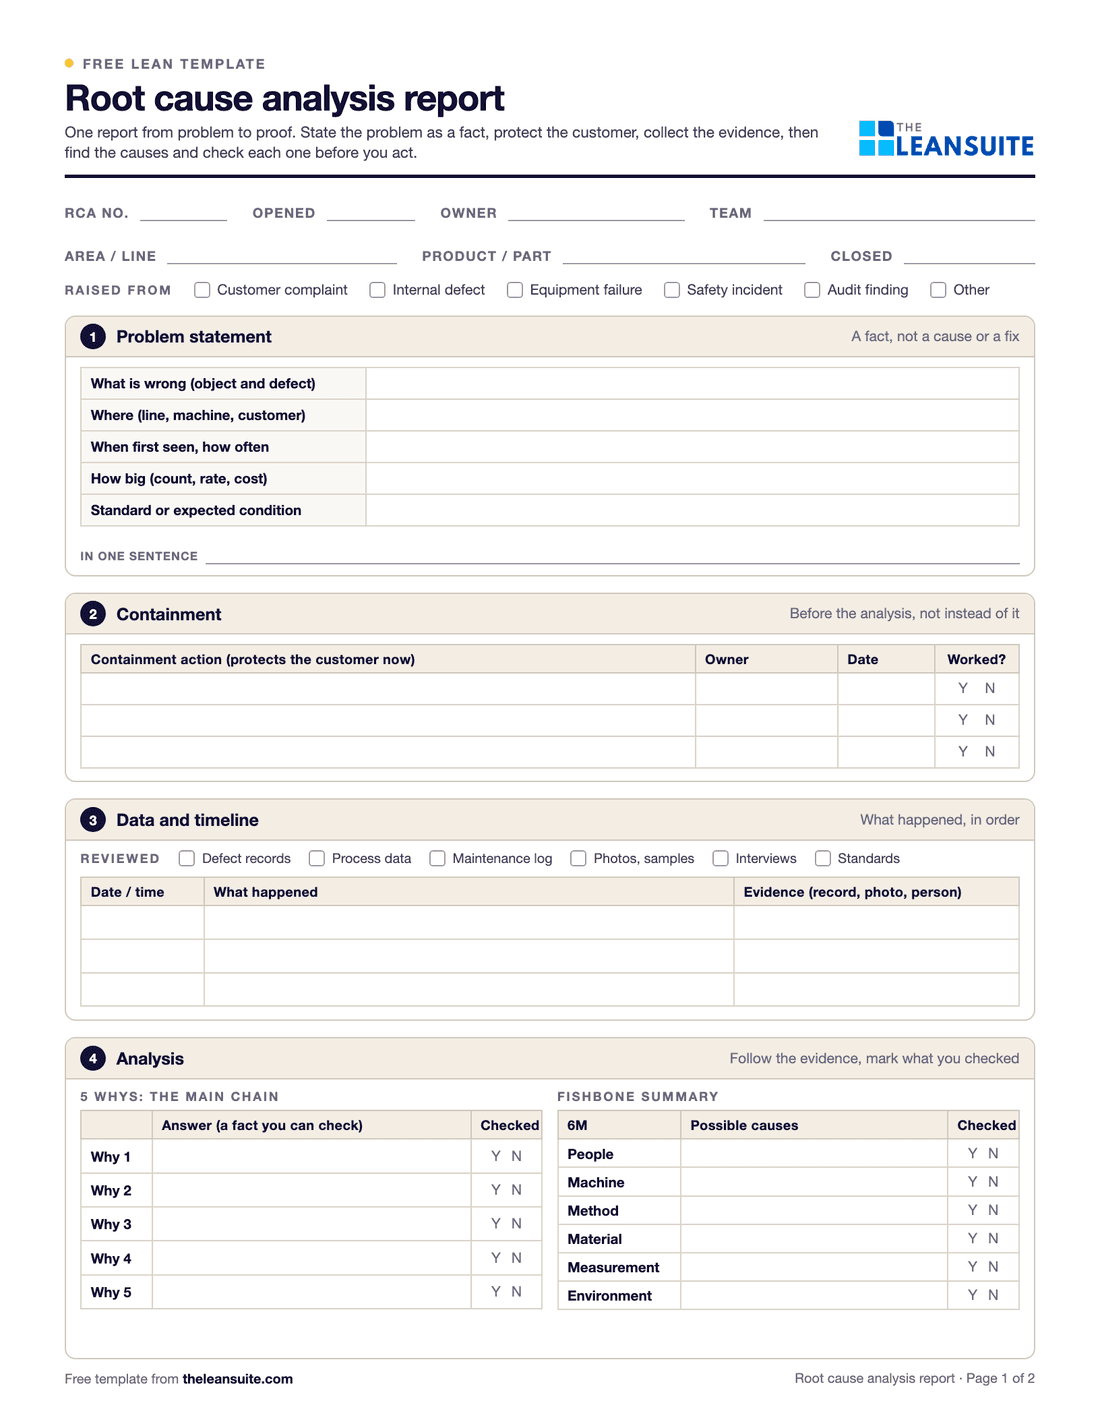 PDF and ExcelRoot cause analysis templateOne report from problem statement to proof: containment, evidence, analysis, verified causes, actions and the effectiveness check.
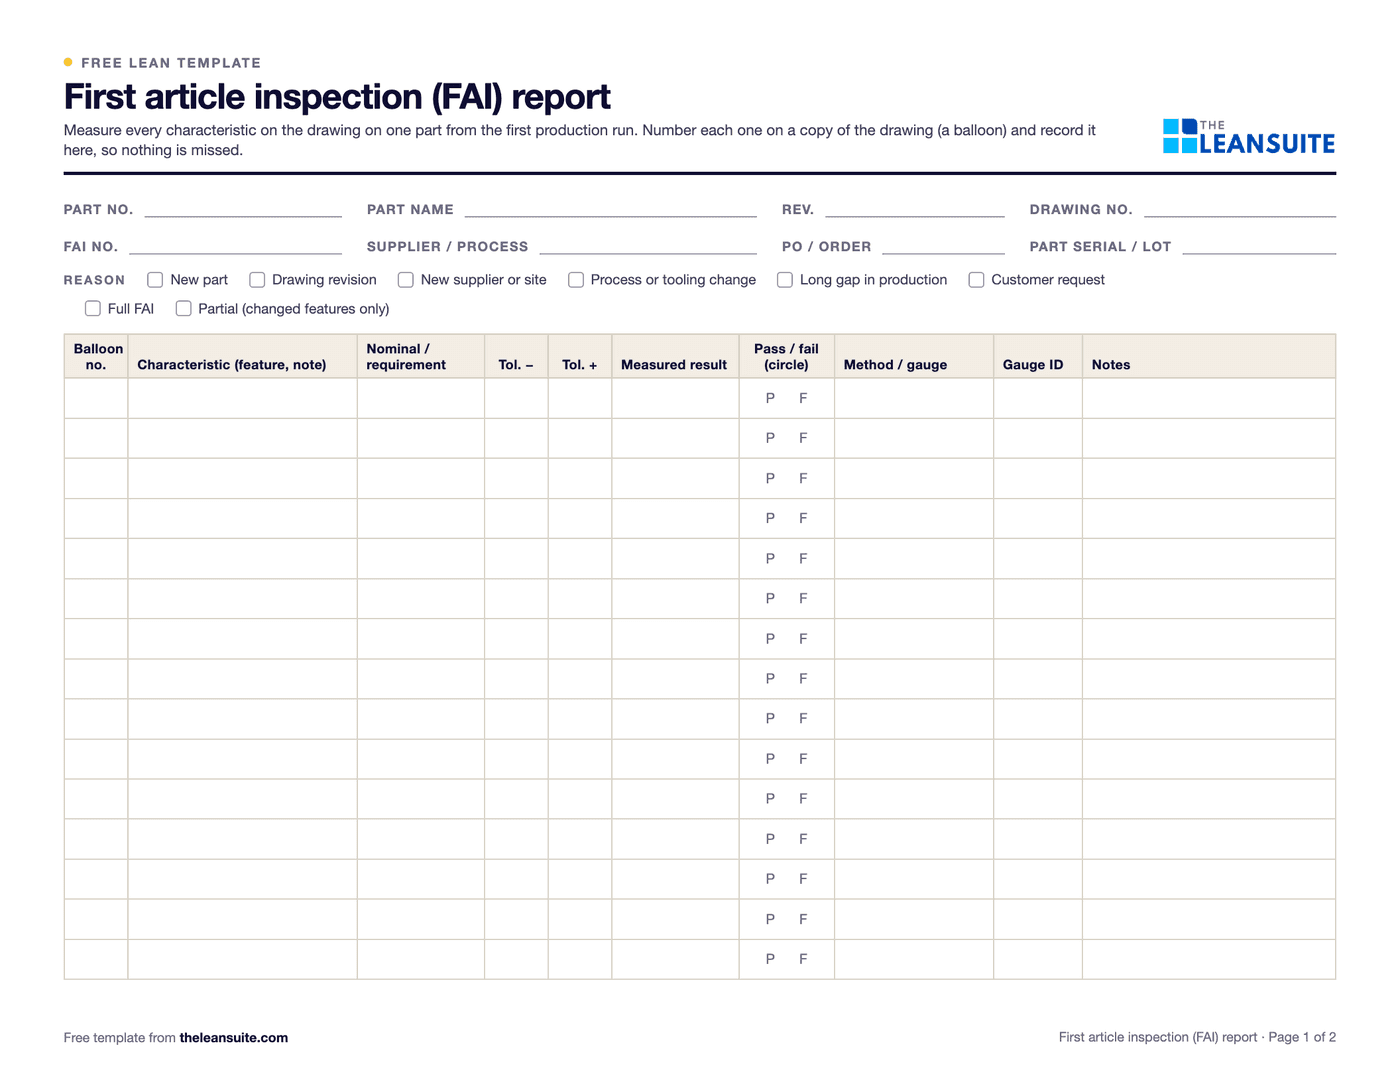 PDF and ExcelFirst article inspection (FAI) report templatePart information, a ballooned characteristic table with tolerances and results, material and process certificates, and sign-off.
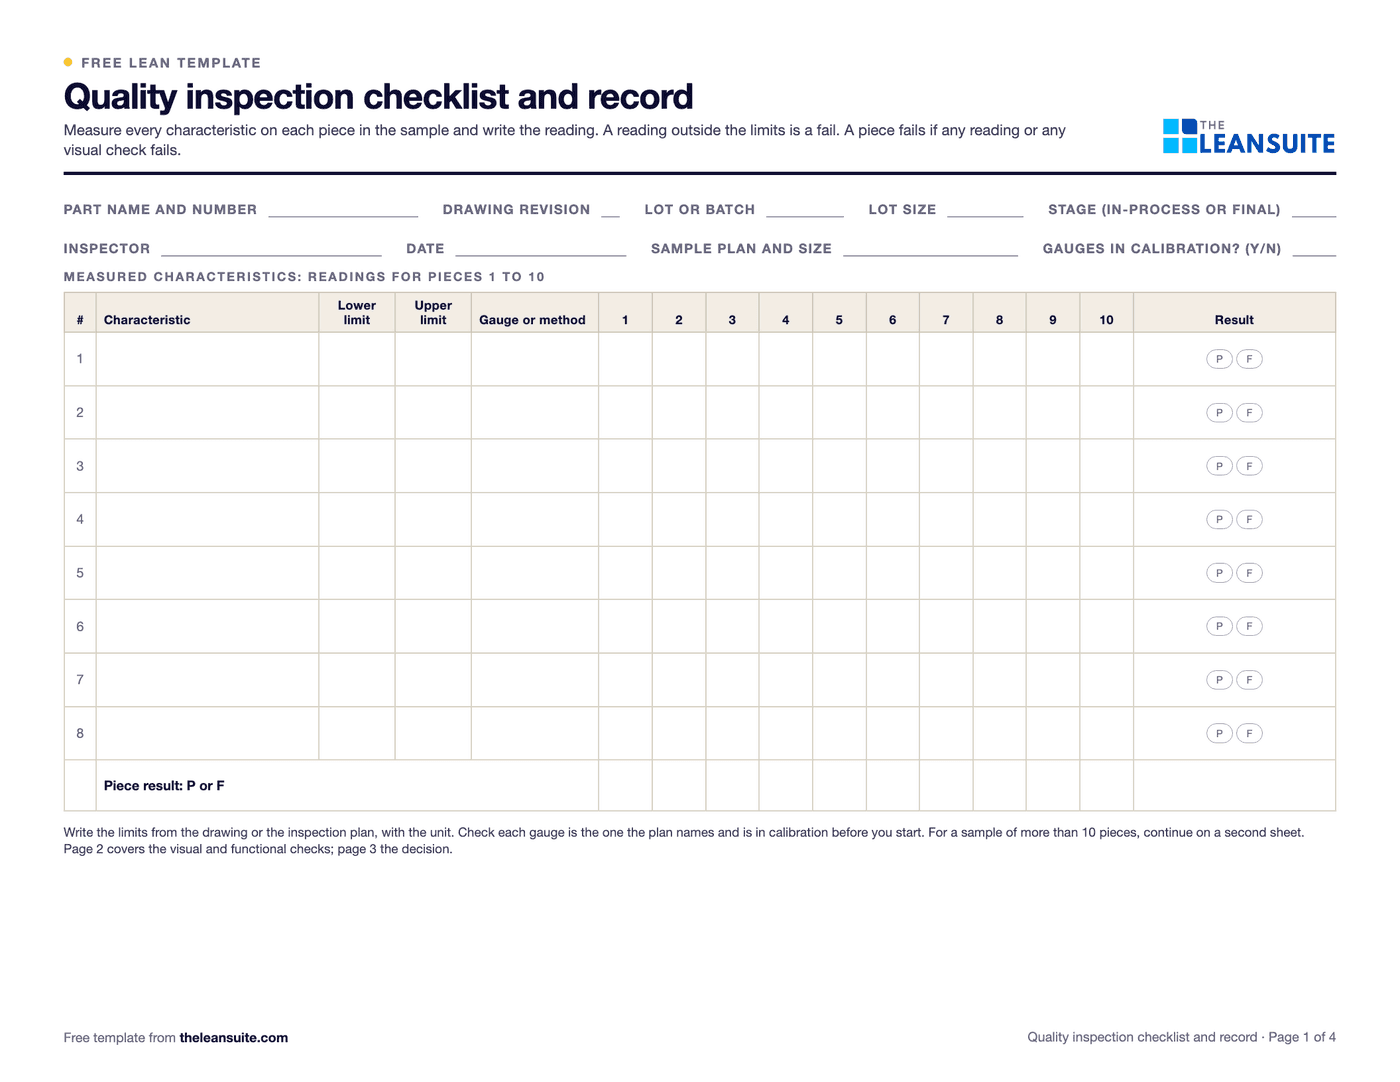 PDF and ExcelQuality inspection checklistAn in-process and final inspection record: measured characteristics, visual checks, a decision and first pass yield.
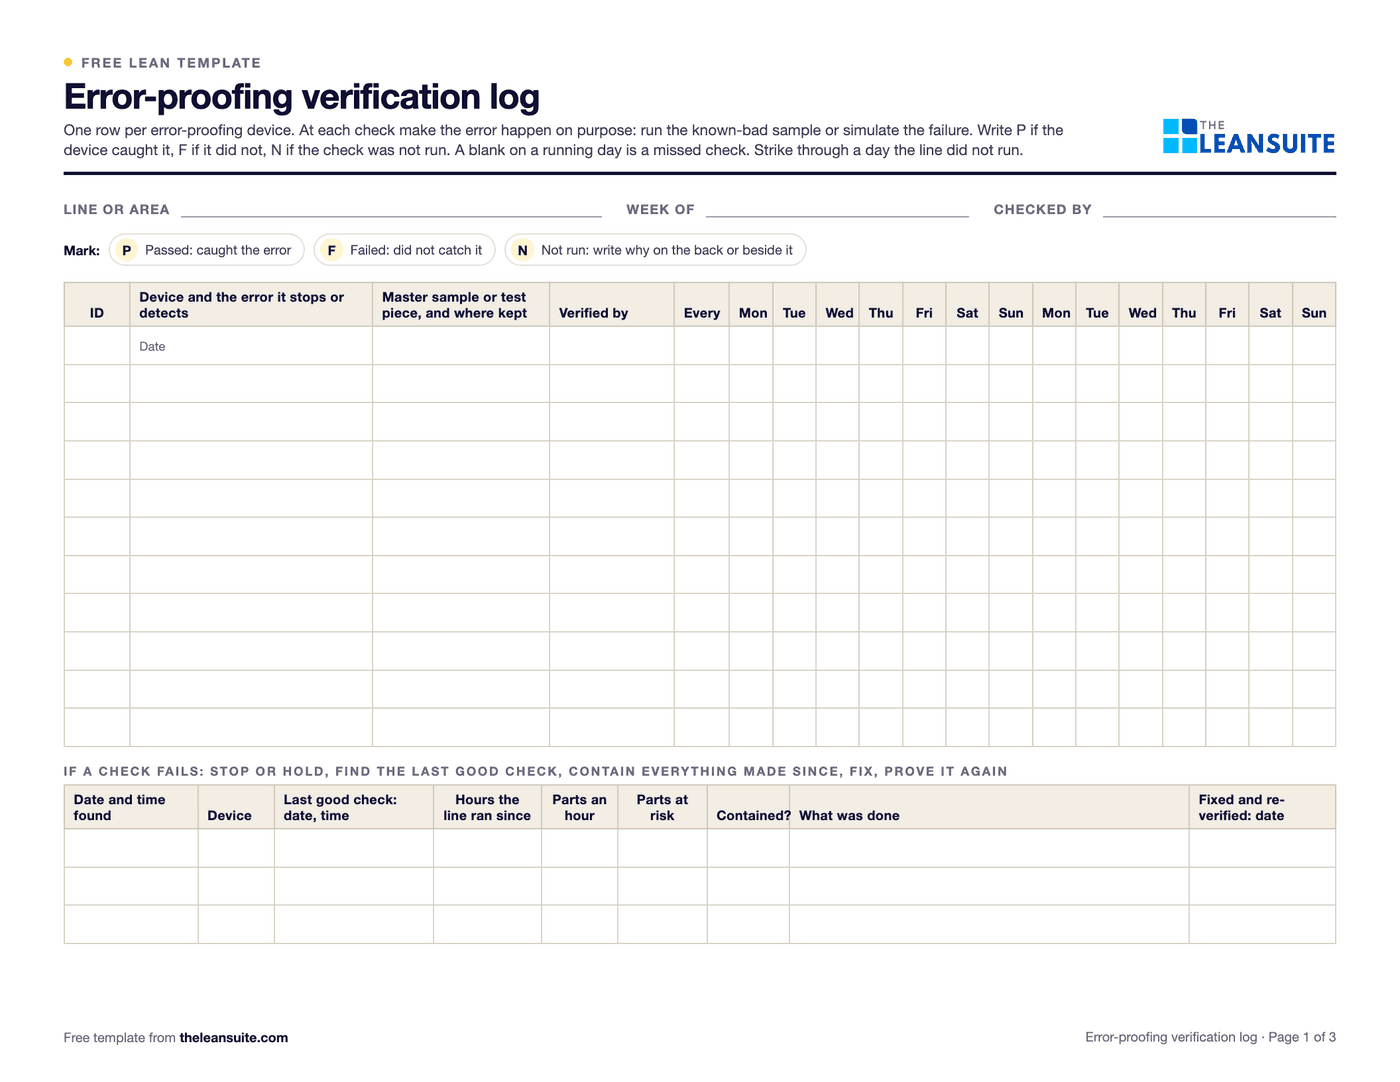 PDF and ExcelError-proofing verification log (daily master-sample check)Each poka-yoke device proved every day or week with a known-bad sample, with missed checks counted and the hours and parts at risk worked out when one fails.
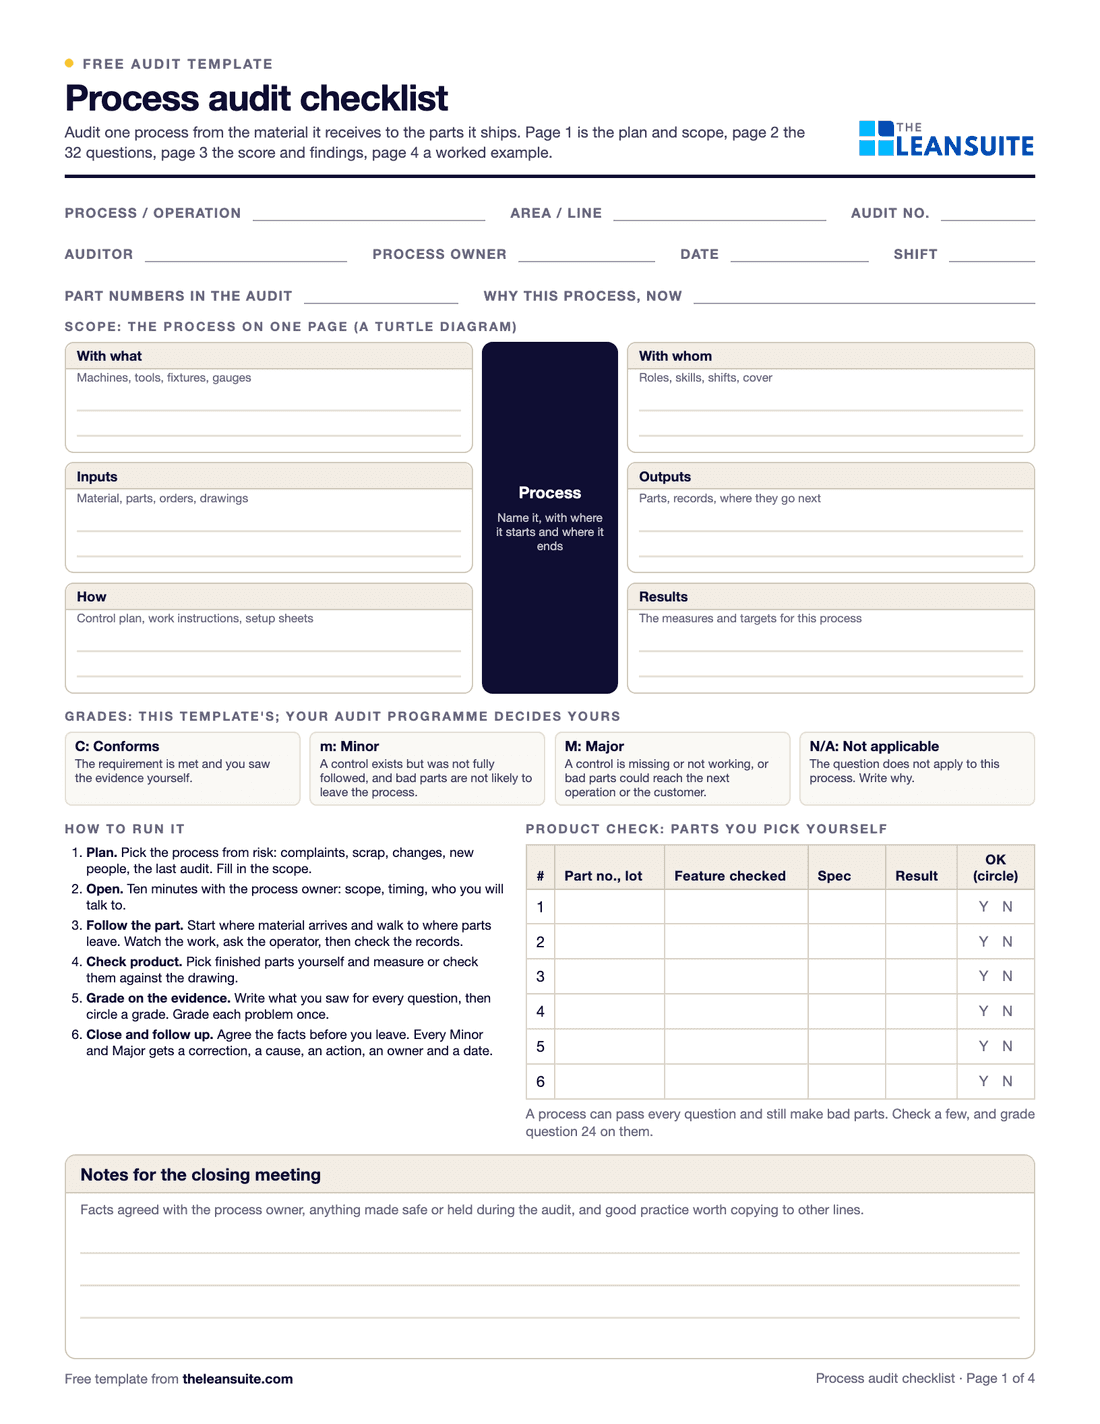 PDF and ExcelProcess audit checklistAudit one process from inputs to results: 32 questions graded conforms, minor or major, a product check, a score by group and a findings list.
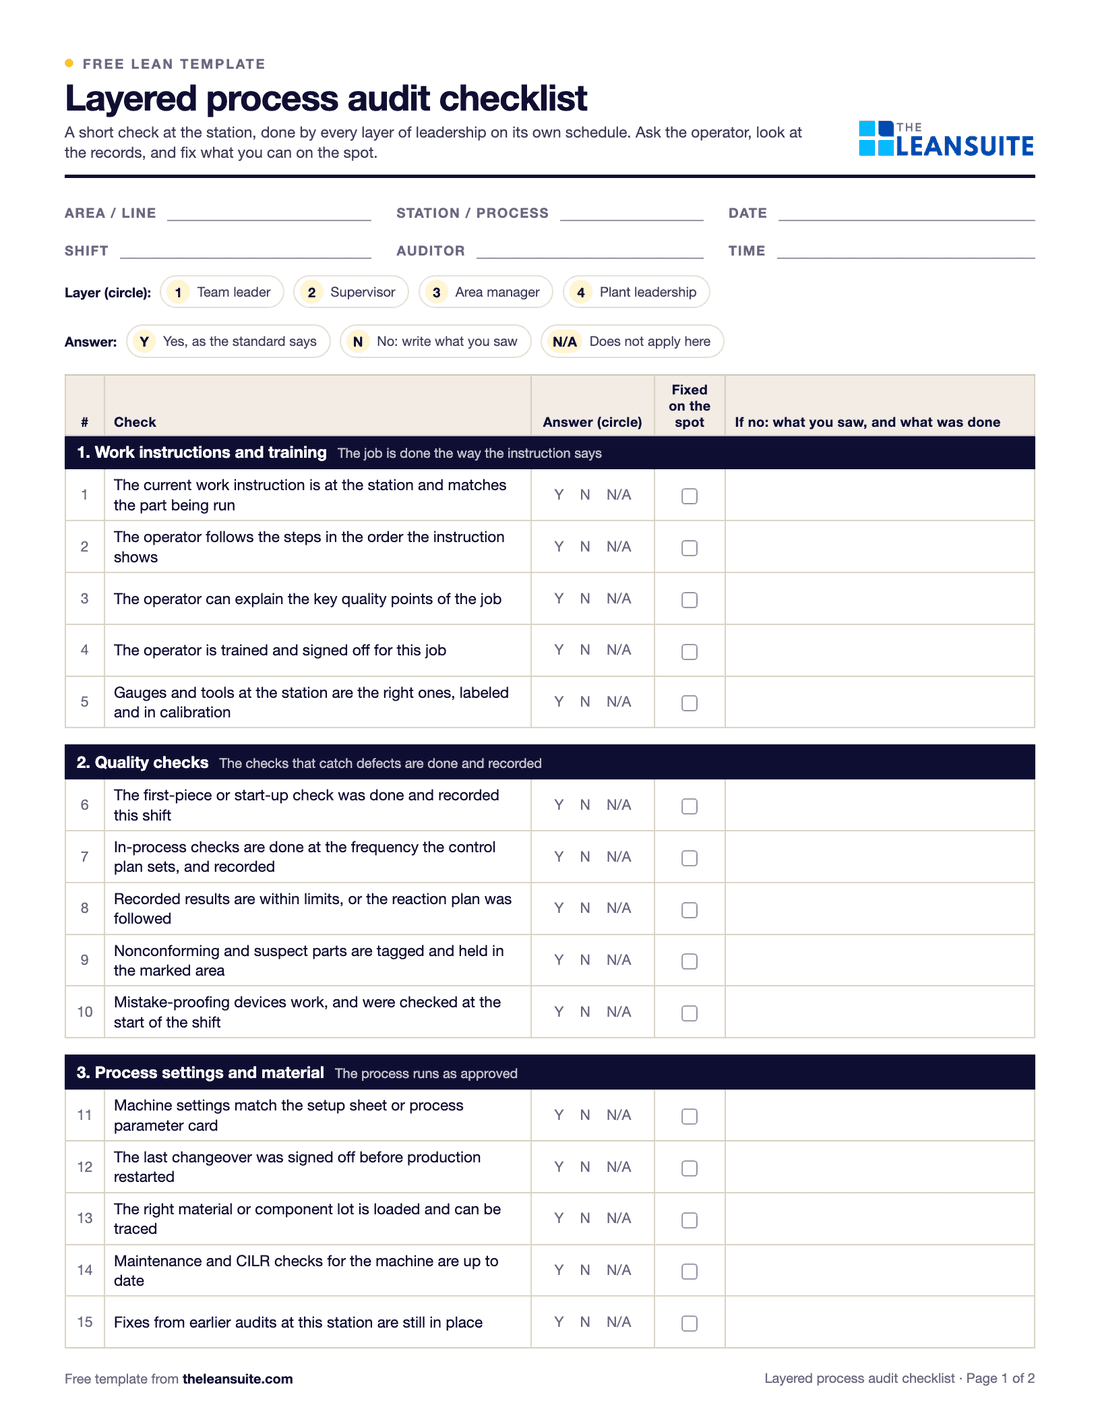 PDF and Excel and WordLayered process audit (LPA) checklist20 yes, no or N/A checks at the station, a fixed-on-the-spot box, scores by group and a findings table.
 PDFFloor marking color guideA floor marking color standard with swatches, marks and line widths to fill in, and a floor marking check with a layout sketch.
 PDF and ExcelSkills matrix templatePeople by tasks on a 0 to 4 scale, coverage and gaps per task and shift, and a training plan that closes them.
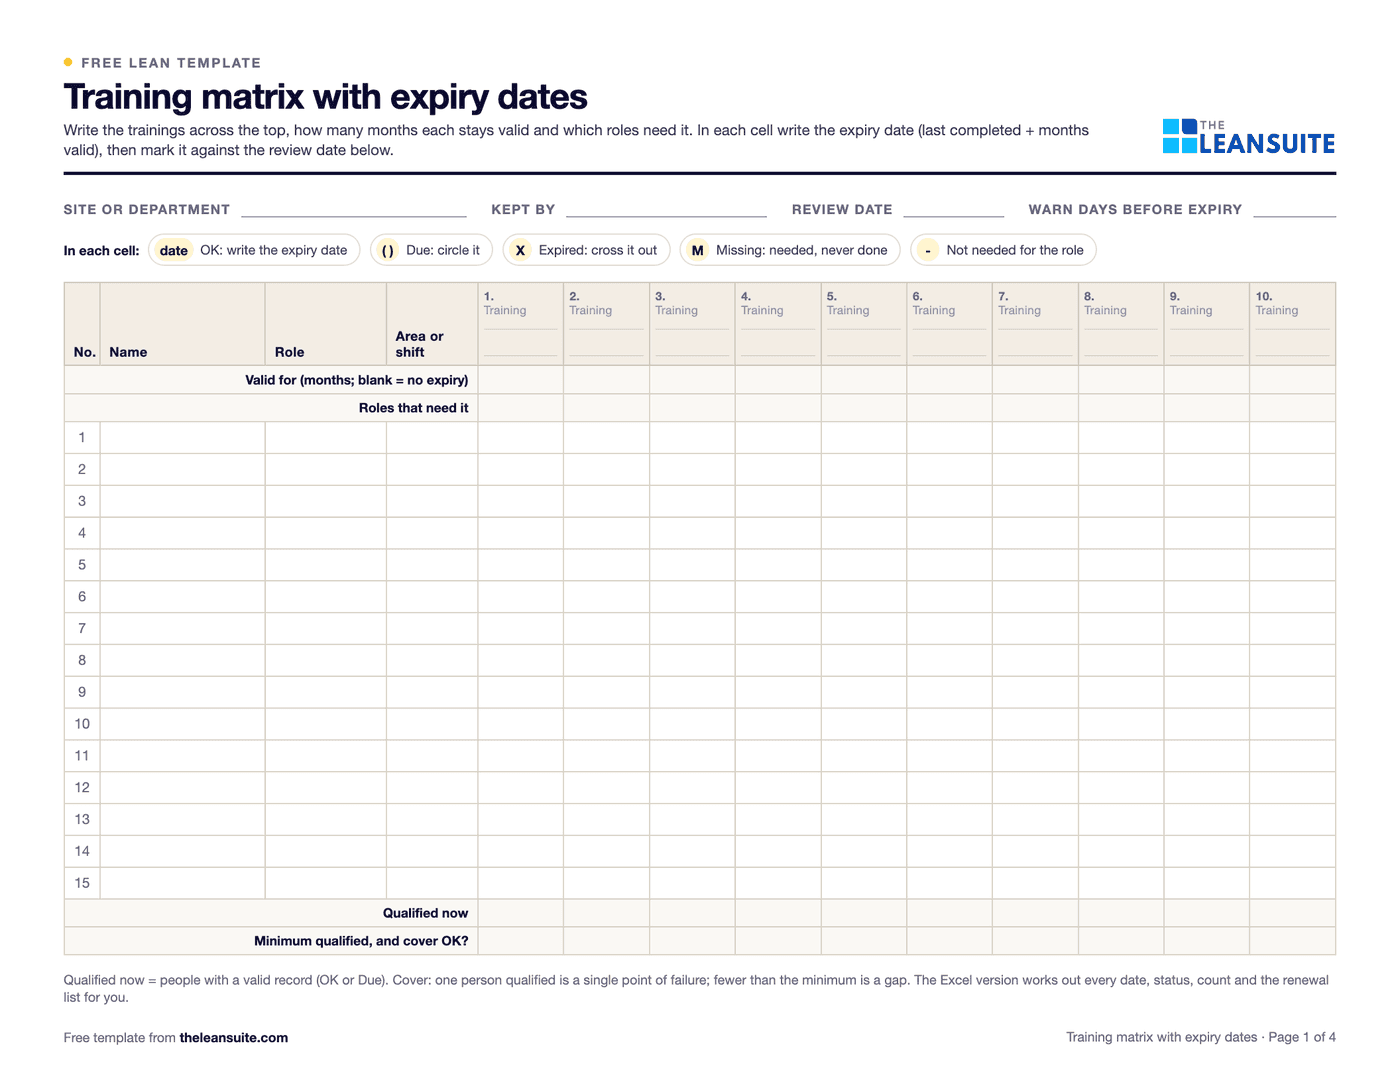 PDF and ExcelTraining matrix template with expiry datesPeople by required trainings with expiry dates, OK, due, expired and missing flags, compliance by person and area, cover per training and a renewal list.
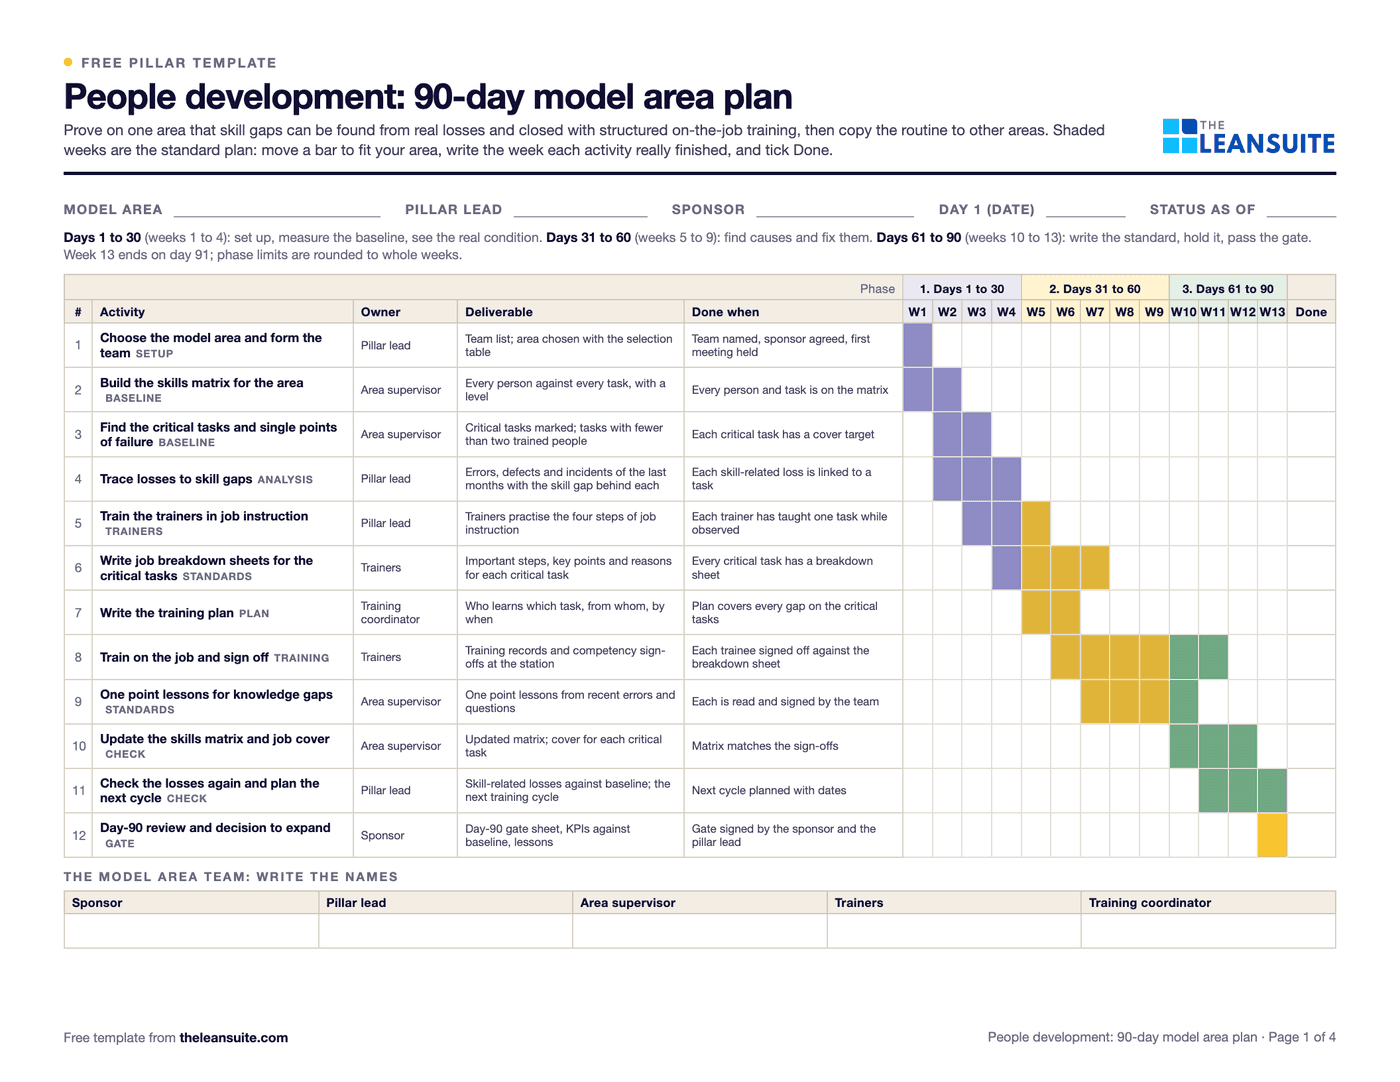 PDF and ExcelPeople development pillar 90-day model area planThirteen weeks from the skills matrix to trained cover on critical tasks in one model area, a KPI board, the day-90 gate and expansion waves.
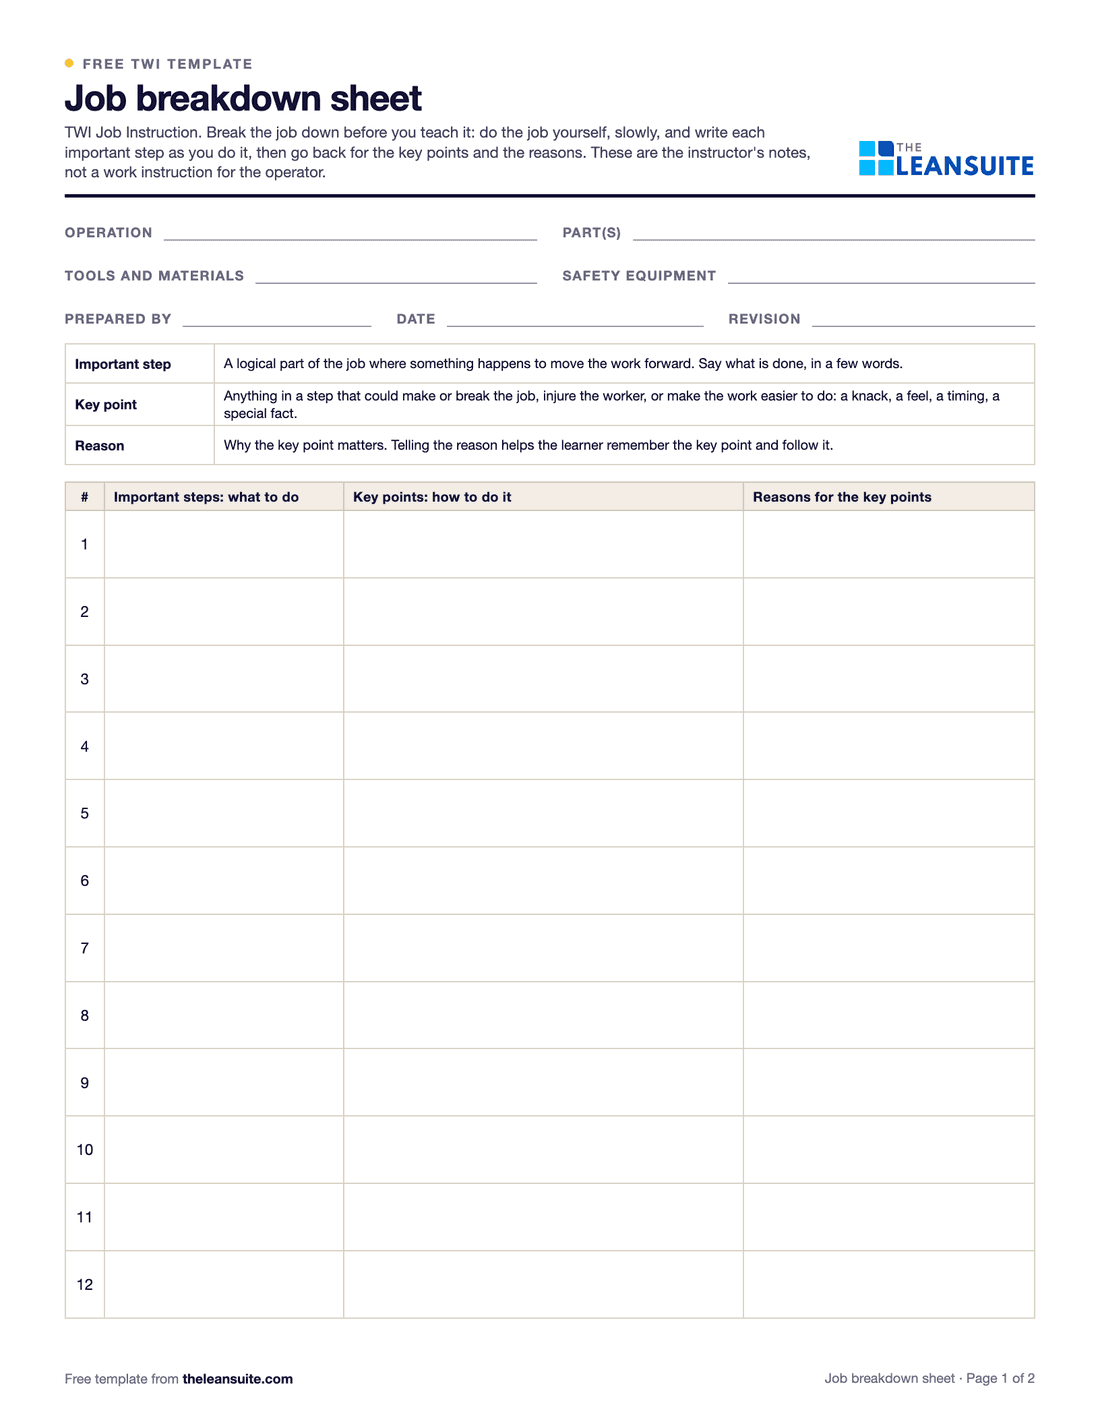 PDF and ExcelTWI job breakdown sheetThe TWI Job Instruction breakdown of a job into important steps, key points and reasons, with a worked example and the four steps.
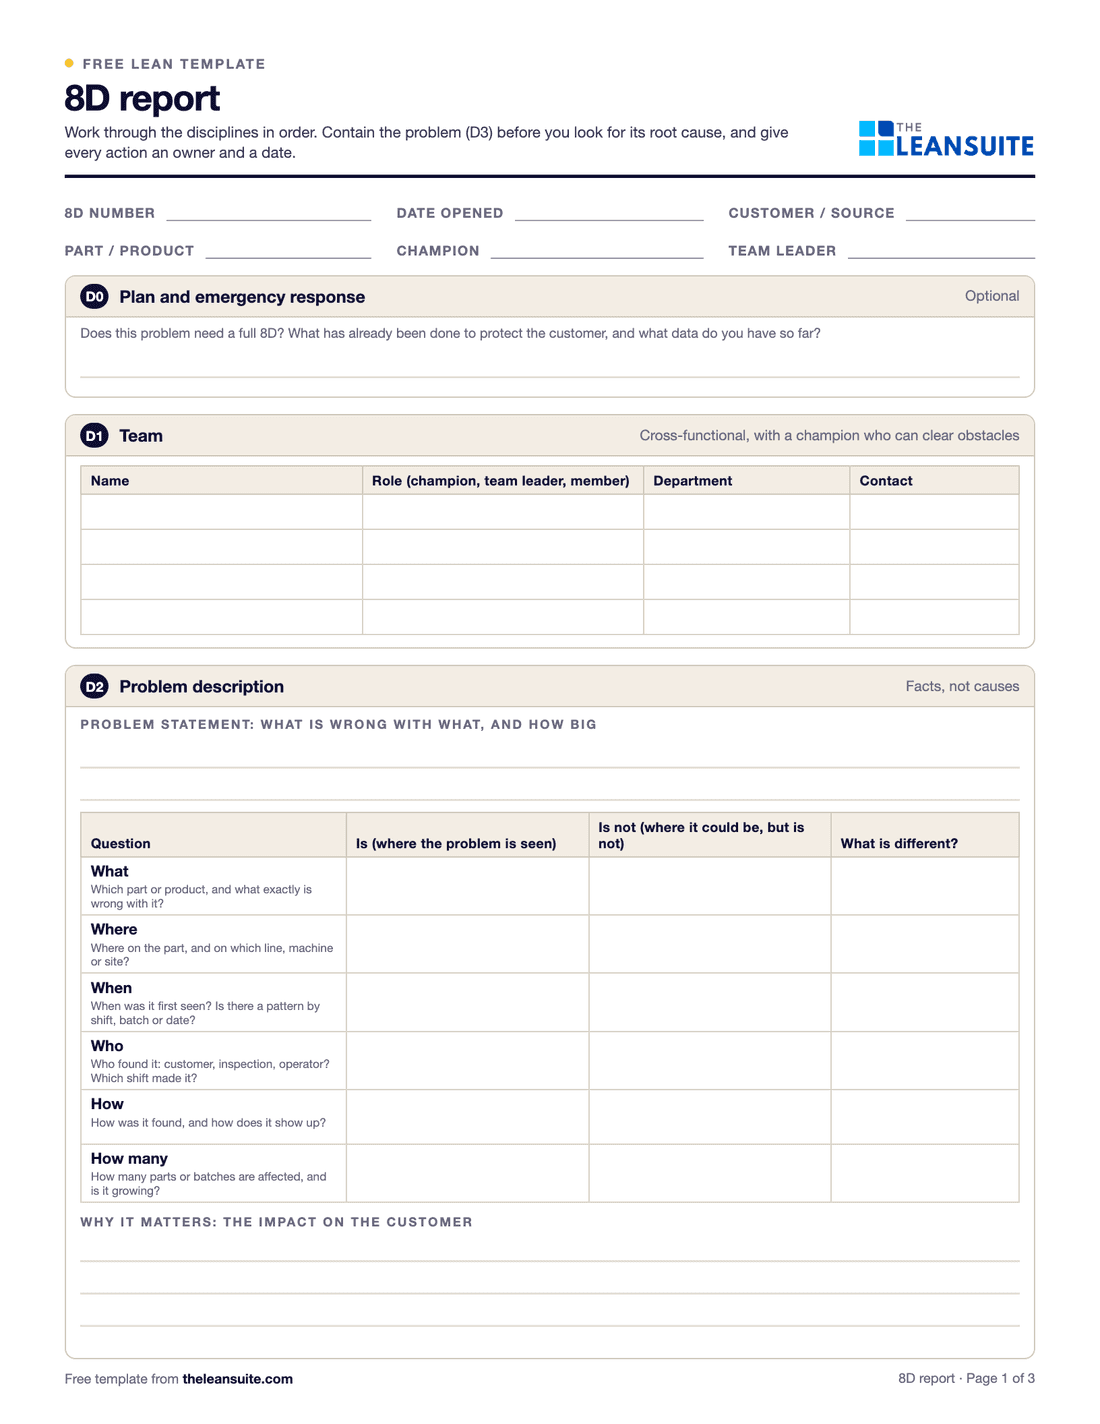 PDF and Excel and Word8D report templateD0 to D8 with targets, containment counts, occurrence, escape and systemic causes, verified actions and a worked example.
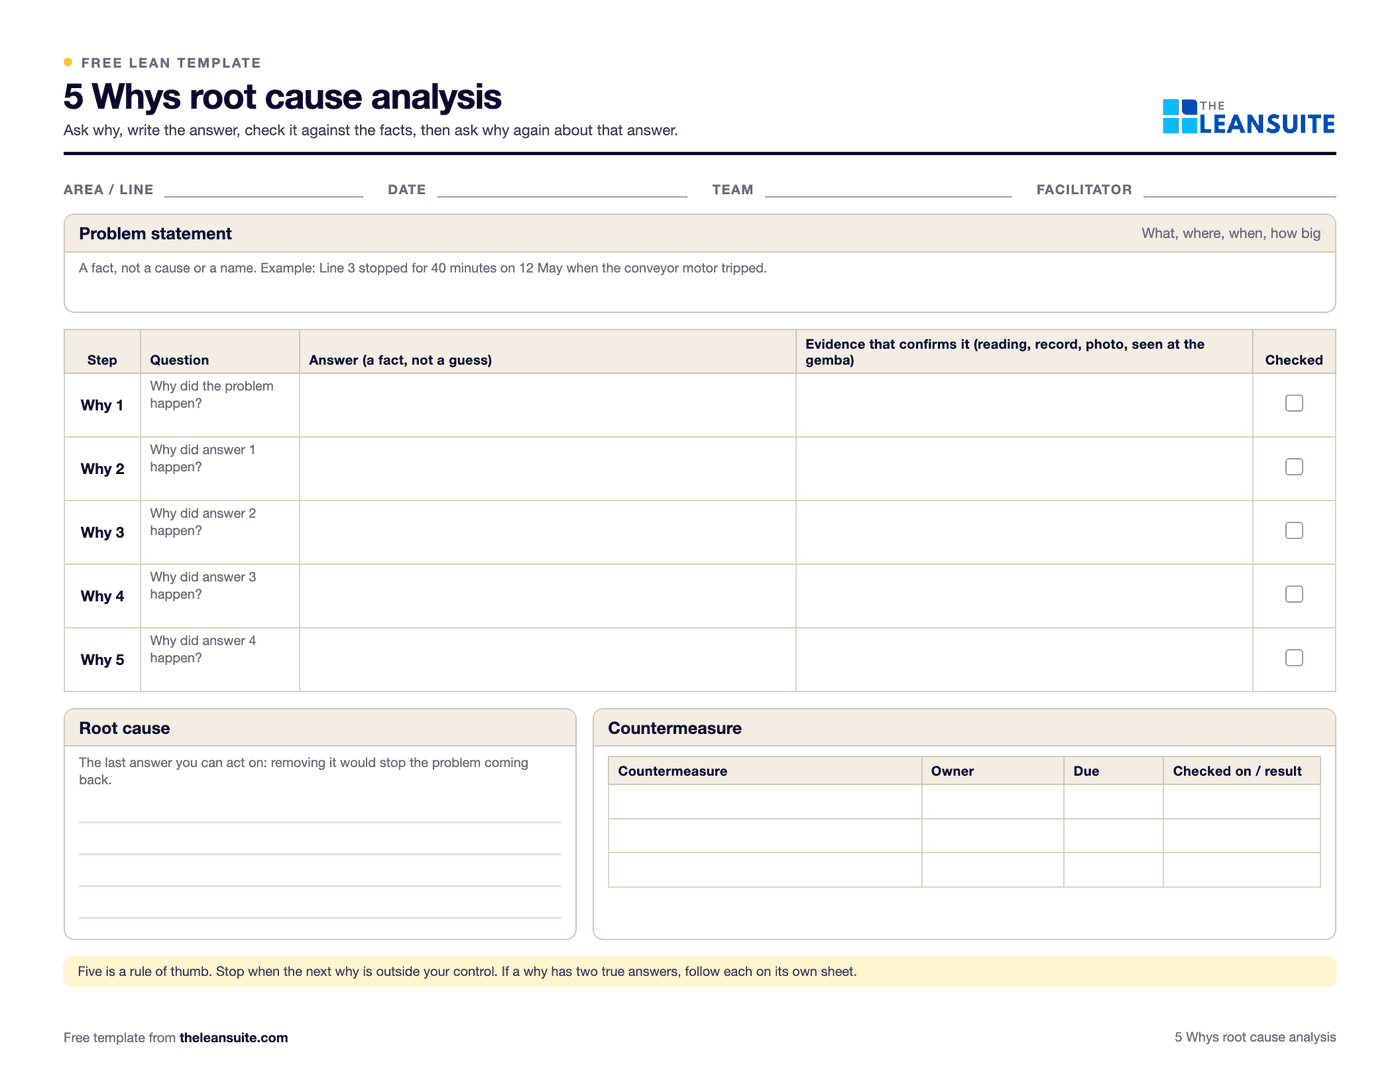 PDF and Excel and Word5 Whys templateA problem statement, a why chain that can branch, evidence for every answer, root causes and countermeasures that are checked.
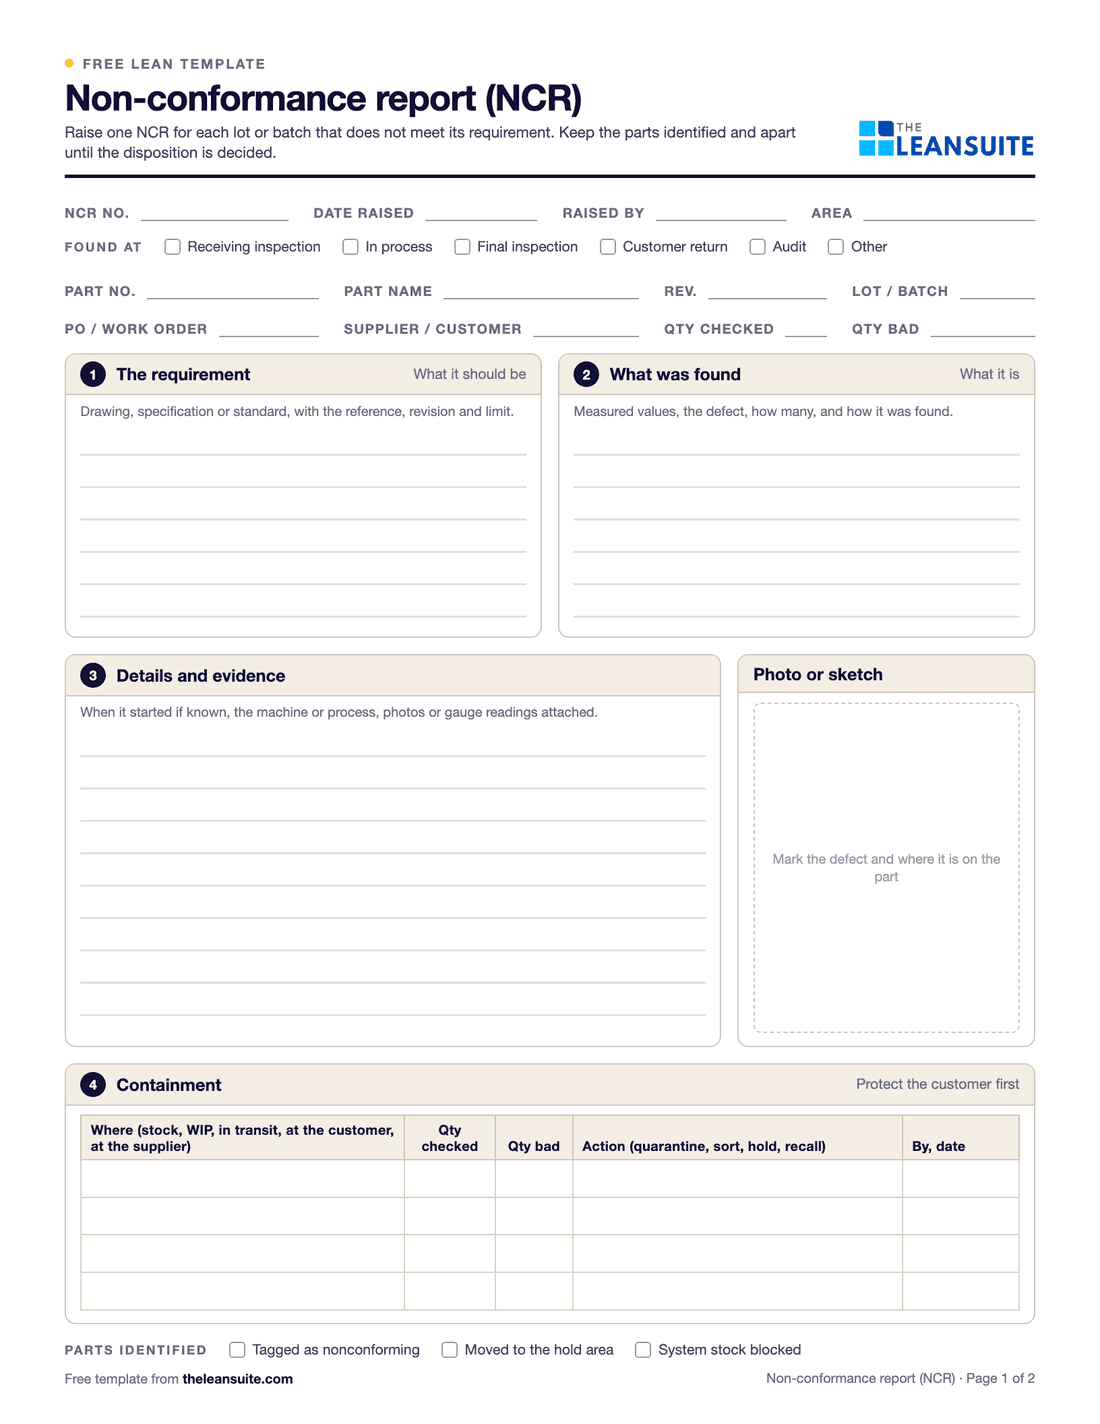 PDF and Excel and WordNon-conformance report (NCR) formA two-page NCR from the requirement against what was found to disposition and closure, and an Excel NCR log.
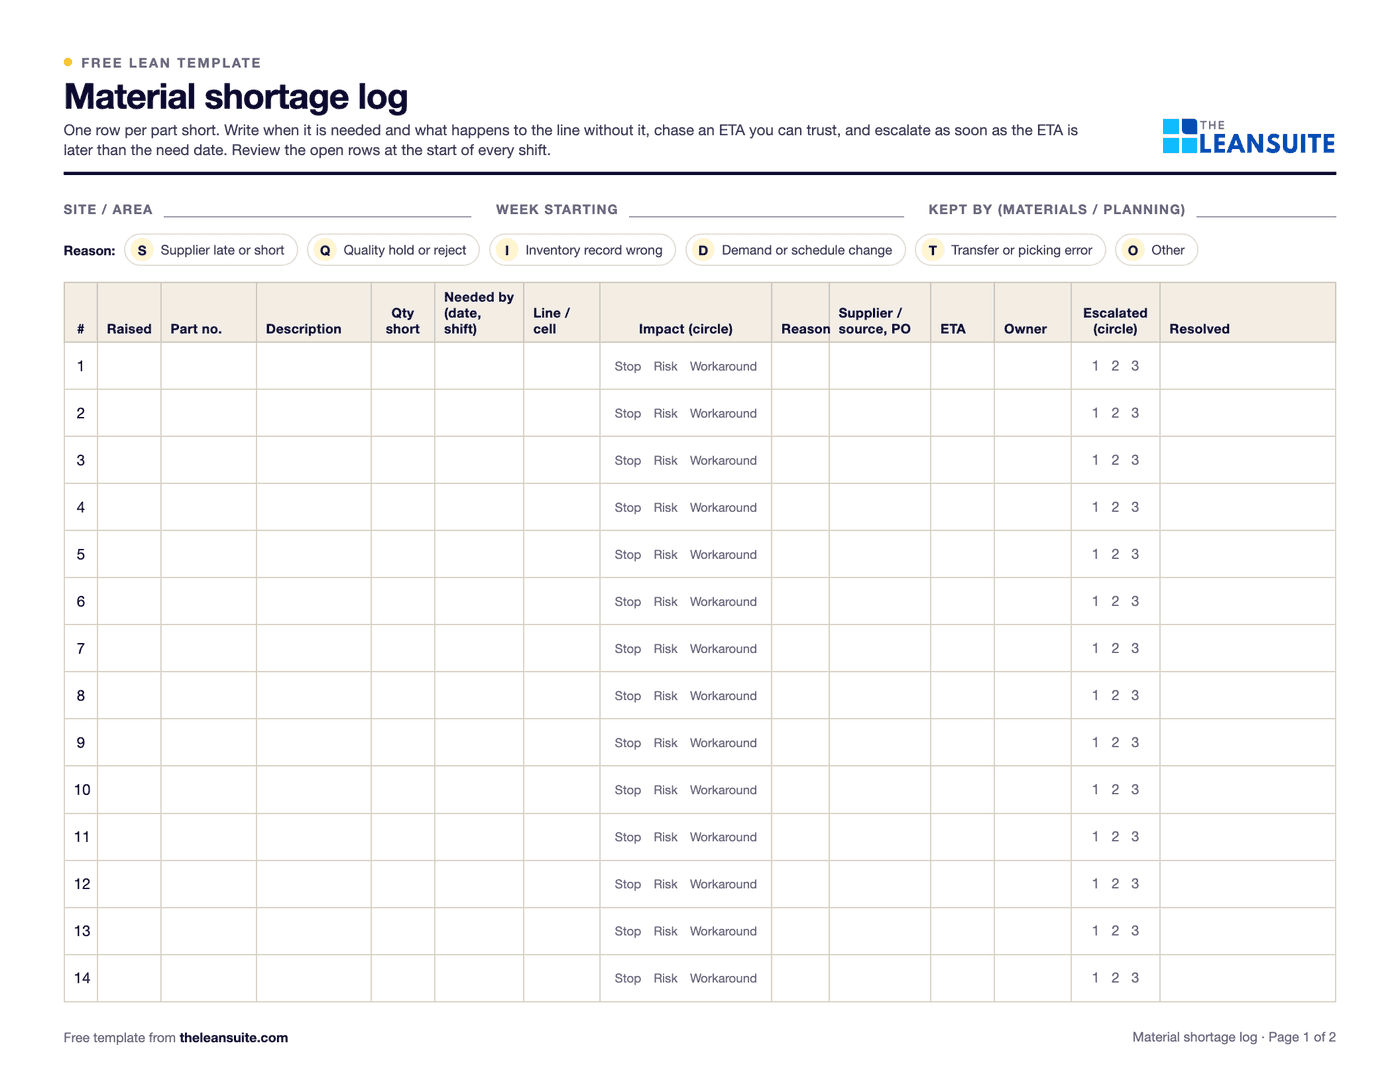 PDF and ExcelMaterial shortage logEvery part short with its need date, line impact, ETA and escalation, and counts by reason and supplier.
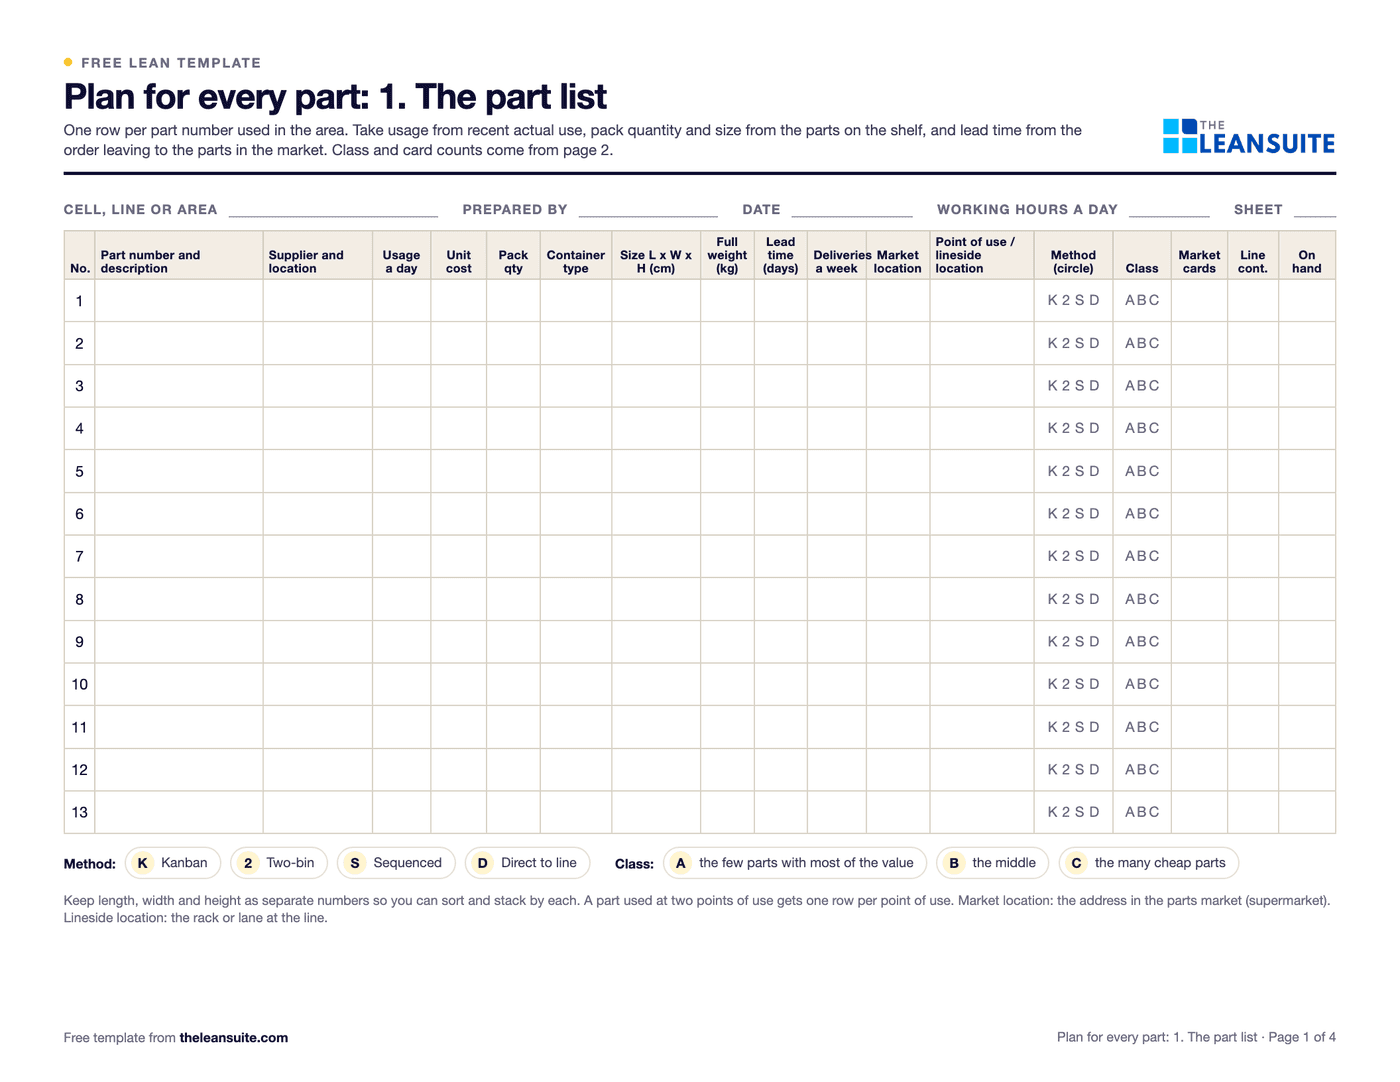 PDF and ExcelPlan for every part (PFEP) templateOne row per part: supplier, pack, container, usage, lead time and locations, with ABC classes, market and line kanban counts and a lineside space check.
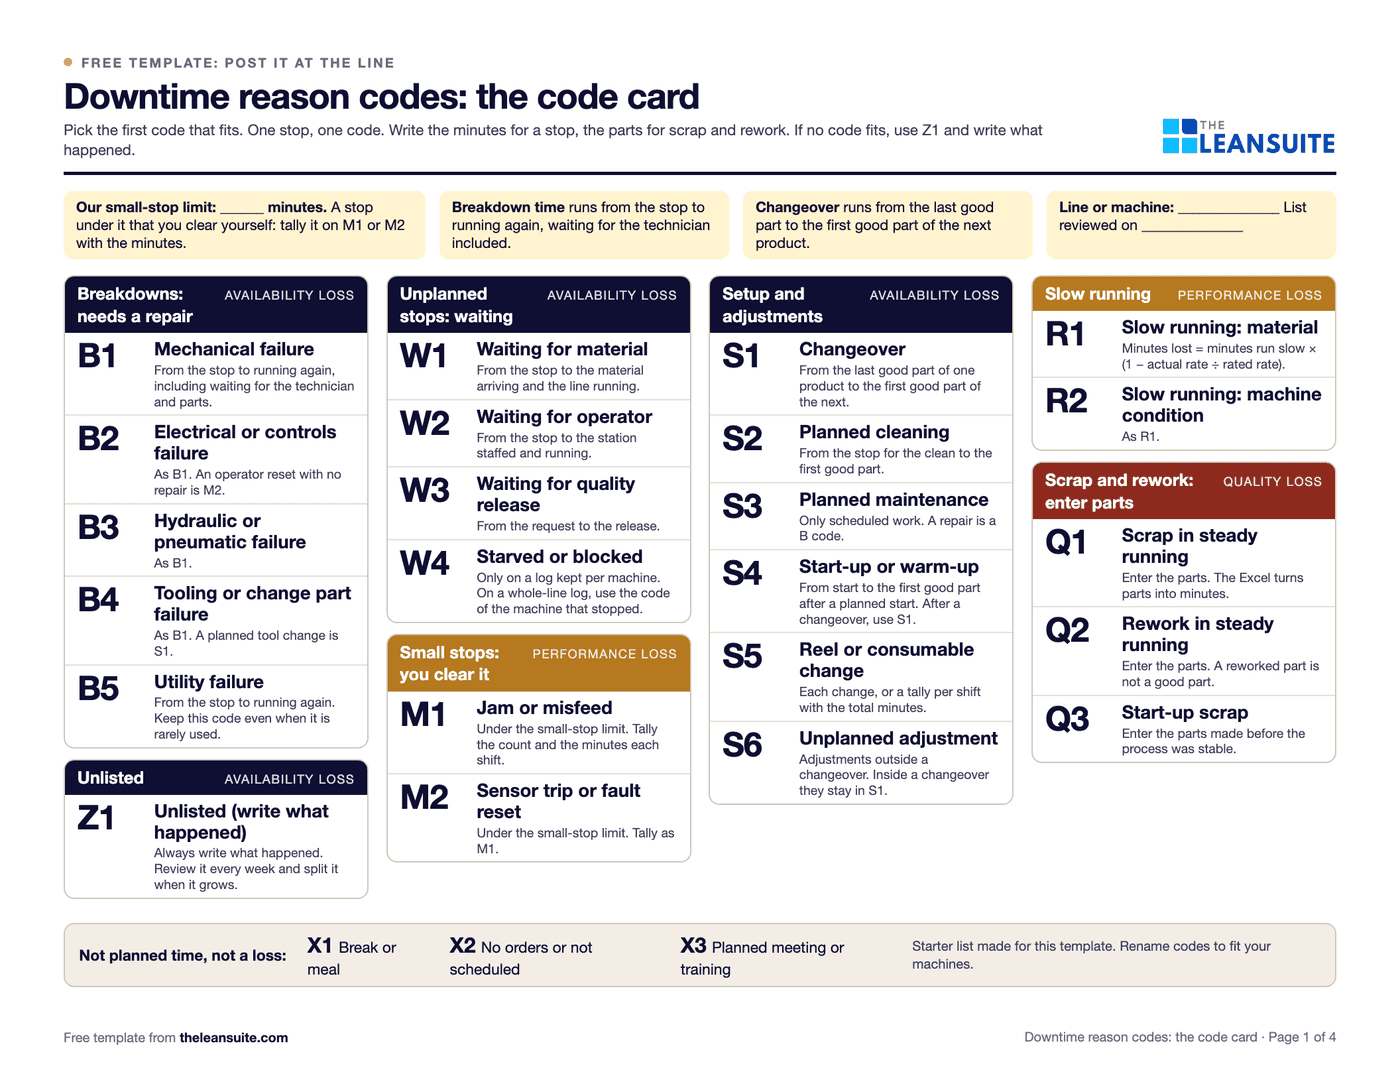 PDF and ExcelDowntime reason codes template26 starter codes mapped to the six big losses, a log with drop-downs, a Pareto by code and by loss, and a code card for the line.
Calculators (5)
- Free calculatorSMED changeover calculatorTime saved by moving changeover steps from internal to external, capacity freed per week and the smaller batch it allows.
- Free calculatorDPMO and sigma level calculatorDPMO, defects per unit, yield and sigma level from the defects found, units checked and opportunities per unit.
- Free online toolPareto chart makerPaste categories and counts: sorted bars, cumulative percentage line and the vital few at the 80% line, as a PNG or SVG.
- Free calculatorFirst pass yield (FPY) calculatorFirst pass yield at each step and rolled throughput yield (RTY) across the whole process.
- Free calculatorOEE calculatorOverall equipment effectiveness from shift time, downtime, ideal cycle time and part counts.
Buyer's guides
LeanSuite pages for these problems
- SMED
- AI SMED changeover analysis
- Quality Prioritization Matrix
- Cost of Poor Quality
- Non-Conformance (NCR)
- Quality Improvement
- Checklists
- Audit Management
- Competency Management
- Trainings (LMS)
- Job Cover Matrix
- AI Root Cause Analysis
- Loss & Cost Management
- Daily Issue Management
How LeanSuite handles each of these is on the page for electronics and PCB assembly plants.
Whirlpool tackled project visibility and continuous improvement across 14 manufacturing plants with LeanSuite. Read the Whirlpool case study.
FAQ
Lean in electronics and PCB assembly plants: common questions
On one SMT line, with the loss you can count most easily: changeover time, solder defects at AOI or first pass yield at test. Measure it for two weeks, fix the biggest cause with the people who run the line, write the new method down and only then move to the next line.
The first board of a new job, a new revision or a changed setup, checked before the lot runs. It covers every part number and value against the bill of materials, polarity and orientation, missing or extra parts, solder joints against the IPC-A-610 class the customer specifies, and the program and stencil revision. A failed item stops the lot until it is fixed and the board is checked again. If your customer specifies its own first article form or standard, use theirs.
Illustrative example: a lot of 400 boards, each with 300 parts and 1,200 solder joints, so 1,500 opportunities per board if you count parts plus joints. AOI and test find 54 defects on 46 boards. DPMO is 54 divided by (400 times 1,500), times 1,000,000: 54 divided by 600,000 is 0.00009, which is 90 DPMO. First pass yield is (400 minus 46) divided by 400, which is 354 divided by 400, or 88.5%. The process looks clean per opportunity, yet more than one board in nine needs touch-up. At 6 minutes a defect, the 54 defects take 324 minutes, or 5.4 hours of rework on one lot.
Workmanship is judged against IPC-A-610, at class 1, 2 or 3 as the customer specifies, and soldering is done to J-STD-001. Rework and repair follow IPC-7711/7721, moisture-sensitive parts are handled to J-STD-033, and ESD control programs follow ANSI/ESD S20.20. The quality system is usually ISO 9001, with IATF 16949, ISO 13485 or AS9100 added for automotive, medical and aerospace customers. Lean does not replace any of these; it makes the routines they call for run the same way on every shift.
SMED for feeder and stencil changeovers, a defect check sheet and Pareto for solder defects, first article checks and poka-yoke for wrong-part and polarity errors, and a skills matrix for IPC certification. Line balancing suits box build, where the work is manual and the takt changes with the mix. Root cause analysis and 8D handle test failures and customer returns.
See LeanSuite on your SMT line and inspection routines
Bring the routine you want to fix first. We will show you how LeanSuite handles it and what a 90-day pilot would cover.