

Lean playbook · Appliances and consumer durables
Lean playbook for appliance and consumer durables plants
Short answer
Start lean in an appliance plant on one assembly line, with three losses it already counts. Stations run over takt when the model mix changes, units fail end-of-line test, and cosmetic damage turns up at final inspection. A yamazumi chart weighted by the mix keeps a mixed-model line to takt. Checks at the station that makes a fault cut test failures. A monthly cost per defect type tells engineers which one to fix first. Once a fix holds, write it as a standard and send it to every plant that runs the same process.
Last updated:
7 problems on the floor, and the lean methods for each
Each problem says what it looks like, which methods address it, the first moves to make and the number to watch. Pick the one or two that cost your plant most; you do not need all of them at once.
Where an appliance assembly line loses time and quality
Sheet metal and moulding
Painting and foaming
End-of-line test
Pack and ship
Across the whole line
Mixed-model lines that drift out of balance
One line builds several models, and each needs a different amount of work at each station. When the mix or the daily volume changes, some stations run over takt while the next ones wait, and rebalancing by stopwatch and spreadsheet is slow enough that the line stays out of balance for weeks.
Lean methods
In LeanSuite
Upload a video of the line and Vision AI produces a Yamazumi chart, a takt comparison and rebalancing recommendations.
First moves
- Recalculate takt time whenever the daily volume or the shift pattern changes.
- Time the work elements of every model at each station and stack them on a yamazumi chart, weighted by the model mix.
- Move elements off the stations over takt, and sequence the models so two heavy units do not reach the same station one after the other.
- Update the standard work sheets on the day the line changes.
Number to watch: Cycle time against takt at every station, for the current model mix.
Units that fail end-of-line test
Leaks, electrical faults and failed function tests show up at the end of the line, after the unit has been closed. It goes to a repair loop, and the station that made the fault often never hears about it, so the same failure comes back.
In LeanSuite
Issue Management logs each defect where it is found.
First moves
- Record every failure with the fault and the station that made it, not only the test station that found it.
- Pareto the failures each week and take the top cause back to the station that creates it.
- Check joints, connections and wiring at the station that makes them, before the unit is closed in.
- Error-proof the top cause where you can, and run a root cause analysis on the rest.
Number to watch: First pass yield at end-of-line test, by model.
Scratches, dents and paint flaws
Cosmetic damage can start at the press, in the paint shop, on the assembly line or in packing, and it is often found only at final inspection or by the customer. When nobody knows where it happened, each area points at the one before it.
In LeanSuite
Issue Management logs each defect where it is found.
First moves
- Agree photos or limit samples of acceptable and unacceptable finish for each visible surface, and post them where the checks happen.
- Add a short finish check at each hand-off between press, paint, assembly and packing, so damage is logged where it is first seen.
- Mark each defect on a drawing of the unit by type and area, and run a 5 Whys on the spot that recurs most.
- Look at how parts and units are carried, stacked and stored between areas, not only at the processes.
Number to watch: Cosmetic defects per hundred units, by the area where each was first seen.
Fixing the loudest defect instead of the costliest
Rework, scrap and warranty returns are counted in different places, so nobody sees what each defect type really costs. Engineers work on whatever drew the last complaint, while a quieter and more expensive defect keeps running.
In LeanSuite
The Quality Matrix puts a cost on it across product lines and processes, and Kaizen & Projects runs the root-cause project and verifies the fix.
First moves
- Put a cost on each defect type every month: rework hours, scrap, warranty claims and extra inspection.
- Rank defect types by that cost, not by how often they come up in meetings.
- Give the top two a project with an owner, and compare the cost before and after to confirm the fix.
Number to watch: Cost of poor quality per month, by defect type and product line.
Ideas from the line that go unanswered
Assembly workers see waste every day, at their station and between stations. When ideas go into a box or a spreadsheet and nobody replies, people stop putting them forward.
Lean methods
In LeanSuite
Employees submit ideas from the shop floor, a reviewer approves or rejects each one with feedback, and an approved idea launches a Kaizen project.
First moves
- Answer every idea within an agreed number of days, yes or no, with the reason.
- Let teams make small changes in their own area without waiting for sign-off, and record what they changed.
- Show the ideas raised and the changes made on the team board, with the names of the people behind them.
Number to watch: Ideas answered on time, and ideas put into practice per person each year.
Kaizen across plants with no view of the savings
Kaizen events and projects run in every plant and department, each tracked its own way. Leaders cannot see which projects are late, who is leading too many of them or what the program has actually saved.
In LeanSuite
Kaizen & Projects runs every improvement with A3, DMAIC and PDCA templates, Kanban and Gantt views, and projected and actual savings.
First moves
- Start every project from one short charter: the problem, the owner, the target and the expected savings.
- Keep all projects in one list with status and owner, and review it every month.
- Agree with Finance how savings are counted, hard and soft apart, and check them before a project closes.
Number to watch: Projects closed on time, and verified hard savings against the yearly target.
A fix in one plant that the others never hear of
One plant solves a problem, and a sister plant building a similar product is still fighting it months later. Improvements travel by email and slide deck, if at all, and nobody checks whether they were taken up.
Lean methods
In LeanSuite
Best Practice Management turns a local win into an approved, step-by-step standard and pushes it to every relevant site at once.
First moves
- Write each proven fix as a short standard with photos, the before-and-after numbers and the conditions it needs.
- Send it to the plants that run the same process, with one person at each who decides whether it applies.
- Track adoption plant by plant, and check it on the floor at the next visit.
Number to watch: Best practices adopted by the plants they apply to.
More small fixes in the production, quality and warehouse and logistics sections of the kaizen idea bank.
A 90-day starting plan
One line or product family, two problems, measured before and after. The point of the first 90 days is a result the plant believes and a method it can repeat, not a plant-wide program.
The 90 days, with the gate that ends each stage
- Days 1 to 30Baseline one assembly lineDone when: The board shows baseline numbers and two problems each have an owner.
- Days 31 to 60Fix the top two lossesDone when: Each fix has a before-and-after number and a written standard.
- Days 61 to 90Hold the gains and share themDone when: The gains have held for a month and another line or plant has started its baseline.
Days 1 to 30
Baseline one assembly line
Pick one line and measure where it loses time and quality before changing anything.
- Choose the line with the most test failures, rework or overtime, and name an owner and a sponsor.
- Measure for two weeks: cycle time against takt by station, first pass yield at end-of-line test, cosmetic defects per hundred units and the monthly cost of rework and scrap.
- Start a short daily meeting at a board by the line, on the same numbers.
- Walk the line from press to packing with operators and quality, and list where defects start.
- Choose the two biggest losses to work on first.
Days 31 to 60
Fix the top two losses
Solve the two problems at the station that causes them, and prove the change with numbers.
- Rebalance the line for the current mix on a yamazumi chart and update standard work.
- Pareto the test failures, move the top check upstream and error-proof one cause.
- Add the finish check at each hand-off and chart where damage is first seen.
- Answer every idea the line team raises within the agreed time.
Days 61 to 90
Hold the gains and share them
Keep the new standards on every shift, then pass them to the other plants.
- Audit the new standards on every shift and act on every gap.
- Put every project from the 90 days in one list with its verified savings.
- Write the fixes that worked as standards and send them to the plants that run the same process.
- Pick the next line and start its baseline.
The KPIs to track
Track them per line and shift, on a board the team sees every day. Set targets from your own baseline, not from someone else's plant.
| KPI | What it tells you | How to measure it | Free help |
|---|---|---|---|
| Cycle time against takt | Whether each station can keep up with demand for the current model mix. | Timed cycle per station, weighted by the mix, compared with available time divided by demand. | Takt time calculator |
| First pass yield at end-of-line test | The share of units that pass test without repair. | Units passing first time divided by units tested, per model and shift. | First pass yield (FPY) calculator |
| Defects per hundred units | How often a unit carries a defect, cosmetic or functional, on a scale you can compare across lines. | Defects found divided by units inspected, times 100, by the area where each was first seen. | Defect check sheet |
| Cost of poor quality | What rework, scrap, warranty and extra inspection cost, and which defect type costs most. | Monthly total of rework hours, scrap, warranty claims and inspection, costed by defect type. | Cost of poor quality (COPQ) calculatorCost of poor quality (COPQ) worksheet |
| Verified savings | What the improvement program saved, counted the way Finance counts it. | Hard and soft savings from closed projects, checked before each project closes, against the yearly target. | Kaizen savings calculatorCost savings tracker |
| Ideas answered on time | Whether people on the line still think it is worth sharing an idea. | Ideas answered within the agreed time divided by ideas raised, per month. | Idea suggestion form |
| Best practice adoption | Whether a fix proven in one plant reaches the others. | Plants that have adopted each practice divided by the plants it applies to. | Yokoten tracker (horizontal deployment) |
By the numbers
Public figures for this industry or for the wider sector it belongs to, each linked to the report or government table it comes from and checked against it on October 3, 2026. More in our lean manufacturing statistics and benchmark charts.
2.0
Electrical equipment, appliance and component manufacturing recorded 2.0 injury and illness cases per 100 full-time workers in 2024, against 2.7 for all manufacturing and 2.3 for all private industry.
Total recordable cases per 100 full-time workers, U.S. private industry, 2024 data from the Survey of Occupational Injuries and Illnesses. This BLS group (NAICS 335) also covers electrical equipment and components, not only household appliances.
Source: U.S. Bureau of Labor Statistics, Table 1. Incidence rates of nonfatal occupational injuries and illnesses by industry and case types, 2024 (2024 data, table updated January 22, 2026)
16×
Plants in the top quarter for relying on reactive maintenance had 3.3 times more downtime and 16 times more defects than plants in the bottom quarter.
Same NIST survey. NIST notes the link is an association, not proof of cause.
Source: NIST, Economics of Manufacturing Machinery Maintenance: A Survey and Analysis of U.S. Costs and Benefits (NIST AMS 100-34) (June 2020)
Injury and illness rate by industry, 2024
- Motor vehicles5.6
- Beverage and tobacco3.7
- Furniture3.5
- Food3.3
- Primary metals3.3
- Nonmetallic mineral products, incl. glass3.3
- Fabricated metal products3.2
- Transportation equipment3.2
- Motor vehicle parts2.9
- Plastics and rubber products2.8
- HVAC and refrigeration2.4
- Paper2.4
- Machinery2.3
- All private industry2.3
- Electrical equipment and appliances2.0This industry
- Printing1.6
- Chemicals1.6
Total recordable cases per 100 full-time workers, 2024: Motor vehicles 5.6, Beverage and tobacco 3.7, Furniture 3.5, Food 3.3, Primary metals 3.3, Nonmetallic mineral products, incl. glass 3.3, Fabricated metal products 3.2, Transportation equipment 3.2, Motor vehicle parts 2.9, Plastics and rubber products 2.8, All manufacturing 2.7, HVAC and refrigeration 2.4, Paper 2.4, Machinery 2.3, All private industry 2.3, Electrical equipment and appliances 2, Printing 1.6, Chemicals 1.6.
Free templates, calculators and buyer's guides
Templates (22)
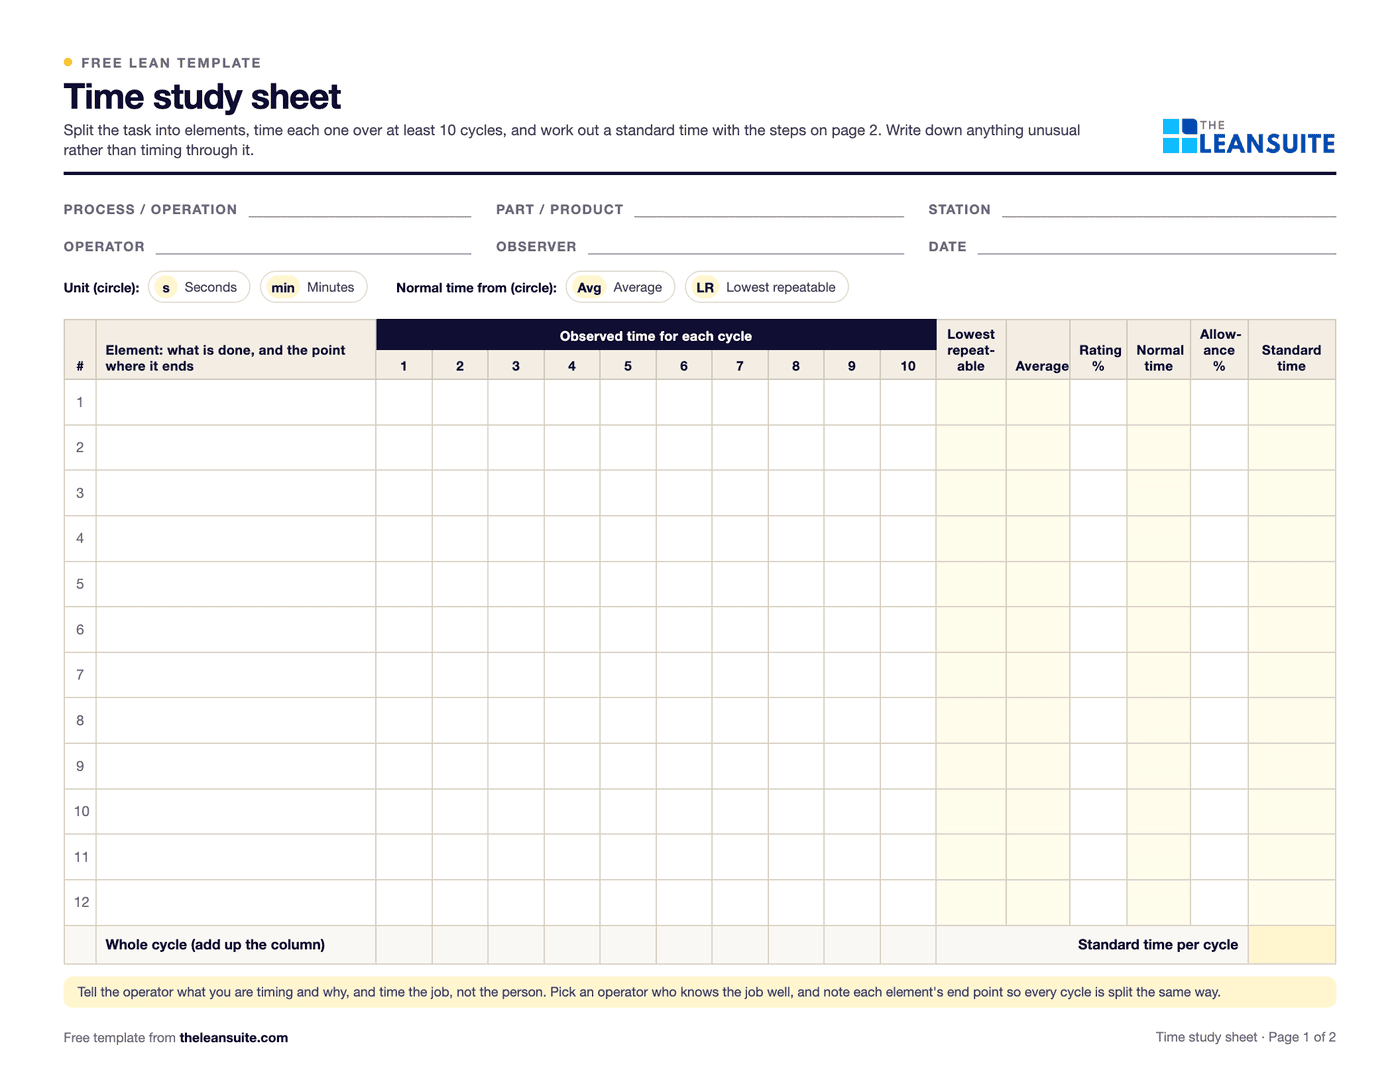 PDF and ExcelTime study sheetTime each element over 10 cycles and work out the average, lowest repeatable and standard time. Excel does the sums.
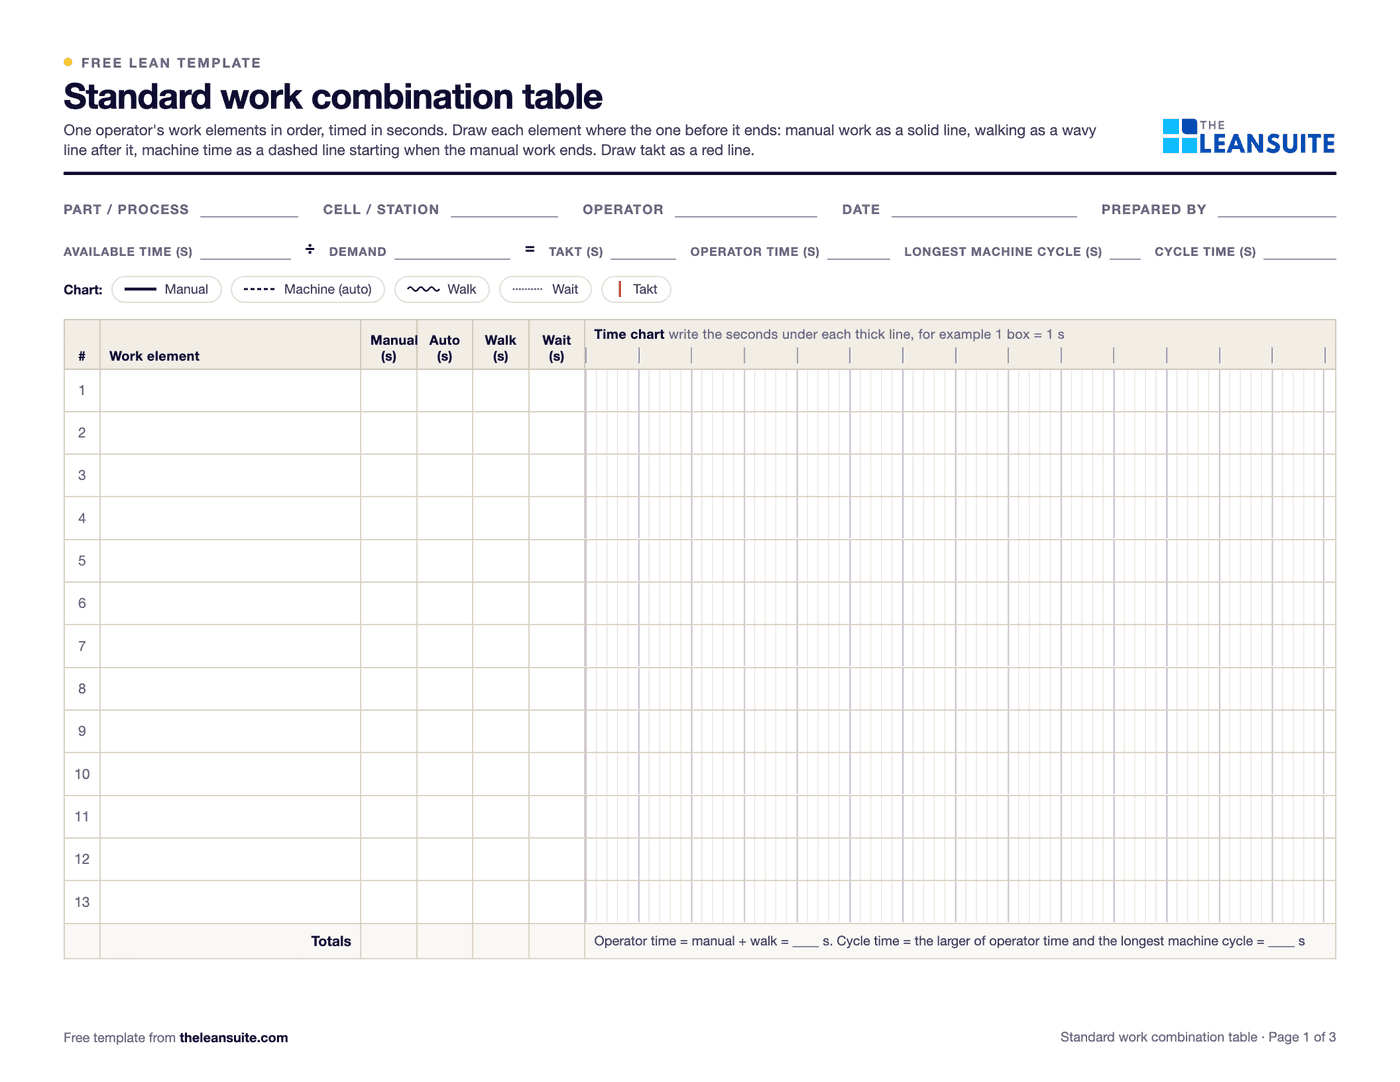 PDF and ExcelStandard work combination tableOne operator's manual, machine, walk and wait time on a time chart against takt, with machine cycles and a process capacity sheet.
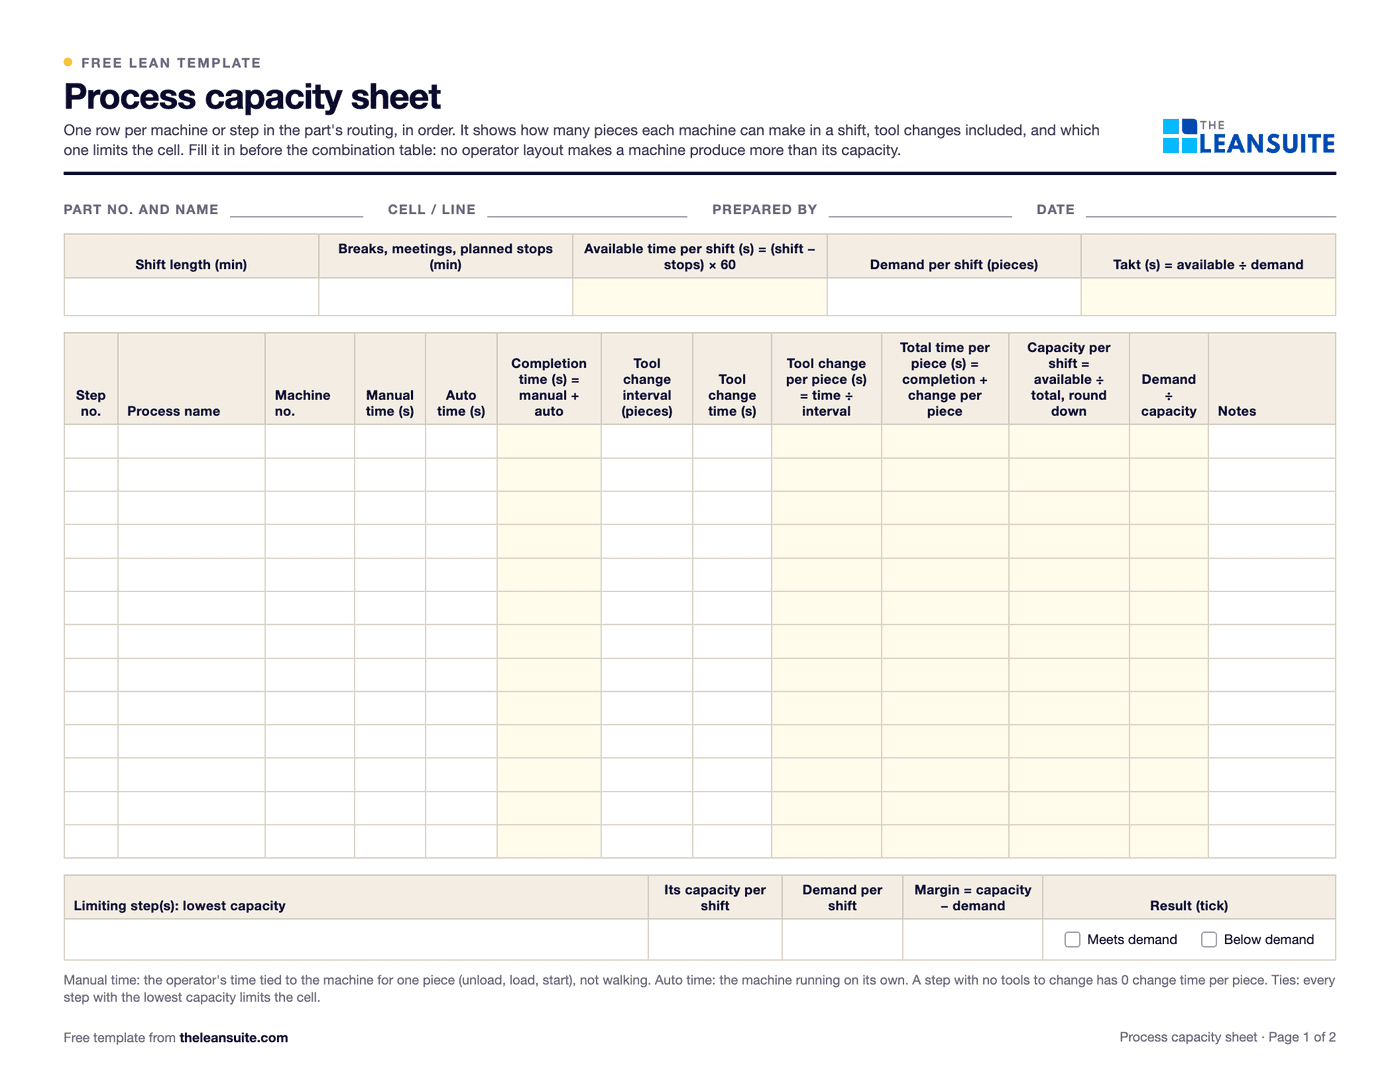 PDF and ExcelProcess capacity sheet templateEach machine in a part's routing with manual, auto and tool change time, its capacity per shift, and the step that limits the cell against demand.
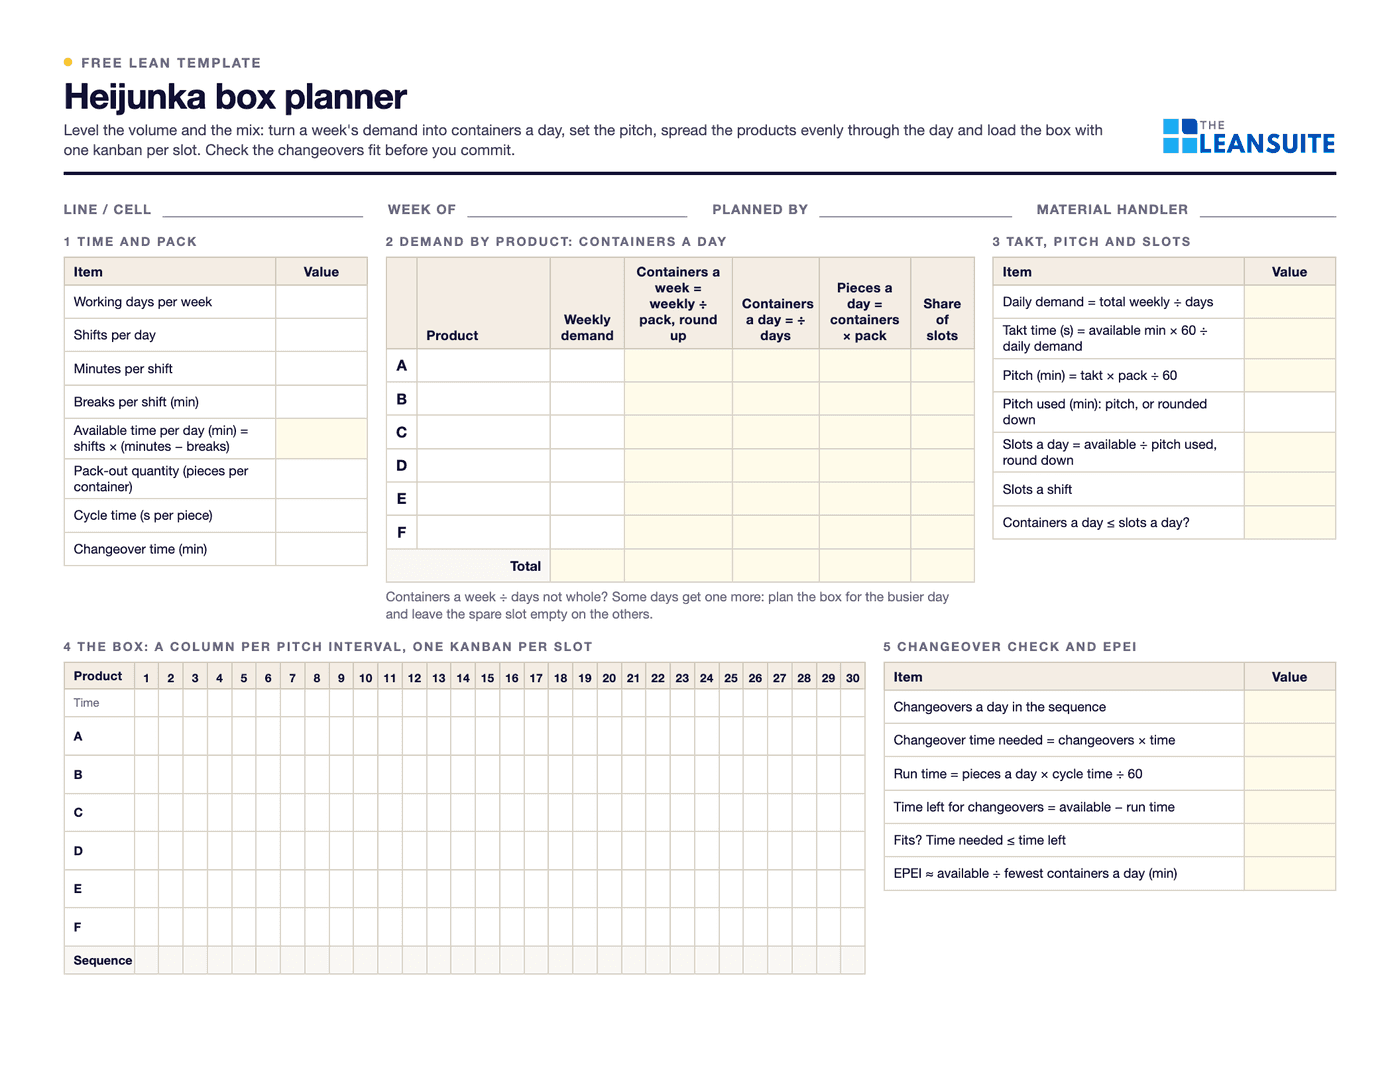 PDF and ExcelHeijunka box planner (production leveling)Weekly demand turned into containers a day, takt, pitch and slots, a leveled sequence of products and the heijunka box, with a check that the changeovers fit.
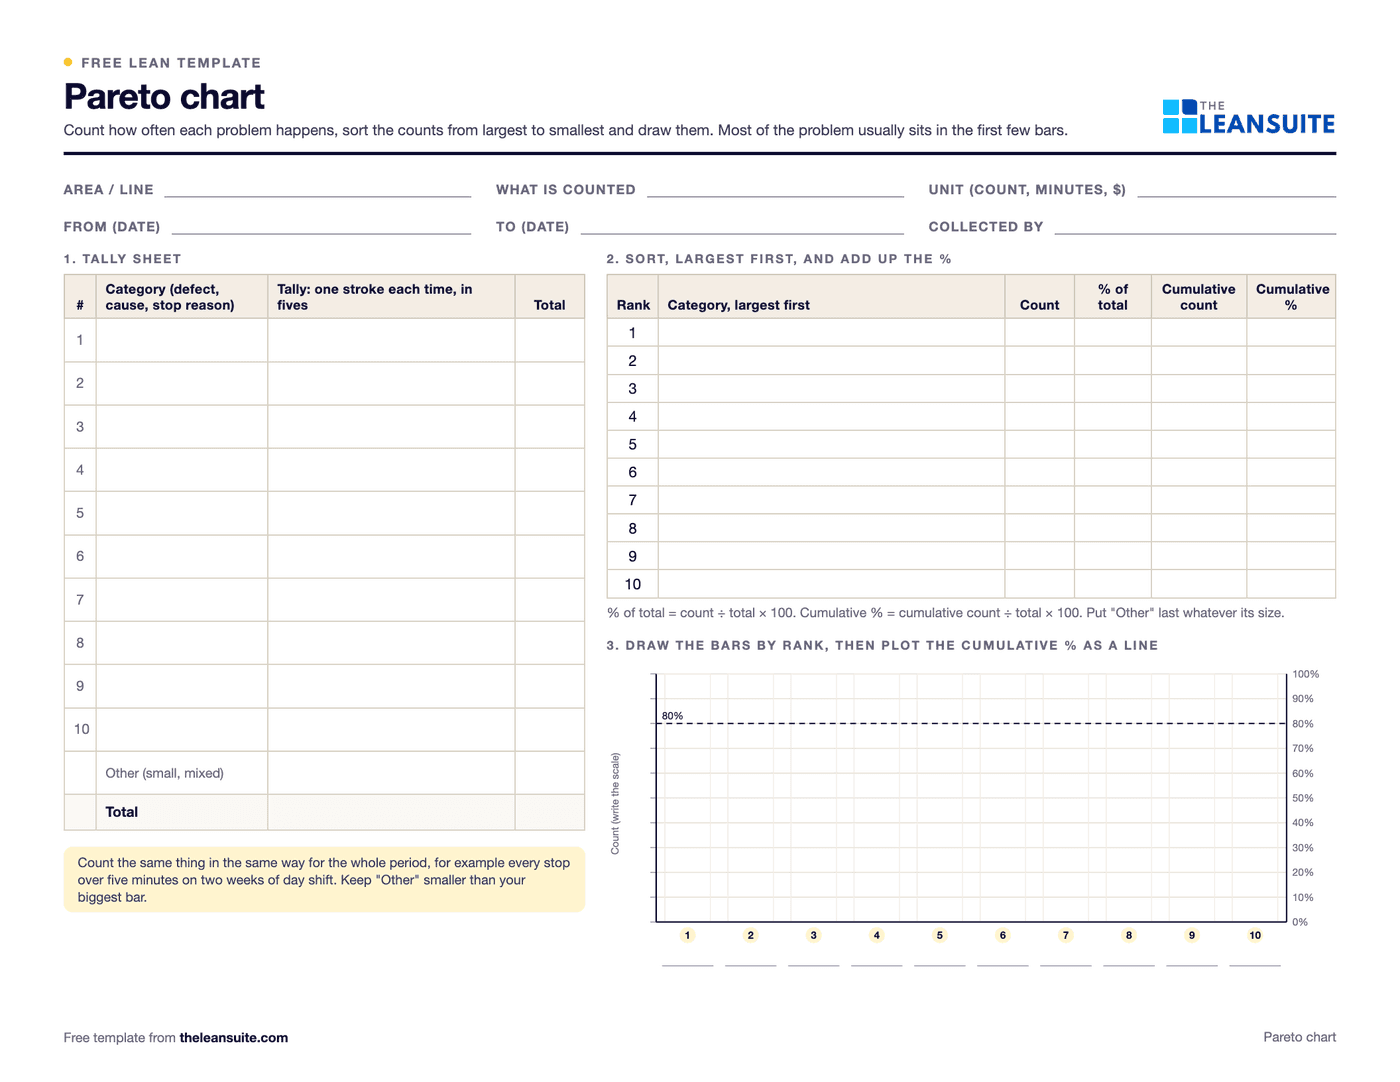 PDF and ExcelPareto chart templateA tally sheet, the Pareto by count and by cost with the cumulative line and the 80% cut, and a before and after comparison. Excel sorts and draws it.
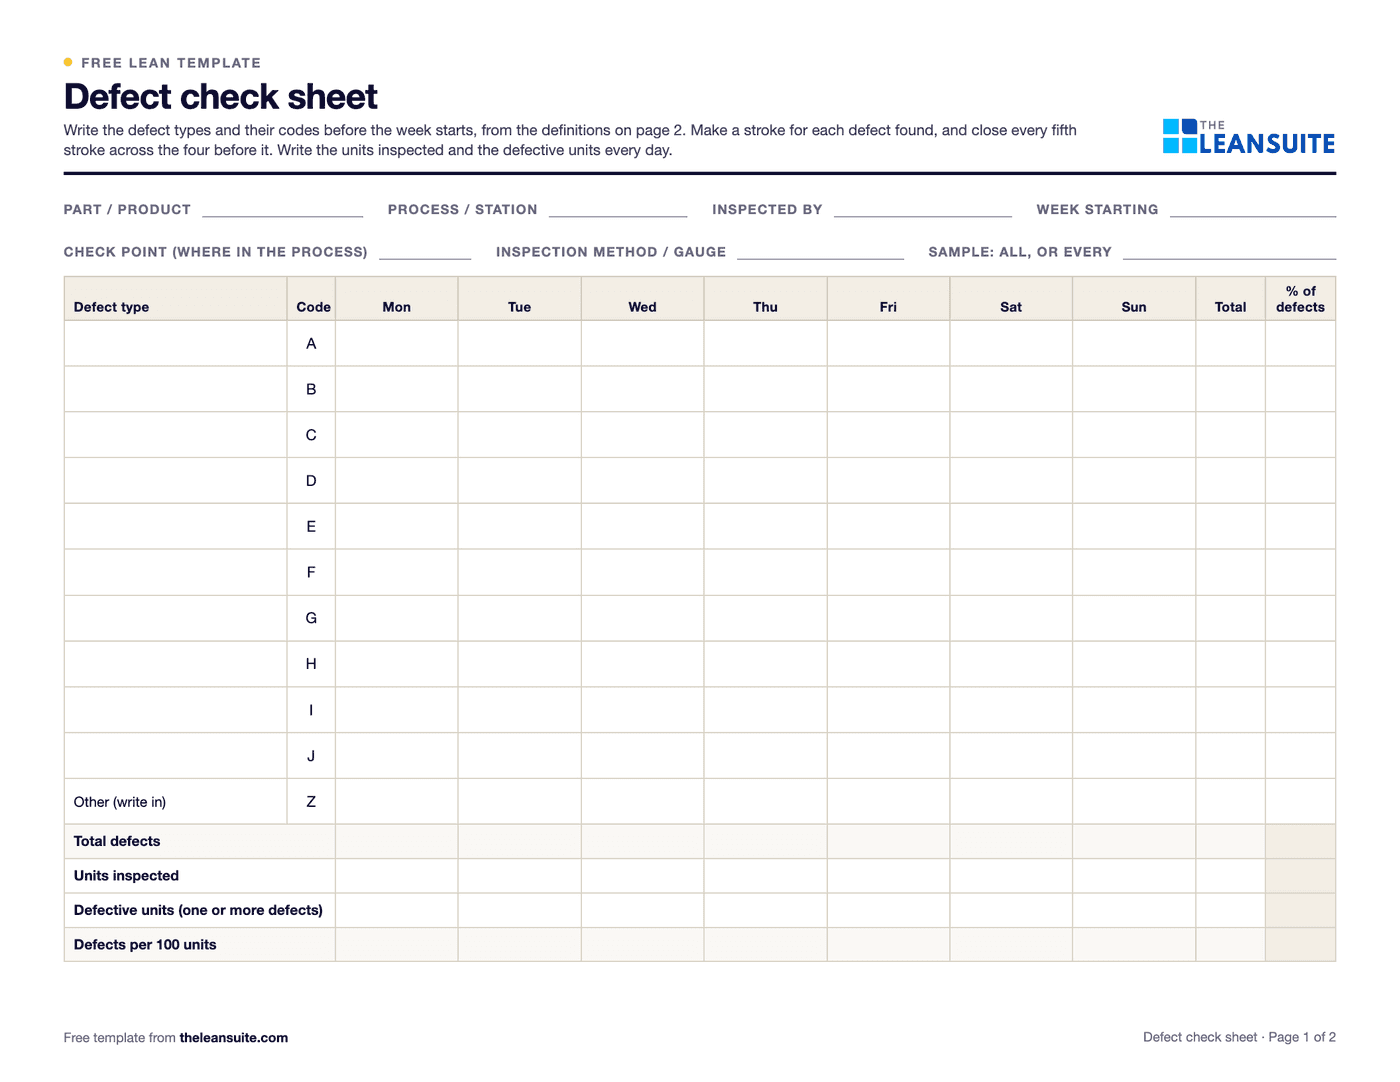 PDF and ExcelDefect check sheetTally defects by type and day, with units inspected, defect rates, a location sheet and the week's Pareto.
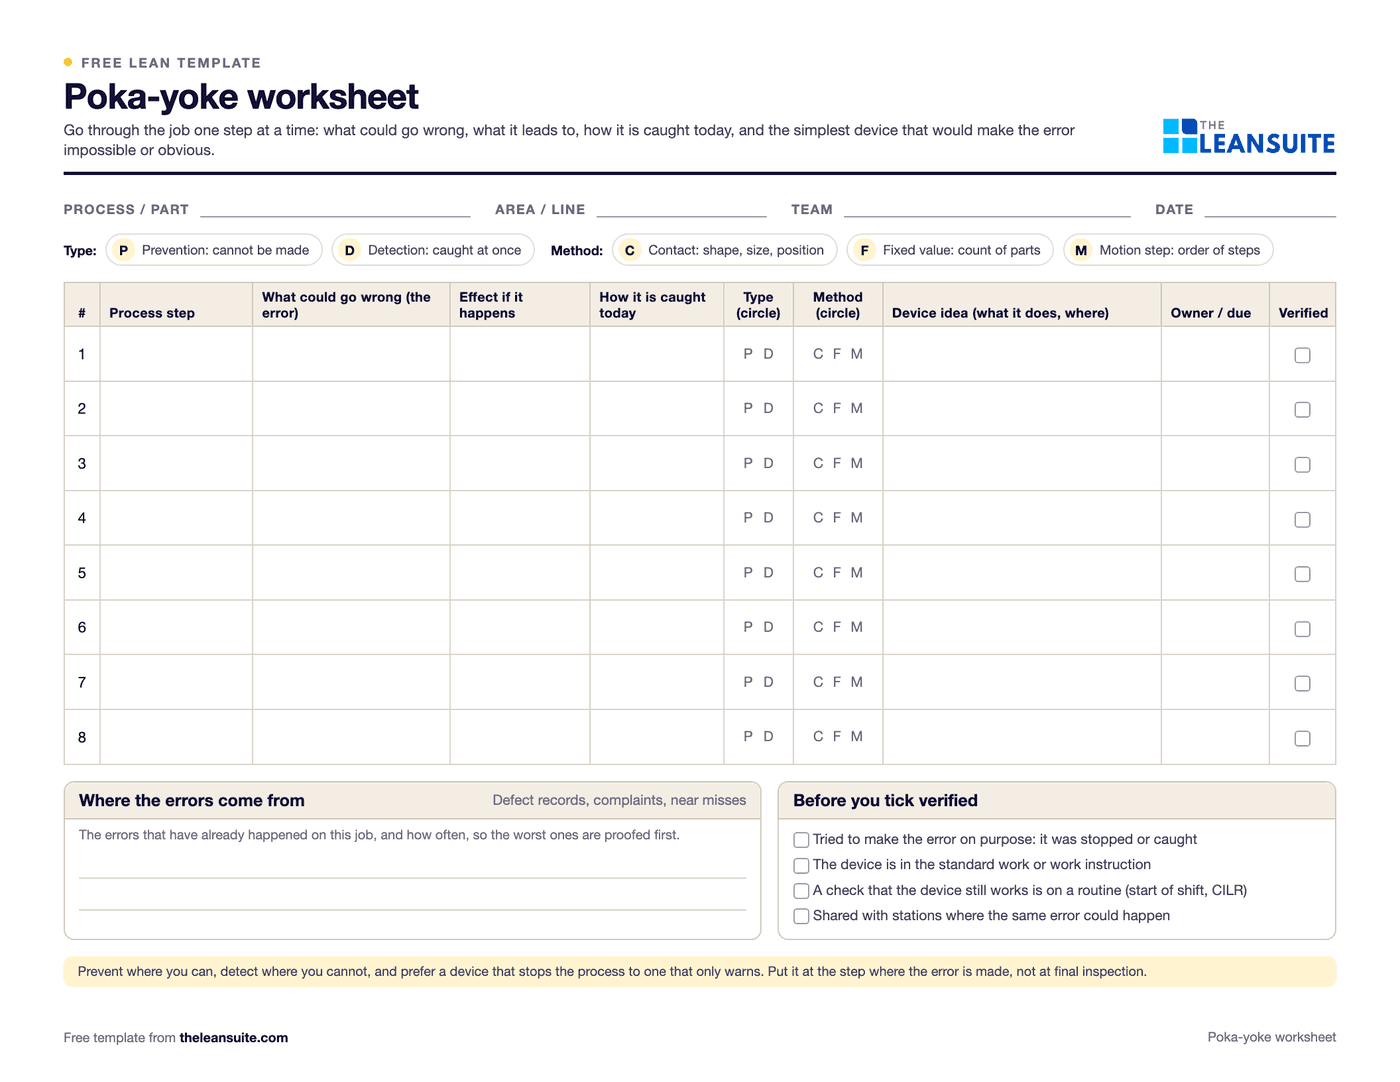 PDF and ExcelPoka-yoke worksheetEach step's errors and what they cost, the device (approach, function, method), payback, and a log that proves each device works.
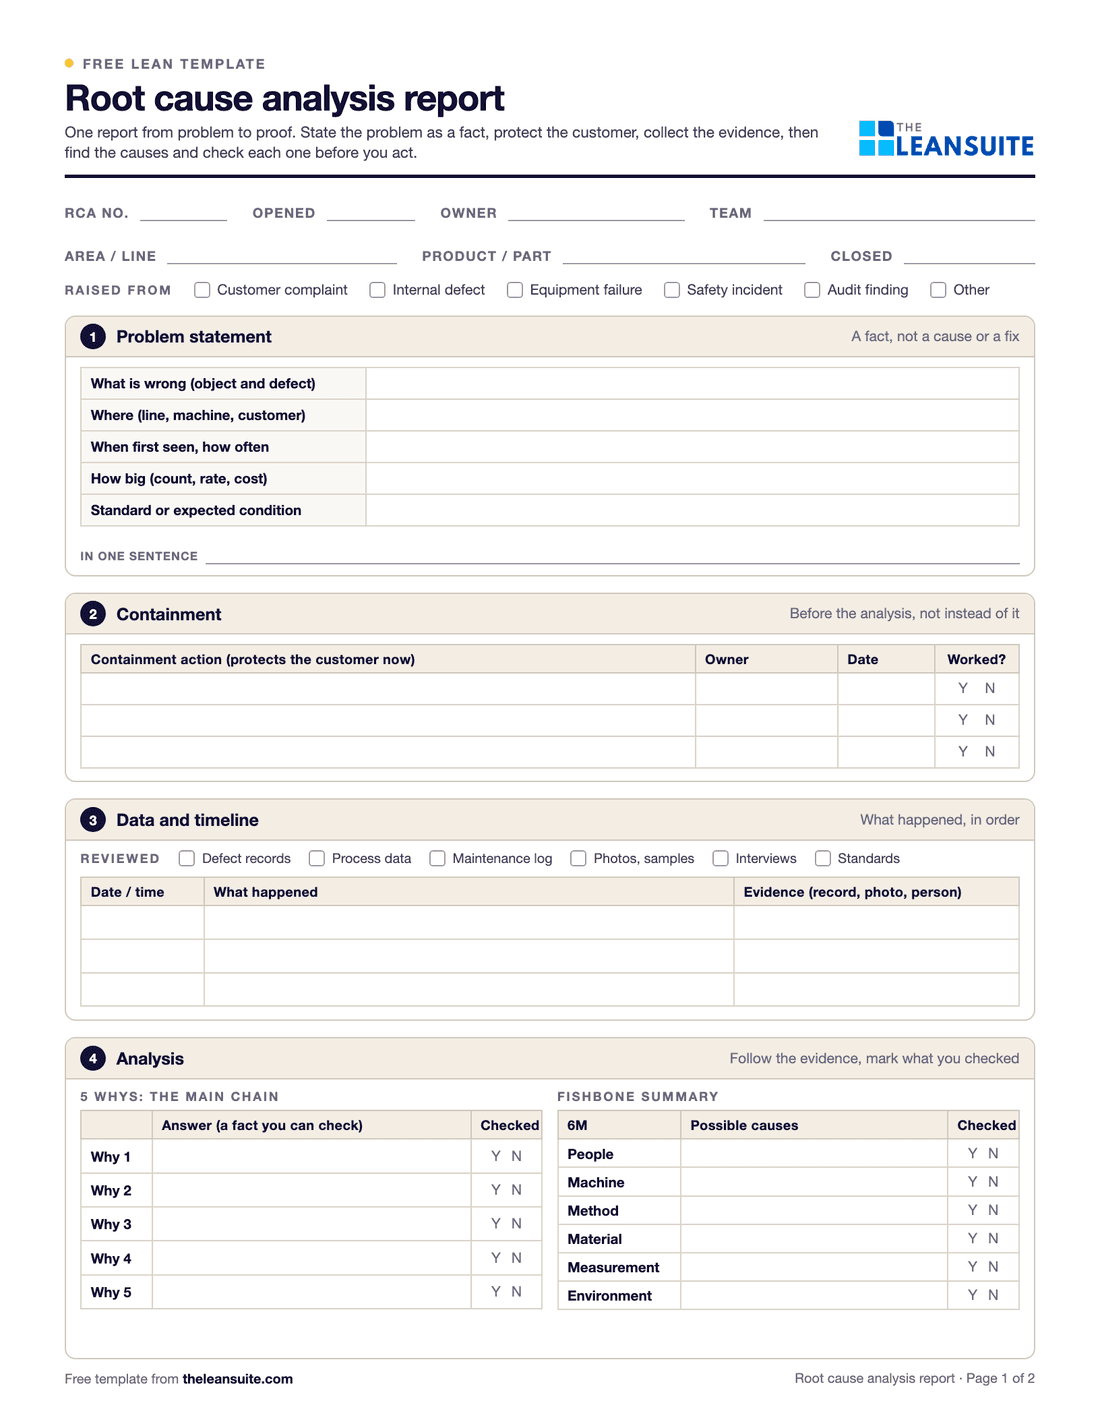 PDF and ExcelRoot cause analysis templateOne report from problem statement to proof: containment, evidence, analysis, verified causes, actions and the effectiveness check.
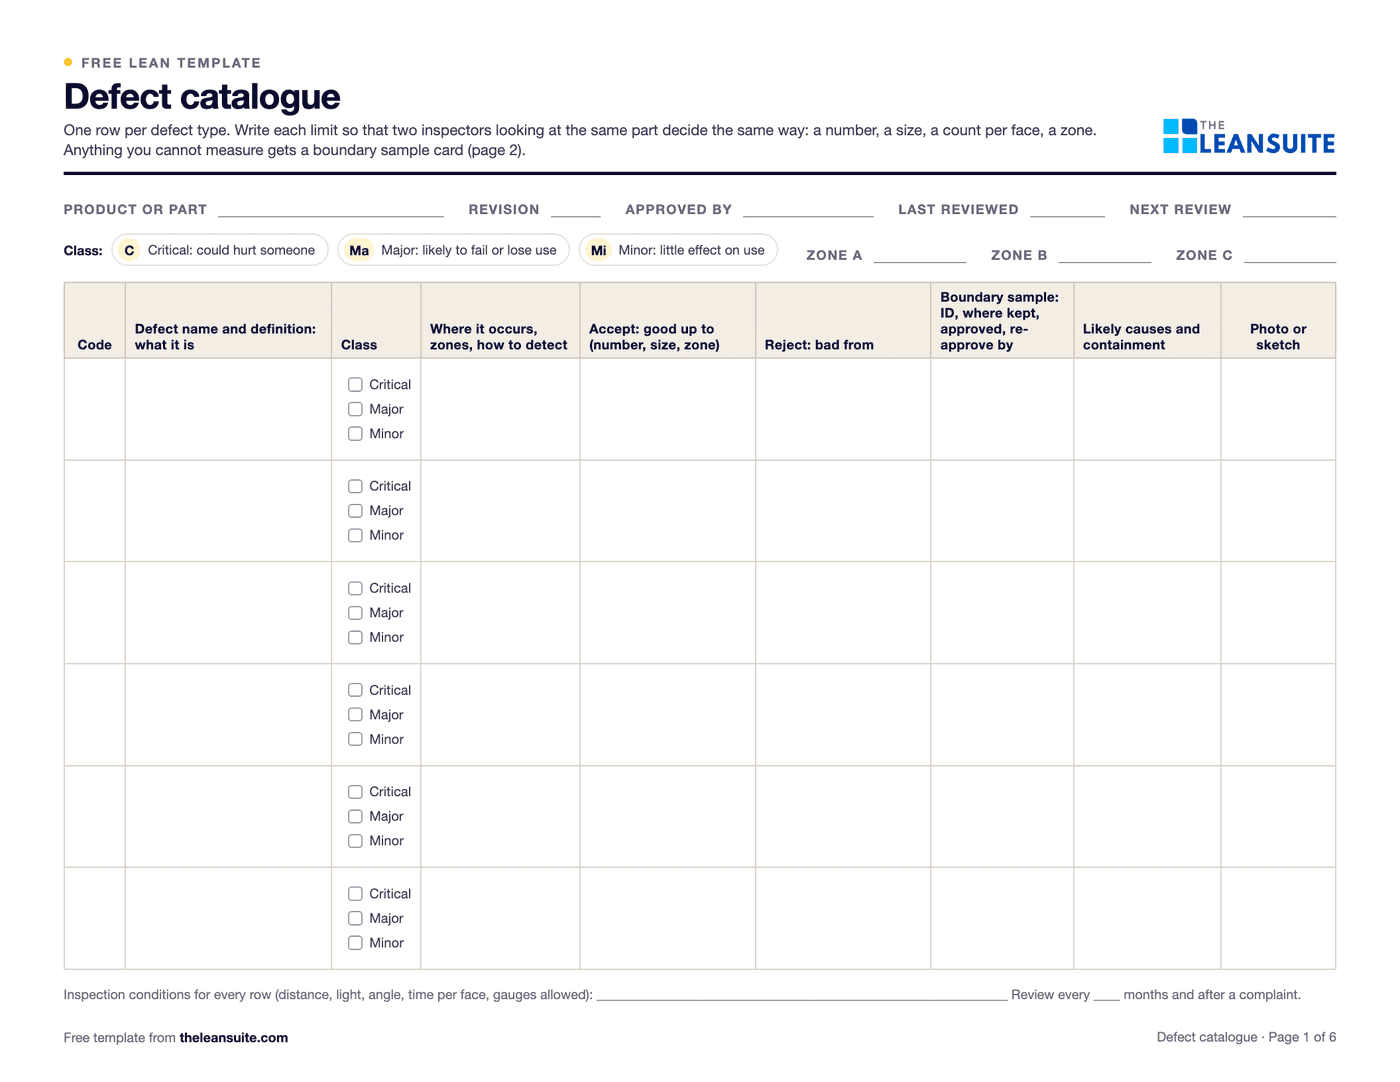 PDF and ExcelDefect catalogue template with boundary samplesEvery defect with a definition, a class and the reason for it, measured accept and reject limits by zone, boundary samples, a defect log with DPU and Pareto, and an inspector agreement check.
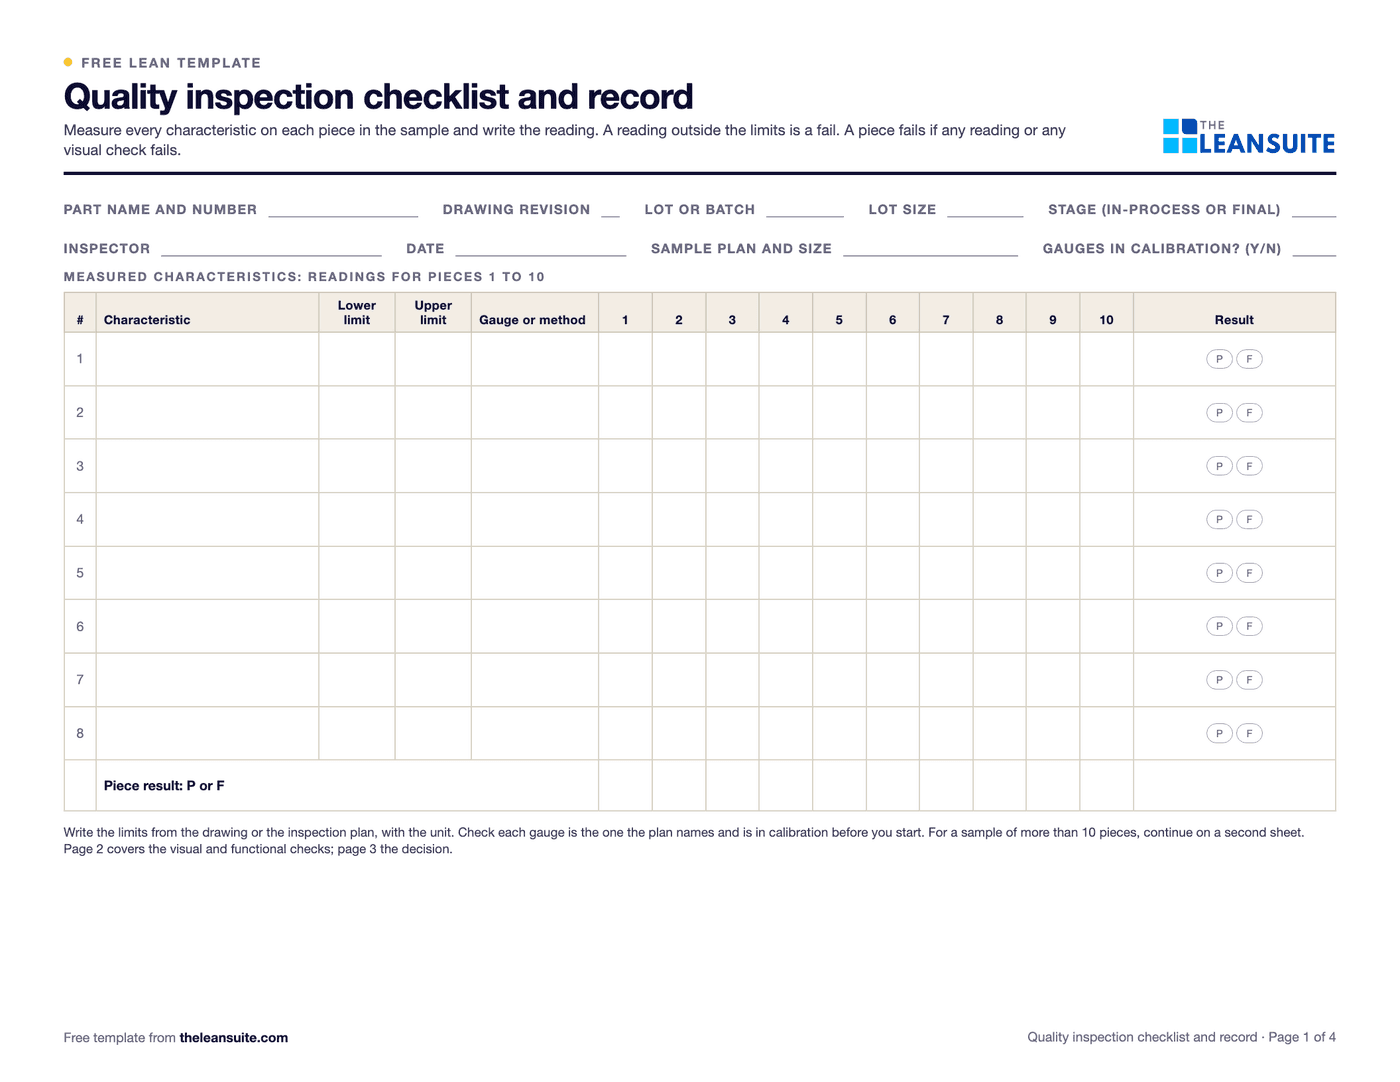 PDF and ExcelQuality inspection checklistAn in-process and final inspection record: measured characteristics, visual checks, a decision and first pass yield.
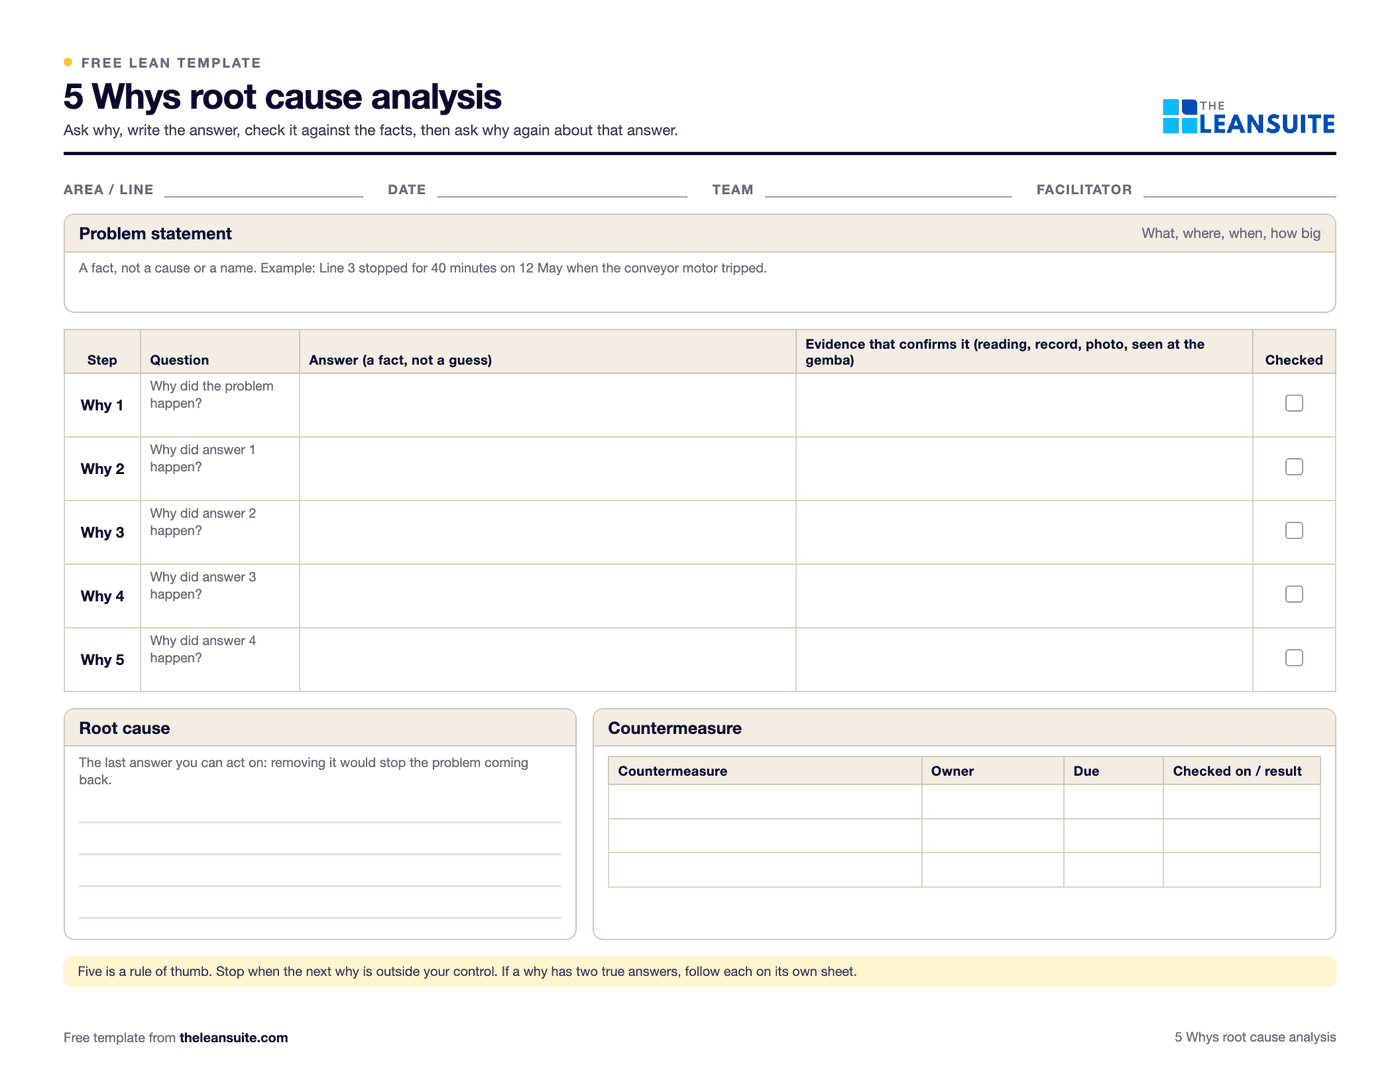 PDF and Excel and Word5 Whys templateA problem statement, a why chain that can branch, evidence for every answer, root causes and countermeasures that are checked.
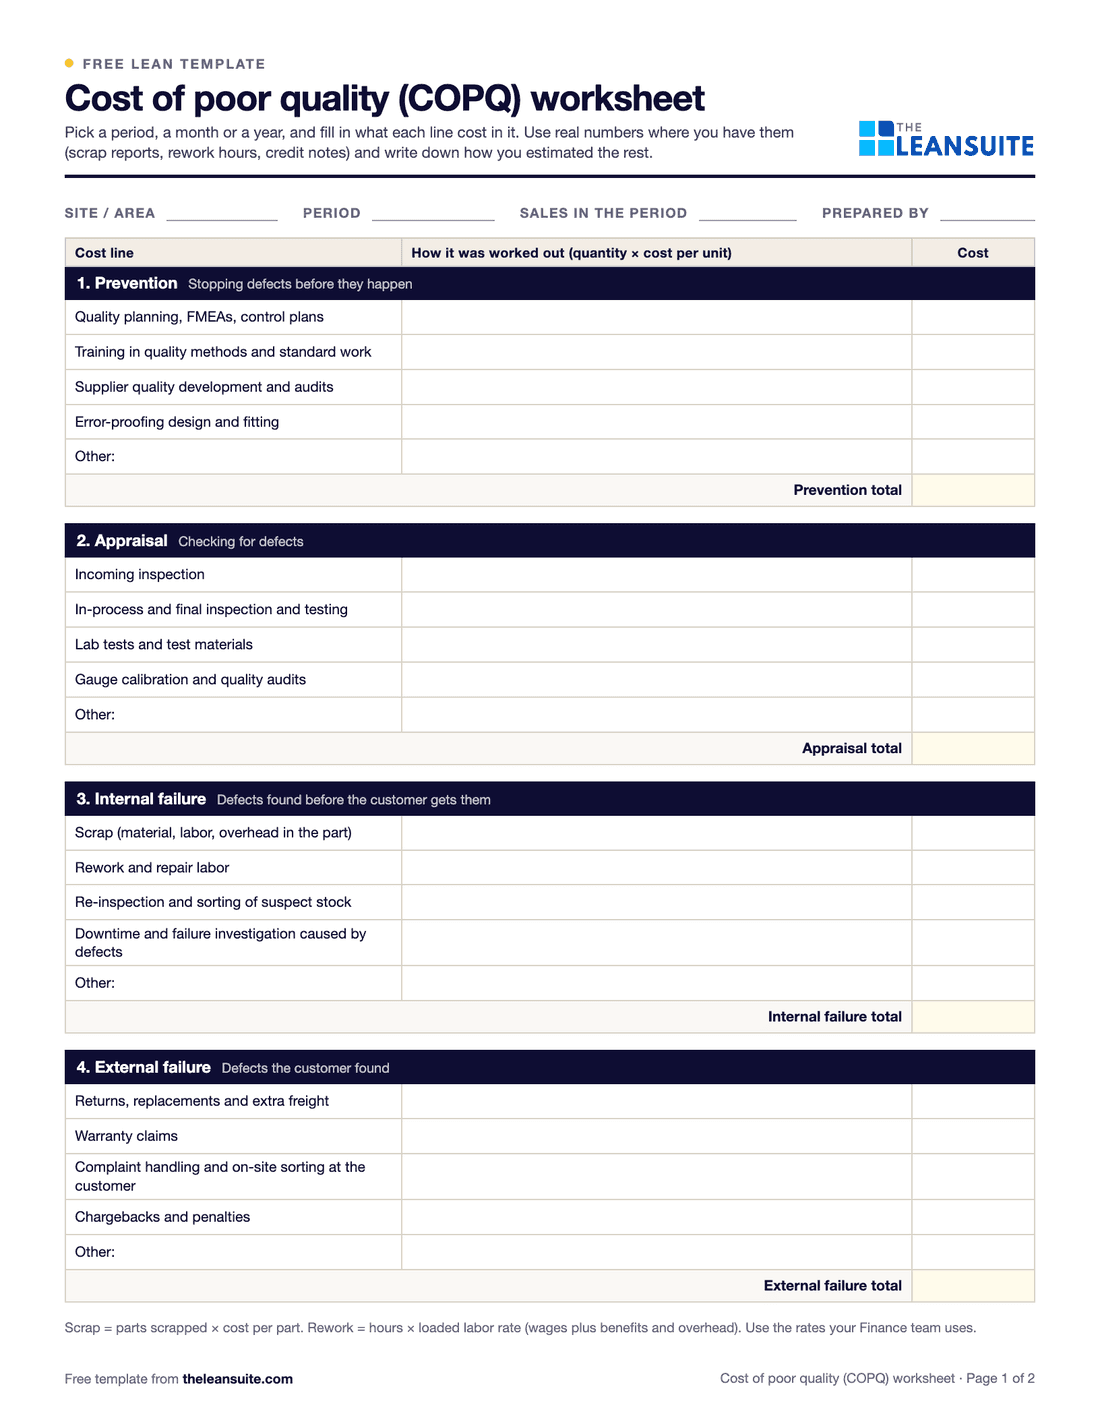 PDF and ExcelCost of poor quality (COPQ) worksheetCost of quality by prevention, appraisal, internal and external failure, with COPQ as a share of sales.
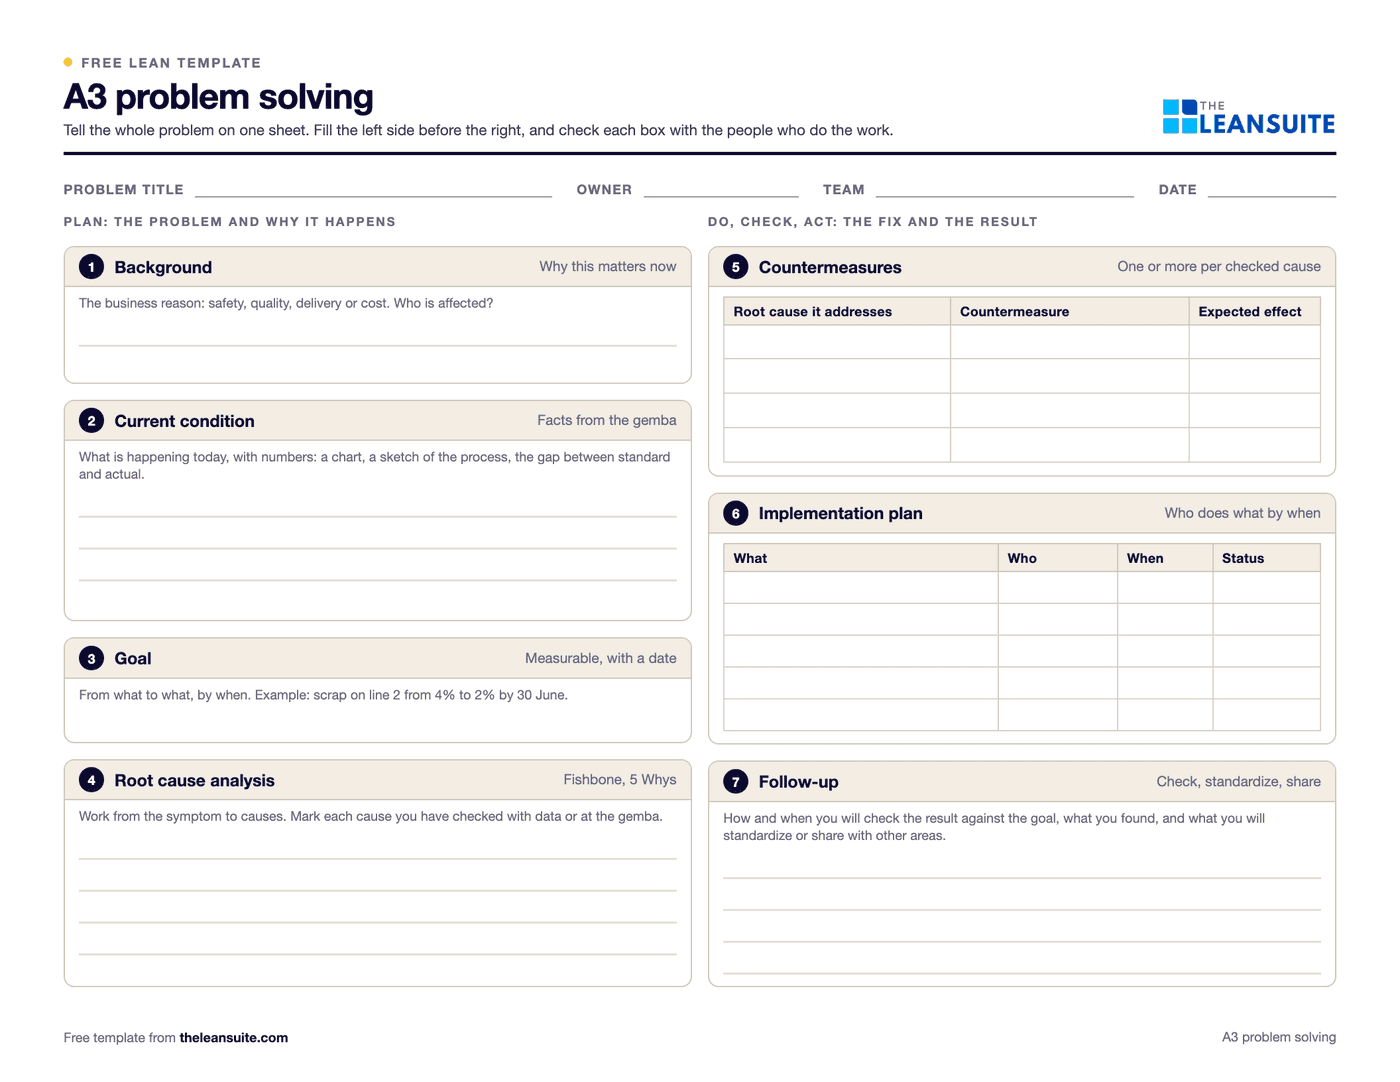 PDF and Excel and WordA3 problem solving templateThe standard seven-box A3 from background to follow-up, with a filled-in worked example. PDF and Excel.
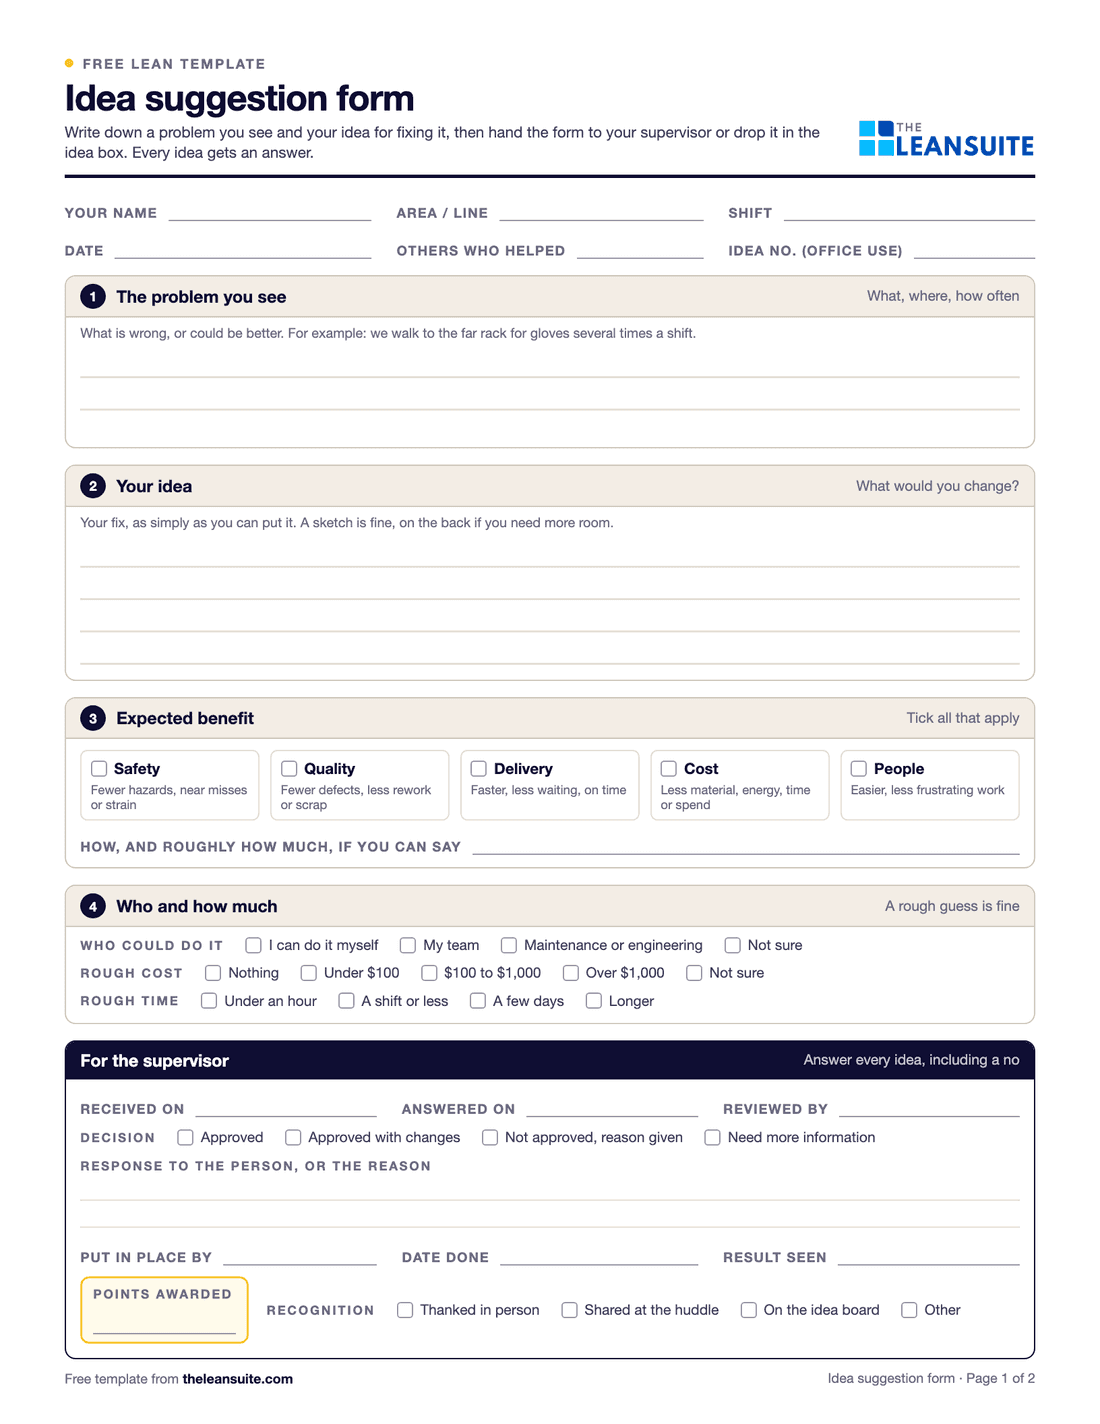 PDF and ExcelIdea suggestion formA one-page idea form with the supervisor's answer and points, and an idea log that tracks days to answer.
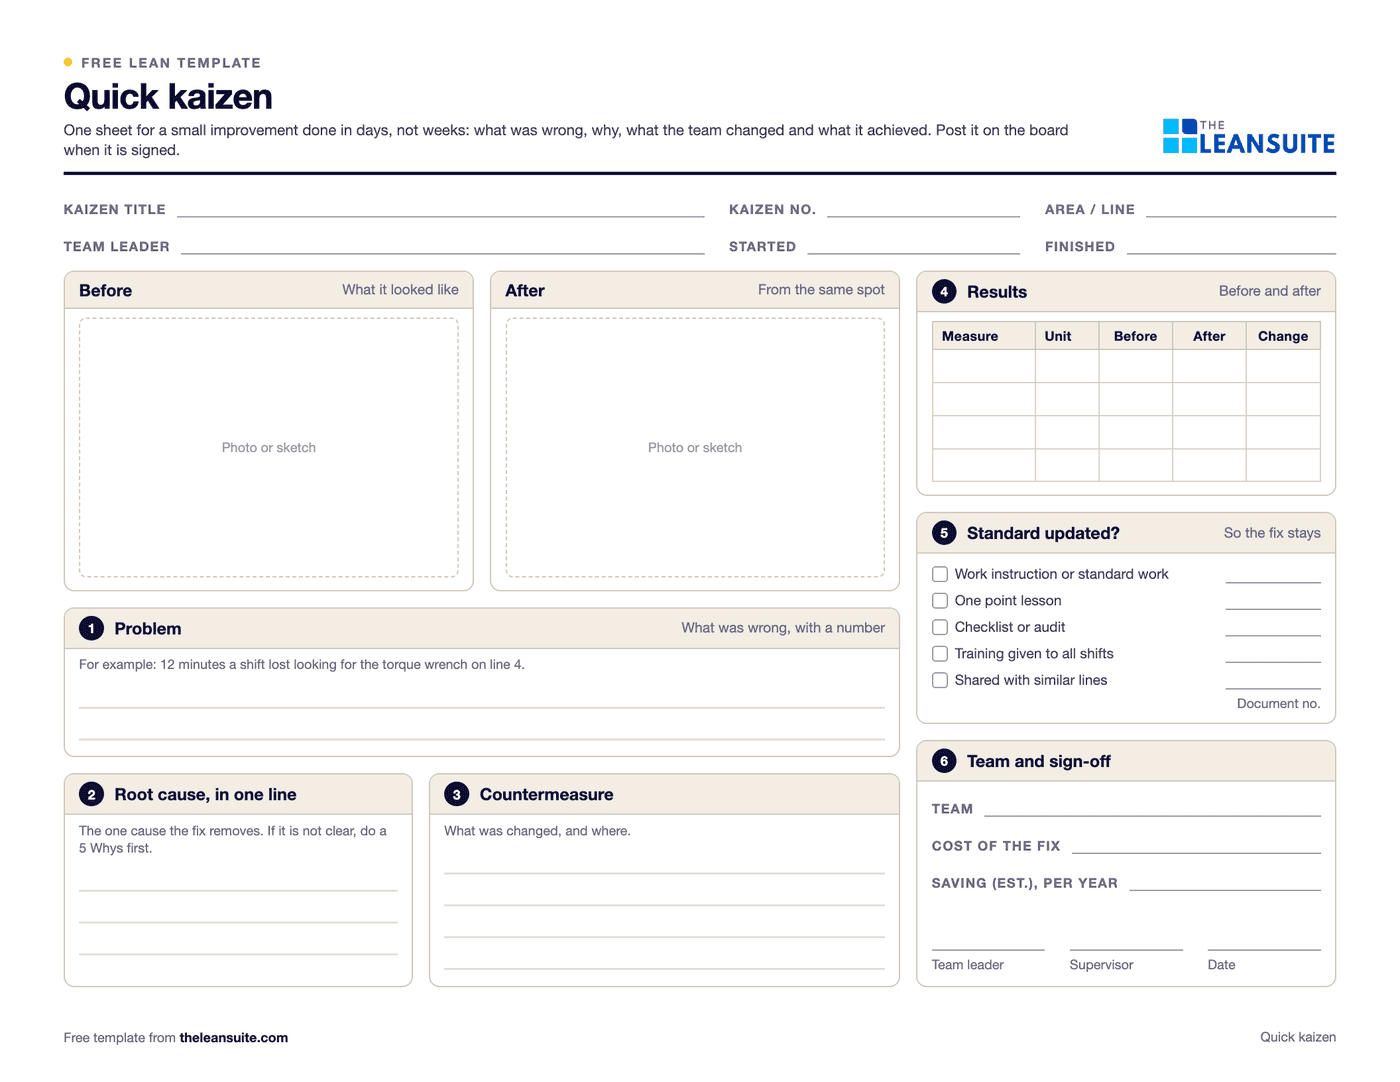 PDF and ExcelQuick kaizen templateOne page for a small improvement: before and after, the cause, the countermeasure, the results and whether the standard changed.
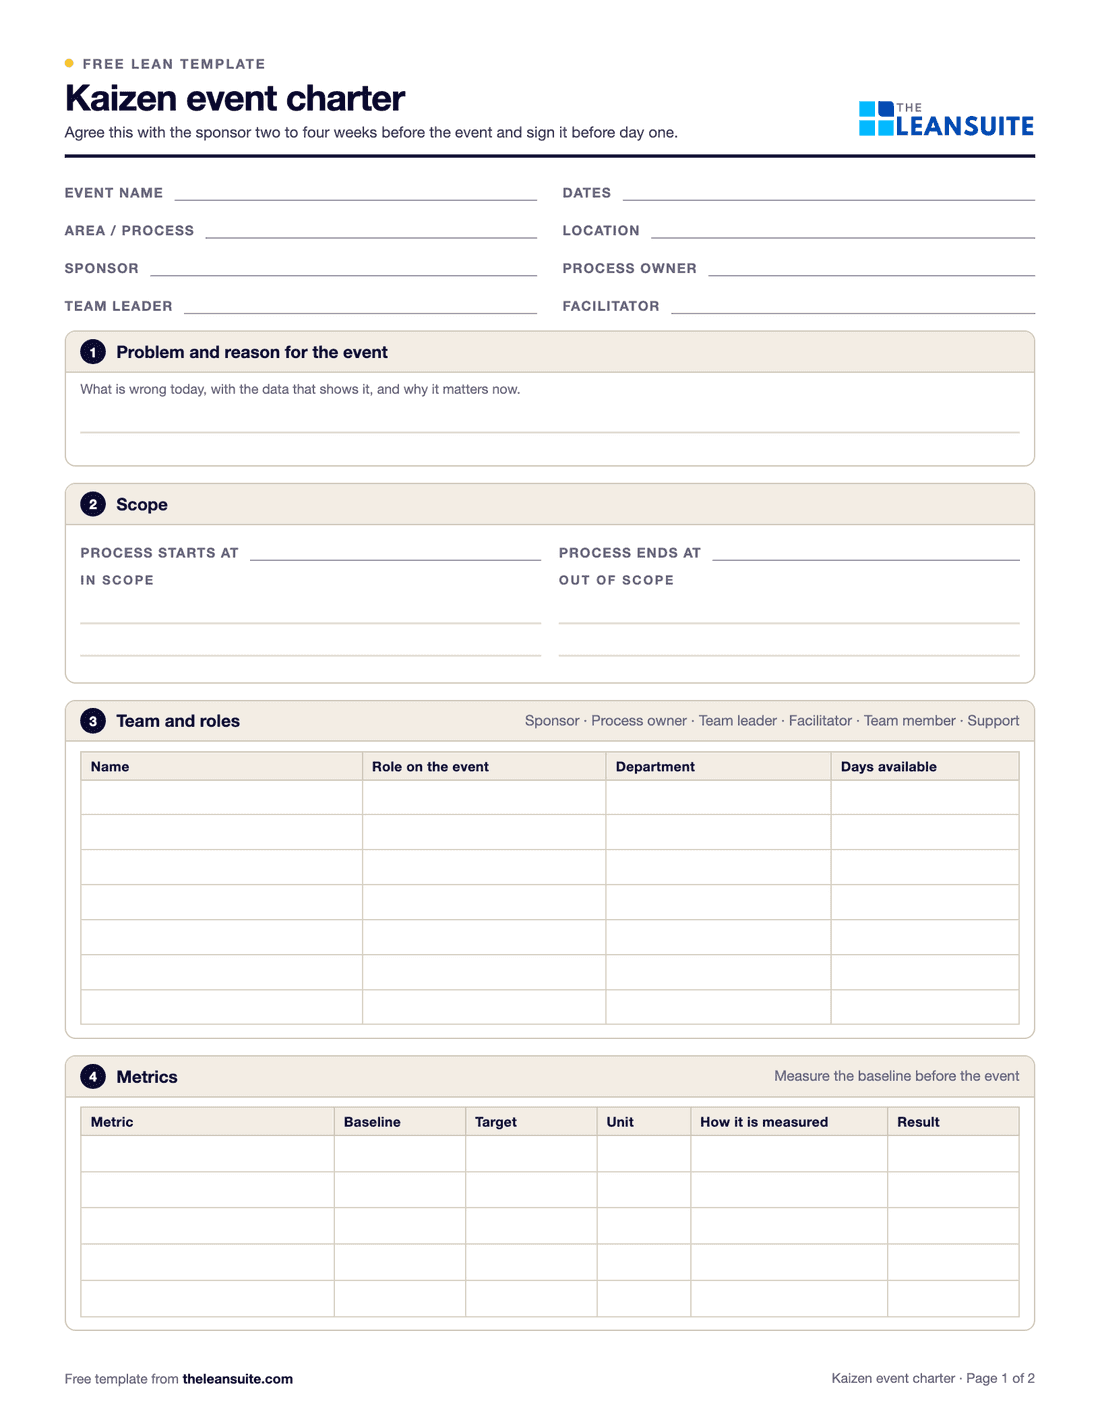 PDF and Excel and WordKaizen event charter templateProblem, goal, scope in and out, boundaries, metrics from baseline to target, team and roles, and sign-off before day one.
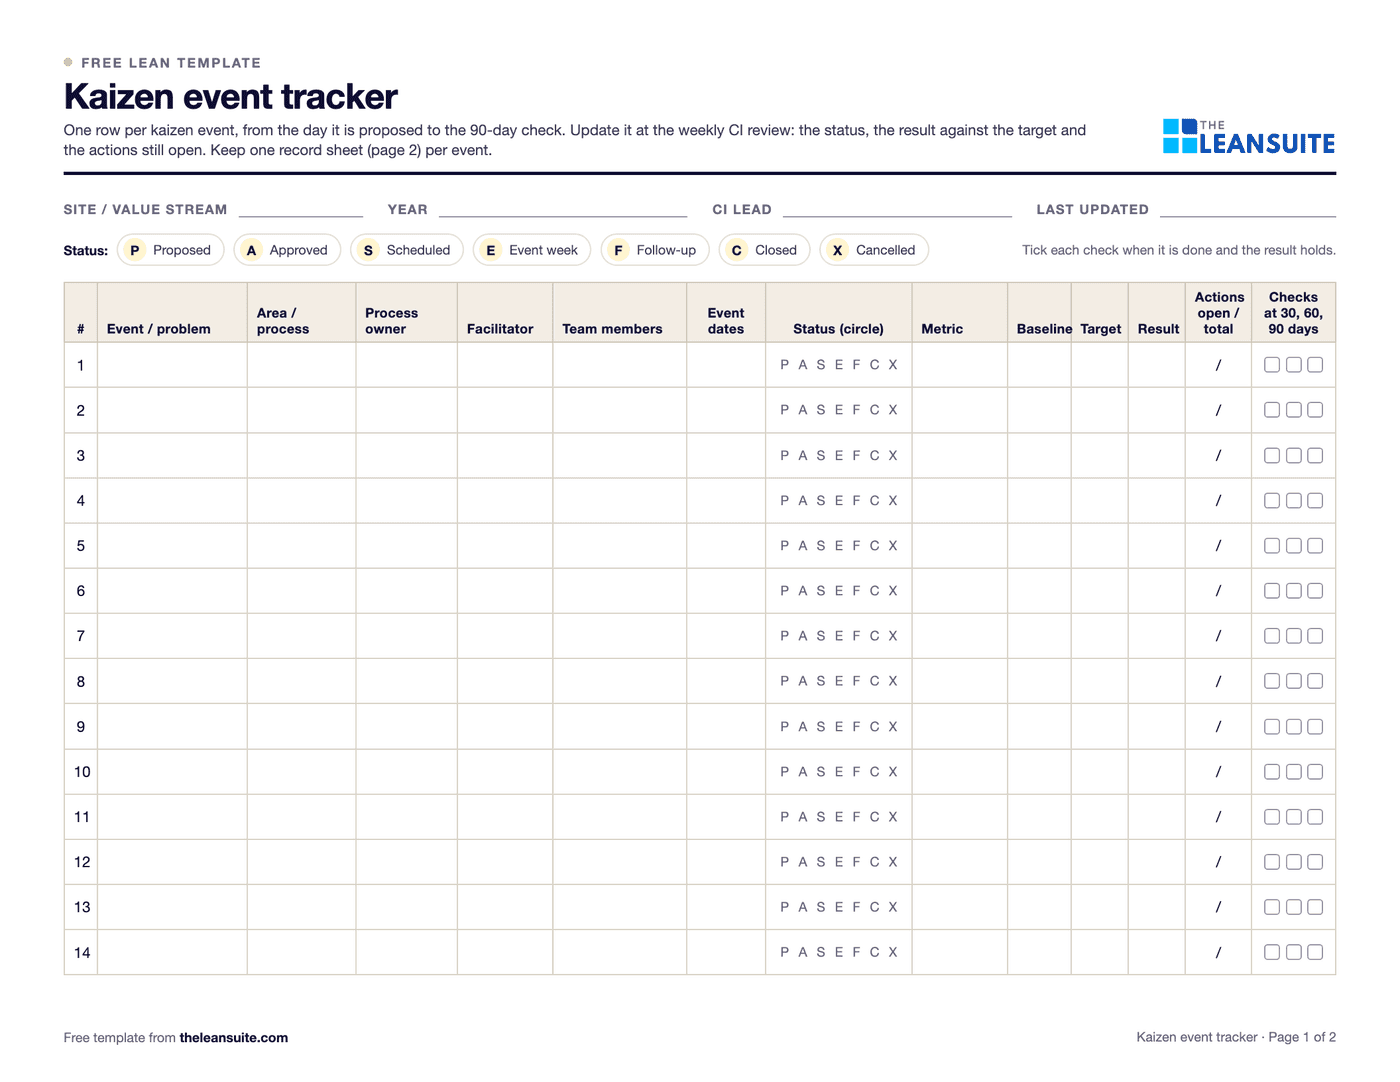 PDF and ExcelKaizen event trackerEvery kaizen event on one sheet: status, roles, the metric against target, open actions and the 30, 60 and 90 day checks.
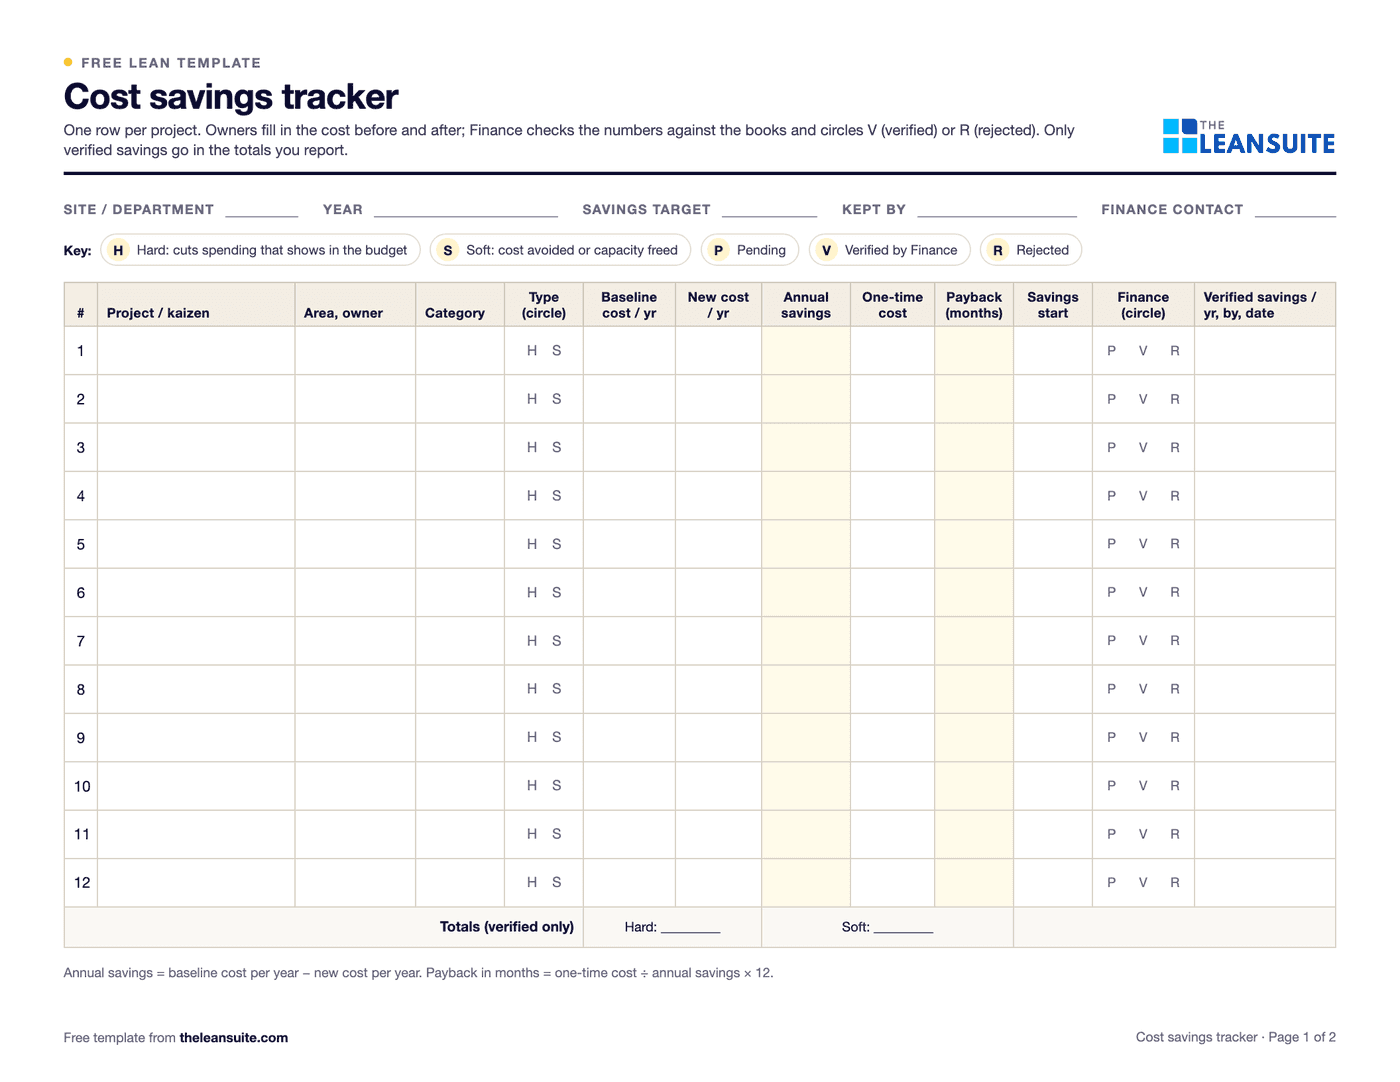 PDF and ExcelCost savings trackerA savings log with hard and soft savings, payback and Finance's sign-off, plus a glide path against the year's target.
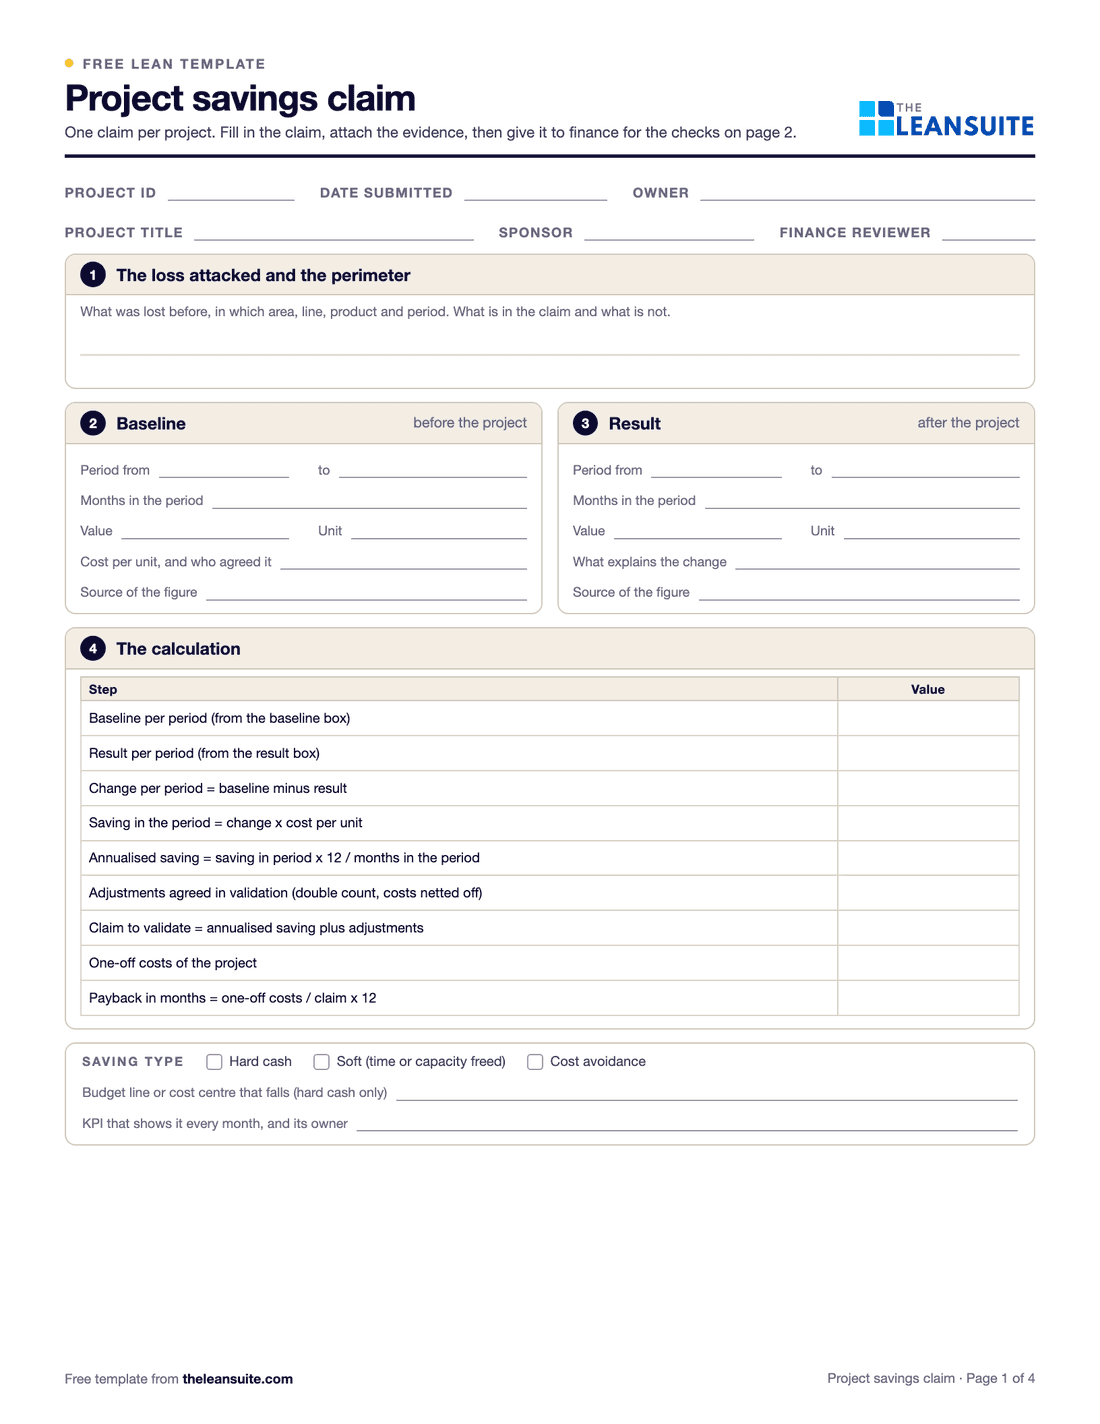 PDF and ExcelProject savings validation checklistThe gate between a project's claim and a reported saving: 20 checks, a claims register and a six-month sustainment check.
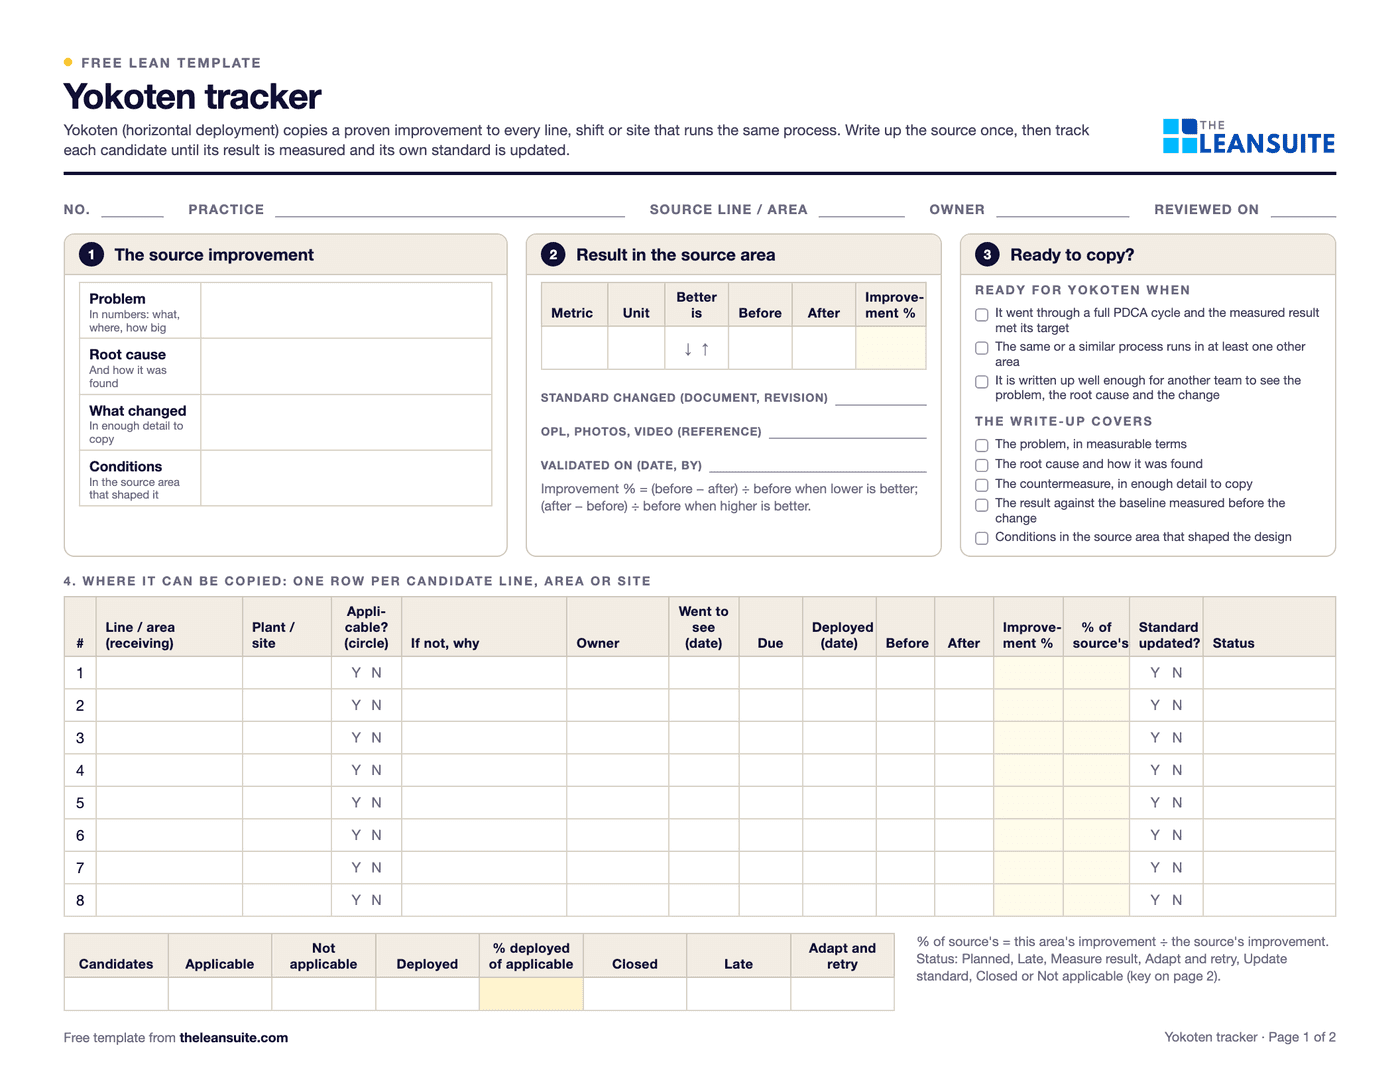 PDF and ExcelYokoten tracker (horizontal deployment)Copy a proven improvement line by line: the source result, each candidate's own before and after, its share of the source's improvement and the standard updated.
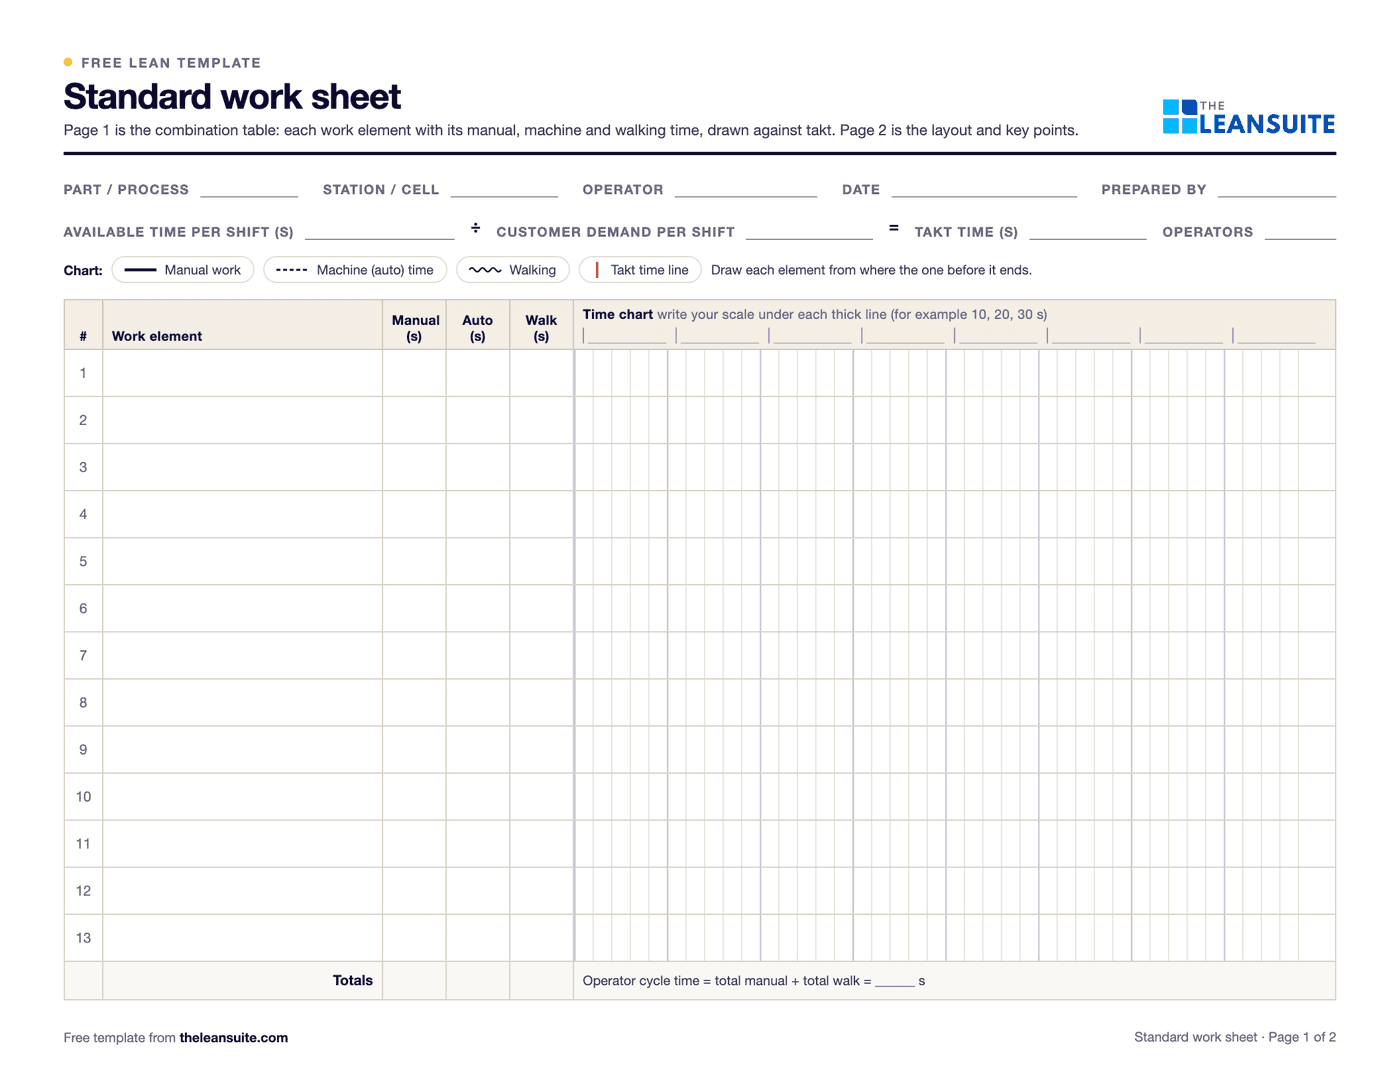 PDF and Excel and WordStandard work sheet templateTakt time, each element's manual, machine and walk time on a time chart, key points and standard WIP.
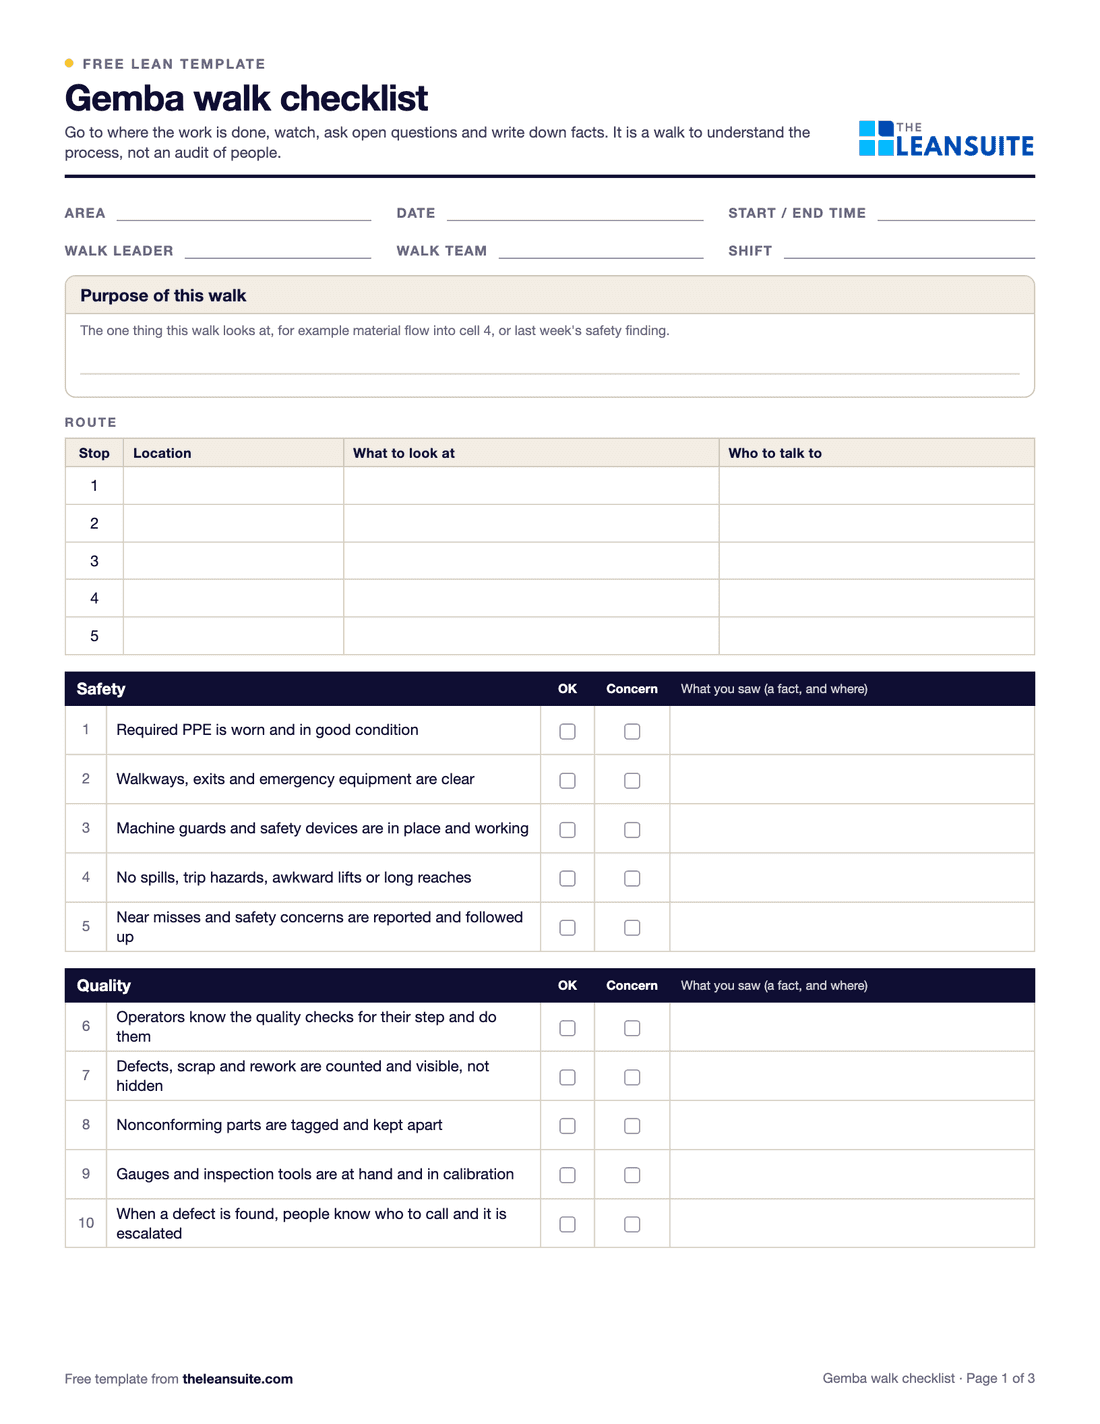 PDF and Excel and WordGemba walk checklistA walk plan and route, 30 prompts in six groups and a findings table with owners and due dates.
Calculators (8)
- Free calculatorTakt time calculatorThe pace a line must hit to meet customer demand, from shift time, breaks and daily demand.
- Free calculatorLine balancing calculatorLine efficiency, balance delay and the minimum number of stations from station times and takt.
- Free calculatorCycle time calculatorCycle time against takt, units per hour, capacity per shift and the gap to daily demand.
- Free calculatorFirst pass yield (FPY) calculatorFirst pass yield at each step and rolled throughput yield (RTY) across the whole process.
- Free online toolPareto chart makerPaste categories and counts: sorted bars, cumulative percentage line and the vital few at the 80% line, as a PNG or SVG.
- Free calculatorCost of poor quality (COPQ) calculatorTotal COPQ and cost of quality, and each as a share of revenue, from the four quality cost categories.
- Free calculatorScrap rate calculatorScrap rate, the cost of scrap per period and per year, and what reaching a target rate would save.
- Free calculatorKaizen savings calculatorYearly savings, payback in months and first-year ROI of an improvement, from time saved, scrap avoided and its costs.
Buyer's guides
LeanSuite pages for these problems
- Best Practice Management
- Yokoten
- Kaizen & Projects
- CI Portfolio
- Line Balancing
- AI Video Analysis
- Cost of Poor Quality
- Quality Prioritization Matrix
- Non-Conformance (NCR)
- Idea Management
How LeanSuite handles each of these is on the page for appliance and consumer durables plants.
Whirlpool tackled project visibility and continuous improvement across 14 manufacturing plants with LeanSuite. Read the Whirlpool case study.
FAQ
Lean in appliance and consumer durables plants: common questions
On one assembly line, with the losses the plant already counts: stations over takt for the current model mix, first pass yield at end-of-line test and cosmetic defects per hundred units. Measure them for two weeks, fix the two biggest causes at the station that creates them, write the new method down and only then move to the next line.
Time the work elements of each model at each station, then weight them by the share of each model in the daily mix and stack them against takt on a yamazumi chart. Move work off the stations that run over, and sequence the models so heavy units do not follow each other at the same station. Rebalance whenever the mix or the volume changes.
Cycle time against takt for every station, first pass yield at end-of-line test, defects per hundred units and cost of poor quality by defect type. For the improvement program as a whole, add verified savings, ideas answered on time and how many plants have adopted each best practice.
Write the fix as a short standard with photos, before-and-after numbers and the conditions it needs, send it to the plants that run the same process, and name one person at each who decides whether it applies. Then track adoption plant by plant and check it on the floor at the next visit.
See LeanSuite across your plant network
Bring the improvement program you want to connect first. We will show you how LeanSuite handles it and what a 90-day pilot would cover.