

Lean playbook · Batteries and energy storage
Lean playbook for battery manufacturing plants
Short answer
Start lean in a battery plant at the stage where a defect is made, not where it is found. Measure yield at every stage, because a cell scrapped at formation carries the cost of everything before it. Protect formation and aging as the bottleneck, give operators a daily care routine on coaters and stackers, and train every new hire to one written method. Any change to a safety-critical step, such as dry-room limits or high-voltage work, goes through your engineering and safety teams first.
Last updated:
7 problems on the floor, and the lean methods for each
Each problem says what it looks like, which methods address it, the first moves to make and the number to watch. Pick the one or two that cost your plant most; you do not need all of them at once.
Where a lithium-ion cell and pack line loses time and quality
Electrode: mixing, coating, calendering and slitting
Cell assembly: stacking or winding, welding and filling
Formation and aging
Module and pack assembly
End-of-line test
Across the whole line
Scrap found late, made early
Uneven coating, burrs on slit edges, misaligned stacks and weak welds are made early but often found at formation, grading or end-of-line test. By then the cell or module carries the cost of every step before it, and the record of where the defect started is thin.
Lean methods
In LeanSuite
Loss and cost management in LeanSuite shows where your plant loses money: import your loss data, get a loss tree that puts a cost on each loss, and track the savings as you remove them.
First moves
- Measure good output against input at every stage, not just at the end of the line.
- Multiply the stage yields to get rolled throughput yield, and find the stage that loses most.
- Make a Pareto of that stage's defects and fix the top cause where it is made.
- Add a check at the stage that makes the defect, so it is caught before more value is added.
Number to watch: Yield at each stage, and rolled throughput yield for the line.
Formation and aging capacity
Formation charges each cell for the first time, and aging holds it for days or weeks before grading. Racks and channels are the slowest, costliest capacity in the plant, so an empty channel, a late load or cells sent back for rework cut output for the whole plant.
In LeanSuite
Log lost production by cause, from breakdowns and changeovers to material shortages, and use it to fix maintenance and scheduling.
First moves
- Confirm the bottleneck with data: compare each stage's capacity with demand.
- Track empty or faulty channels and late loads on formation every shift.
- Make sure only good cells reach formation, so no channel time goes on cells that would fail anyway.
- Schedule the stages before formation to its pace, not to their own.
Number to watch: Formation channel use, and cells formed per day against plan.
Dry-room and contamination discipline
Electrolyte filling and cell assembly need very dry, clean air, and metal particles in a cell can cause an internal short. Door discipline, gowning, cleaning and dew point checks depend on many people on every shift, and a tick on a log cannot show they were done properly.
In LeanSuite
Schedule dry-room, cleaning and gowning checks every shift with pictures and videos for each step.
First moves
- Write one-page standards for gowning, entry and cleaning, with photos of the right condition.
- Log dew point and particle checks on a fixed schedule, with a reaction plan for when a limit is passed.
- Audit a sample of dry-room checks each week on the floor, not from the log.
- Treat every excursion as a defect: contain the cells made during it, then find the cause.
Number to watch: Dry-room excursions per week, and checks done on time and passed first time.
Coater, calender and stacker downtime
Coaters, calenders, slitters, stackers and winders are few, fast and expensive, and one stop starves every step after it. During a ramp, maintenance is busy finishing the installation, and small faults that operators could catch turn into long stops.
Lean methods
In LeanSuite
LeanSuite runs autonomous maintenance with visual CILR checklists, abnormality tags routed to maintenance, and skills tracking, so small problems are caught before they cause downtime.
First moves
- Start a daily clean, inspect, lubricate and retighten routine on the machine that sets the pace.
- Tag every abnormality the operators find and route it to maintenance.
- Run a breakdown analysis on every stop longer than a set limit.
- Track mean time between failures on the critical machines every week.
Number to watch: Unplanned downtime hours and MTBF on coaters, calenders and stackers.
Thermal, chemical, electrical and lead hazards
Charged cells can go into thermal runaway, electrolyte is corrosive and flammable, packs carry high voltage, and lead-acid plants handle lead dust and fumes. Near misses go unreported when reporting is slow, and isolation steps on the equipment drift from the written procedure.
In LeanSuite
Anyone can report a near miss by scanning a station QR code with their phone, anonymously if you allow it, and each hazard becomes a corrective action with a due date.
First moves
- Make near-miss reporting take under a minute, from a phone at the station.
- Review every report within a day and choose the fix from the top of the hierarchy of controls, removing the hazard before relying on PPE.
- Walk each lockout procedure on the equipment it covers and correct it where it differs.
- Run a risk assessment before any change to the process, the equipment or the layout.
Number to watch: Near misses reported and closed, and the recordable incident rate.
A workforce new to batteries
A new plant hires hundreds of people who have never built a cell, often speaking several languages, while engineers are still tuning the process. Shadowing cannot keep up, and each new hire learns a slightly different method.
In LeanSuite
Film the job once and LeanSuite drafts the work instruction with numbered steps, photos and safety notes, and you can translate it into the languages your teams speak.
First moves
- Write job breakdown sheets for the steps where mistakes cost most: filling, welding, high-voltage work and dry-room entry.
- Train with the four-step job instruction method and sign each person off before they work alone.
- Keep a skills matrix per area so supervisors see who is cleared for each machine.
- Update the instruction and retrain whenever engineering changes the process.
Number to watch: Positions covered by at least two signed-off people on every shift.
A ramp that slips week by week
The ramp plan sets output, yield and staffing targets week by week. When each area keeps its own numbers, a slipping stage is found late, and actions agreed in one meeting are forgotten by the next.
In LeanSuite
Lean Studio runs tiered meetings on live, cascaded SQDCM boards, and red metrics become tracked actions.
First moves
- Put every area's output and yield on one board against the ramp plan, updated each shift.
- Hold short tiered meetings: the line at the start of the shift, area leaders after, plant leaders last.
- Turn every red number into an action with an owner and a date, and escalate what one tier cannot fix.
- Pair each lagging measure with a leading one, such as checks done on time ahead of yield.
Number to watch: Weekly output and yield against the ramp plan.
More small fixes in the production, maintenance and safety sections of the kaizen idea bank.
A 90-day starting plan
One line or product family, two problems, measured before and after. The point of the first 90 days is a result the plant believes and a method it can repeat, not a plant-wide program.
The 90 days, with the gate that ends each stage
- Days 1 to 30See the losses stage by stageDone when: You have baseline numbers on the board and two problems with an owner each.
- Days 31 to 60Fix the top two lossesDone when: Each fix has a written standard and a before-and-after number.
- Days 61 to 90Make it stick, then spread itDone when: The gains have held for a month and the next stage or line has its baseline.
Days 1 to 30
See the losses stage by stage
Pick one line and get a true yield and downtime baseline before changing anything.
- Choose one line or product, and name a lead for each stage and one sponsor.
- Measure for two weeks: yield at every stage, downtime on the pacing machines, formation channel use and dry-room excursions.
- Work out rolled throughput yield and mark the stage that loses most.
- Start a short meeting at each area board at the start of every shift, and one for area leaders after it.
- Choose the two biggest losses to work on first.
Days 31 to 60
Fix the top two losses
Run focused improvements on the two problems and check them against the baseline.
- Take the top defect at the worst stage and fix it where it is made, with that stage's engineers and operators.
- Start the daily care routine on the pacing machine and tag every abnormality.
- Protect formation: only good cells in, and empty channels tracked every shift.
- Write each new method down as standard work, a job breakdown or a one-point lesson as soon as it works.
Days 61 to 90
Make it stick, then spread it
Check the new standards hold on every shift, then copy them to the next stage or line.
- Audit the new standards, dry-room checks included, on every shift.
- Train and sign off every operator on the changes and update the skills matrix.
- Compare stage yields and downtime with the baseline and share the result at the plant meeting.
- Pick the next stage or line, copy what worked and start again at day one.
The KPIs to track
Track them per line and shift, on a board the team sees every day. Set targets from your own baseline, not from someone else's plant.
| KPI | What it tells you | How to measure it | Free help |
|---|---|---|---|
| Yield by stage | Where good material is lost, stage by stage, instead of only at the end of the line. | Good output divided by input at each stage, in cell equivalents, per shift. | First pass yield (FPY) calculator |
| Rolled throughput yield | The chance that a cell gets through every stage good the first time. | Multiply the first-time yields of all the stages, for example 0.96 times 0.97 times 0.98. | - |
| Scrap rate | The share of material or cells scrapped, and where it happens. | Scrapped units divided by units started, per stage and cause; by weight for electrode material. | Scrap rate calculator |
| OEE on the pacing machines | How much planned time on coaters, calenders and stackers made good product at full speed. | Availability times performance times quality, per shift, on each pacing machine. | OEE calculator |
| Formation channel use | How much of the bottleneck's capacity goes to cells that turn out good. | Channel hours used by cells that pass grading divided by channel hours available, per day. | Process capacity sheet template |
| Output against the ramp plan | Whether the plant is on its ramp curve, week by week. | Good cells, modules or packs made in the week divided by the plan for that week. | Manufacturing KPI dashboard template |
| Recordable incident rate | How often people are hurt badly enough for the injury to be recorded. | Recordable cases times 200,000, divided by the hours worked in the period. | TRIR and DART rate calculator |
By the numbers
Public figures for this industry or for the wider sector it belongs to, each linked to the report or government table it comes from and checked against it on October 3, 2026. More in our lean manufacturing statistics and benchmark charts.
2.0
Electrical equipment, appliance and component manufacturing, the BLS group that includes battery manufacturing, recorded 2.0 injury and illness cases per 100 full-time workers in 2024, against 2.7 for all manufacturing and 2.3 for all private industry.
Total recordable cases per 100 full-time workers, U.S. private industry, 2024 data from the Survey of Occupational Injuries and Illnesses. This BLS group (NAICS 335) also covers appliances and other electrical equipment, not only batteries.
Source: U.S. Bureau of Labor Statistics, Table 1. Incidence rates of nonfatal occupational injuries and illnesses by industry and case types, 2024 (2024 data, table updated January 22, 2026)
16×
Plants in the top quarter for relying on reactive maintenance had 3.3 times more downtime and 16 times more defects than plants in the bottom quarter.
Same NIST survey. NIST notes the link is an association, not proof of cause.
Source: NIST, Economics of Manufacturing Machinery Maintenance: A Survey and Analysis of U.S. Costs and Benefits (NIST AMS 100-34) (June 2020)
Injury and illness rate by industry, 2024
- Motor vehicles5.6
- Beverage and tobacco3.7
- Furniture3.5
- Food3.3
- Primary metals3.3
- Nonmetallic mineral products, incl. glass3.3
- Fabricated metal products3.2
- Transportation equipment3.2
- Motor vehicle parts2.9
- Plastics and rubber products2.8
- HVAC and refrigeration2.4
- Paper2.4
- Machinery2.3
- All private industry2.3
- Electrical equipment and appliances2.0
- Printing1.6
- Chemicals1.6
Total recordable cases per 100 full-time workers, 2024: Motor vehicles 5.6, Beverage and tobacco 3.7, Furniture 3.5, Food 3.3, Primary metals 3.3, Nonmetallic mineral products, incl. glass 3.3, Fabricated metal products 3.2, Transportation equipment 3.2, Motor vehicle parts 2.9, Plastics and rubber products 2.8, All manufacturing 2.7, HVAC and refrigeration 2.4, Paper 2.4, Machinery 2.3, All private industry 2.3, Electrical equipment and appliances 2, Printing 1.6, Chemicals 1.6.
Free templates, calculators and buyer's guides
Templates (27)
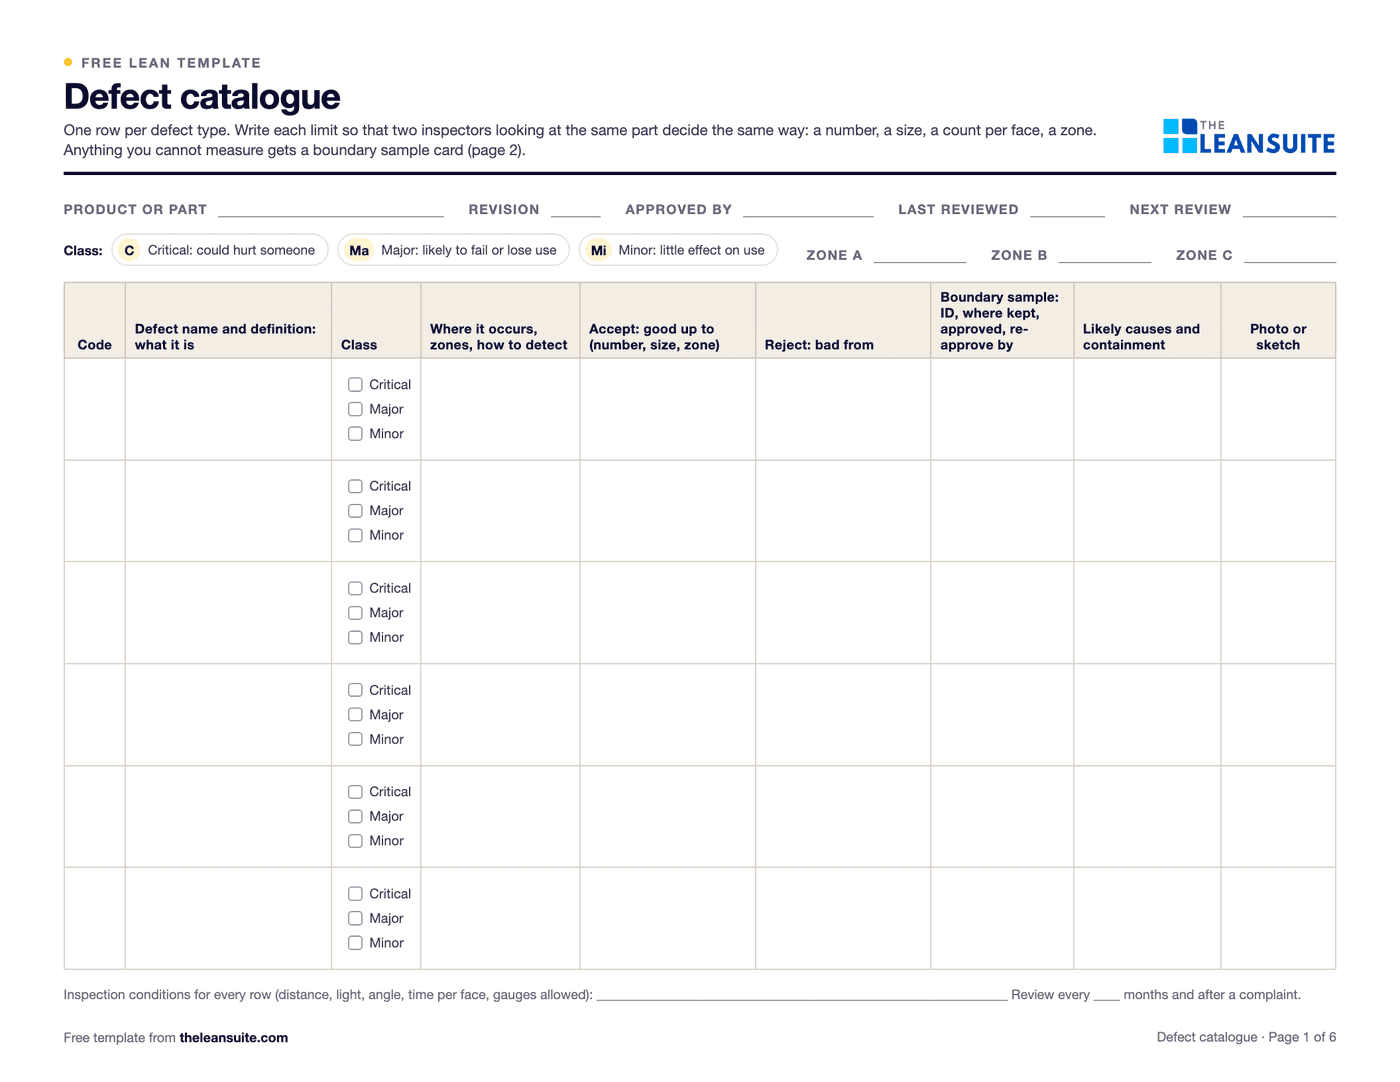 PDF and ExcelDefect catalogue template with boundary samplesEvery defect with a definition, a class and the reason for it, measured accept and reject limits by zone, boundary samples, a defect log with DPU and Pareto, and an inspector agreement check.
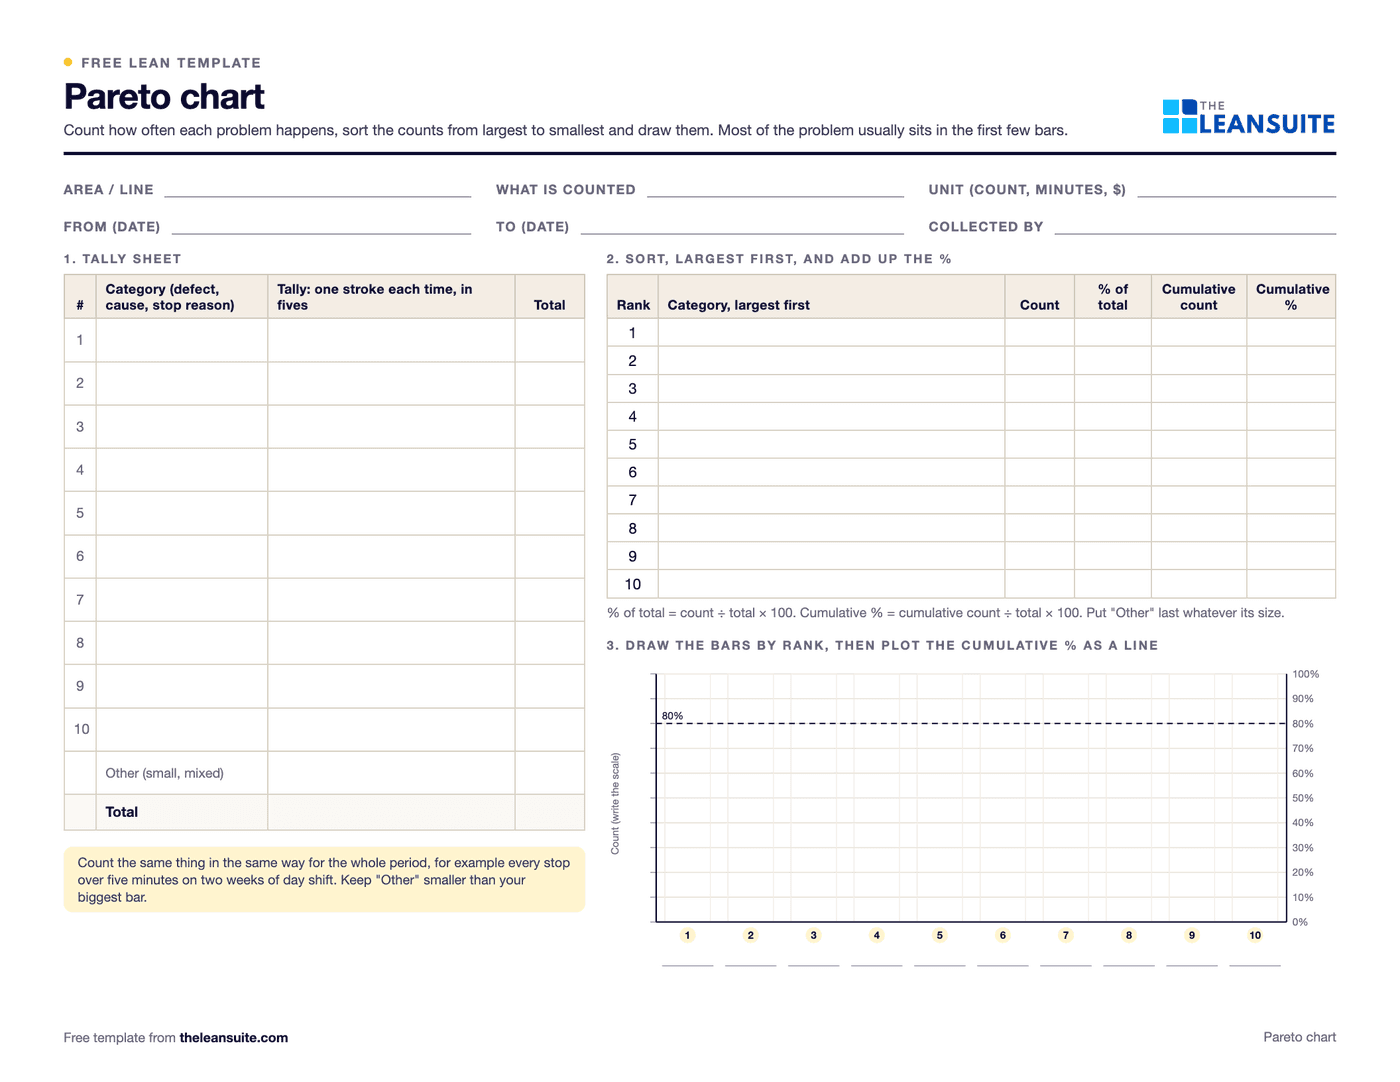 PDF and ExcelPareto chart templateA tally sheet, the Pareto by count and by cost with the cumulative line and the 80% cut, and a before and after comparison. Excel sorts and draws it.
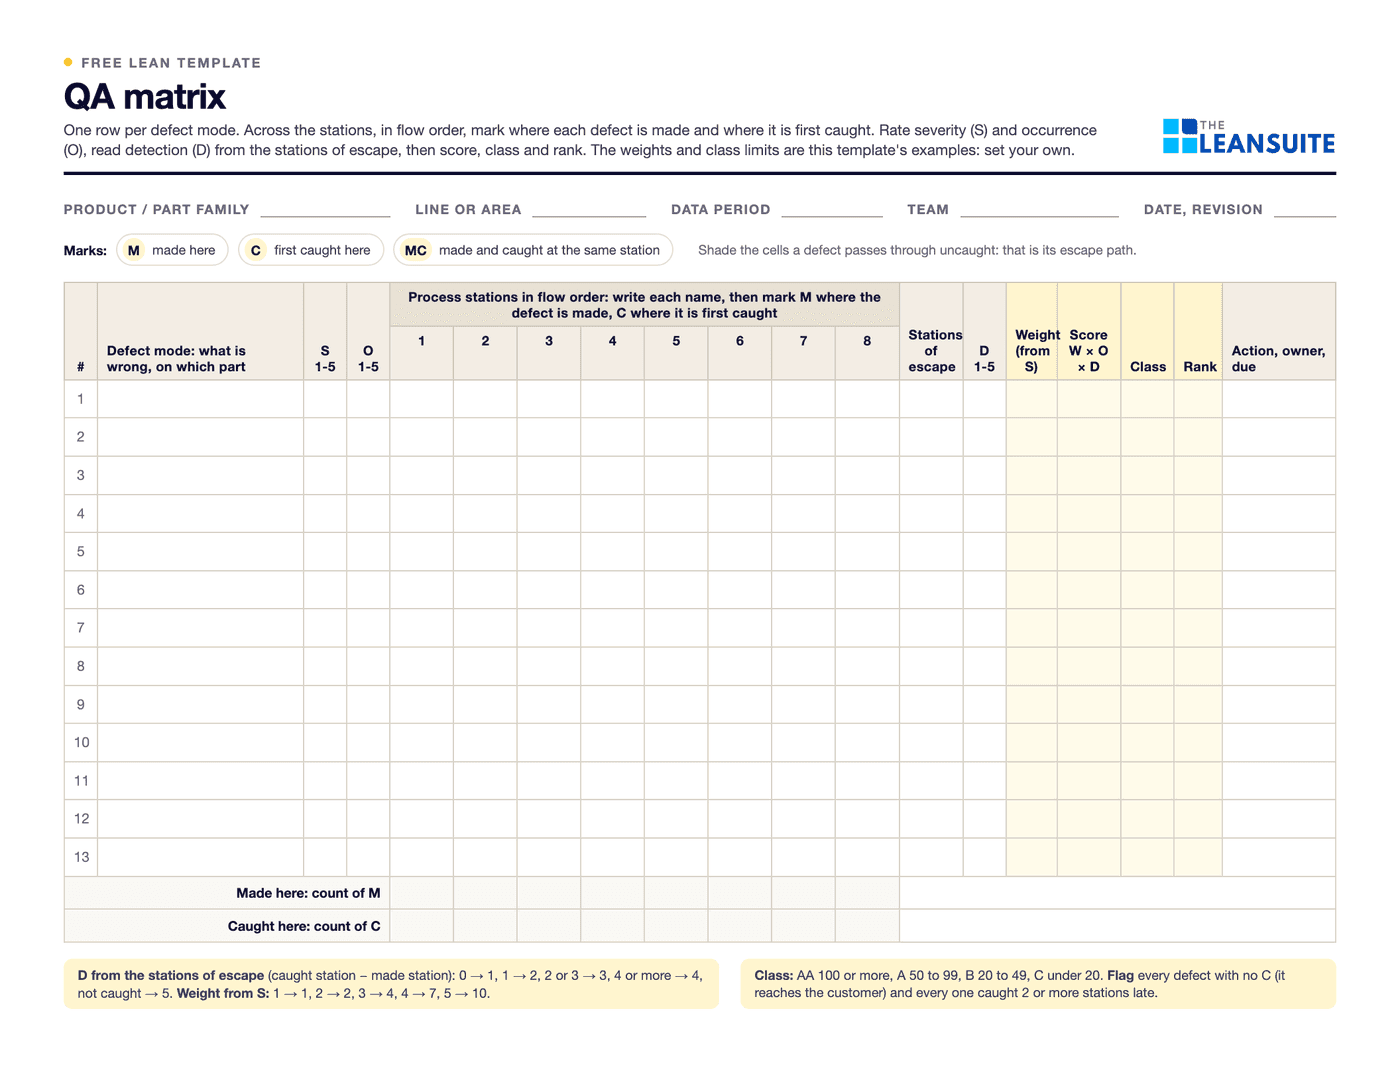 PDF and ExcelQA matrix templateDefect modes against stations in flow order: where each is made and first caught, a weight × occurrence × detection score, an AA to C class and the escapes flagged.
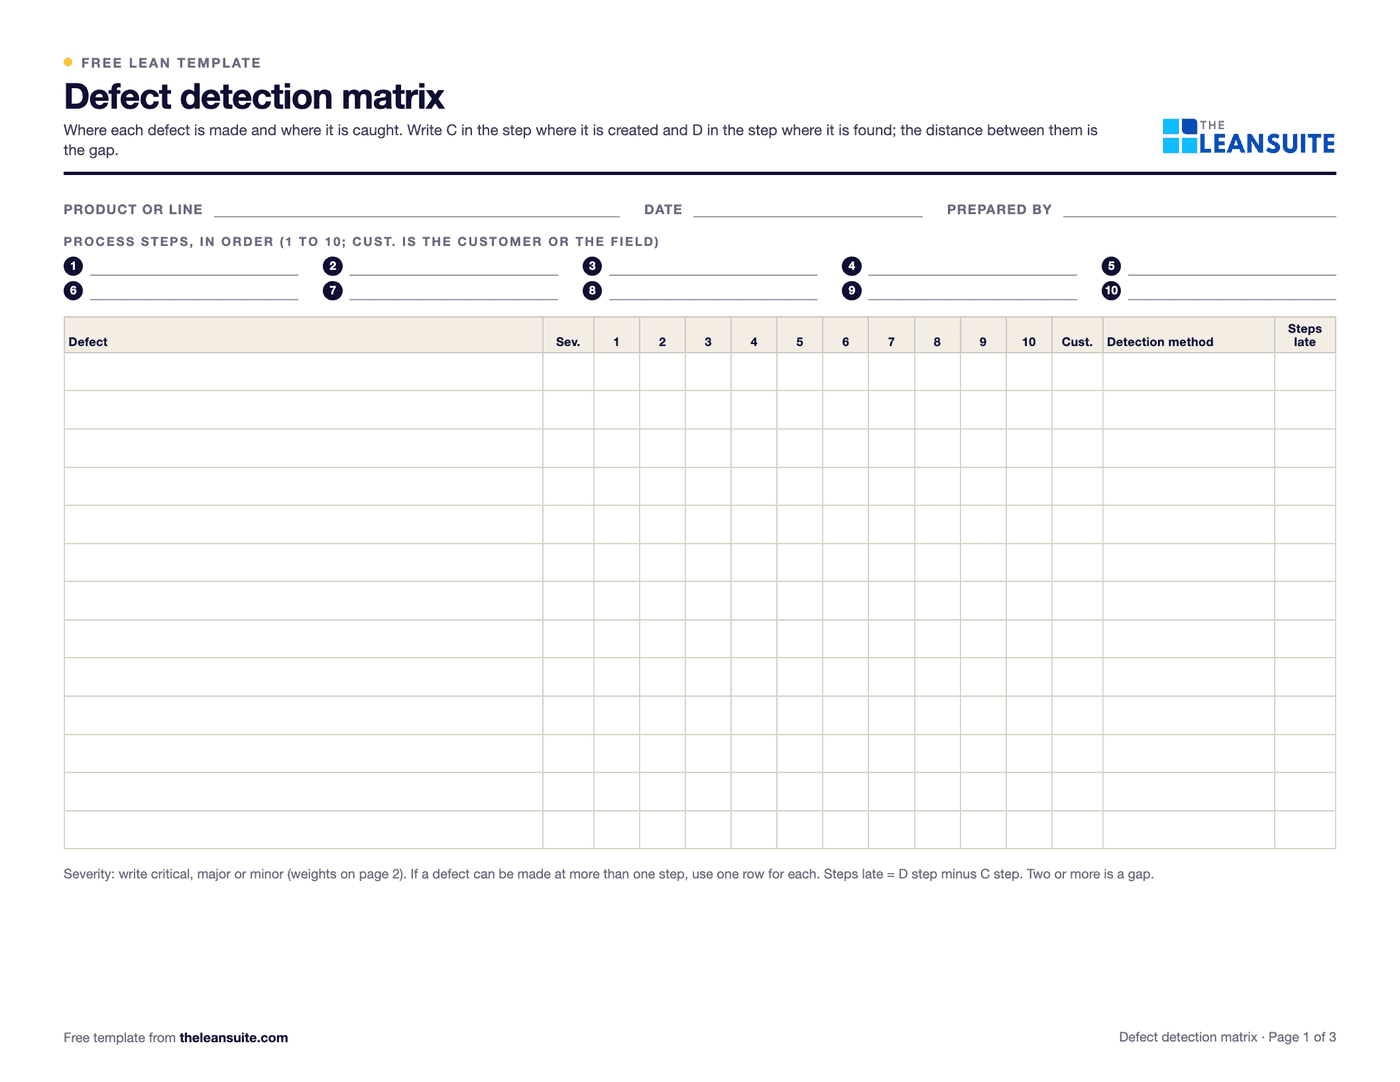 PDF and ExcelDefect detection matrix templateMap where each defect is created and where it is found, score the gap and move the check closer to the cause.
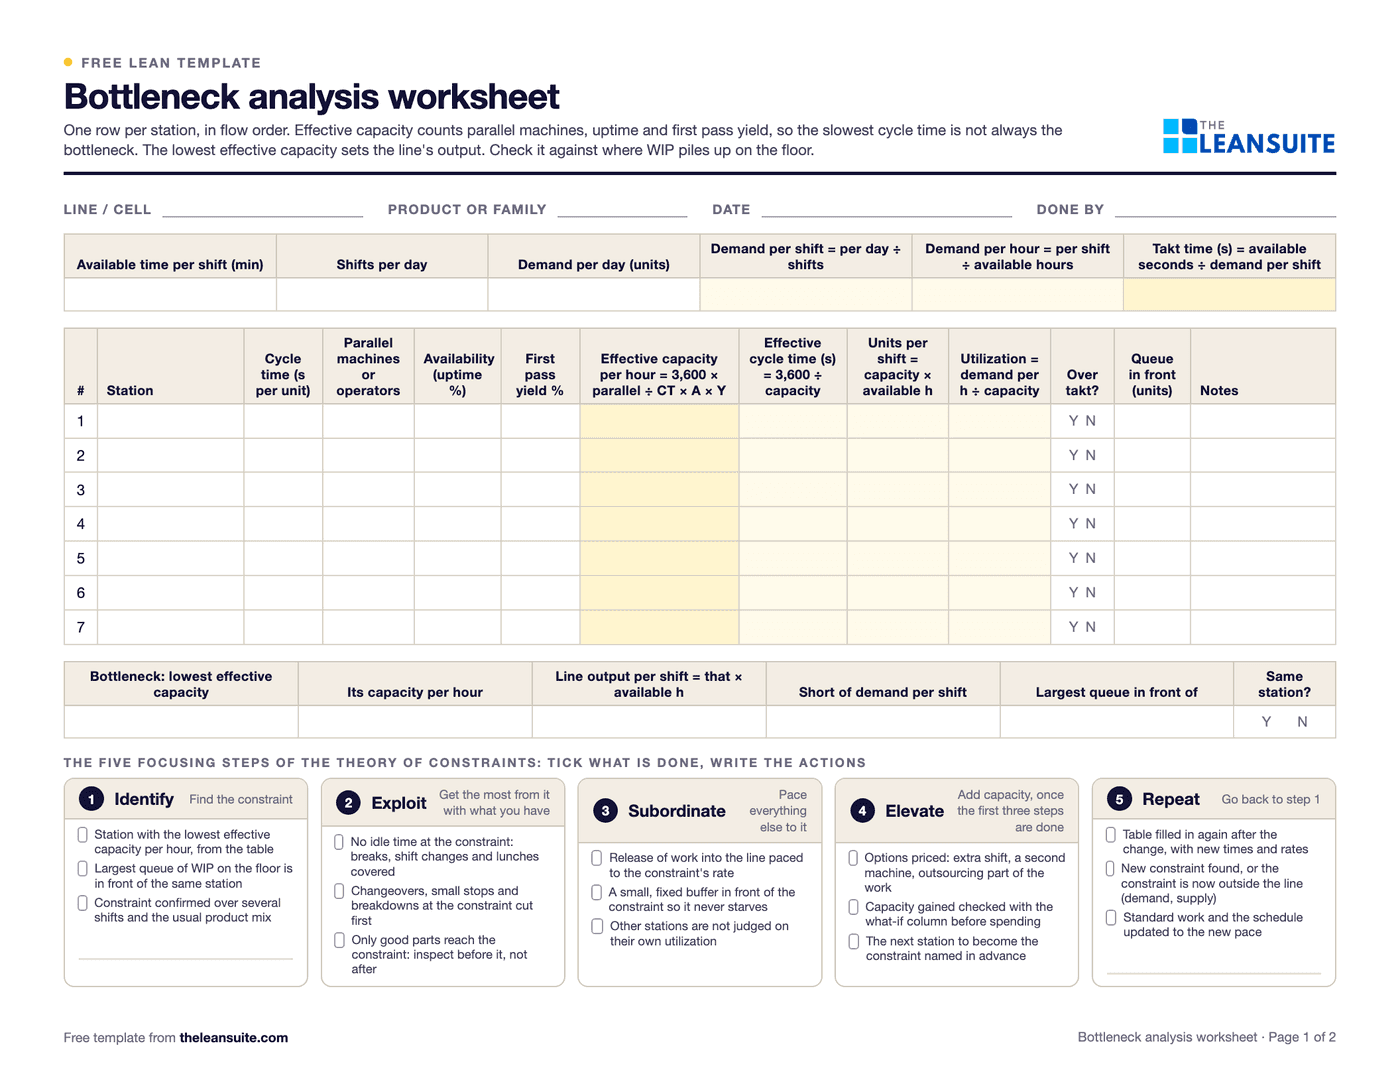 PDF and ExcelBottleneck analysis worksheetEffective capacity per station from cycle time, parallel units, availability and yield, the bottleneck, takt and utilization, a queue cross-check and the five focusing steps.
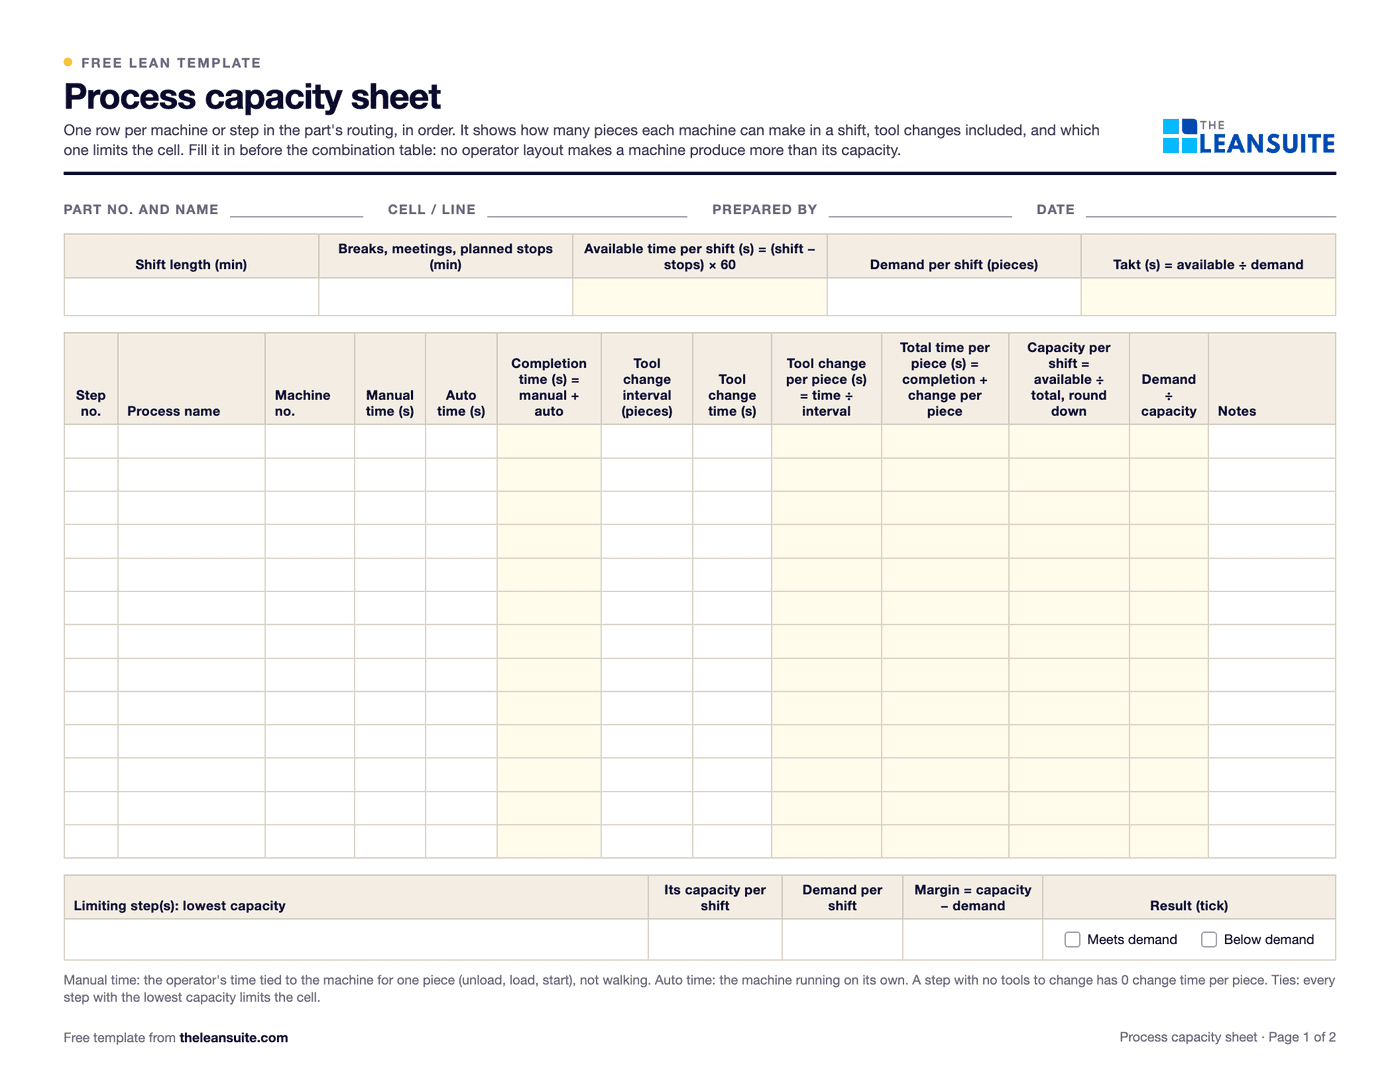 PDF and ExcelProcess capacity sheet templateEach machine in a part's routing with manual, auto and tool change time, its capacity per shift, and the step that limits the cell against demand.
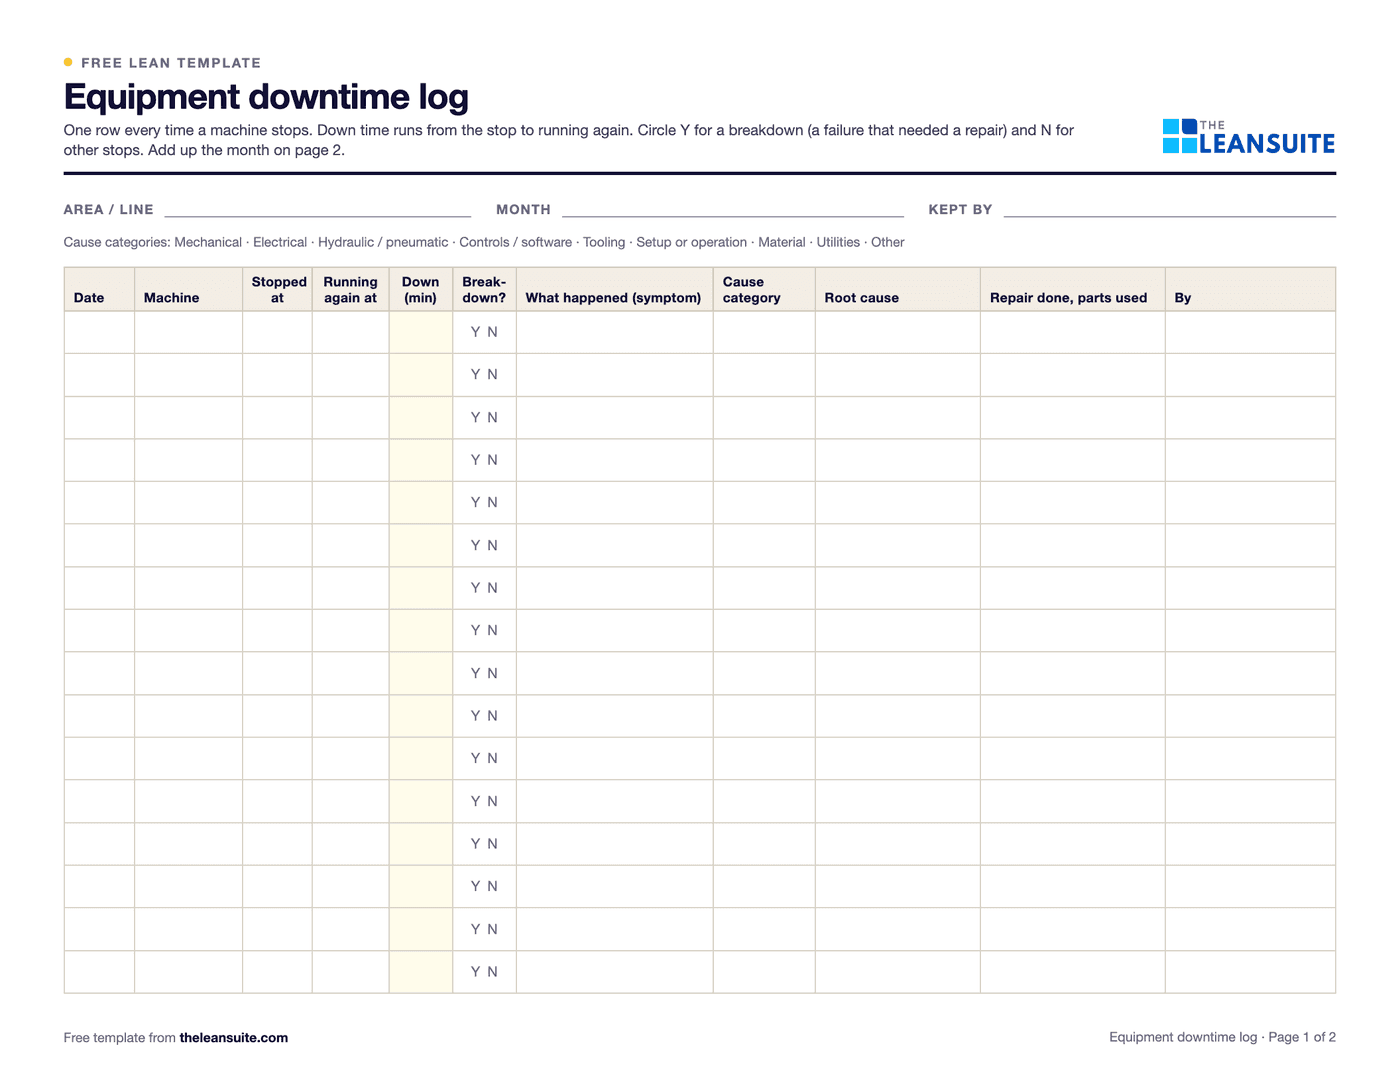 PDF and ExcelEquipment downtime log (MTTR and MTBF)A breakdown and downtime log, with MTTR, MTBF and downtime by machine and cause worked out in Excel.
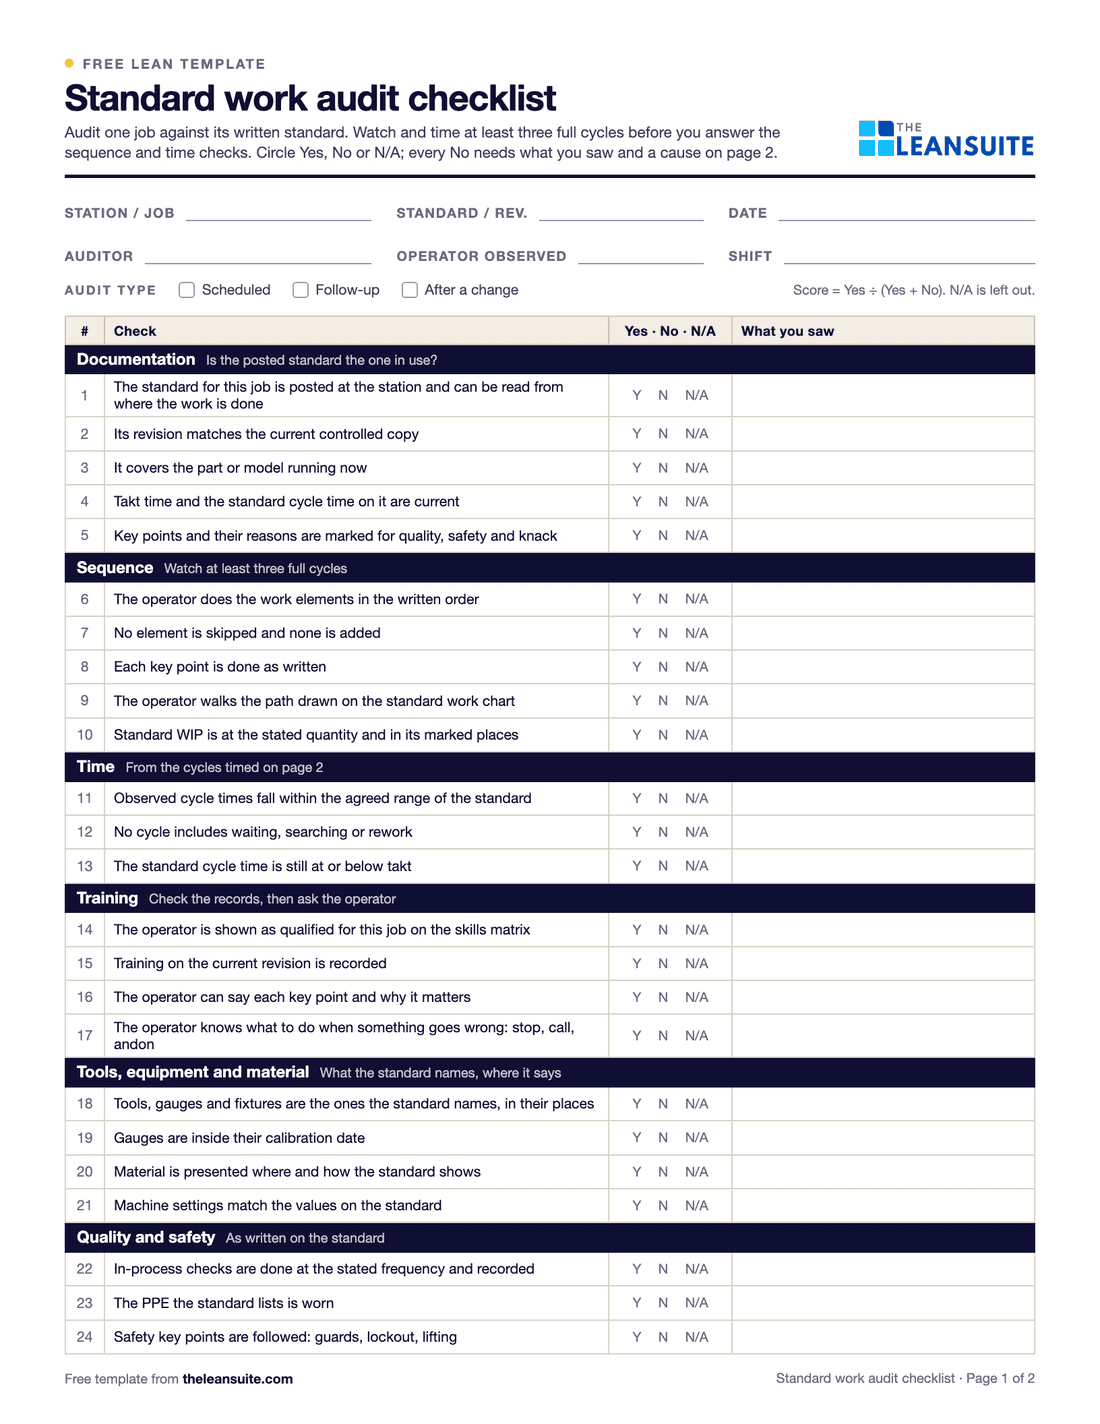 PDF and ExcelStandard work audit checklist24 checks of a job against its written standard, ten timed cycles, and each gap sorted by cause before anyone acts.
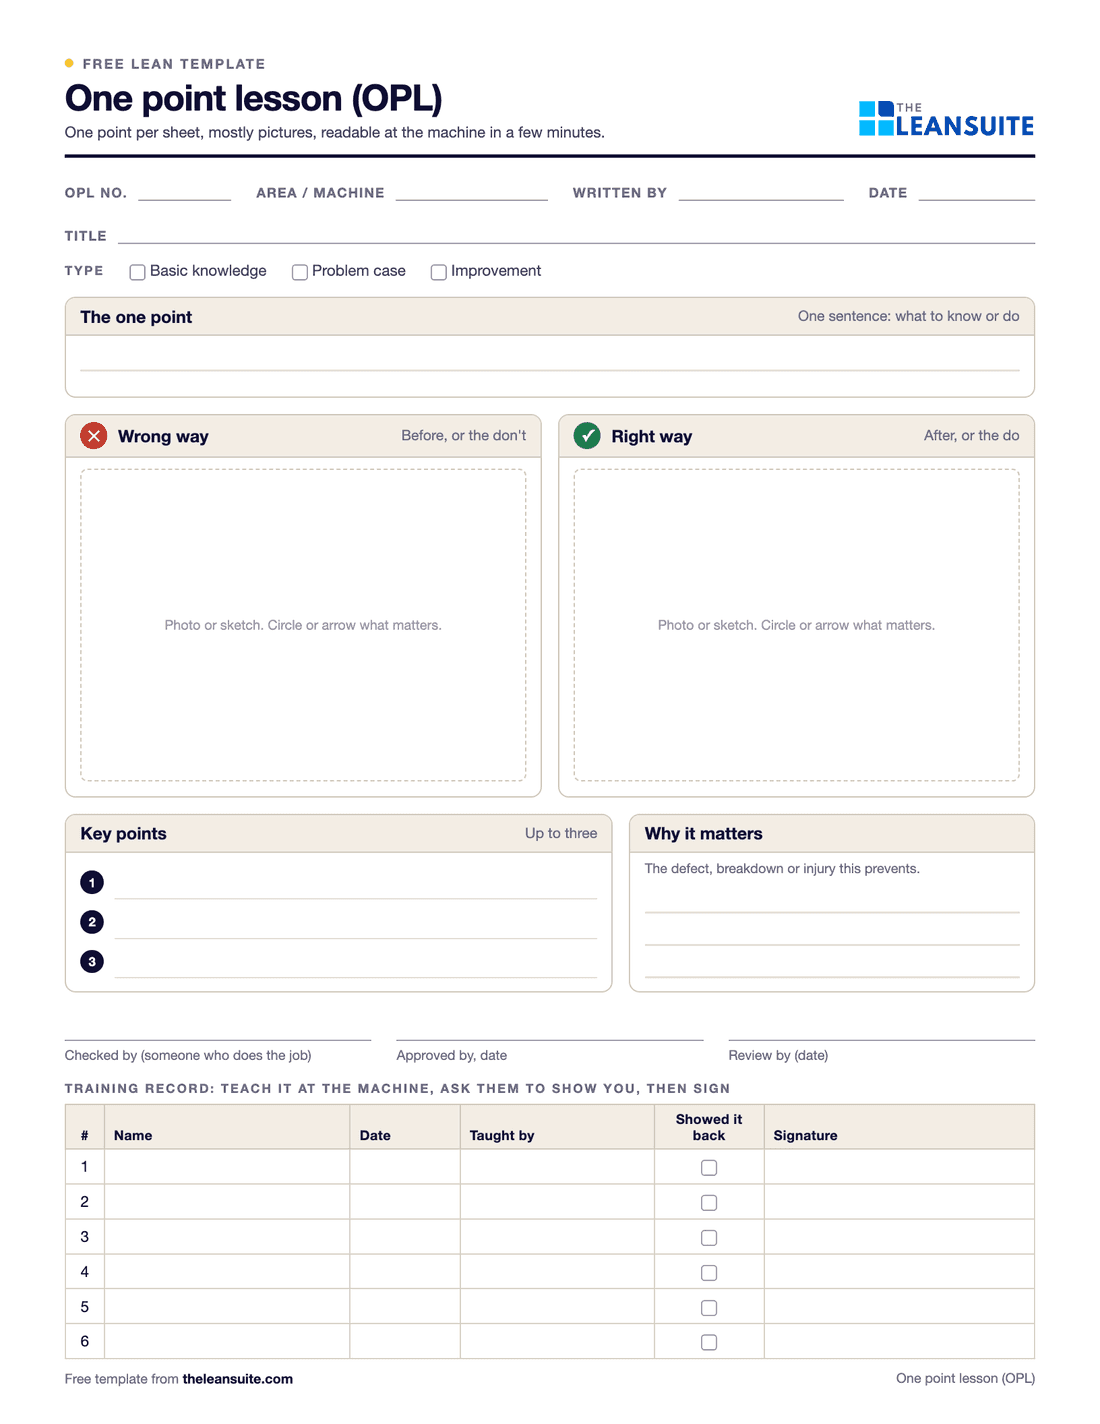 PDF and Excel and WordOne point lesson (OPL) templateOne topic on one page: wrong way and right way pictures, checkable key points, the standard it belongs to and a sign-off record.
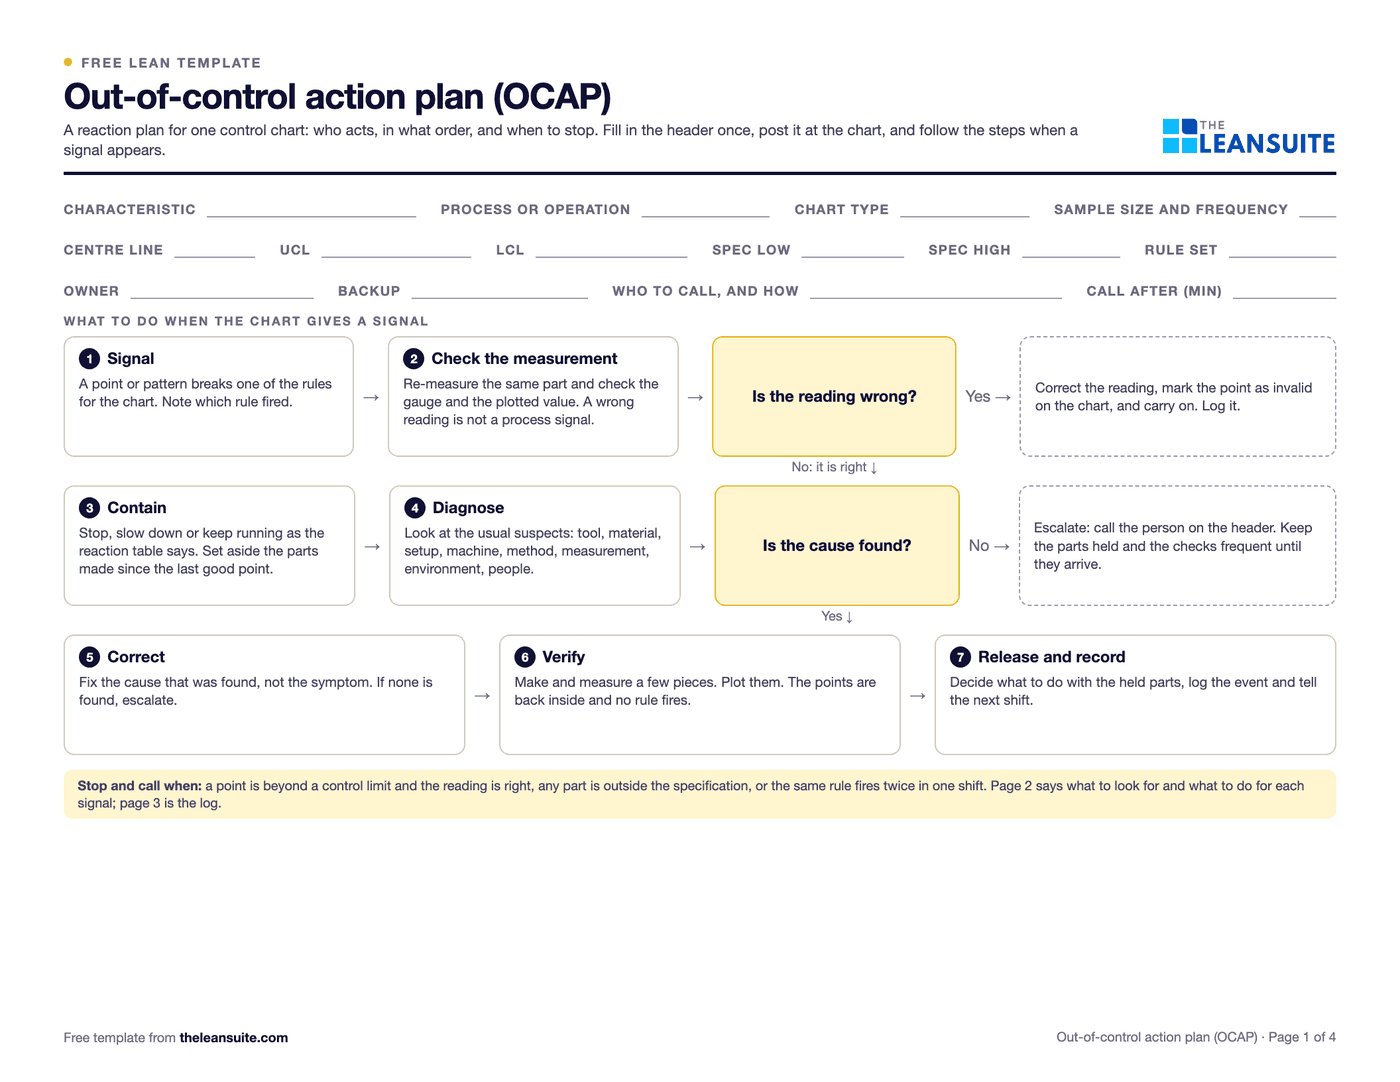 PDF and ExcelOut-of-control action plan (OCAP) templateA reaction plan for a control chart: the steps, what each signal means, who to call and a log of events.
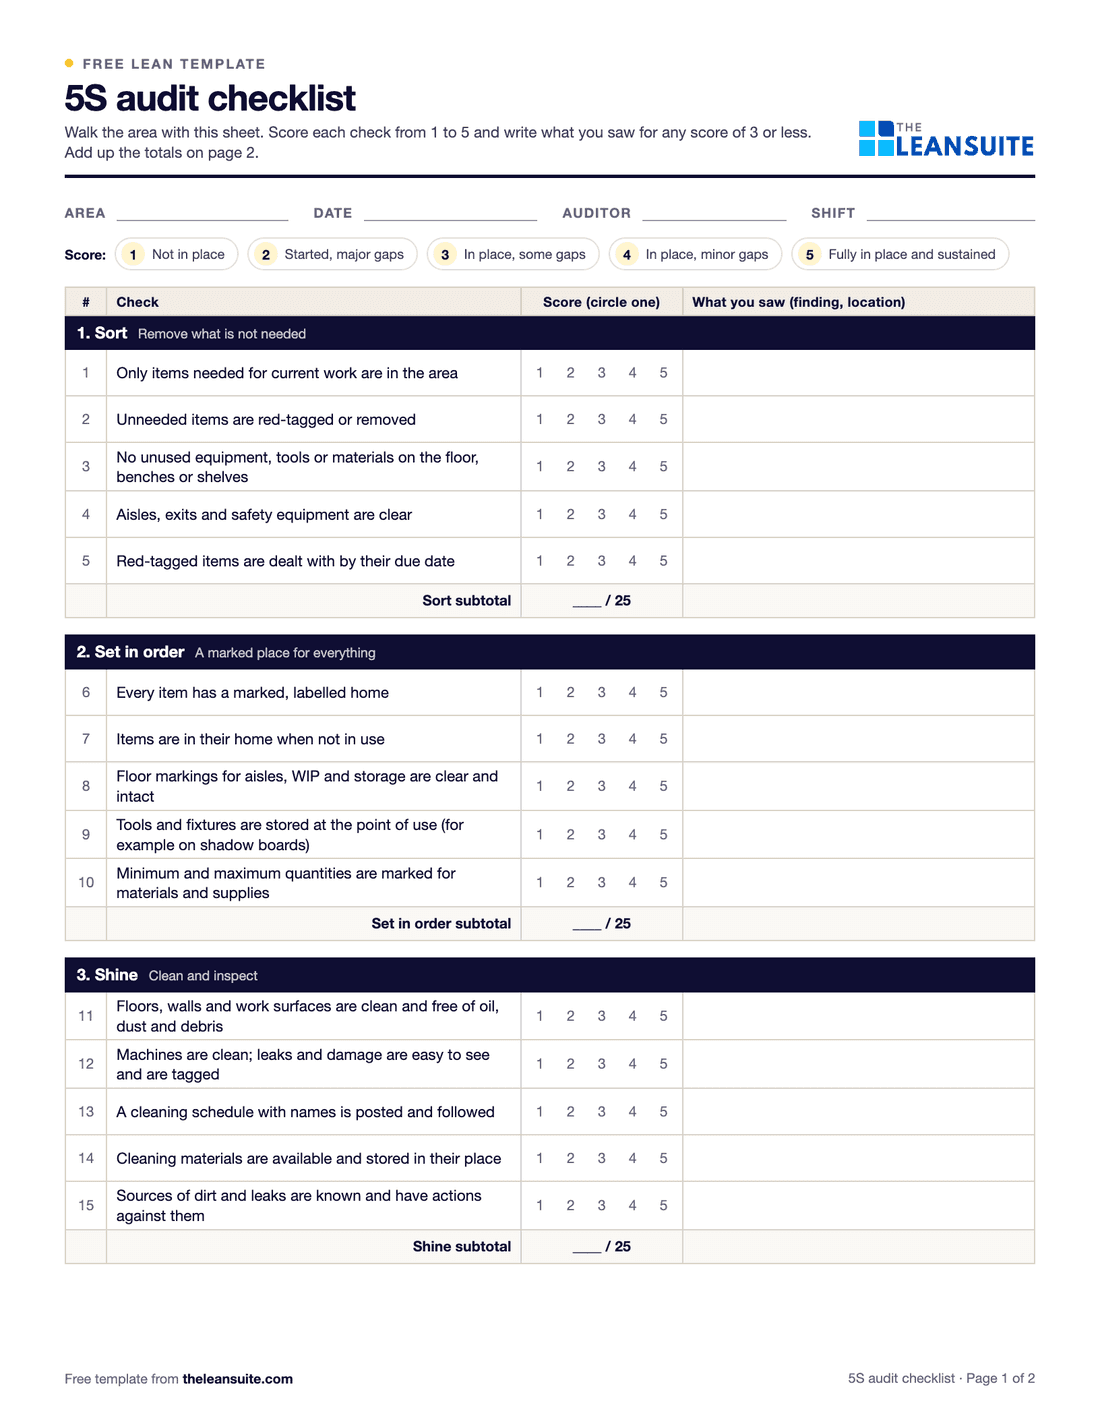 PDF and Excel and Word5S audit checklist template25 checks, five per S, scored 1 to 5, with a score summary and a chart of the five S's.
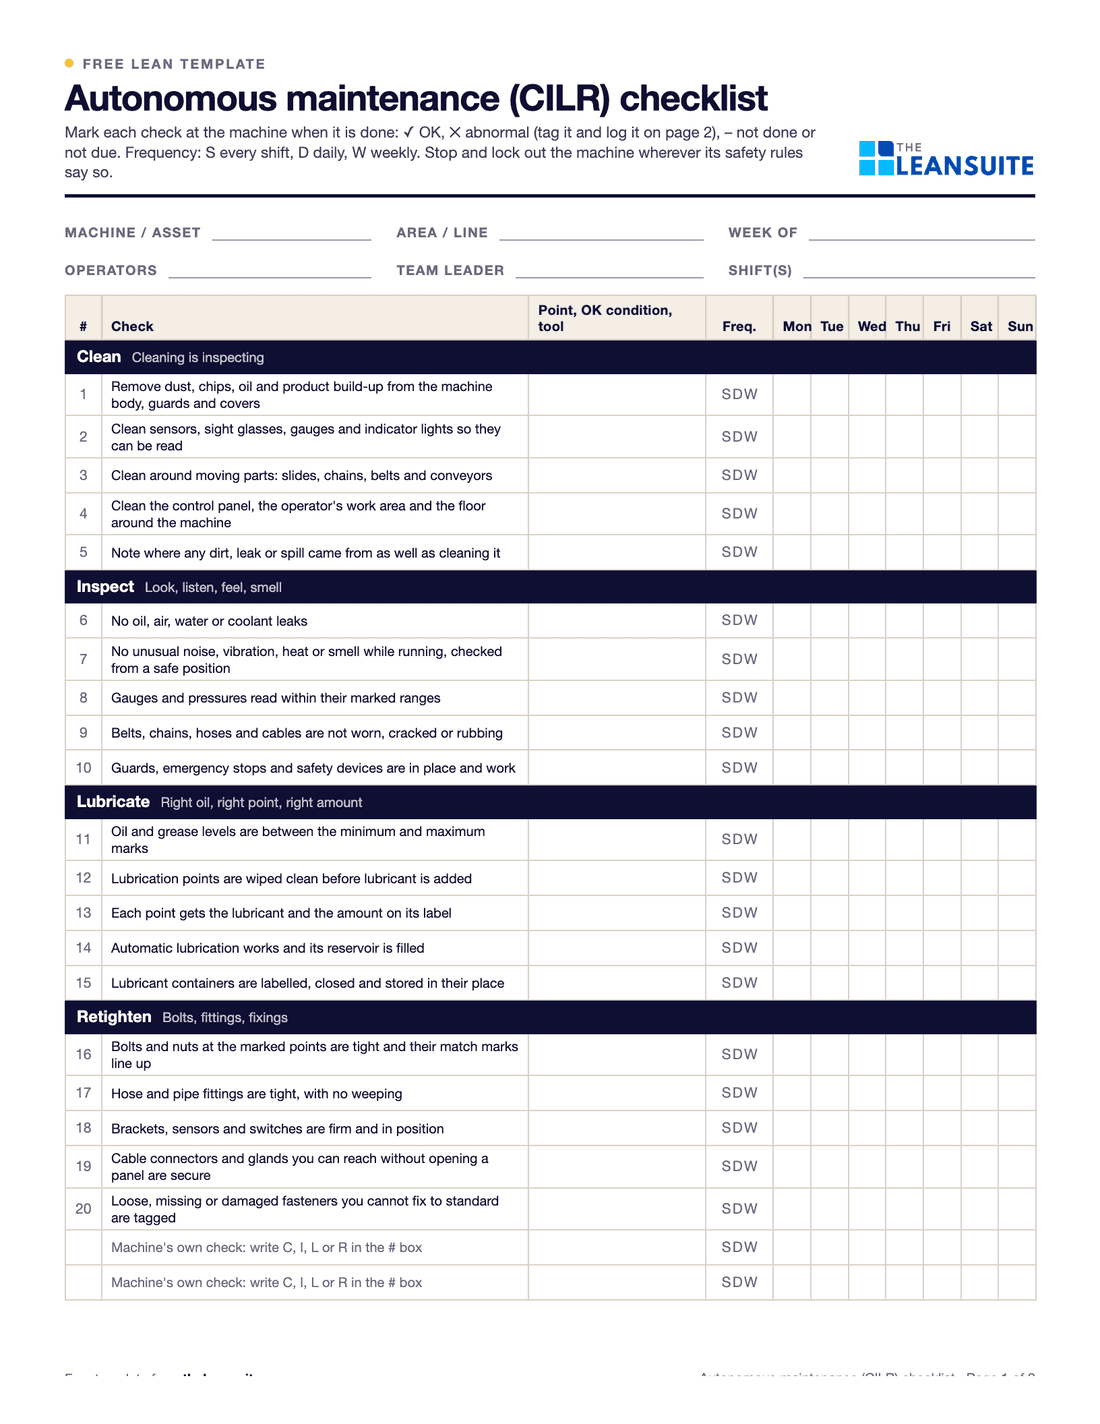 PDF and ExcelAutonomous maintenance (CILR) checklist20 clean, inspect, lubricate and retighten checks with a box per day, an abnormality log and sign-off.
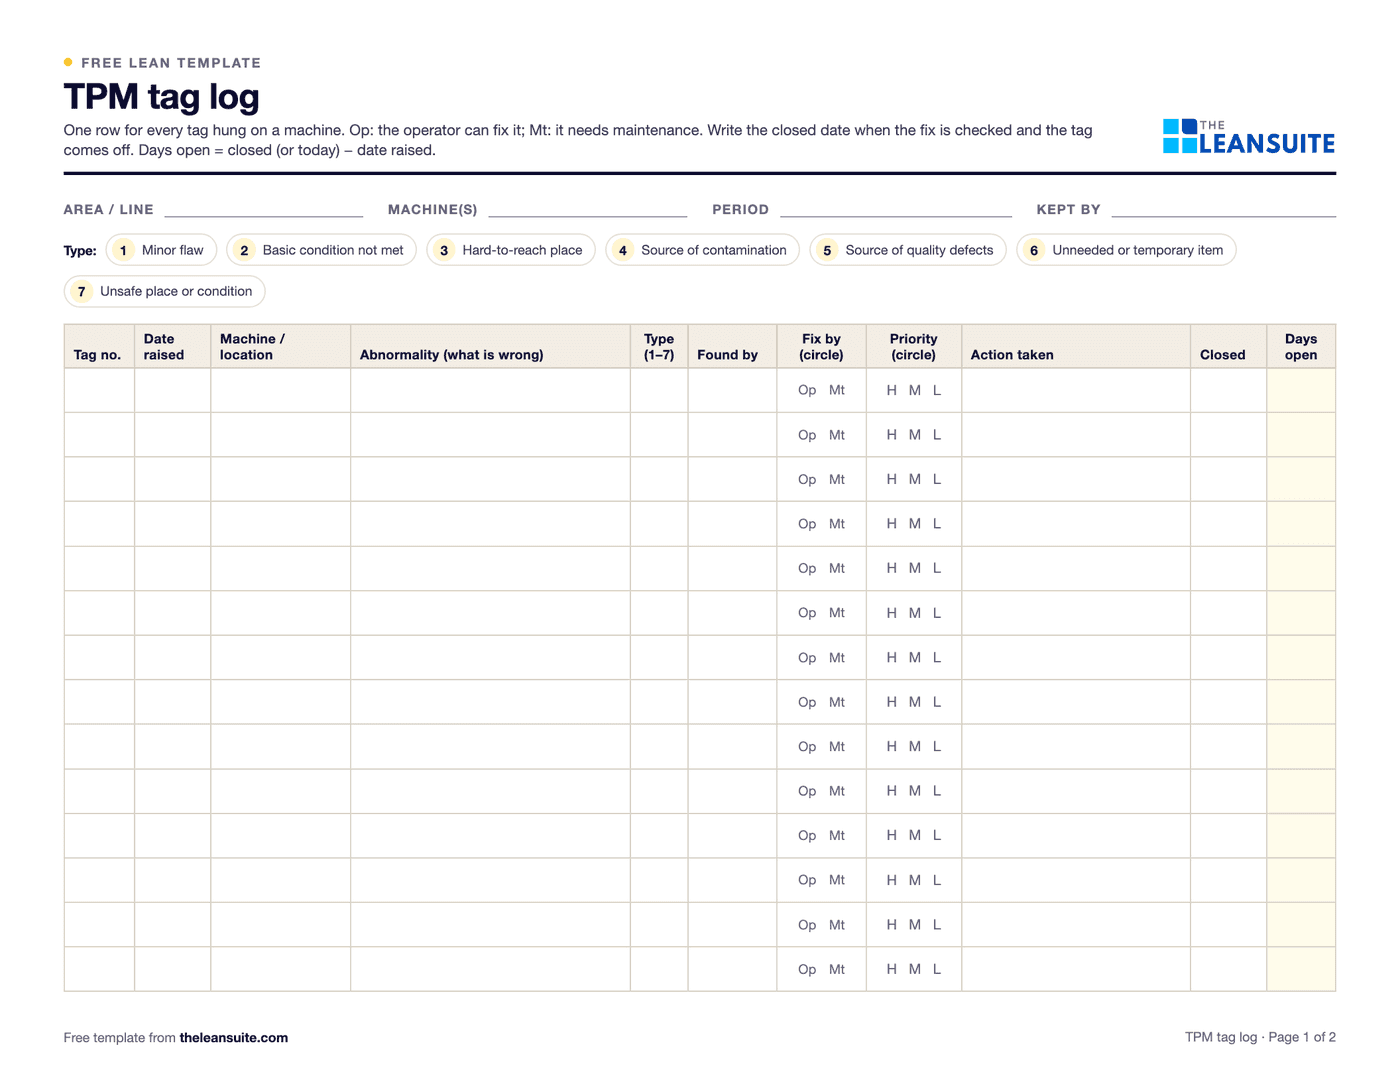 PDF and ExcelTPM tag logEvery abnormality tag with type, who fixes it, priority and dates, with days open and counts by type and week.
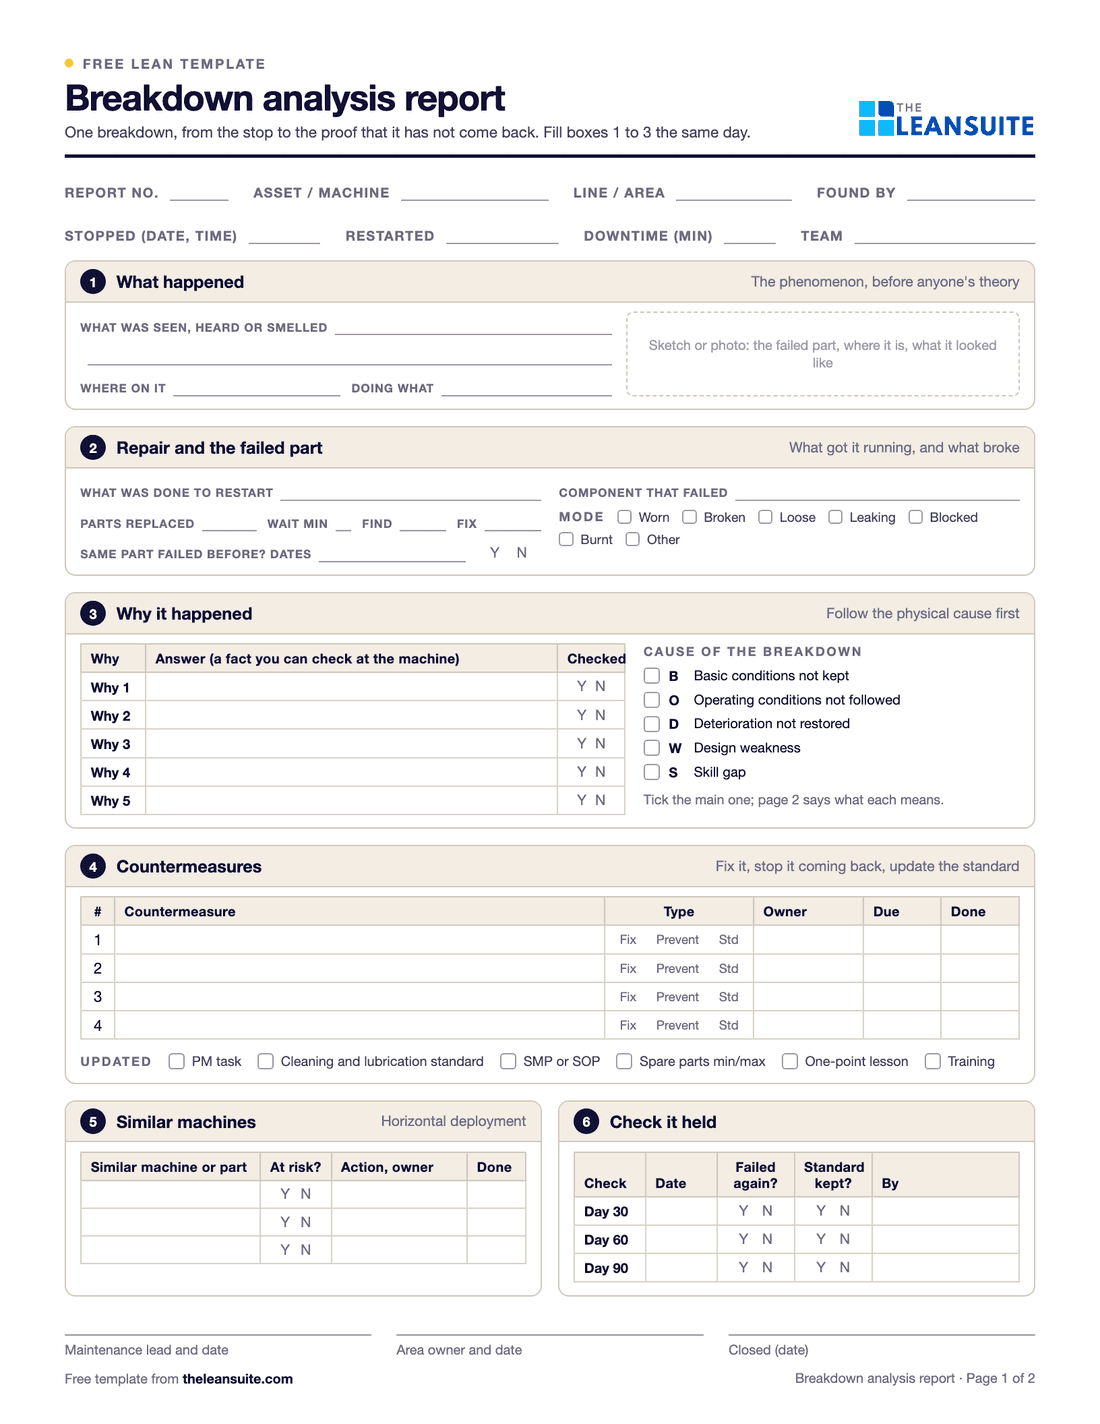 PDF and ExcelBreakdown analysis reportOne equipment breakdown from the stop to the 90-day check, plus a breakdown log with repeat flags, MTBF and MTTR by asset and a Pareto of causes.
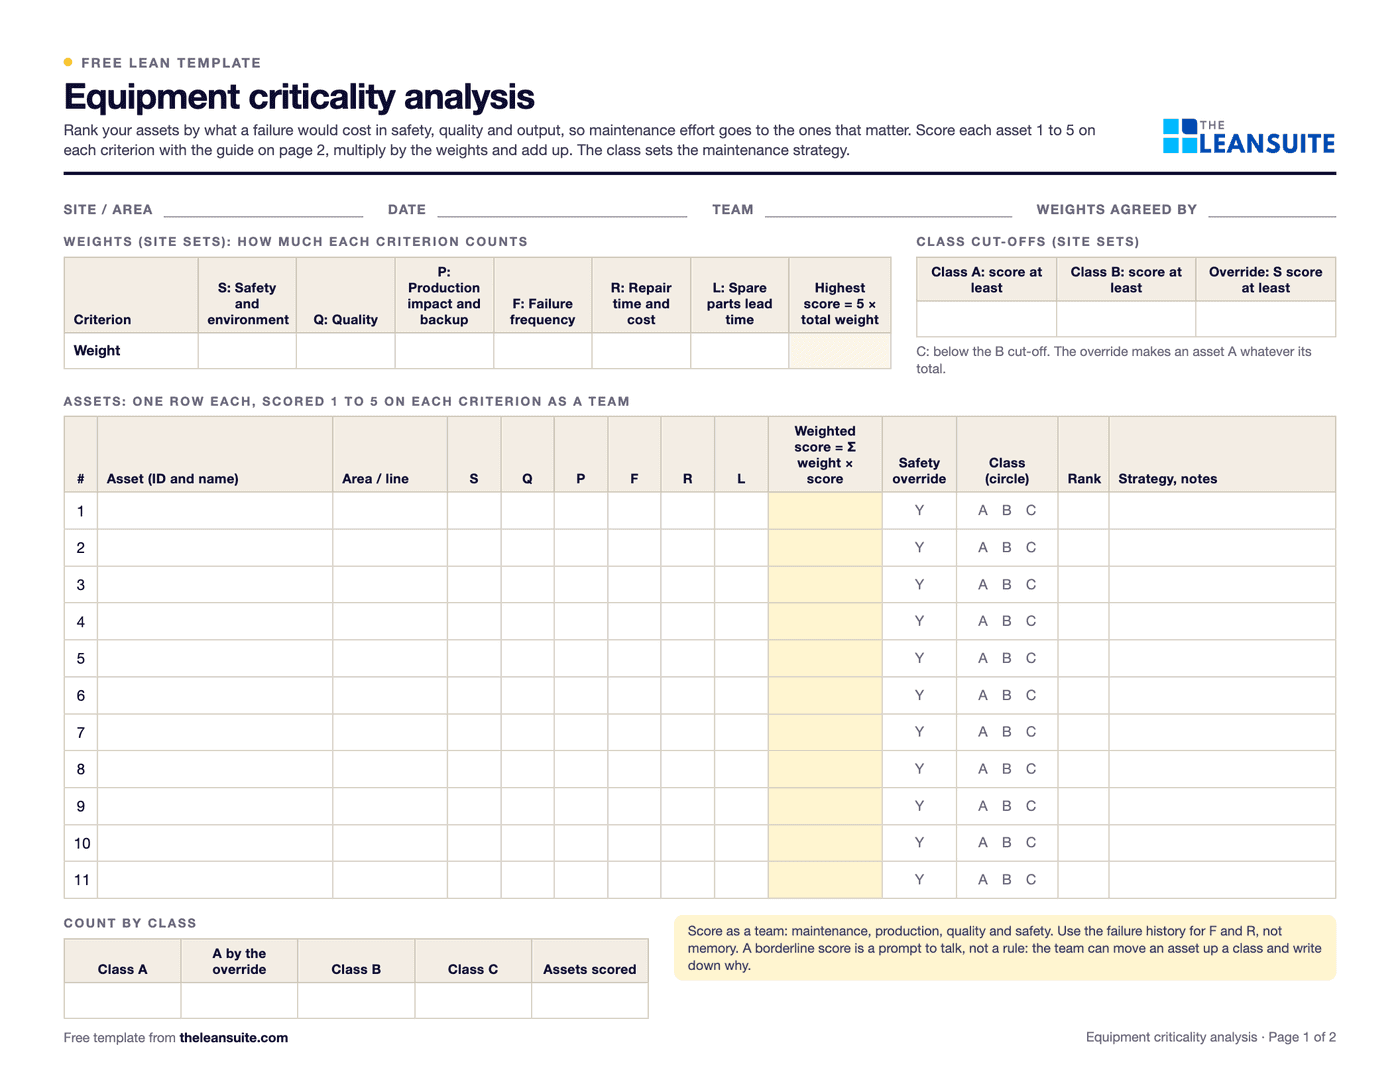 PDF and ExcelEquipment criticality analysisAssets scored 1 to 5 on six criteria with your own weights, ranked and sorted into classes A, B and C with a safety override and a suggested maintenance strategy.
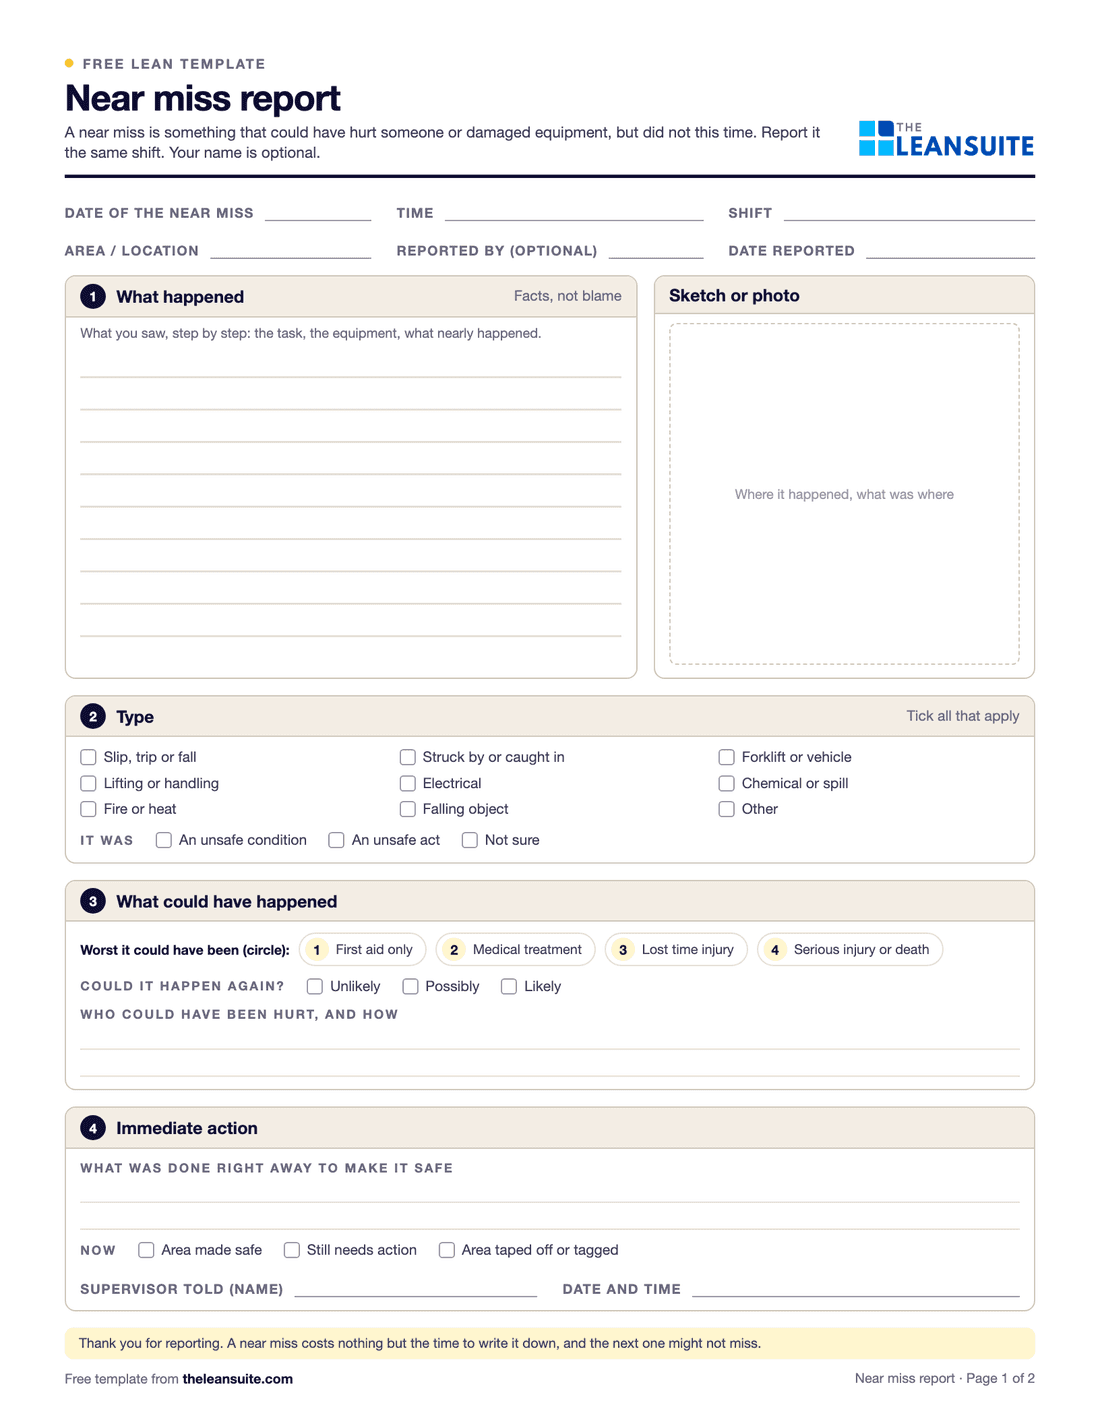 PDF and ExcelNear miss report formA two-page near miss report from the first report to closure, and an Excel log with status and days open.
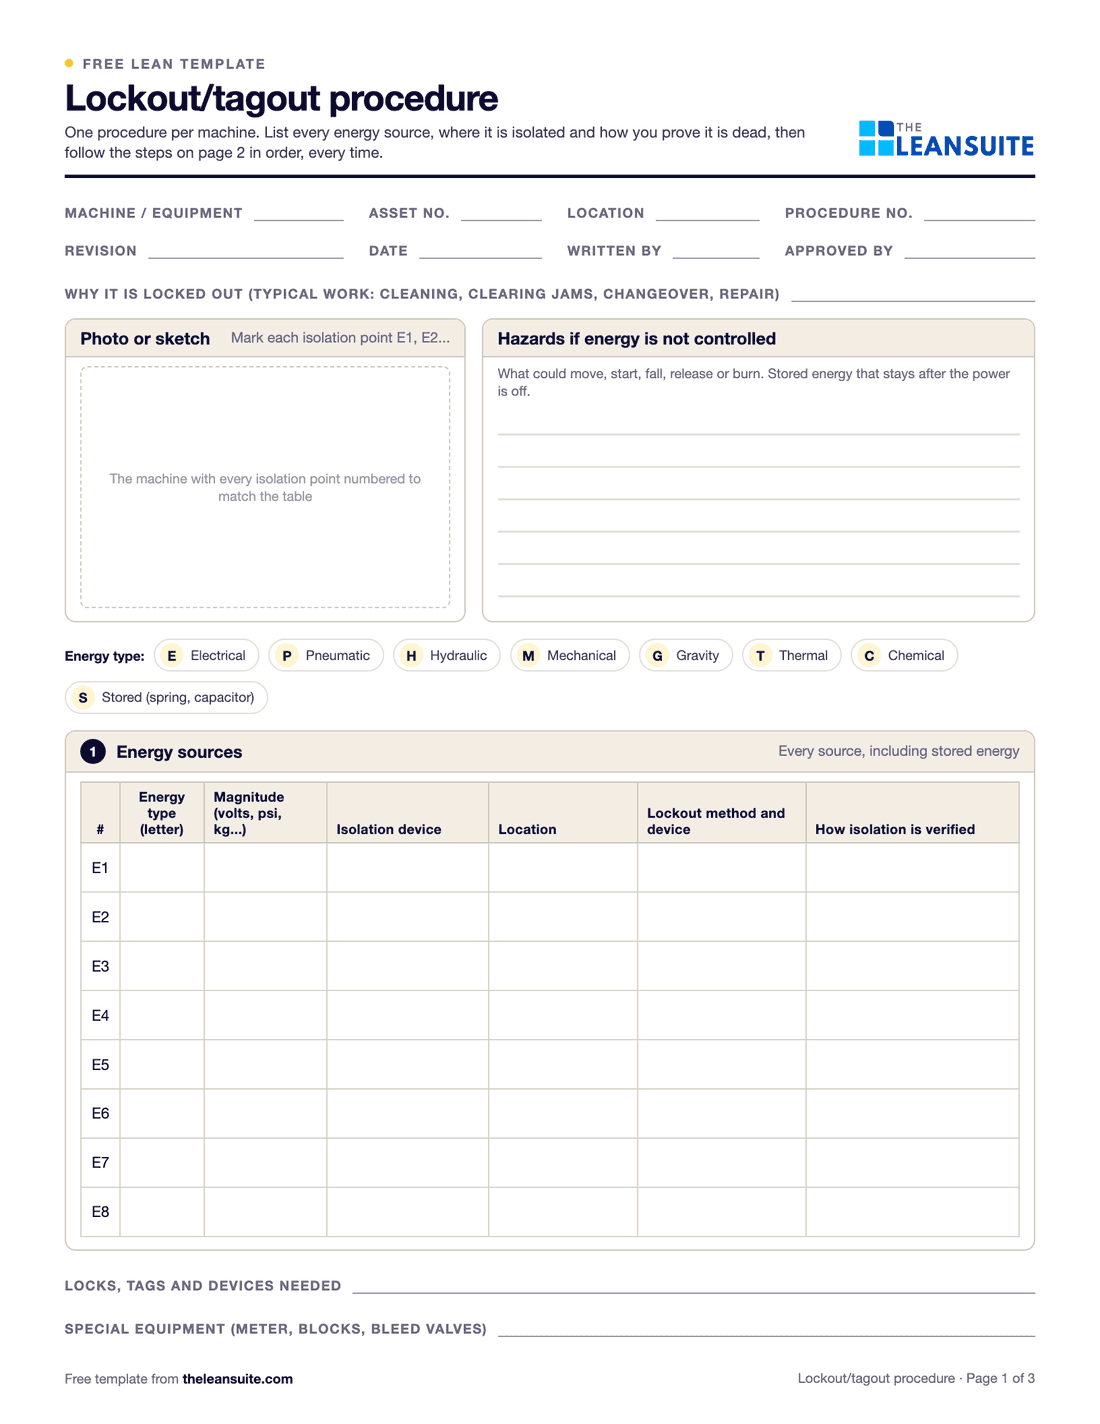 PDF and ExcelLockout/tagout (LOTO) procedure templateA machine-specific LOTO procedure: energy sources and isolation points, the steps from shutdown to restart, and the annual review.
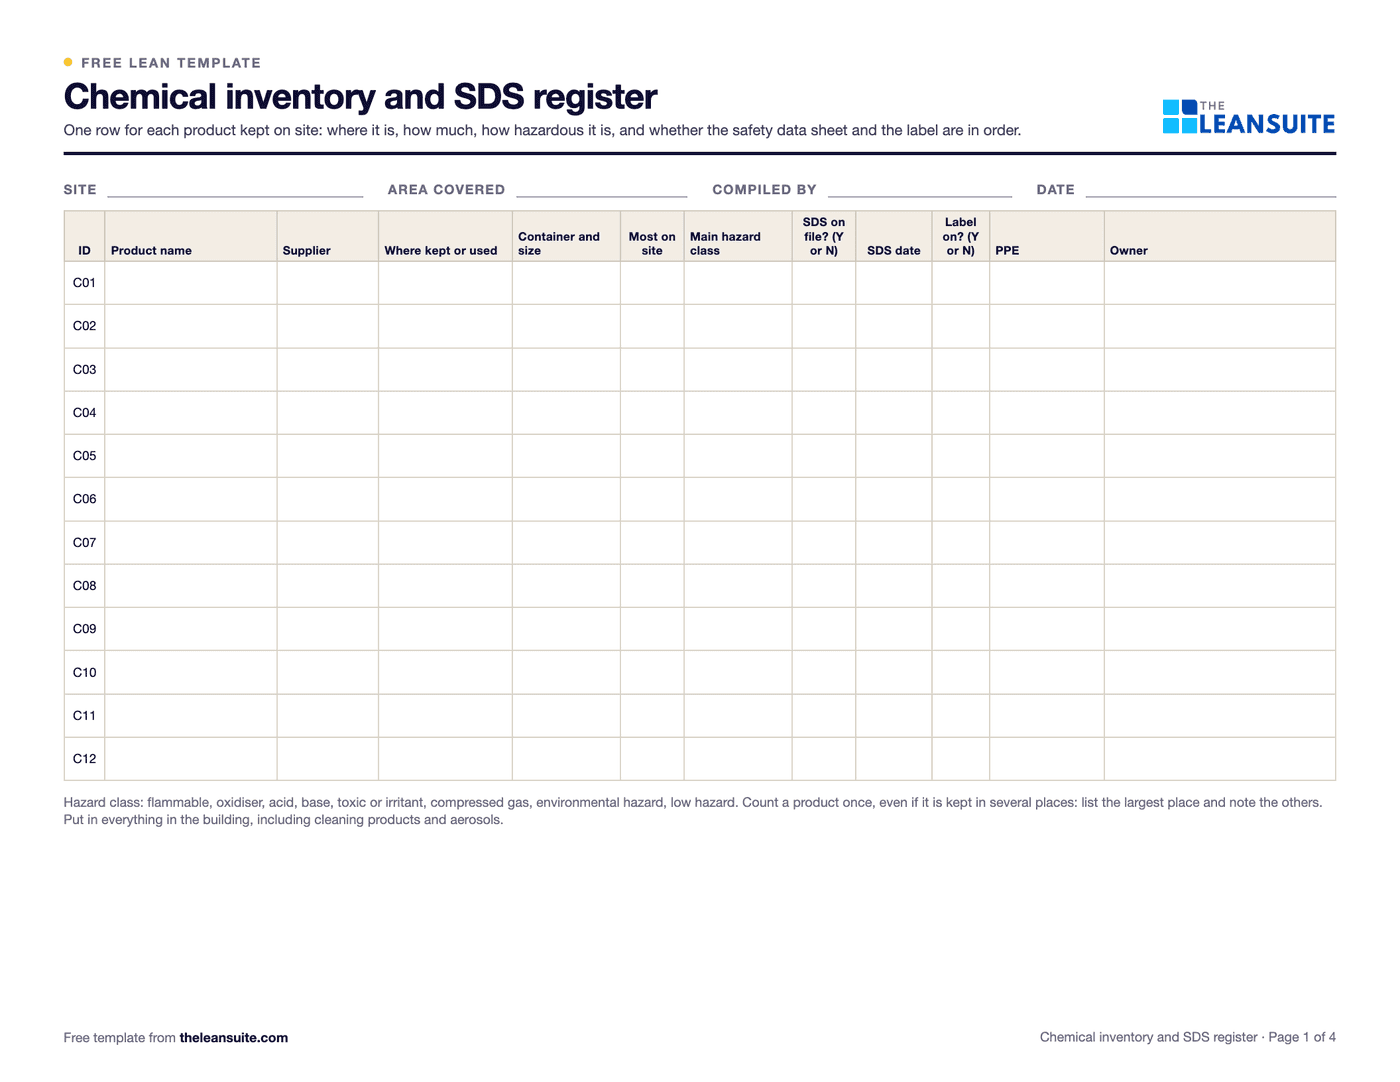 PDF and ExcelChemical inventory and SDS register templateA register of every chemical on site with its hazard class, safety data sheet and label, and a check that incompatible products are kept apart.
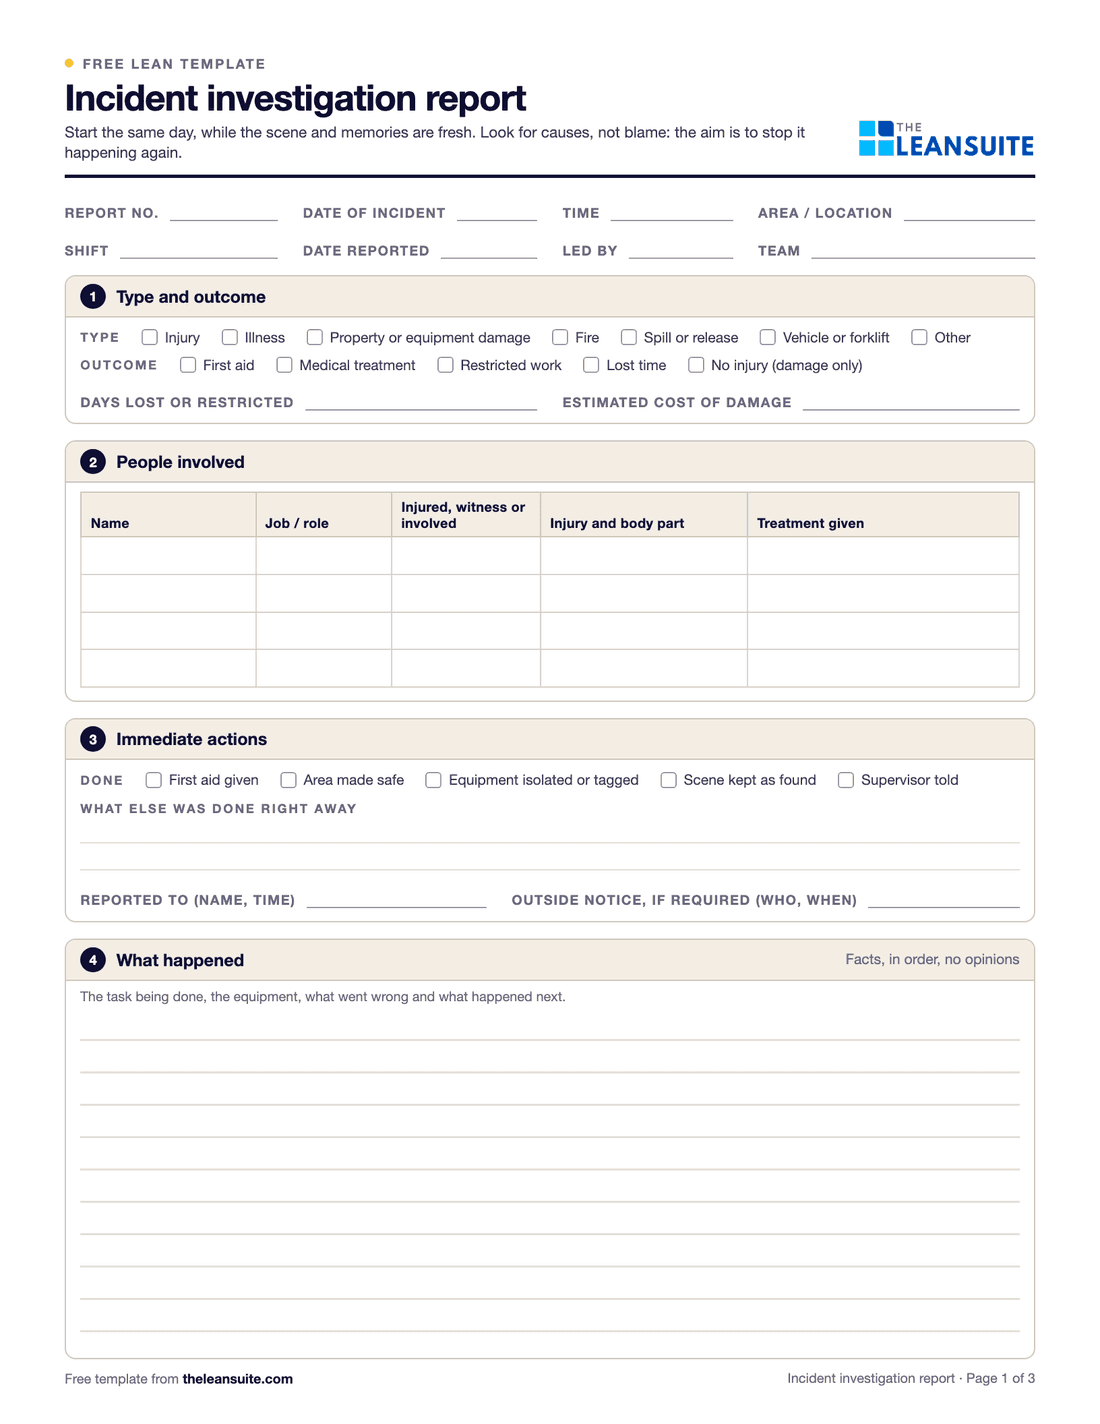 PDF and ExcelIncident investigation report templateFacts and a sourced timeline, causes at three levels, actions by the hierarchy of controls, a US recordkeeping screen and a closure check.
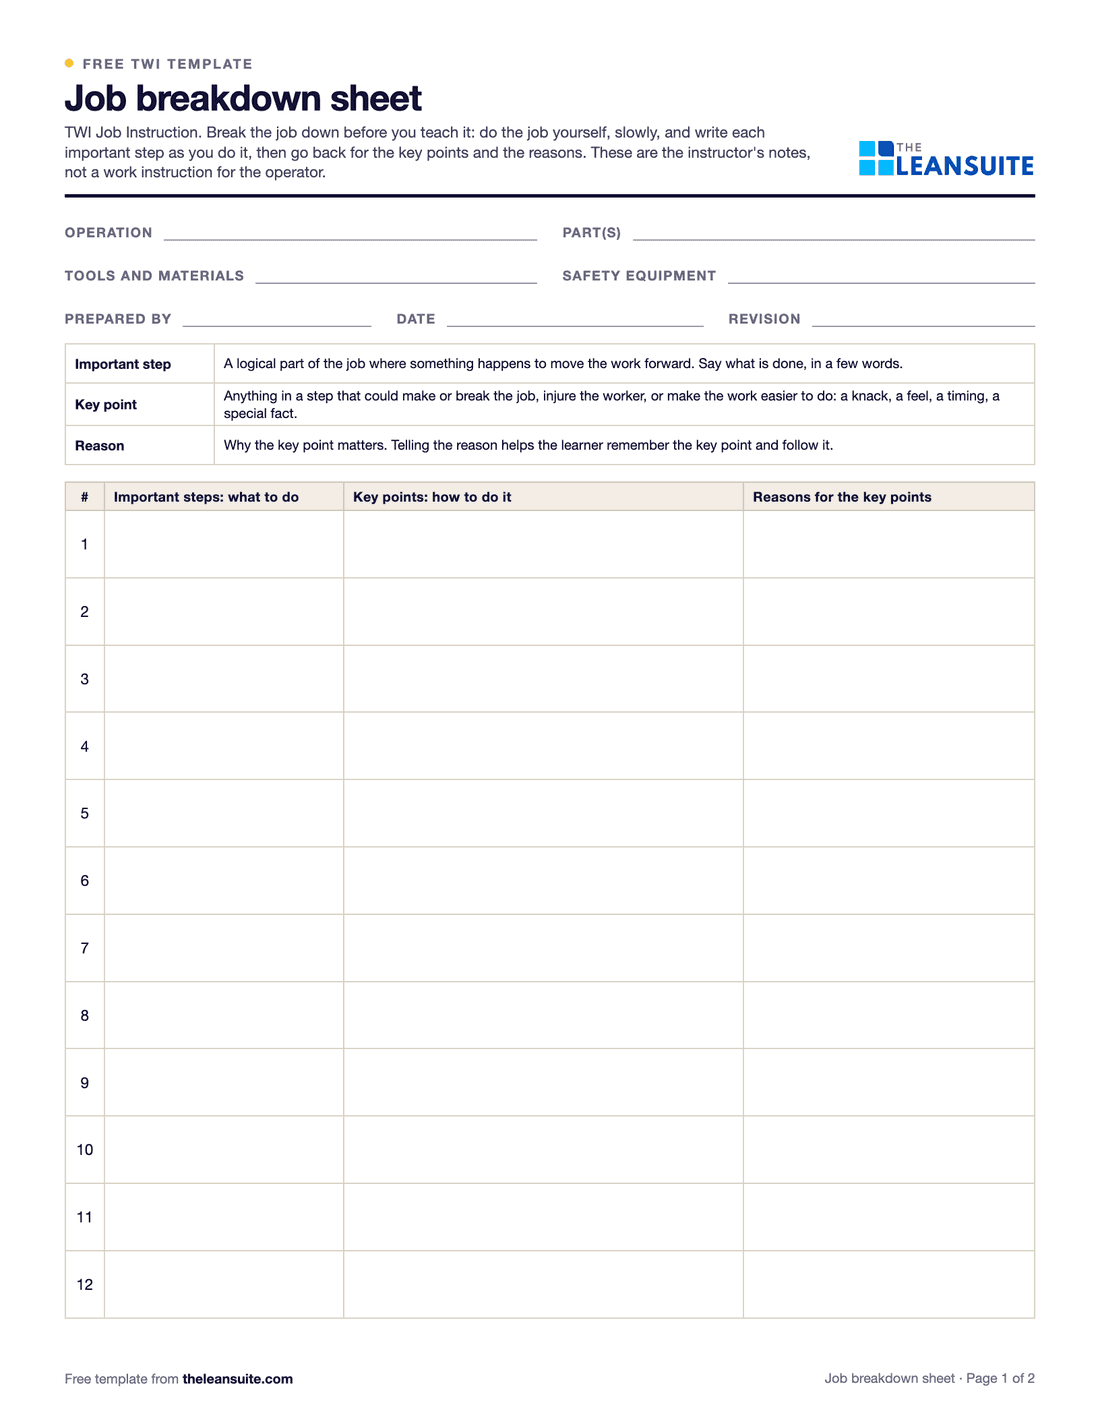 PDF and ExcelTWI job breakdown sheetThe TWI Job Instruction breakdown of a job into important steps, key points and reasons, with a worked example and the four steps.
 PDF and ExcelSkills matrix templatePeople by tasks on a 0 to 4 scale, coverage and gaps per task and shift, and a training plan that closes them.
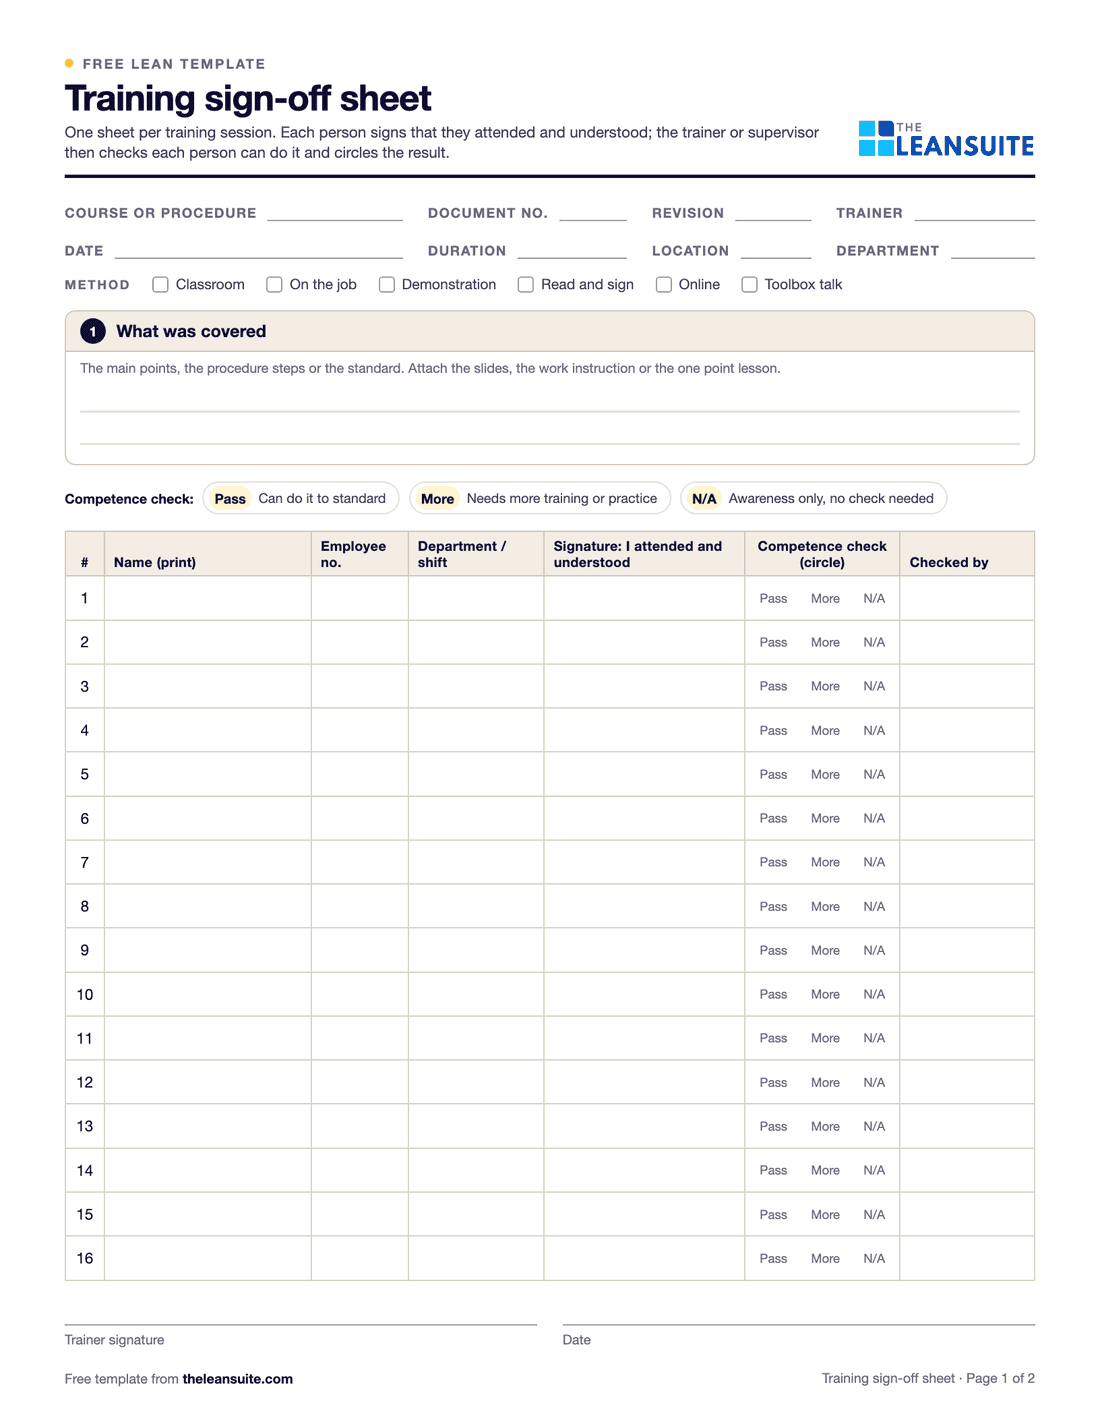 PDF and ExcelTraining sign-off sheetAn attendance and sign-off record where each person signs they understood, with a competence check and an Excel log.
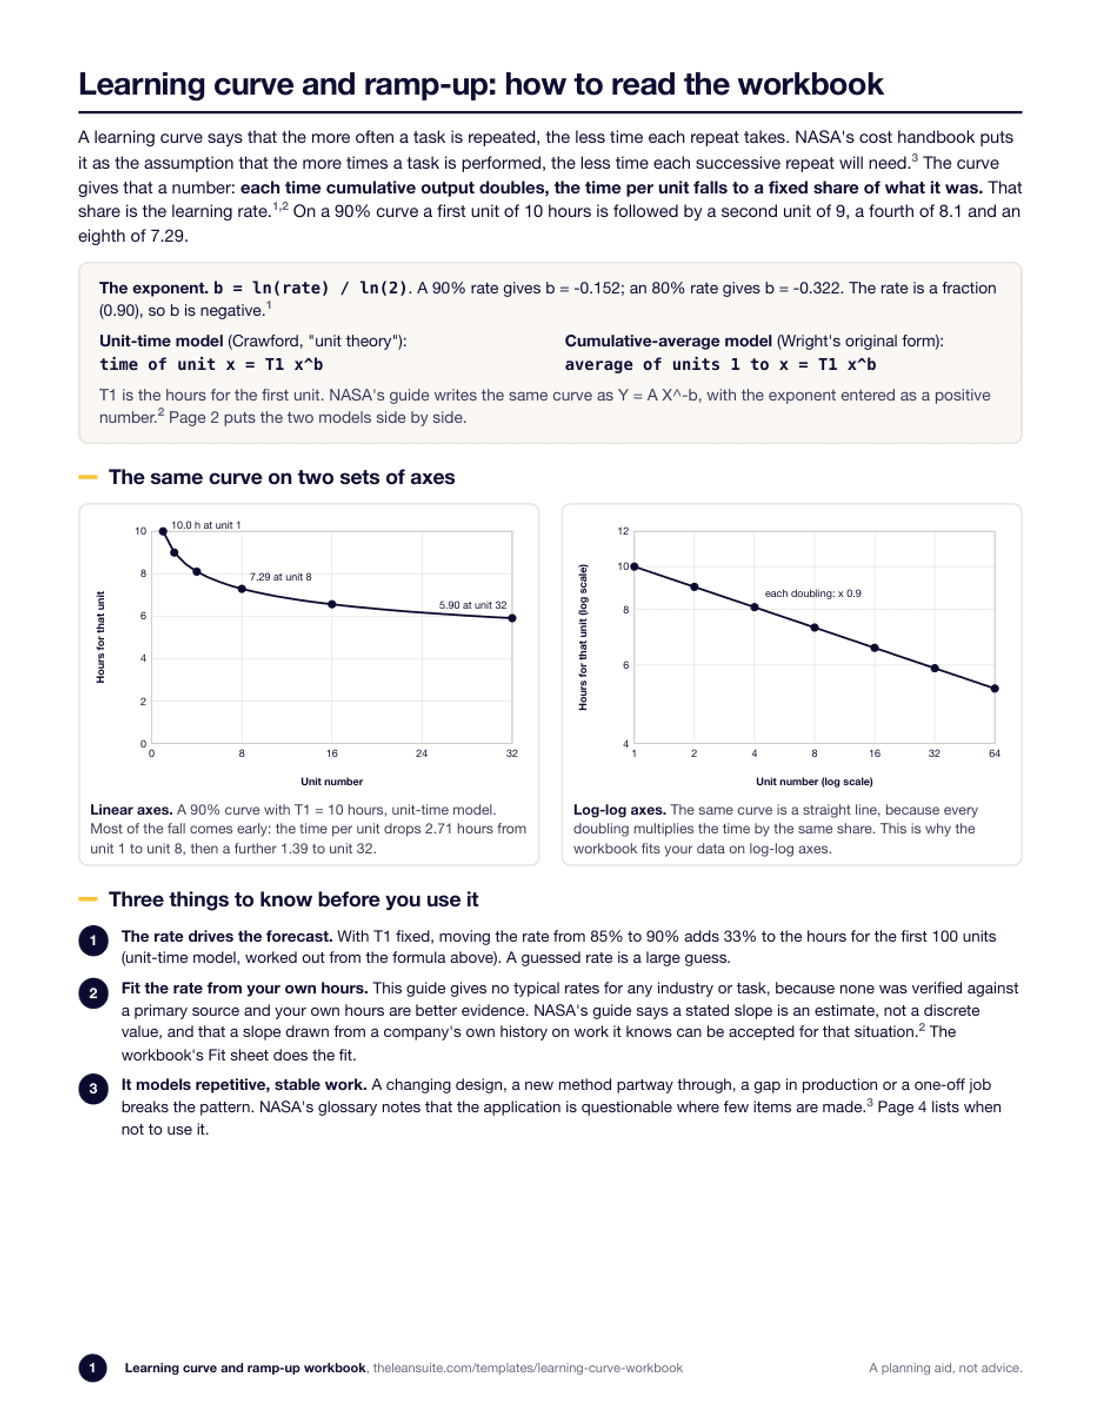 PDF and ExcelLearning curve and ramp-up workbookBoth learning curve models side by side, a fit from your own observed hours, batch hours, the unit that reaches standard and a weekly ramp plan.
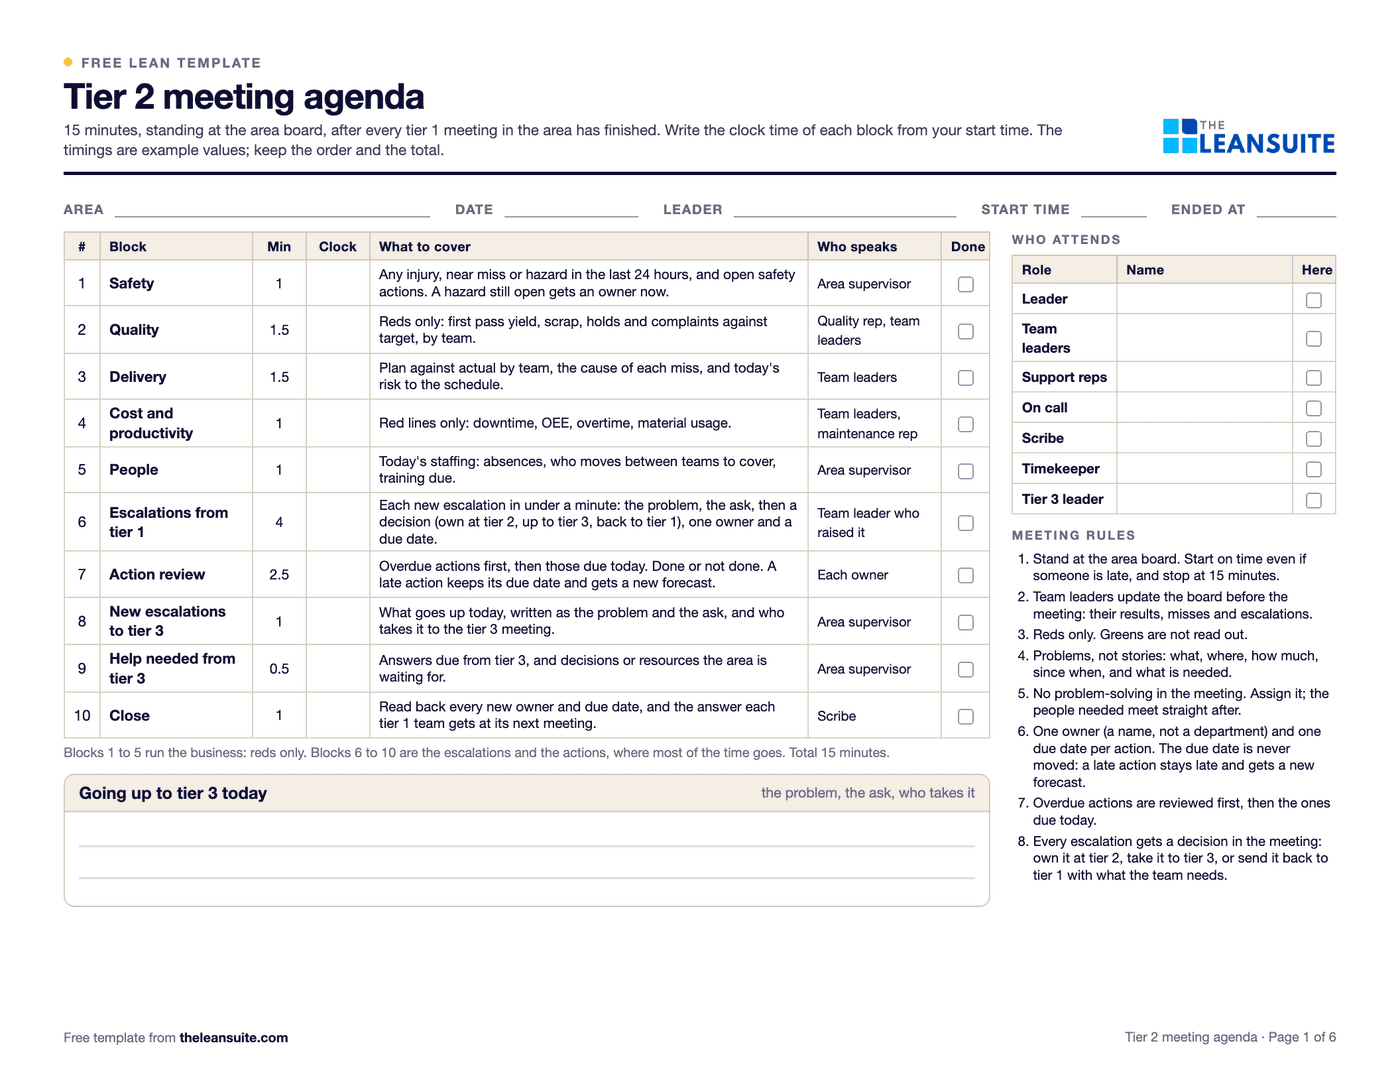 PDF and ExcelTier 2 meeting agenda and escalation sheetA 15-minute tier 2 agenda in ten timed blocks, fixed roles and rules, escalation triggers with time limits, and a log that ages every escalation and sends the answer back down.
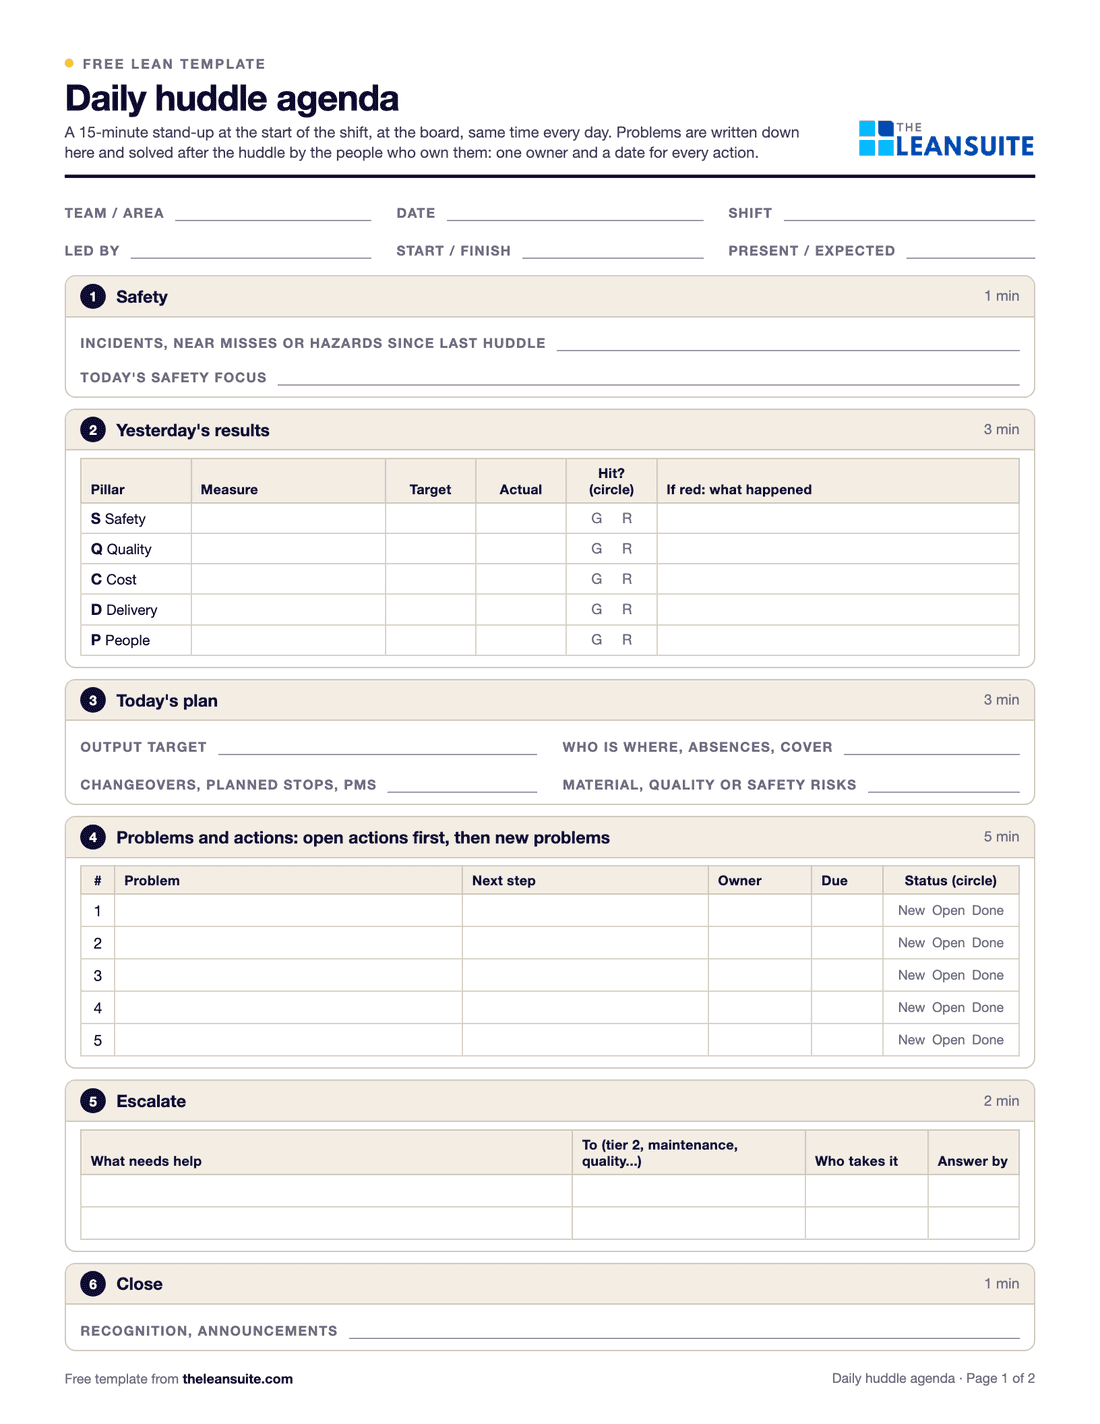 PDF and ExcelDaily huddle agendaA 15-minute start-of-shift stand-up in six timed blocks, with yesterday's SQCDP results, today's plan, actions and escalations.
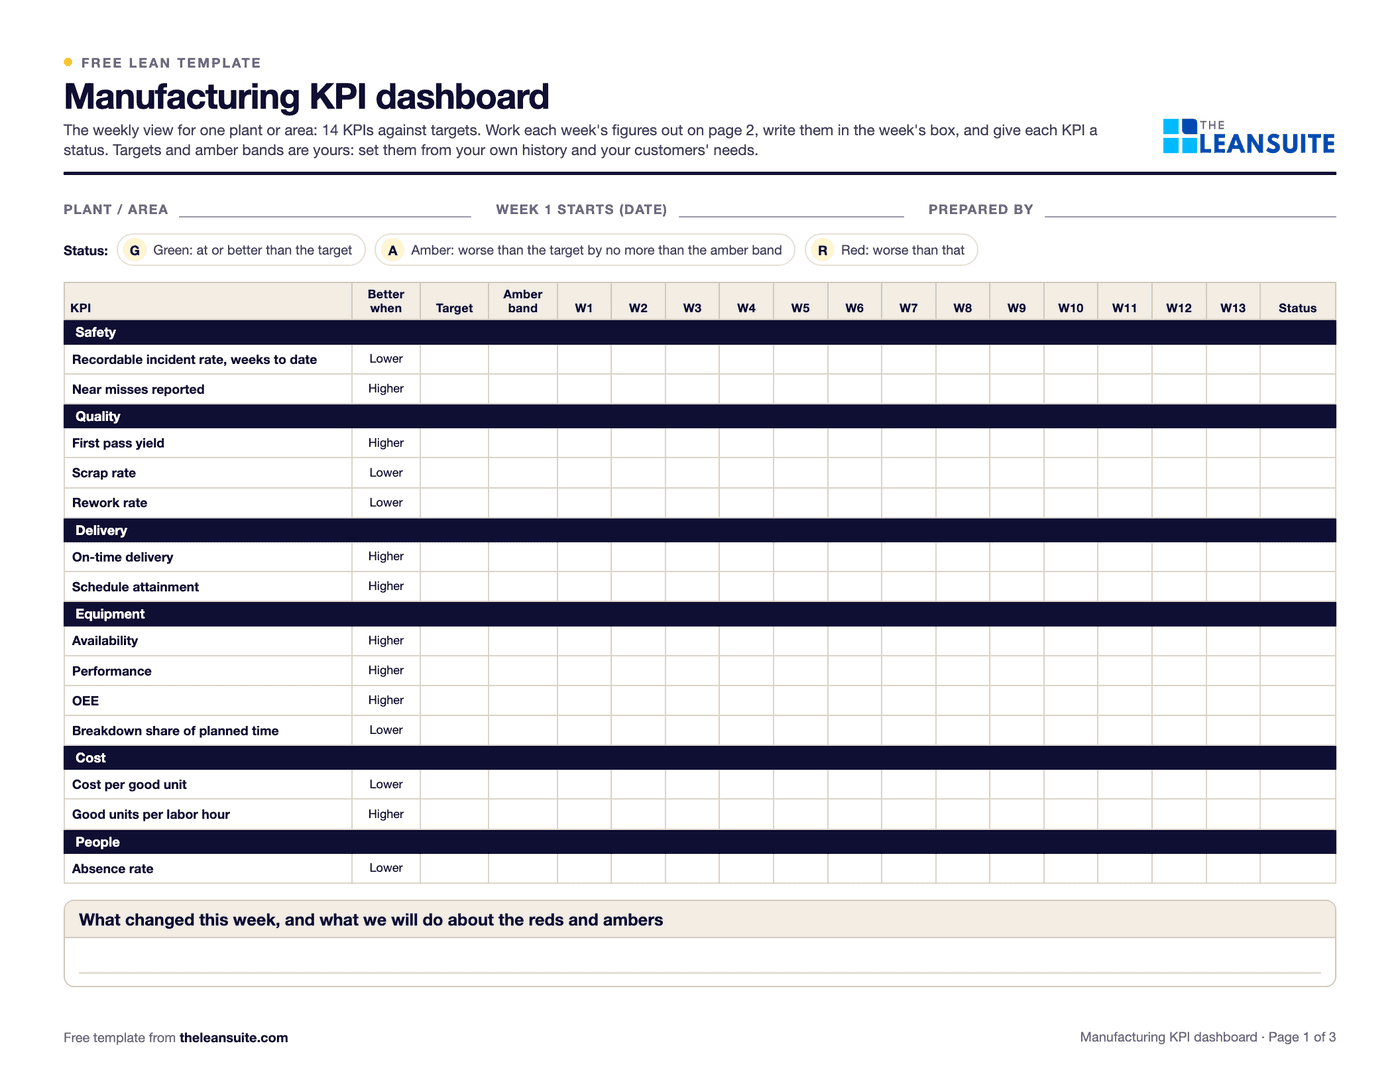 PDF and ExcelManufacturing KPI dashboard templateWeekly plant numbers in, 14 KPIs out: OEE and its parts, first pass yield, scrap, on-time delivery, recordable rate, cost and absence, each against a target.
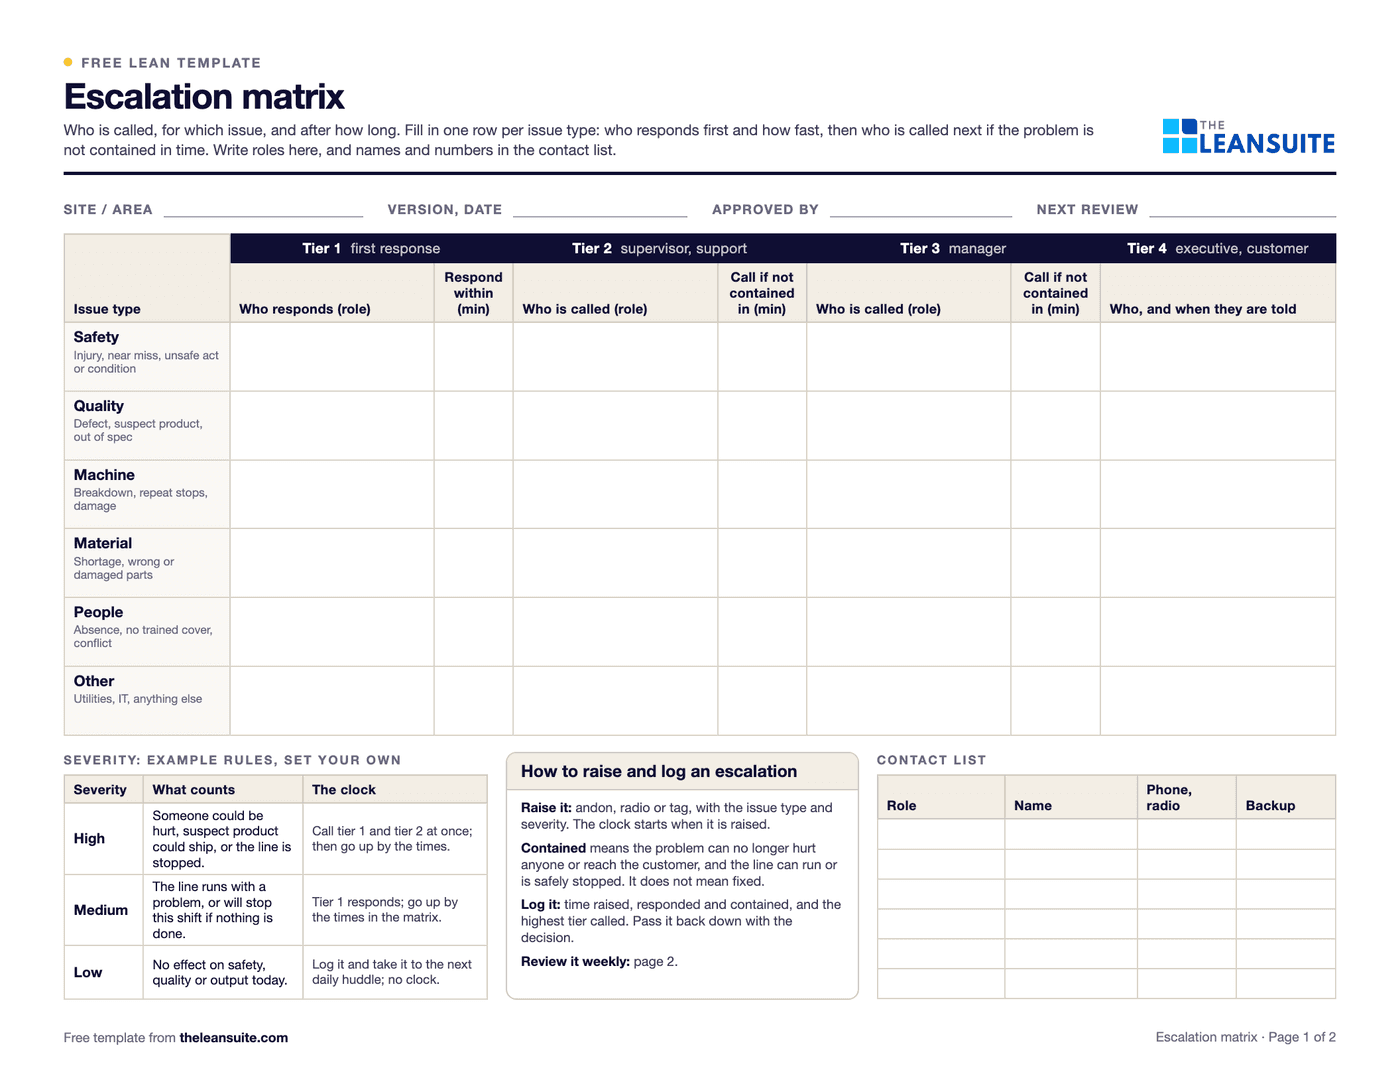 PDF and ExcelEscalation matrix templateWho is called for each type of issue and after how long, with severity rules, contacts and an escalation log.
Calculators (8)
- Free calculatorScrap rate calculatorScrap rate, the cost of scrap per period and per year, and what reaching a target rate would save.
- Free calculatorFirst pass yield (FPY) calculatorFirst pass yield at each step and rolled throughput yield (RTY) across the whole process.
- Free calculatorBottleneck calculatorThe step that limits your line, from each step's cycle time, machines and uptime, with daily capacity and the gap to demand.
- Free calculatorOEE calculatorOverall equipment effectiveness from shift time, downtime, ideal cycle time and part counts.
- Free calculatorMTBF and MTTR calculatorMean time between failures, mean time to repair and availability from operating time, failures and repair time.
- Free calculatorDowntime cost calculatorWhat an hour, an event and a year of unplanned downtime cost, from lost output, idle labour, scrap and overtime.
- Free calculatorTRIR and DART rate calculatorOSHA recordable and DART incident rates from your 300A case counts and hours, and what one more case does to them.
- Free calculatorRisk matrix calculatorSeverity times likelihood on a 3 x 3, 4 x 4 or 5 x 5 risk matrix, the band and its action, editable banding, and the score after further controls.
Buyer's guides
LeanSuite pages for these problems
- Loss & Cost Management
- Non-Conformance (NCR)
- KPI Dashboards
- CILR Checklists
- Audit Management
- Autonomous Maintenance
- Professional Maintenance Tags
- Near Miss Reporting
- Lockout/Tagout (LOTO)
- Digital Work Instructions
- Trainings (LMS)
- Competency Management
- Tiered Meetings
How LeanSuite handles each of these is on the page for battery and energy storage plants.
Whirlpool tackled project visibility and continuous improvement across 14 manufacturing plants with LeanSuite. Read the Whirlpool case study.
FAQ
Lean in battery and energy storage plants: common questions
At the stage that loses most, found by measuring yield at every stage for two weeks. Fix the top defect where it is made, protect formation as the bottleneck and put a daily care routine on the machine that sets the pace. Write each fix down as a standard and train it before moving on.
Illustrative example: electrode making yields 96% good, cell assembly 97% and formation and grading 98%. Rolled throughput yield is 0.96 times 0.97 times 0.98, which is 0.9126, or about 91.3%: of 10,000 cell equivalents started, about 9,126 come out good. Raising electrode yield from 96% to 98% lifts it to 0.98 times 0.97 times 0.98, which is 0.9316, or about 93.2%, so about 190 more good cells per 10,000 without touching formation. A defect fixed at the electrode also stops formation channels being spent on cells that would fail.
The methods are the same; the stages differ. A lead-acid plant casts grids, pastes and cures plates, assembles and forms batteries, and its biggest health topic is lead exposure. A lithium-ion plant coats and calenders electrodes, assembles cells in dry rooms, forms and ages them, then builds modules and packs. In both, yield by stage, a protected bottleneck, daily equipment care and trained operators come first.
It should not, but check every change against the rules the product and plant work to: IATF 16949 for automotive programs, the safety standards the packs or systems are certified to, such as UL 2580 or UL 9540, UN 38.3 for transport, and the OSHA lead standard in lead-acid plants. A change to a validated process step usually needs your own or your customer's change approval first. Lean removes waiting and rework around those steps; it does not skip them.
See LeanSuite on your ramp-up
Bring the loss you want to fix first. We will show you how LeanSuite handles it and what a 90-day pilot would cover.