

Lean playbook · Medical devices
Lean playbook for medical device plants
Short answer
Lean in a medical device plant starts with first-time quality, not speed. Measure yield at every step, because small losses multiply across molding, assembly and sealing. Error-proof the assembly steps where parts are missed or swapped. Balance manual cleanroom cells against takt, and keep CAPA for systemic problems so the list can be closed. Any change to a validated process goes through your change control, so agree the route with quality before you start.
Last updated:
7 problems on the floor, and the lean methods for each
Each problem says what it looks like, which methods address it, the first moves to make and the number to watch. Pick the one or two that cost your plant most; you do not need all of them at once.
Where a medical device molding, assembly and packaging line loses time and quality
Component molding and machining
Cleanroom assembly
Packaging and sealing
Sterilization
Final inspection and release
Across the whole line
Scrap at molding
Short shots, flash, sink and out-of-tolerance dimensions are scrapped at the press. The process is validated, so the scrap is treated as normal instead of a problem to solve.
In LeanSuite
Issue Management logs each defect where it is found.
First moves
- Count scrap by defect type and by cavity for two weeks.
- Chart the critical dimensions and find the cavities and settings with the widest spread.
- Fix the top cause, and raise change control for any change to a validated parameter.
Number to watch: First-pass yield at molding, by cavity.
Missed and swapped parts in assembly
Operators assemble small parts by hand, often under magnification, following a paper traveler. A missed O-ring or a swapped component is easy to make and hard to see at final inspection.
In LeanSuite
Film the job once and LeanSuite drafts the work instruction with numbered steps, photos, tools, PPE and warnings from the video.
First moves
- Pareto assembly defects by step and pick the step with the most.
- Error-proof it: fixtures that only fit one way, part presence checks, kits with one of each part.
- Write job breakdowns with photos for the critical steps and train with them.
Number to watch: First-pass yield at assembly, and defects by step.
Unbalanced cleanroom cells
Cleanroom cells are staffed by hand and volumes change by model and month. One station sets the pace while others wait, and adding a person means gowning in and finding space.
Lean methods
In LeanSuite
Upload a video of the line and Vision AI produces a Yamazumi chart, a takt comparison and rebalancing recommendations.
First moves
- Time each station's work elements, ideally from video, and draw a Yamazumi chart against takt.
- Move elements from the busiest station to the lightest, within the validated sequence.
- Rebalance when demand or the model mix changes, not once a year.
Number to watch: Balance efficiency, and output per operator hour.
Seal and packaging defects
Channels, wrinkles and weak seals in the sterile barrier pouch are found at seal inspection, or worse after sterilization, when the whole lot is at risk.
In LeanSuite
Each non-conformance is captured with photos and routed to quality and engineering.
First moves
- Record every seal defect by type, sealer and shift on a check sheet.
- Check sealer temperature, pressure and dwell time at start-up against the validated window.
- Error-proof pouch loading so the device cannot sit in the seal area.
Number to watch: Seal defects per 1,000 pouches, by sealer.
Label and component mix-ups between lots
Lines that run several models or sizes leave labels, components and travelers from the last lot near the line. A clearance sheet is signed, but nobody can say which stations were checked.
Lean methods
In LeanSuite
Audit management in LeanSuite lets you build, schedule and run any shop floor audit or inspection, from layered process audits to gemba walks, and turn every finding into a tracked action.
First moves
- Write the clearance as a station-by-station walk, with a photo of each place leftovers hide.
- Have a second person verify it before the first unit of the next lot.
- Remove what the line does not need, and give each lot's labels and parts their own marked place.
Number to watch: Line clearance findings per clearance.
NCR and CAPA backlog
Lots wait at final release for open NCRs, and the CAPA list grows faster than it closes because every problem becomes a CAPA. The same defects come back after CAPAs are closed.
Lean methods
In LeanSuite
Each non-conformance is captured with photos and routed to quality and engineering.
First moves
- Sort open items: one-off issues get a correction, systemic ones get a CAPA.
- Review every open CAPA with its owner and due date at a weekly meeting.
- Close a CAPA only after a check that the action worked, and trend repeat defects.
Number to watch: CAPA cycle time, and repeat NCRs after a CAPA closed.
Qualified operators on every station
Each operator must be qualified on a procedure before running it, and requalified after a change. When someone is out, supervisors search records to find a qualified replacement.
In LeanSuite
Competency Management keeps a live skills matrix whose levels update as people complete training and on-the-job sign-offs.
First moves
- Build a skills matrix by station and procedure, with the date each qualification was given.
- Plan cross-training for every station with fewer than two qualified people per shift.
- Requalify people before a changed procedure goes live, not after.
Number to watch: Stations with at least two qualified operators per shift.
More small fixes in the production, quality and maintenance sections of the kaizen idea bank.
A 90-day starting plan
One line or product family, two problems, measured before and after. The point of the first 90 days is a result the plant believes and a method it can repeat, not a plant-wide program.
The 90 days, with the gate that ends each stage
- Days 1 to 30Measure yield at every stepDone when: You have yield by step, two problems with owners and an agreed change control route.
- Days 31 to 60Error-proof and rebalanceDone when: Each change has a before-and-after number and an approved standard.
- Days 61 to 90Hold the gains and spread themDone when: The gains have held for a month and the next line has its yield baseline.
Days 1 to 30
Measure yield at every step
See where one product line loses yield and time, and agree the change control route with quality.
- Choose the product line with the most scrap or NCRs, and name an owner.
- Agree with quality which changes need change control or revalidation.
- Measure first-pass yield at each step for two weeks, and count NCRs and open CAPAs.
- Start a short daily meeting at the cell with production, quality and engineering.
- Choose the two biggest losses to work on first.
Days 31 to 60
Error-proof and rebalance
Attack the two problems and prove the change with numbers.
- Error-proof the assembly step with the most defects.
- Time the cell and rebalance it against takt.
- Sort the CAPA list into corrections and true CAPAs, and set owners and dates.
- Raise change control for anything that touches a validated step.
Days 61 to 90
Hold the gains and spread them
Keep the new standards in place and start the next line.
- Requalify operators on the changed procedures and update the skills matrix.
- Audit the new standards and the line clearance on every shift.
- Update the process FMEA with what you learned.
- Share the results and pick the next line.
The KPIs to track
Track them per line and shift, on a board the team sees every day. Set targets from your own baseline, not from someone else's plant.
| KPI | What it tells you | How to measure it | Free help |
|---|---|---|---|
| Rolled throughput yield | The share of units that pass every step first time, across the whole line. | Multiply the first-pass yields of each step, per product line and week. | First pass yield (FPY) calculator |
| NCRs per 1,000 units | How often product does not meet specification, and where. | NCRs raised divided by units made, times 1,000, split by source. | Non-conformance report (NCR) form |
| CAPA cycle time | How long systemic problems stay open. | Average days from CAPA opened to closed after its effectiveness check, and the share closed on time. | CAPA log template |
| Scrap cost | What scrap costs, weighted by how far the unit got before it was scrapped. | Units scrapped at each step times the cost of a unit at that step, per month. | Cost of poor quality (COPQ) calculator |
| Balance efficiency | How evenly work is spread across a manual cell. | Total work content divided by the number of stations times the longest station time. | Line balancing calculator |
| Qualified coverage | Whether each shift has enough qualified people for its stations. | Stations with at least two qualified operators on the shift divided by stations staffed. | Skills matrix template |
By the numbers
Public figures for this industry or for the wider sector it belongs to, each linked to the report or government table it comes from and checked against it on October 3, 2026. More in our lean manufacturing statistics and benchmark charts.
16×
Plants in the top quarter for relying on reactive maintenance had 3.3 times more downtime and 16 times more defects than plants in the bottom quarter.
Same NIST survey. NIST notes the link is an association, not proof of cause.
Source: NIST, Economics of Manufacturing Machinery Maintenance: A Survey and Analysis of U.S. Costs and Benefits (NIST AMS 100-34) (June 2020)
31%
Only 31% of respondents feel they fully understand how quality costs affect their organization's financial performance.
From ASQE's 2025 Insights on Excellence Cost of Quality Report, as published by ASQ. Across industries, not medical devices alone.
Source: ASQ, What is Cost of Quality (COQ)? (citing the 2025 ASQE Insights on Excellence Cost of Quality Report) (2025)
Injury and illness rate by industry, 2024
- Motor vehicles5.6
- Beverage and tobacco3.7
- Furniture3.5
- Food3.3
- Primary metals3.3
- Nonmetallic mineral products, incl. glass3.3
- Fabricated metal products3.2
- Transportation equipment3.2
- Motor vehicle parts2.9
- Plastics and rubber products2.8
- HVAC and refrigeration2.4
- Paper2.4
- Machinery2.3
- All private industry2.3
- Electrical equipment and appliances2.0
- Printing1.6
- Chemicals1.6
Total recordable cases per 100 full-time workers, 2024: Motor vehicles 5.6, Beverage and tobacco 3.7, Furniture 3.5, Food 3.3, Primary metals 3.3, Nonmetallic mineral products, incl. glass 3.3, Fabricated metal products 3.2, Transportation equipment 3.2, Motor vehicle parts 2.9, Plastics and rubber products 2.8, All manufacturing 2.7, HVAC and refrigeration 2.4, Paper 2.4, Machinery 2.3, All private industry 2.3, Electrical equipment and appliances 2, Printing 1.6, Chemicals 1.6.
Free templates, calculators and buyer's guides
Templates (17)
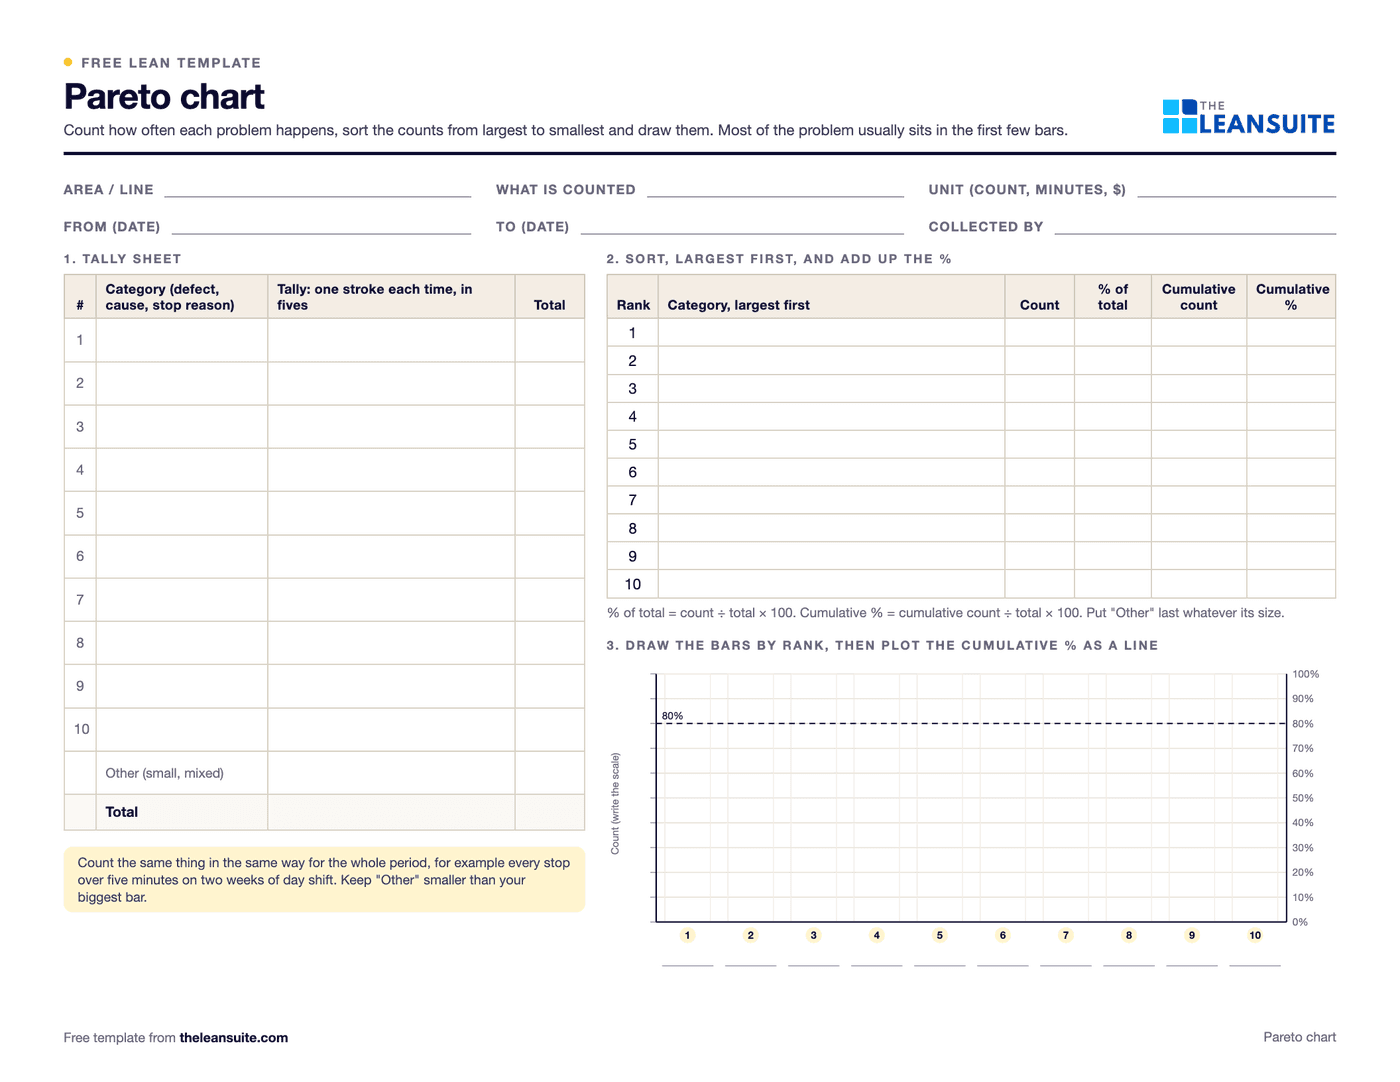 PDF and ExcelPareto chart templateA tally sheet, the Pareto by count and by cost with the cumulative line and the 80% cut, and a before and after comparison. Excel sorts and draws it.
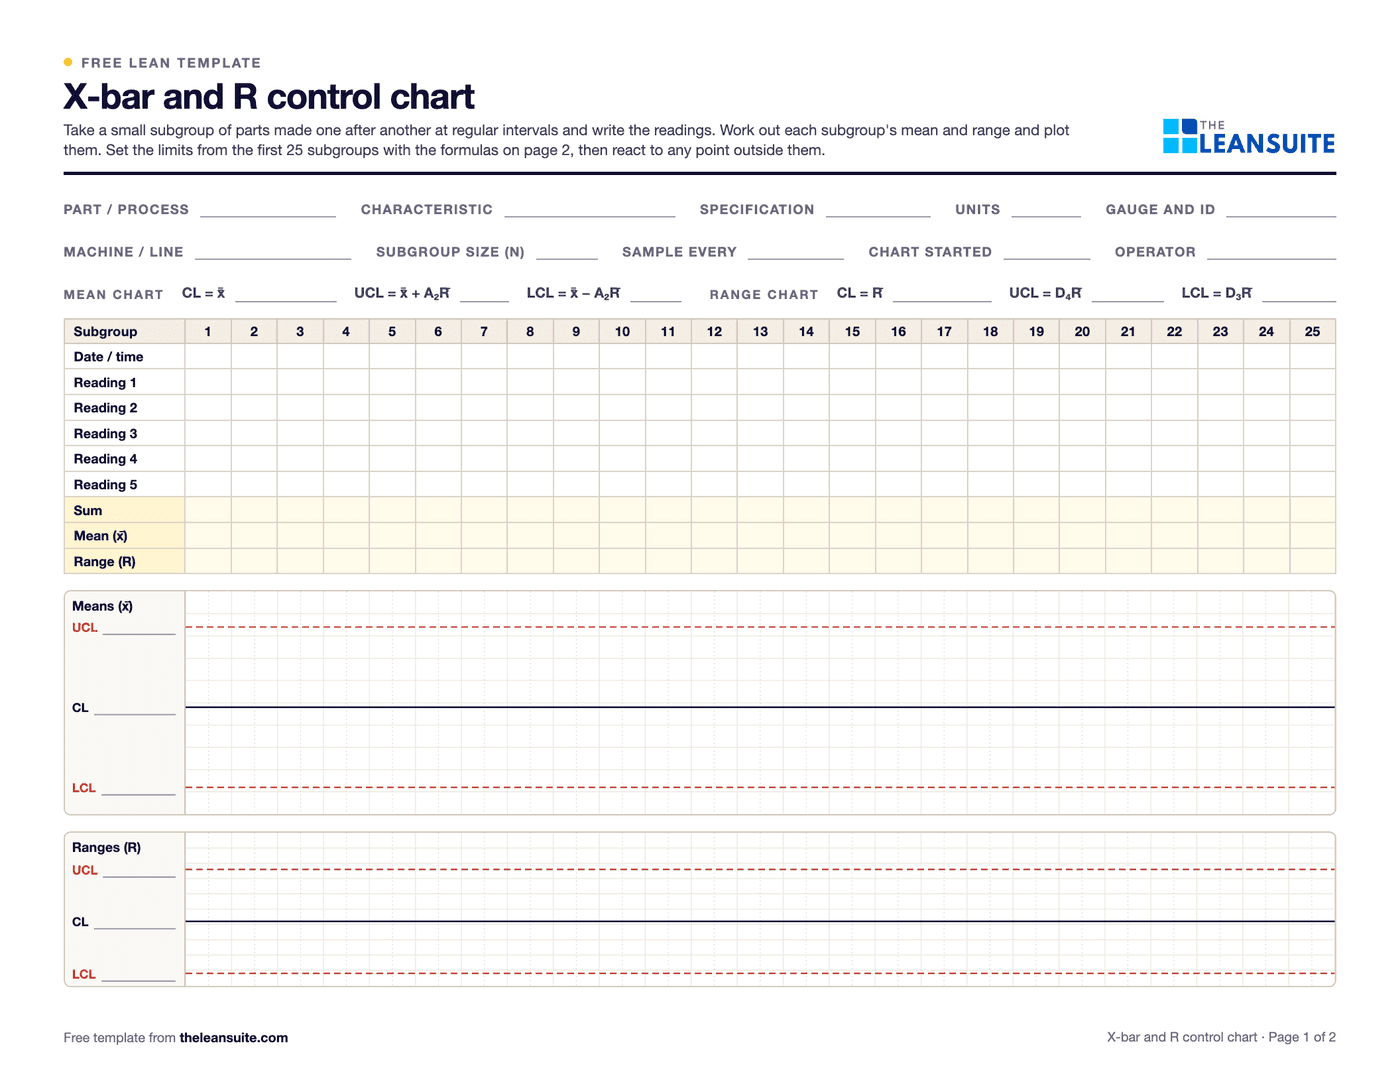 PDF and ExcelX-bar and R control chart template25 subgroups with means and ranges, control limits from A2, D3 and D4, signal flags, both charts and a reaction log.
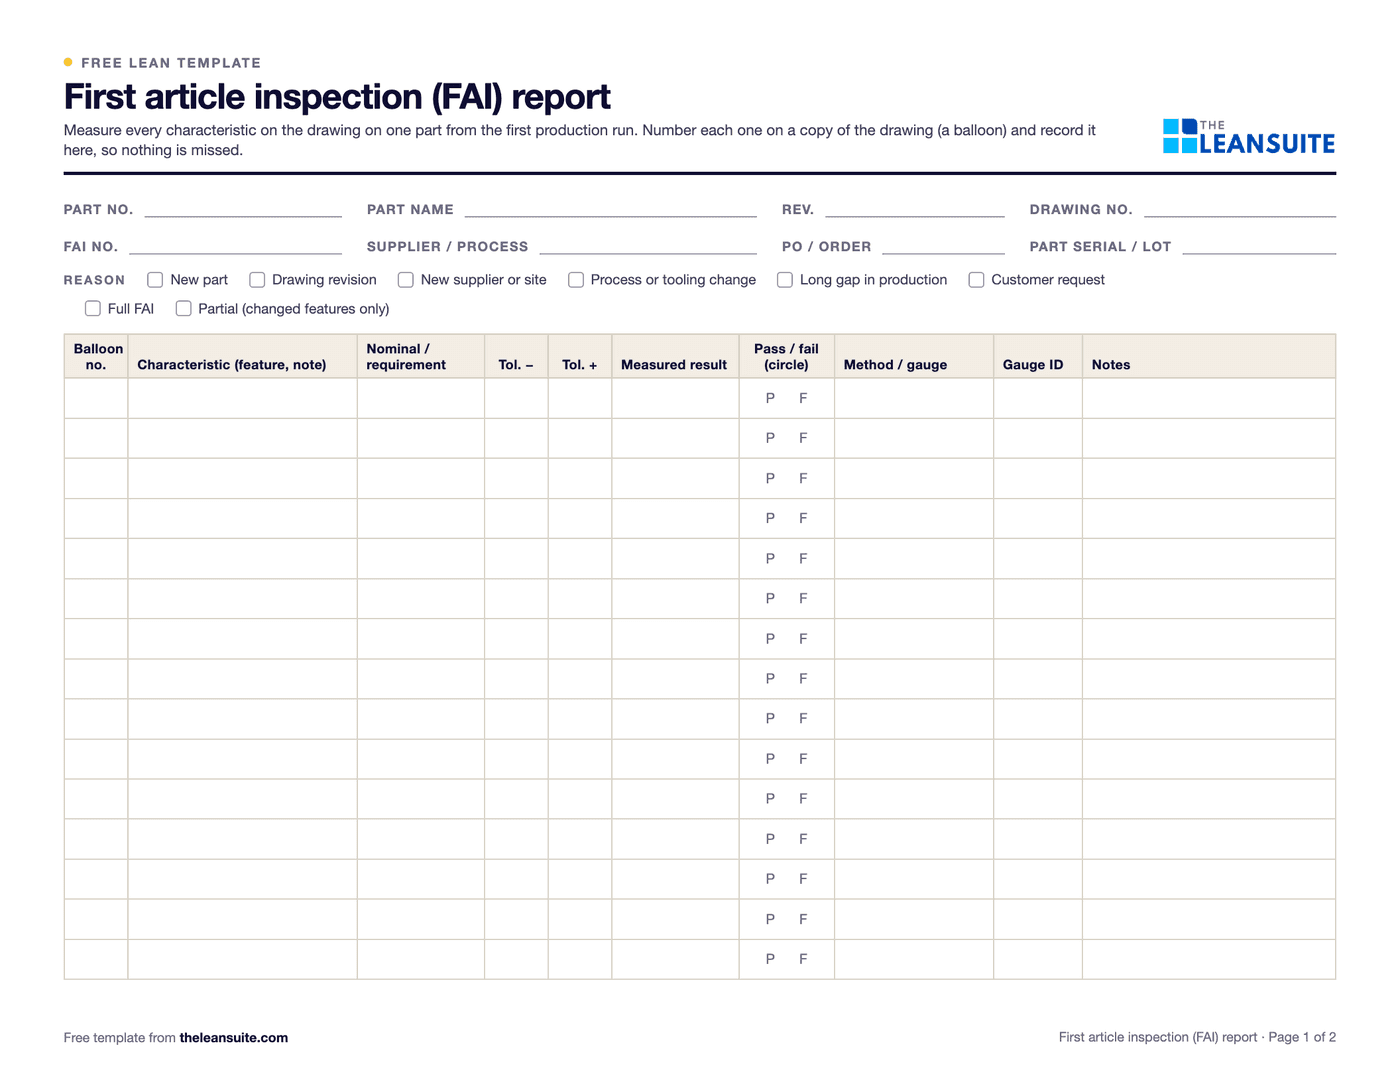 PDF and ExcelFirst article inspection (FAI) report templatePart information, a ballooned characteristic table with tolerances and results, material and process certificates, and sign-off.
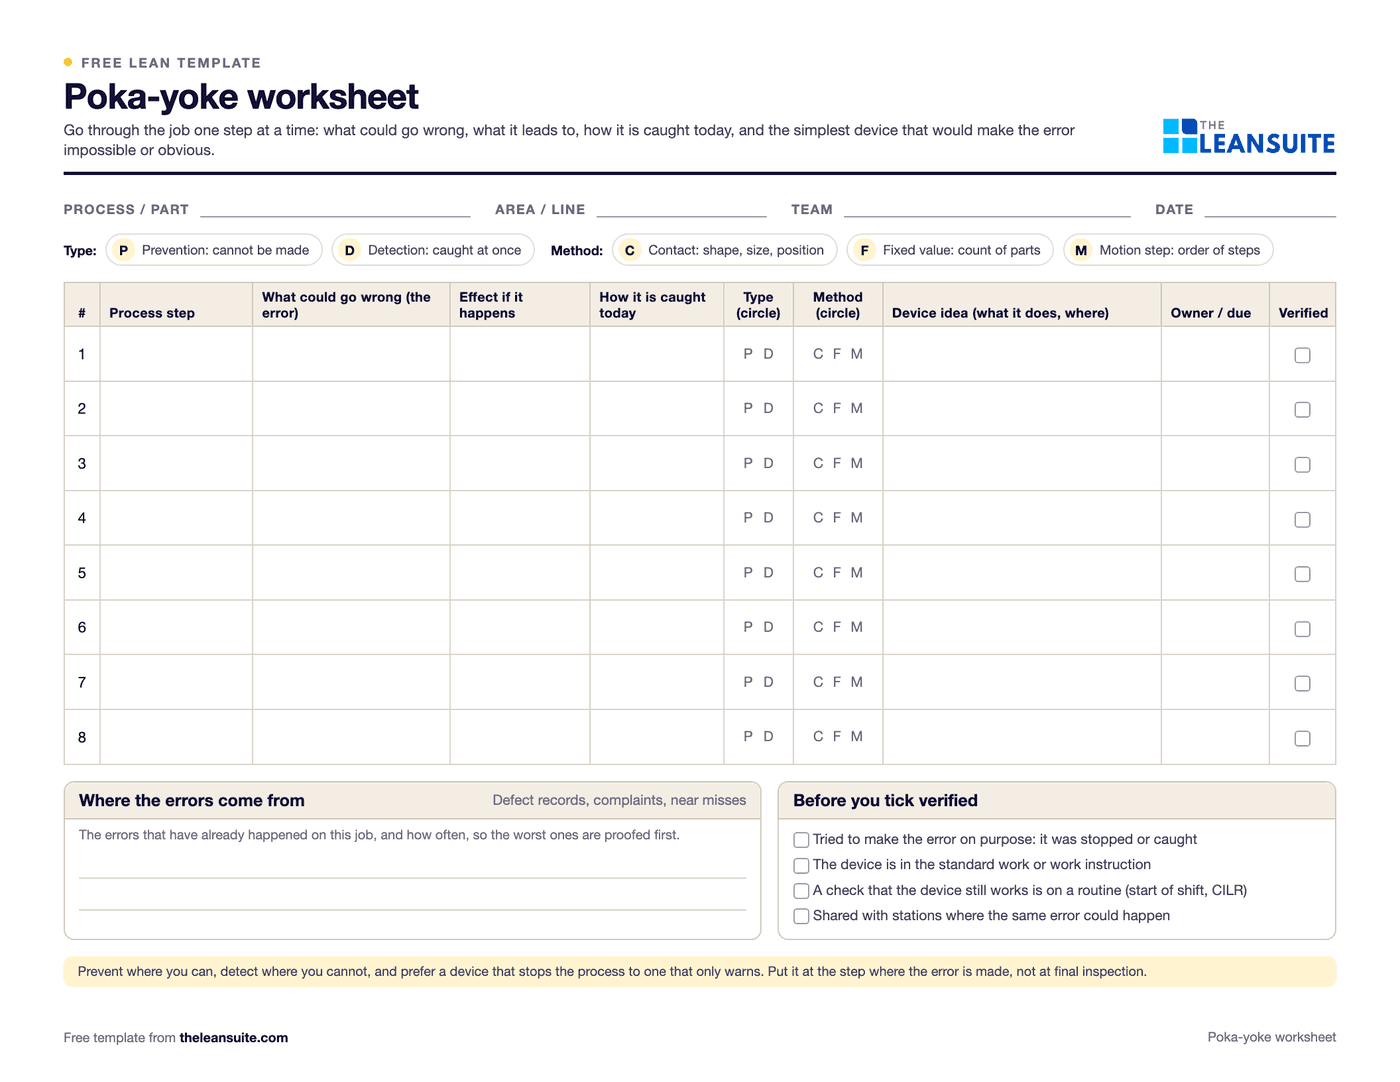 PDF and ExcelPoka-yoke worksheetEach step's errors and what they cost, the device (approach, function, method), payback, and a log that proves each device works.
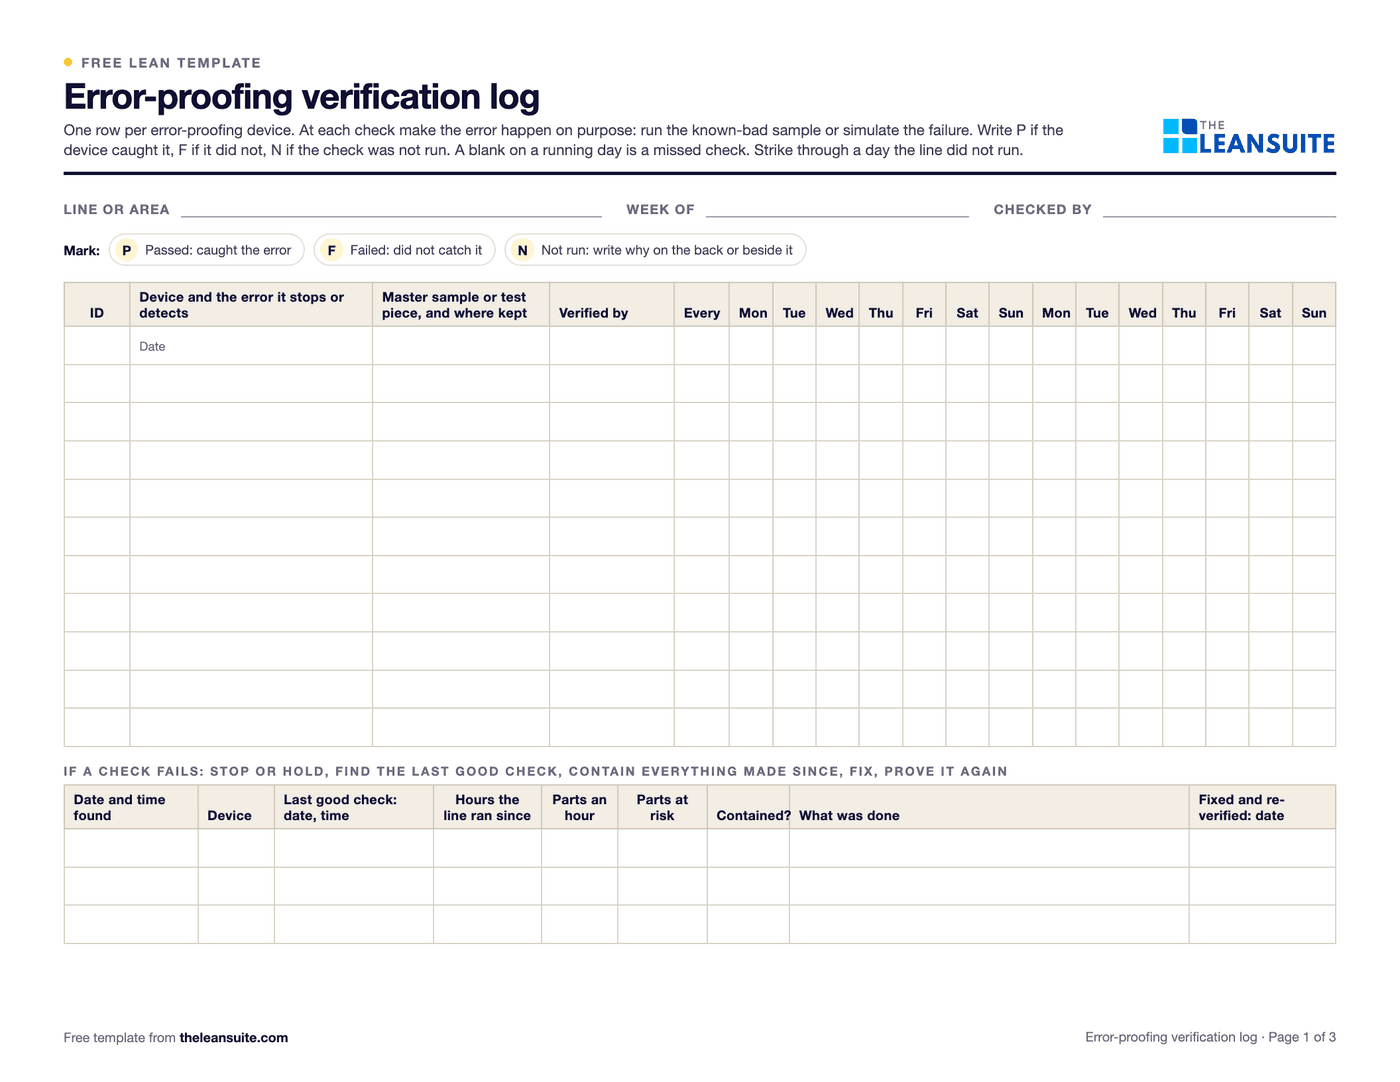 PDF and ExcelError-proofing verification log (daily master-sample check)Each poka-yoke device proved every day or week with a known-bad sample, with missed checks counted and the hours and parts at risk worked out when one fails.
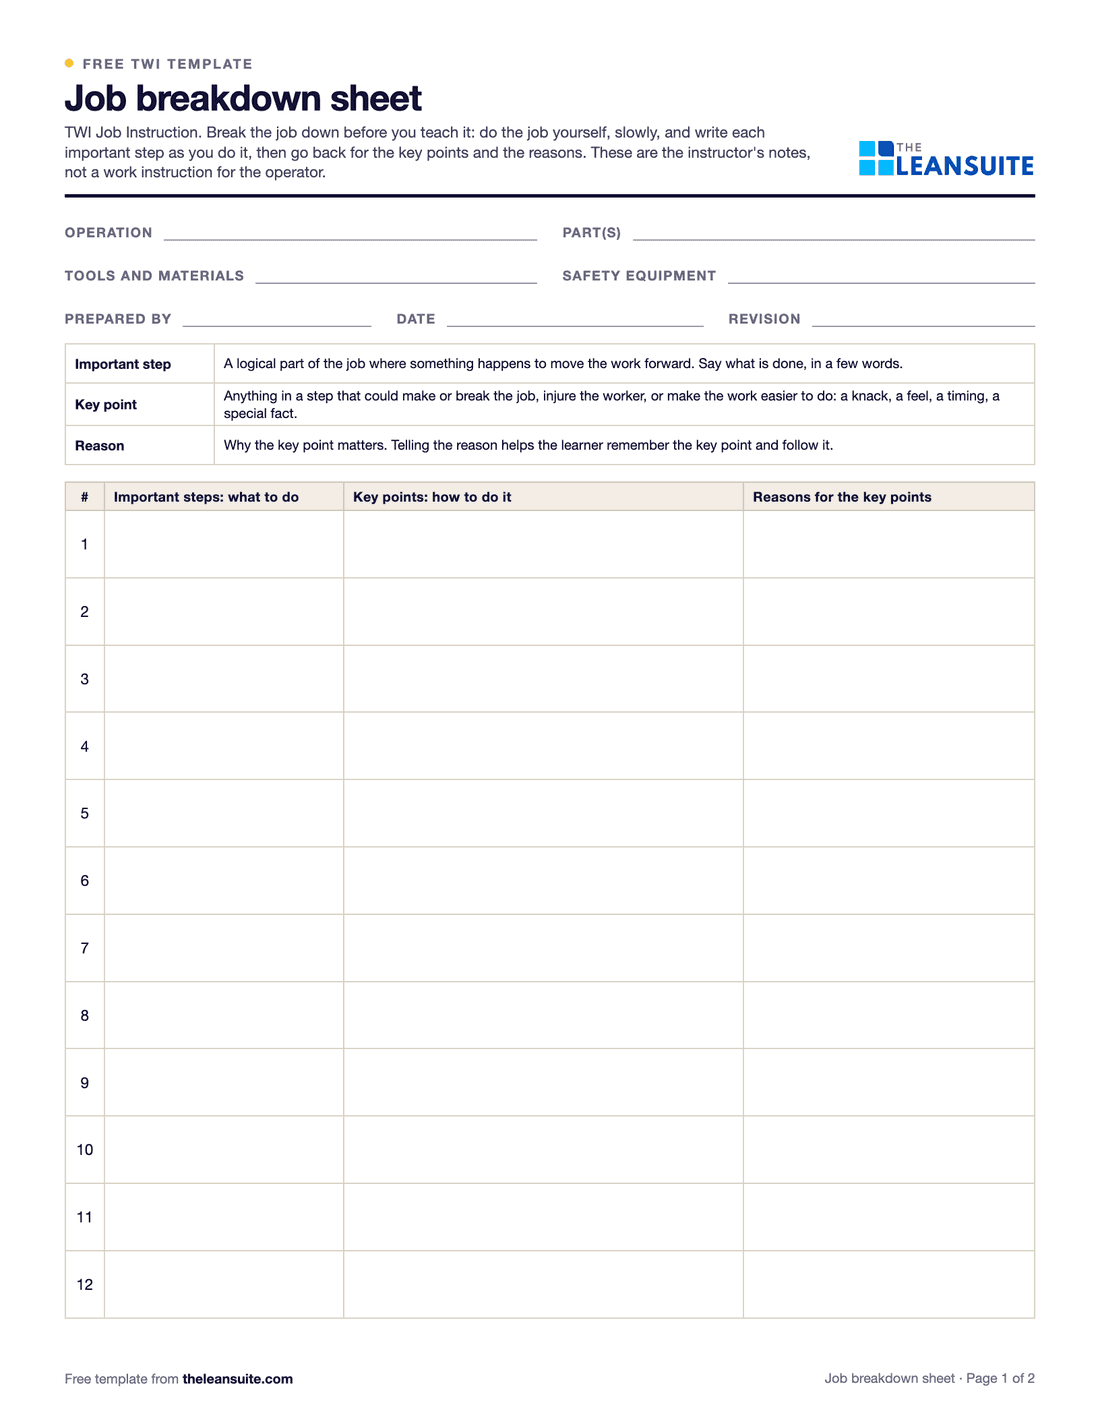 PDF and ExcelTWI job breakdown sheetThe TWI Job Instruction breakdown of a job into important steps, key points and reasons, with a worked example and the four steps.
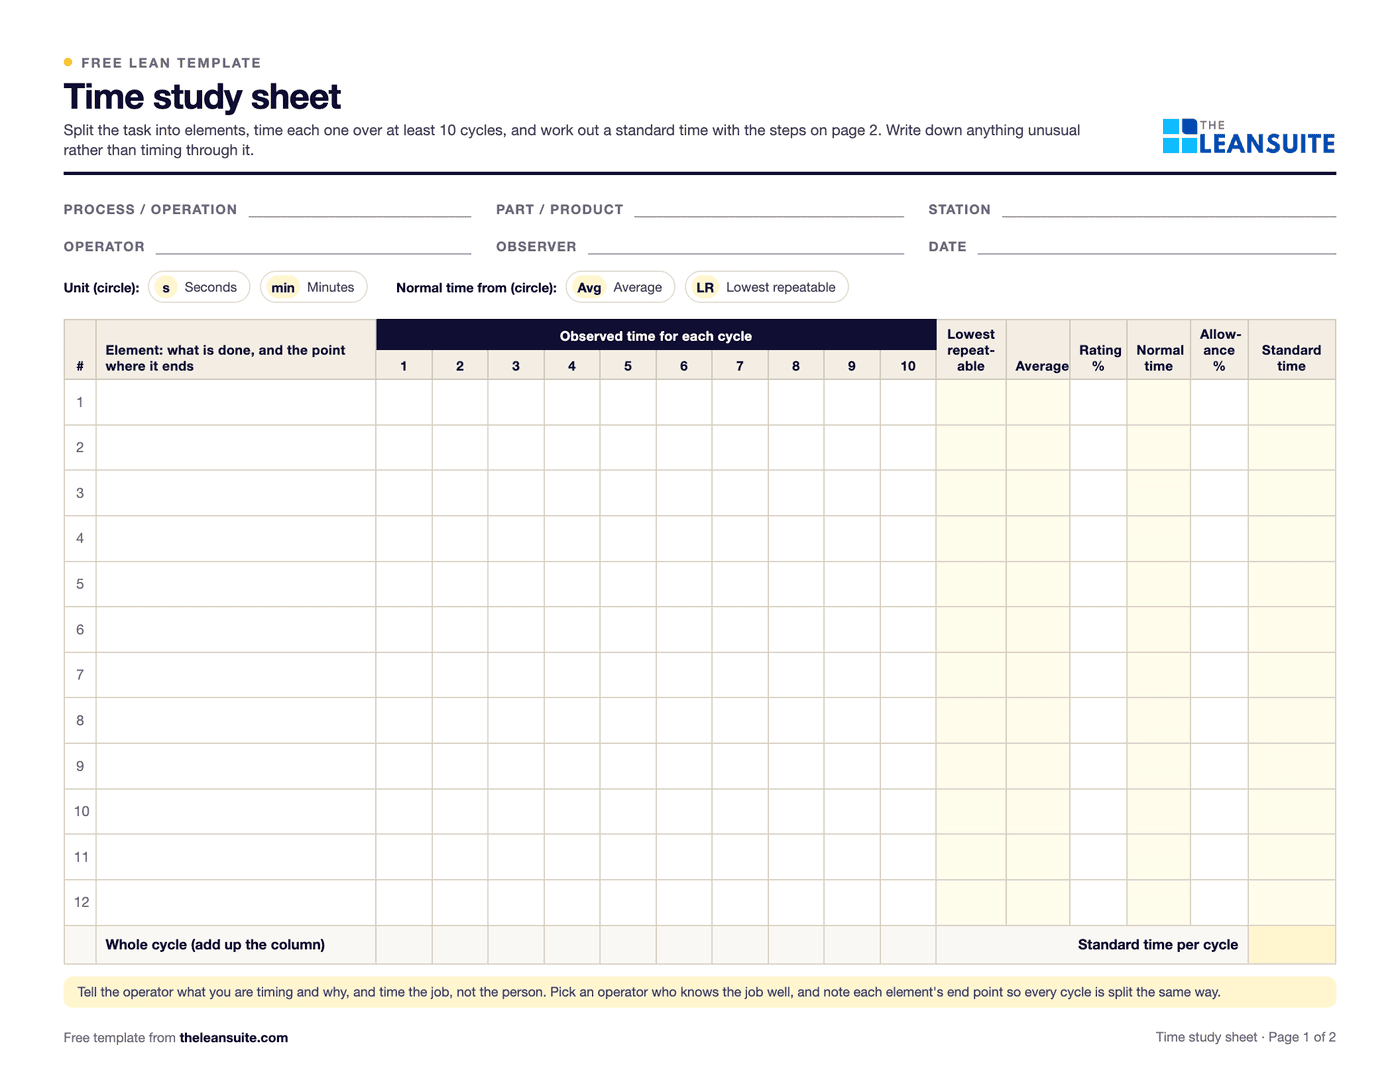 PDF and ExcelTime study sheetTime each element over 10 cycles and work out the average, lowest repeatable and standard time. Excel does the sums.
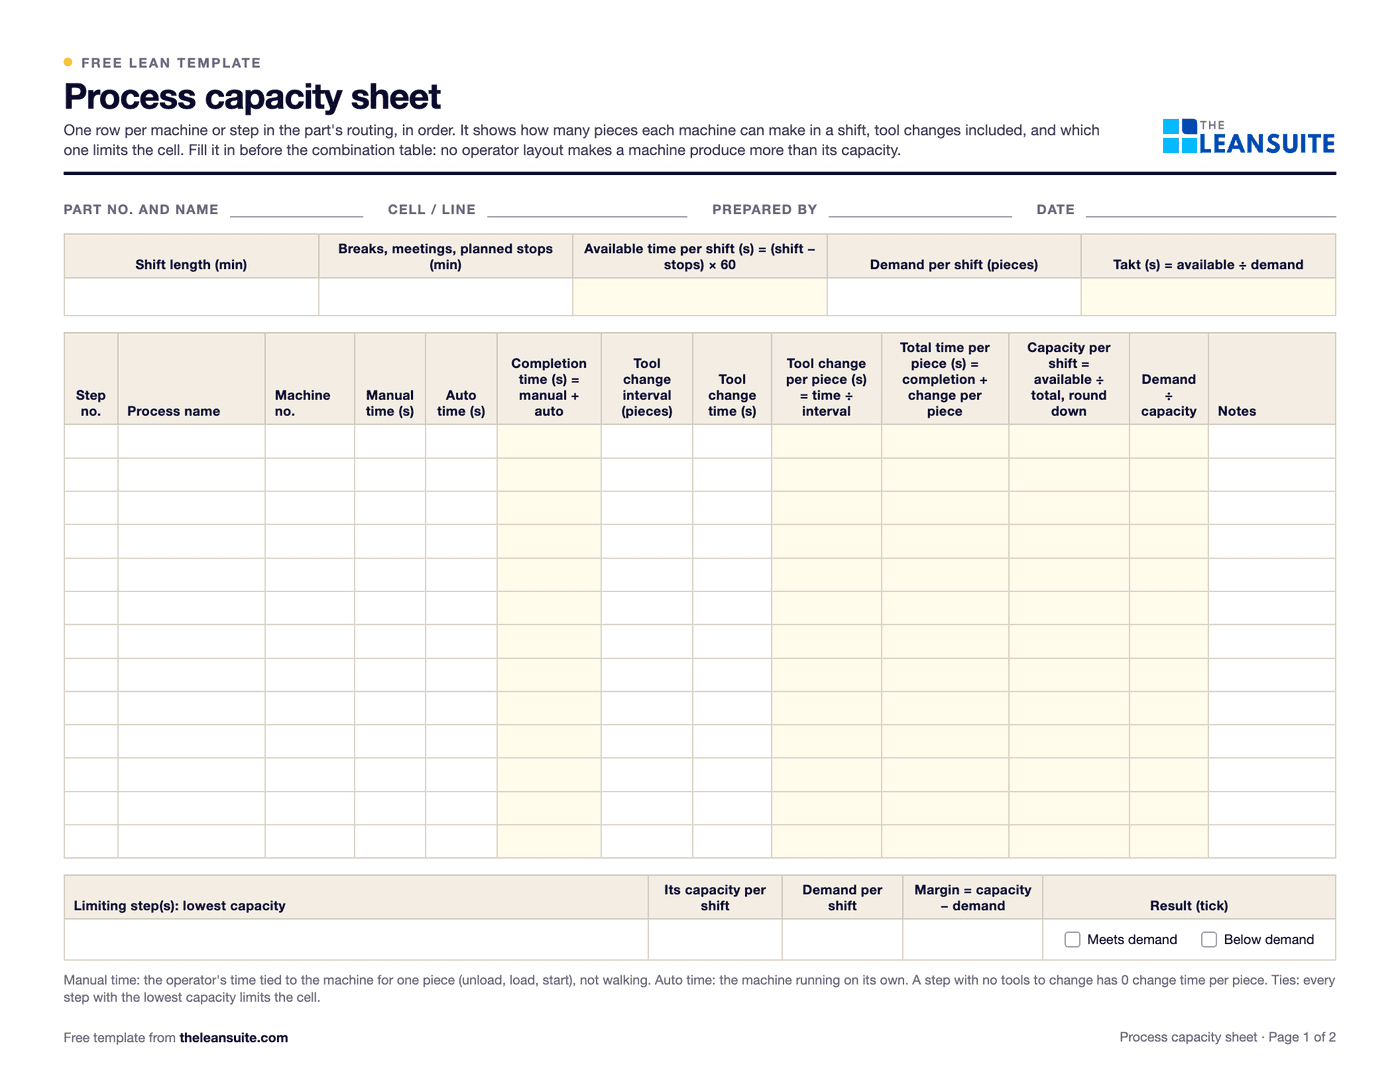 PDF and ExcelProcess capacity sheet templateEach machine in a part's routing with manual, auto and tool change time, its capacity per shift, and the step that limits the cell against demand.
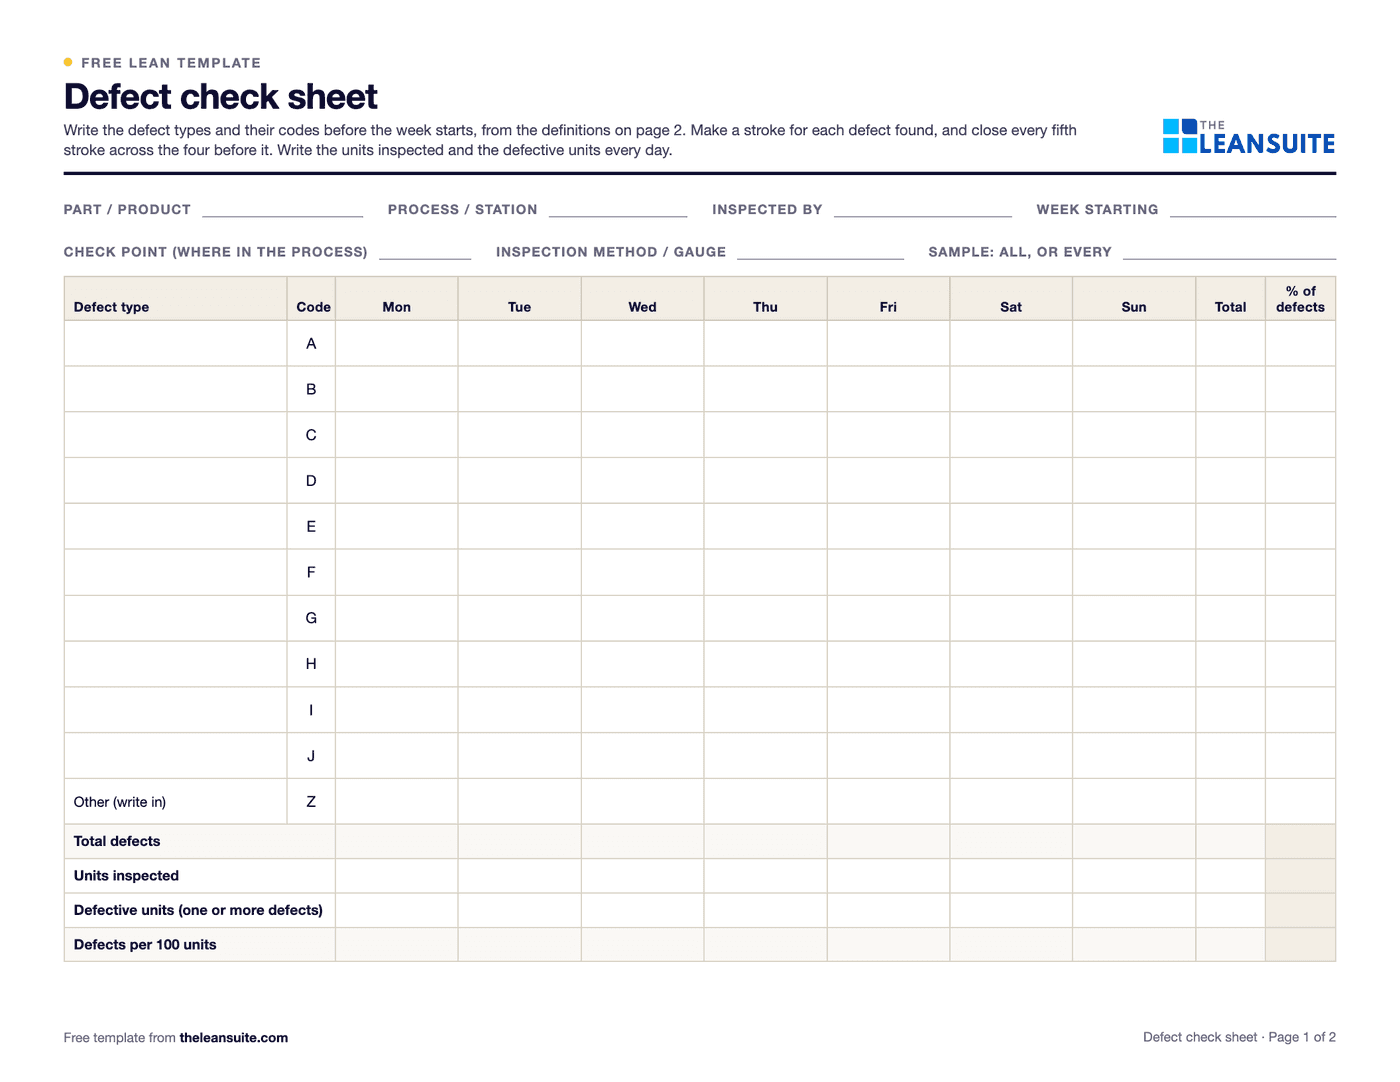 PDF and ExcelDefect check sheetTally defects by type and day, with units inspected, defect rates, a location sheet and the week's Pareto.
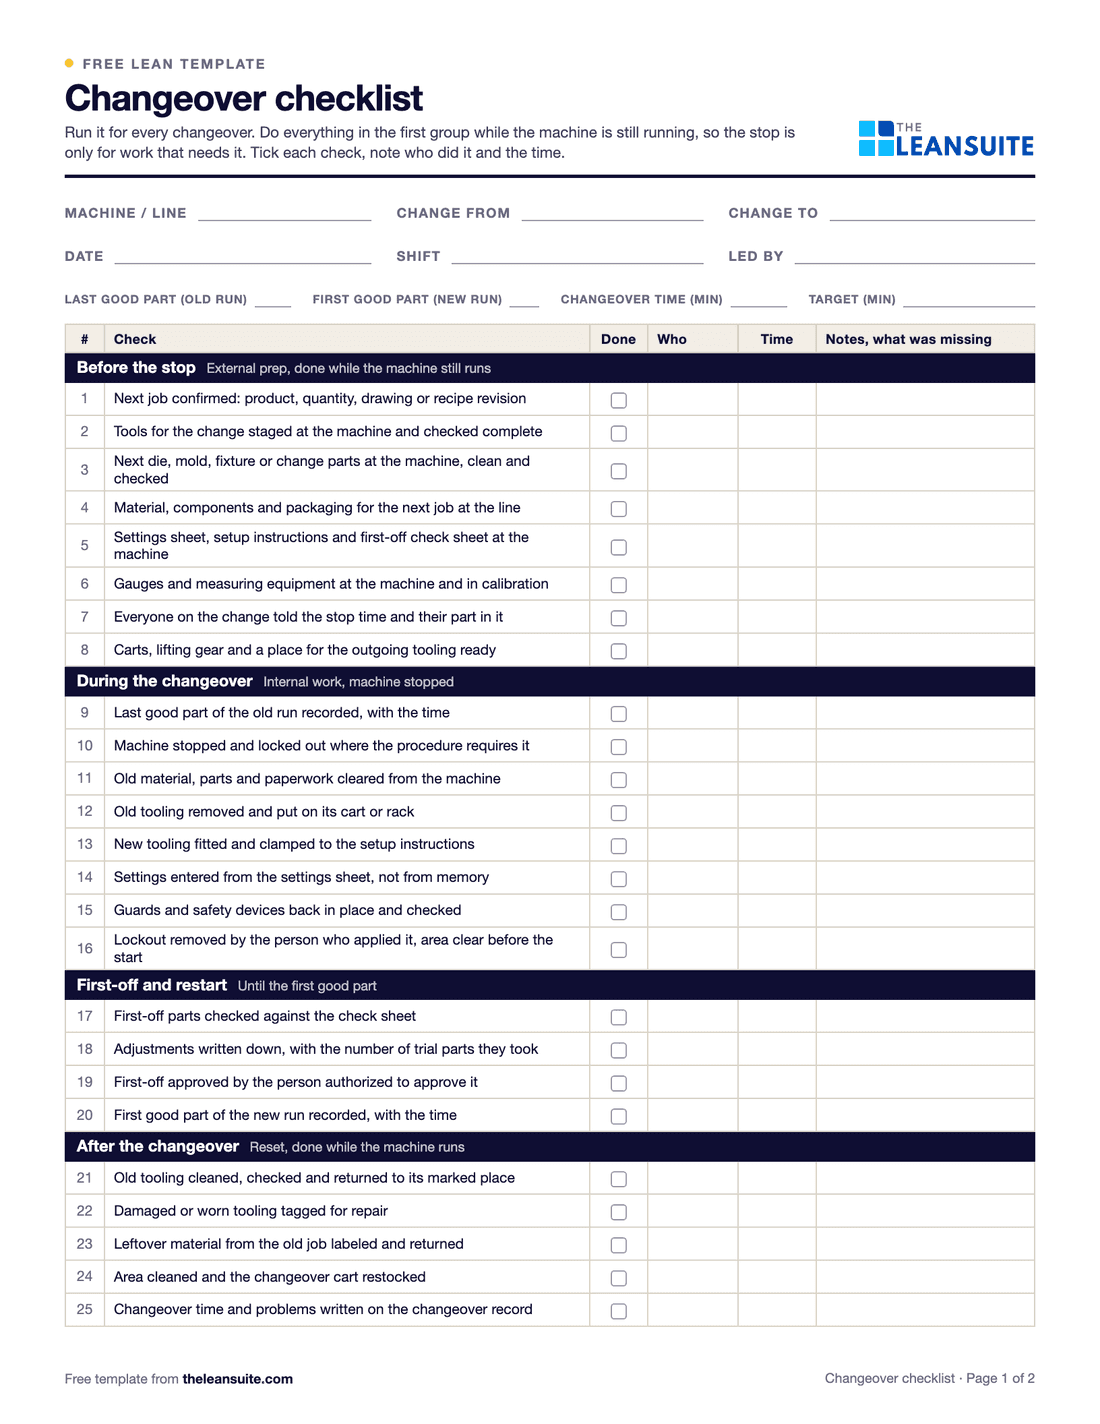 PDF and ExcelChangeover checklist25 checks for every changeover, a record of planned and actual times, and a log of changeover time against target.
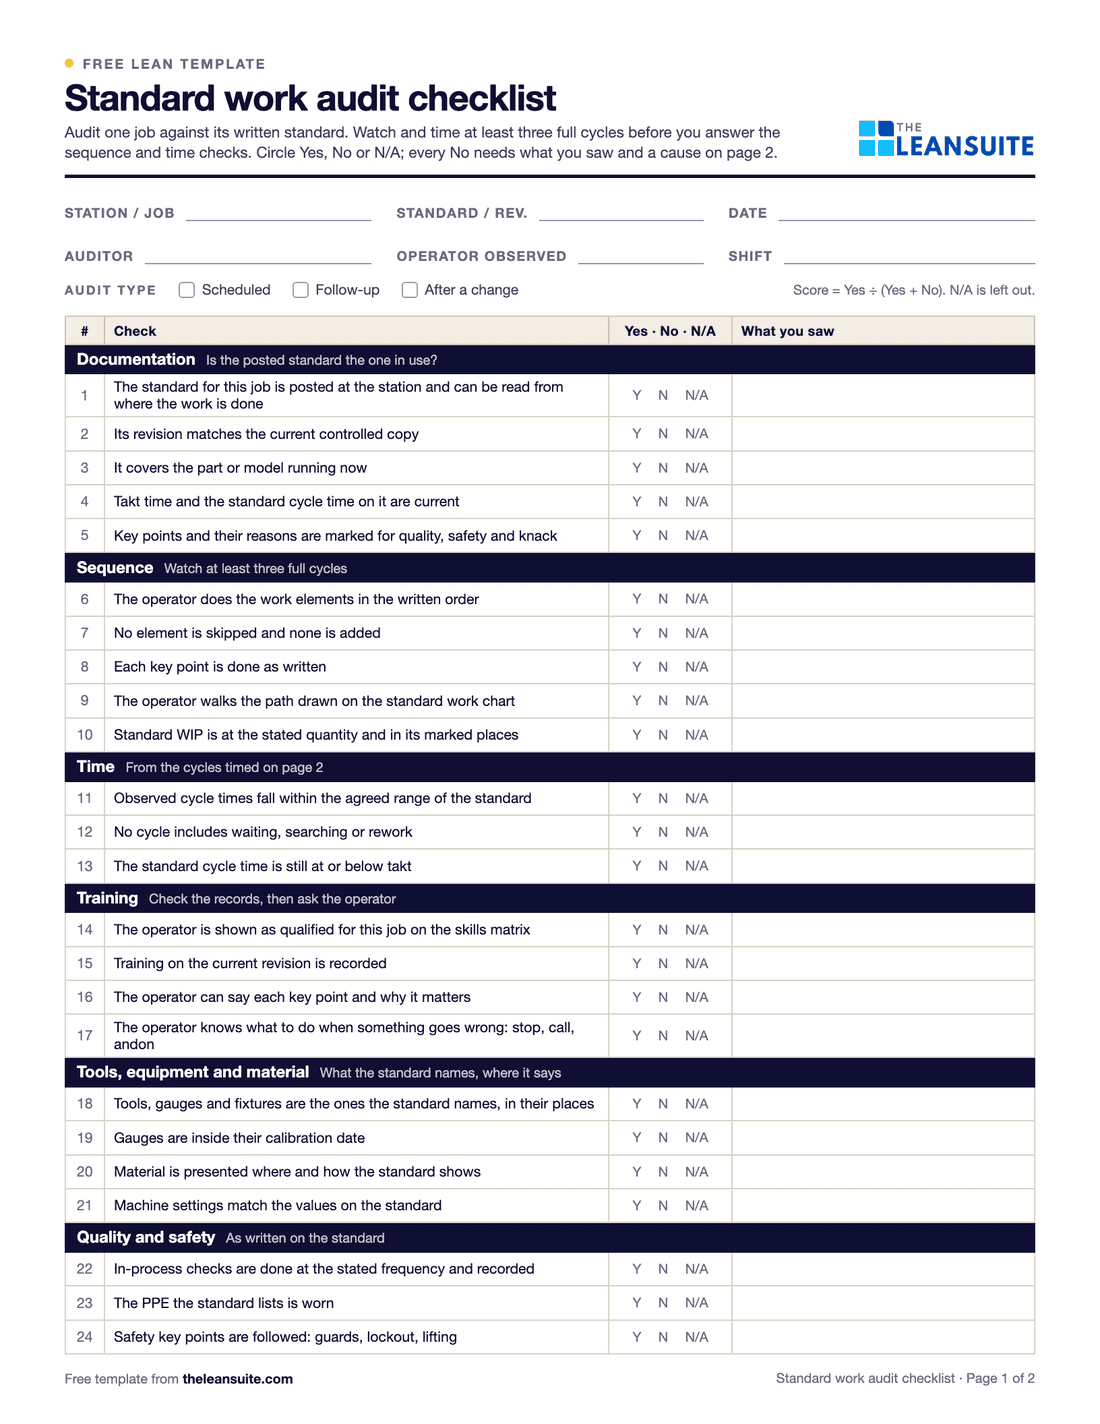 PDF and ExcelStandard work audit checklist24 checks of a job against its written standard, ten timed cycles, and each gap sorted by cause before anyone acts.
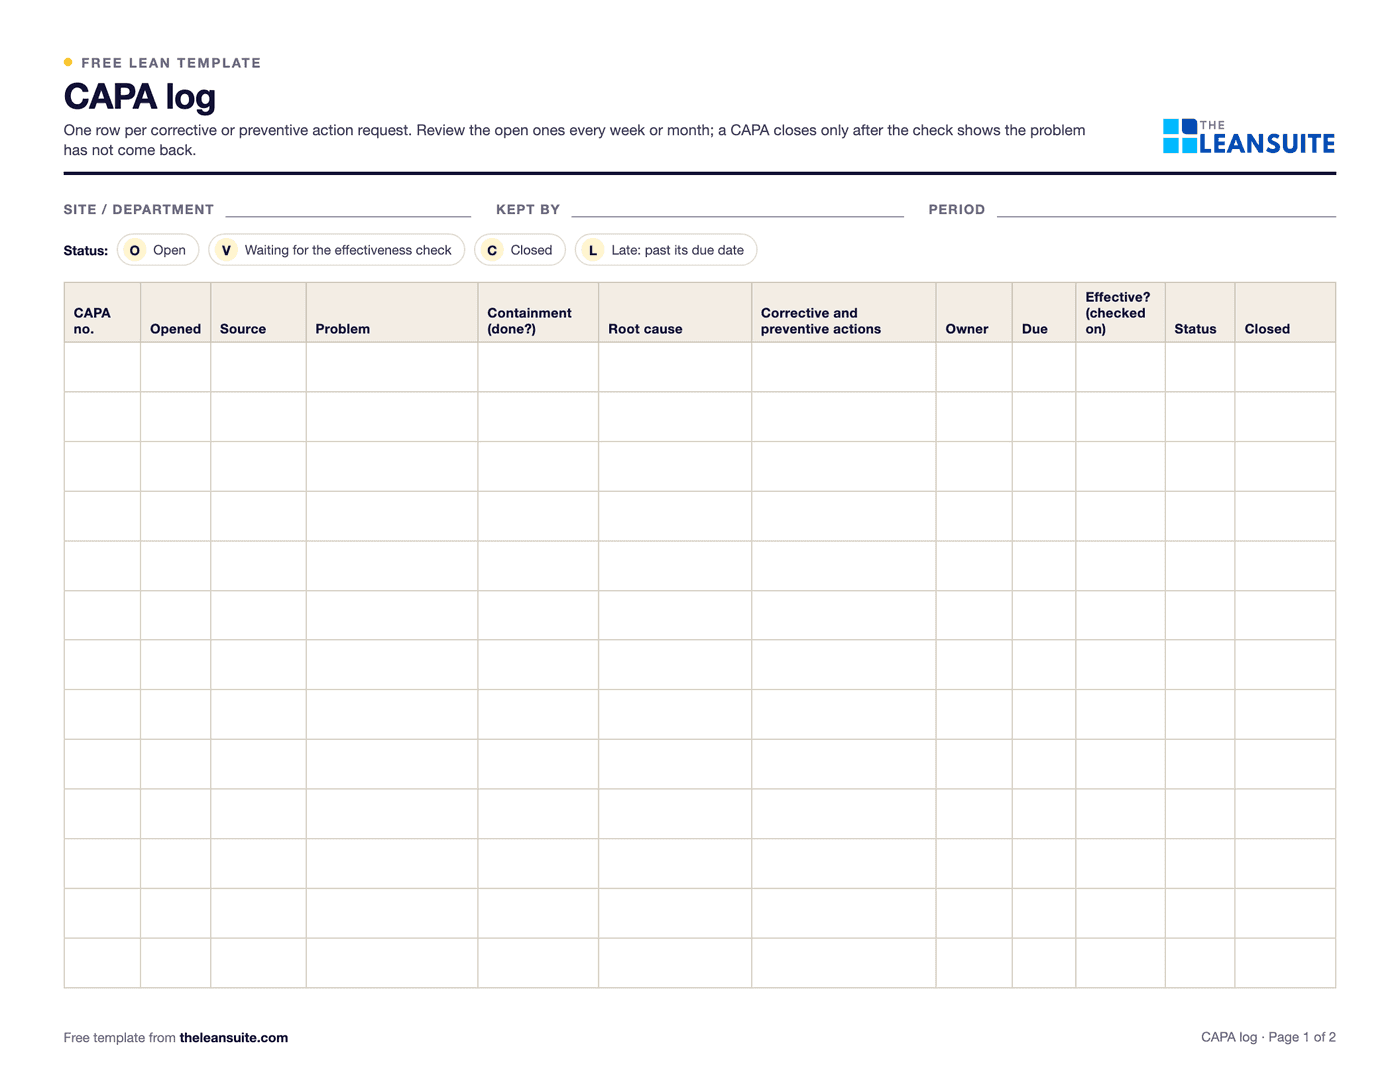 PDF and Excel and WordCAPA log templateAn Excel CAPA tracker with status, days open, late flags and counts by source, plus a printable log and monthly review.
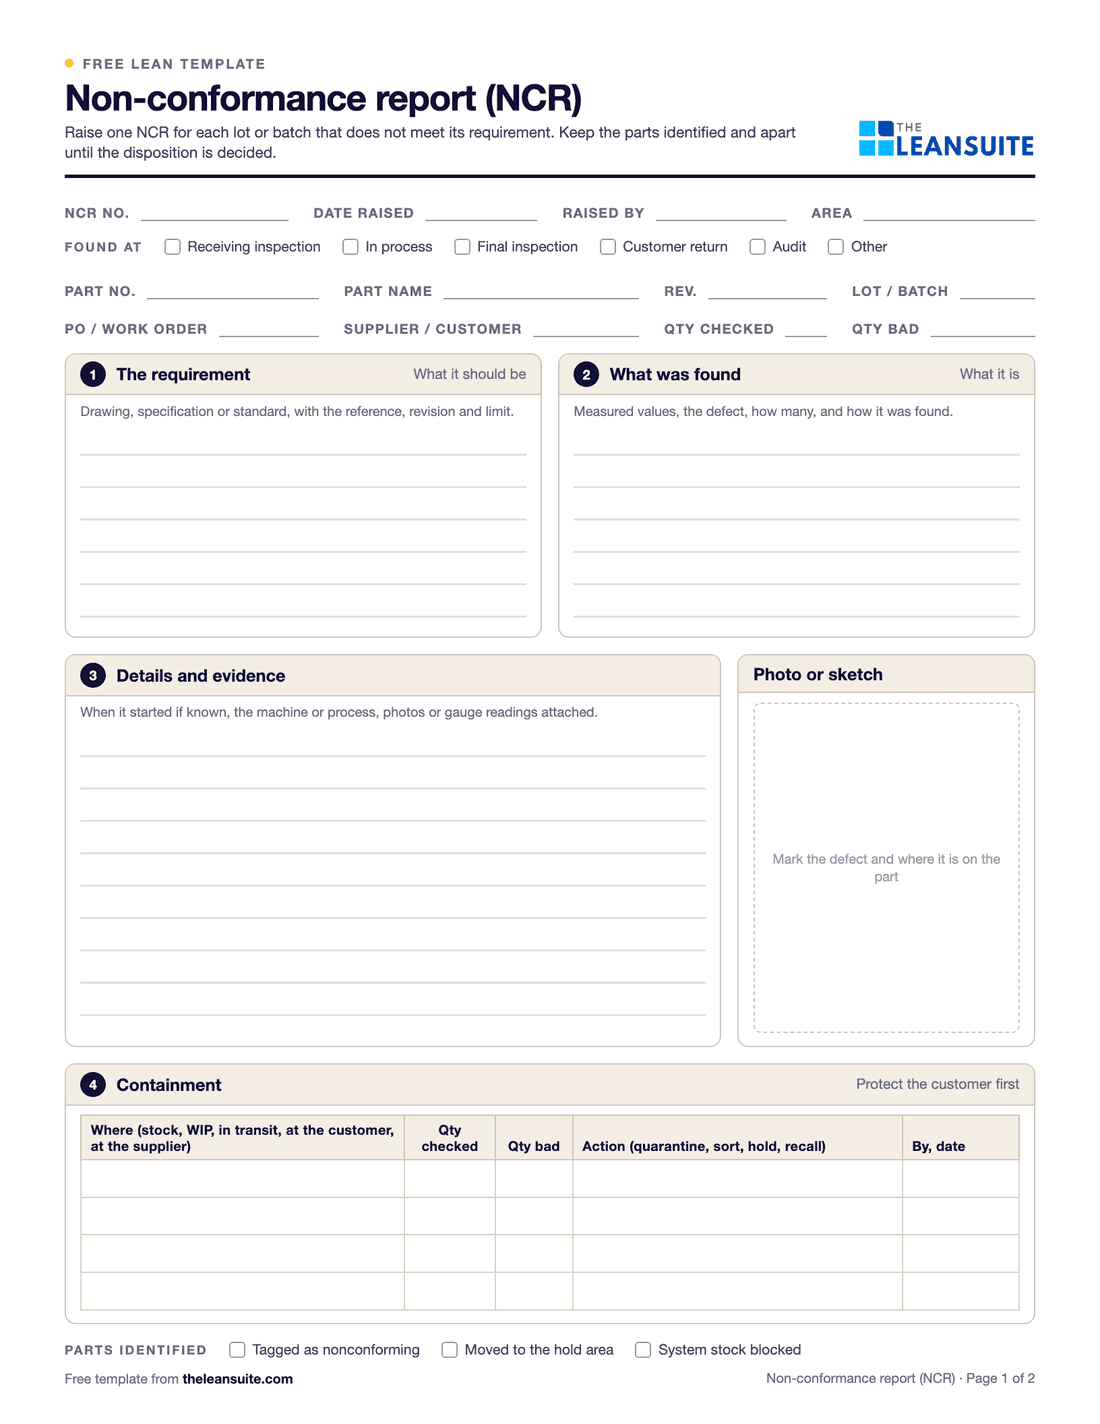 PDF and Excel and WordNon-conformance report (NCR) formA two-page NCR from the requirement against what was found to disposition and closure, and an Excel NCR log.
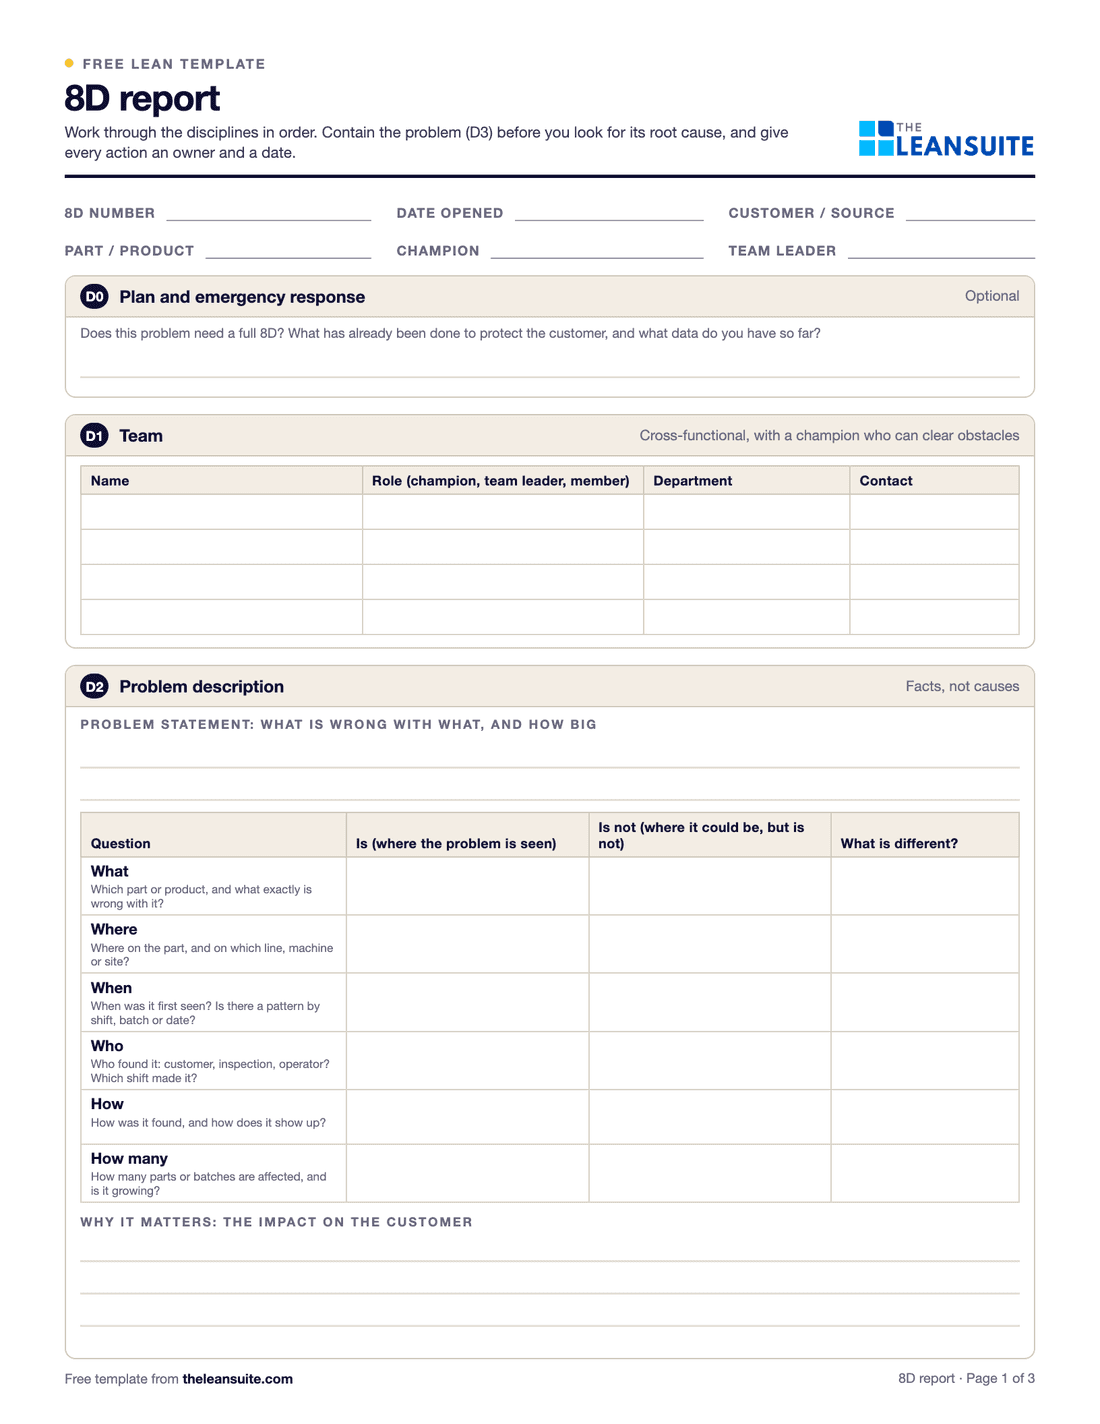 PDF and Excel and Word8D report templateD0 to D8 with targets, containment counts, occurrence, escape and systemic causes, verified actions and a worked example.
 PDF and ExcelSkills matrix templatePeople by tasks on a 0 to 4 scale, coverage and gaps per task and shift, and a training plan that closes them.
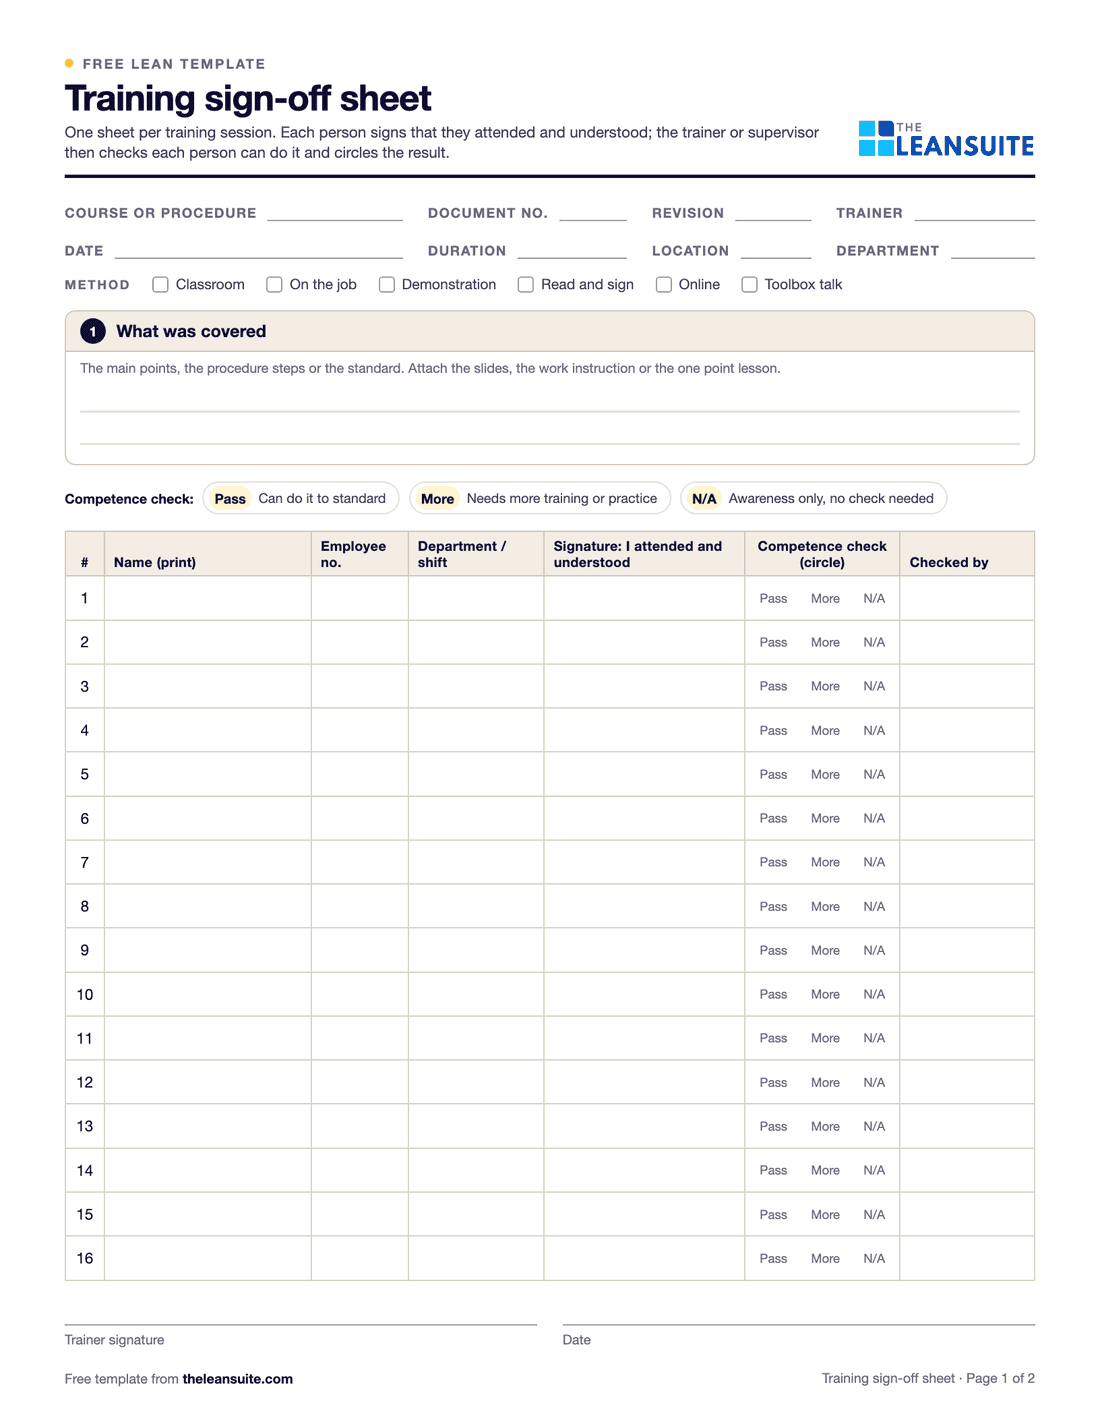 PDF and ExcelTraining sign-off sheetAn attendance and sign-off record where each person signs they understood, with a competence check and an Excel log.
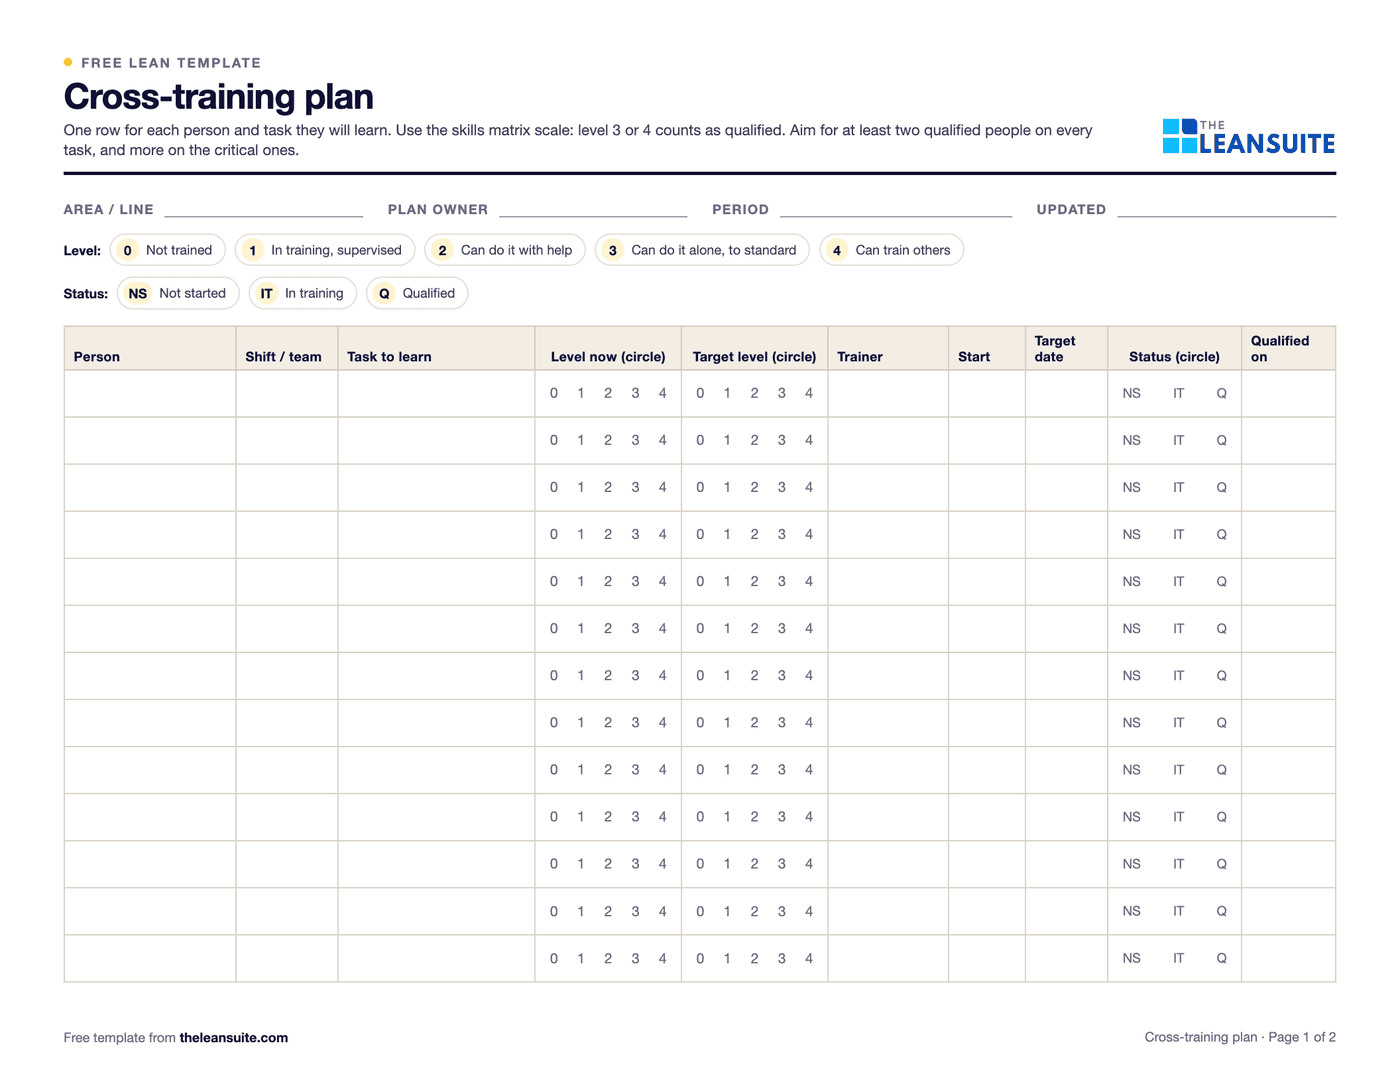 PDF and ExcelCross-training plan templateWho is learning which task, from and to which level, by when, and how many are qualified on each task.
Calculators (6)
- Free calculatorProcess capability (Cp, Cpk) calculatorCp and Cpk against your specification limits, plus Pp and Ppk from pasted measurements, with a distribution chart.
- Free calculatorScrap rate calculatorScrap rate, the cost of scrap per period and per year, and what reaching a target rate would save.
- Free calculatorLine balancing calculatorLine efficiency, balance delay and the minimum number of stations from station times and takt.
- Free calculatorTakt time calculatorThe pace a line must hit to meet customer demand, from shift time, breaks and daily demand.
- Free calculatorFirst pass yield (FPY) calculatorFirst pass yield at each step and rolled throughput yield (RTY) across the whole process.
- Free calculatorCost of poor quality (COPQ) calculatorTotal COPQ and cost of quality, and each as a share of revenue, from the four quality cost categories.
Buyer's guides
LeanSuite pages for these problems
- Non-Conformance (NCR)
- Corrective Action Log
- Digital Work Instructions
- AI SOPs
- Competency Management
- Job Cover Matrix
- Audit Management
- Checklists
- Cost of Poor Quality
- Quality Prioritization Matrix
- Line Balancing
- AI Video Analysis
How LeanSuite handles each of these is on the page for medical device plants.
Whirlpool tackled project visibility and continuous improvement across 14 manufacturing plants with LeanSuite. Read the Whirlpool case study.
FAQ
Lean in medical device plants: common questions
Yes. Lean removes waiting, rework and scrap, and a quality system asks for the same: controlled processes, fewer nonconformities, and corrective action that works. Changes to a validated process go through your change control, so agree the route with quality before you start.
With yield. Measure first-pass yield at every step of one product line for two weeks, multiply the steps to get rolled throughput yield, and fix the step that loses the most. Error-proofing the worst assembly step is often the fastest win.
Keep CAPA for systemic problems and handle one-off issues with a correction. Give each CAPA an owner and a due date, review open ones weekly, and close each one only after checking that the action worked.
Rolled throughput yield, NCRs per 1,000 units, CAPA cycle time, scrap cost, balance efficiency on manual cells and qualified coverage per shift. Track them per product line, and review them at a short daily meeting.
See LeanSuite on your assembly floor
Bring the routine you want to fix first. We will show you how LeanSuite handles it and what a 90-day pilot would cover.