

Lean playbook · Plastics and injection molding
Lean playbook for plastics and injection molding plants
Short answer
Lean in a plastics and injection molding plant starts with the mold change and the process window. Cut mold change time with SMED so short runs pay, and lock a documented process for each mold so defects such as short shots, flash and sink stop coming back. Operators care for presses, dryers and chillers every shift, purge and regrind get a cost, and setup skills spread beyond a few technicians. Measure OEE per press, scrap rate and mold change time before and after.
Last updated:
7 problems on the floor, and the lean methods for each
Each problem says what it looks like, which methods address it, the first moves to make and the number to watch. Pick the one or two that cost your plant most; you do not need all of them at once.
Where an injection molding cell loses time and quality
Resin drying and handling
Trim, assembly and decoration
Inspect and pack
Across the whole line
Long mold changes and startup scrap
The press stops while the old mold comes out, the next one is found, hung, plumbed and heated, and the process is dialed in until a part passes. Many of those steps could happen while the press still runs, and the first shots after every change go in the scrap bin.
In LeanSuite
Run each mold change as a digital checklist in Lean Creator, and Issue Management flags missing items.
First moves
- Film one mold change on the busiest press and list every step with its time, from the last good part to the first approved part.
- Move everything you can outside the stop: preheat the next mold, dry the material and stage the cart, hoses, clamps and tools before the press stops.
- Shorten the steps left inside the stop with quick couplings, standard clamp heights and a fixed first-shot approval routine.
Number to watch: Mold change time from last good part to first good part, and startup scrap per change.
Defects that come and go: short shots, flash, sink and splay
A run starts clean, then short shots, flash or sink marks appear on second shift. Someone nudges a pressure or a temperature to chase it, the defect moves, and the settings that made good parts are no longer written down anywhere.
Lean methods
In LeanSuite
Issue Management logs each defect where it is found, the QA Matrix costs and ranks it, and Kaizen & Projects runs the root-cause project.
First moves
- Record a documented process sheet for each mold on each press: barrel and mold temperatures, injection speed and pressure, transfer point, hold, cooling time and cushion.
- Check cushion and shot weight every shift; a cushion that drifts warns of a worn check ring or a feed problem before parts go bad.
- When a defect appears, compare the press with the sheet before changing anything, and run a root-cause analysis on any defect that comes back.
Number to watch: Scrap rate per mold, and customer defects per million parts shipped.
Press, dryer, chiller and robot stops
Heater bands fail, water lines block, a dryer stops reaching its dew point, a robot gripper misses a part. The long breakdowns get logged, but the short robot, conveyor and granulator stops never reach a report.
Lean methods
In LeanSuite
Operators log each minor stop in one tap with its category, duration and cause, and Cost Management adds the stops up into a costed loss tree per machine.
First moves
- Write a clean, inspect and lubricate routine for each press and its auxiliaries: hydraulic oil level and temperature, water flow at the mold, heater bands, dryer dew point, robot grippers and vacuum.
- Log every stop with a reason code, and count the short stops on one press for a week.
- Fix the top stop cause on each press and add the check that would have caught it.
Number to watch: OEE per press, and mean time between failures for presses and auxiliaries.
Wet resin and material mix-ups
Resins such as nylon, PET, polycarbonate and PBT pick up moisture and must be dried before molding. A dryer with spent desiccant, a hopper that ran low or the wrong material in a loader shows up later as splay, brittle parts or a whole lot on hold.
Lean methods
In LeanSuite
Digital CILR checklists put each press's clean, inspect, lubricate and retighten routine on the operator's Daily Standard Work, and operators flag an abnormality with a photo without leaving the checklist.
First moves
- Check and log dryer temperature, dew point and drying time each shift against the resin data sheet.
- Label every loader, hopper and line with the material and color it carries, and treat a material change as a checked step with a second sign-off.
- Post the regrind limit for each part at the press and record how much regrind goes in.
Number to watch: Lots held or scrapped for moisture or material problems.
Purge, regrind and resin lost to scrap
Every color or material change makes purge and startup shots, and rejects pile up in a gaylord beside the press. Some goes back as regrind, the rest is sold off or thrown away, and nobody knows which mold or change costs the most resin.
In LeanSuite
Import your loss data and LeanSuite builds a loss tree that puts a cost on each loss, then tracks the savings as you remove them.
First moves
- Weigh purge and startup scrap per change for two weeks, by mold and by material.
- Plan the color and material sequence with a changeover matrix: light to dark, and between compatible materials.
- Put a cost on purge, scrap and regrind per mold, and work on the most expensive first.
Number to watch: Resin lost to purge and scrap each month, in kilograms and in cost.
Setup skills held by a few technicians
Hanging molds, setting a process and teaching a robot take years to learn, and a few process technicians cover every shift. When one is off, molds wait for days shift, or run on settings nobody else understands.
In LeanSuite
LeanSuite keeps a live skills matrix: people qualify through training and digital sign-offs, and gaps show up before they cost you a shift.
First moves
- Build a skills matrix for mold hanging, process setting, robot teaching and troubleshooting, by shift.
- Write a job breakdown for hanging and starting a mold with your best technician, with the key points and the reason for each.
- Pair a trainee with a technician on every shift until each critical skill has at least three people.
Number to watch: Setup skills with fewer than three qualified people per shift.
Reaching into the mold, hot molds and robot cells
Stuck parts tempt operators to reach past the gate, mold changes put people next to hot molds and heavy loads, and robots move fast inside their cells. Interlock checks are skipped when they are not written down, and lockout steps for hydraulics and hot runners go out of date.
Lean methods
In LeanSuite
Lean Creator runs lockout procedures as photo-verified isolation steps, and only trained, authorized people can start a lockout.
First moves
- Check press gate interlocks, robot cell guarding and emergency stops at the start of every shift.
- Write a lockout procedure for each press with a photo of every energy source: electrical, hydraulic, heat from barrel and hot runner, and stored pressure.
- Report near misses at the mold area, and fix the reason people reach in, such as parts that stick.
Number to watch: Guard and interlock check findings closed, and near misses reported and closed.
More small fixes in the production, quality and maintenance sections of the kaizen idea bank.
Injection molding defects: causes and what to check first
Most injection molding defects come from four places: the material, the mold, the machine and the process settings. Before you change a setting, compare the press with the documented process for that mold. Many defects are drift from the sheet, and chasing them by changing settings makes the next run harder.
Short shot
- What it looks like
- The part is not completely filled: a missing corner, rib end or thin section.
- Usual causes
- Too small a shot, low injection pressure or speed, a cold melt or mold, blocked gate or vents, a worn check ring.
- Check first
- Cushion and shot size against the process sheet. A cushion near zero means the screw is bottoming out.
Flash
- What it looks like
- A thin film of plastic at the parting line, around ejector pins or at slides.
- Usual causes
- Clamp force too low for the part, a worn or damaged parting line, debris on the mold face, too much pack pressure or too hot a melt.
- Check first
- The mold faces for debris and damage, then clamp tonnage and pack pressure against the sheet.
Sink marks
- What it looks like
- Shallow dents on the surface, often opposite ribs, bosses or thick sections.
- Usual causes
- Too little pack or hold pressure or time, a gate that freezes too early, thick walls, a hot spot in the mold.
- Check first
- Hold pressure and hold time, and whether the gate freezes before the part is packed.
Voids
- What it looks like
- Bubbles or empty pockets inside thick sections, seen in clear parts or when a part is cut open.
- Usual causes
- The same as sink when the skin is already rigid: low pack, early gate freeze. Moisture can add to it.
- Check first
- Pack and hold settings, then the drying record for the lot.
Warpage
- What it looks like
- The part twists or bows after ejection and does not sit flat.
- Usual causes
- Uneven cooling, uneven wall thickness, fiber or molecular orientation, ejecting the part too hot.
- Check first
- Mold temperature on both halves and water flow on each circuit, then cooling time.
Splay (silver streaks)
- What it looks like
- Silvery streaks on the surface, pointing in the direction of flow.
- Usual causes
- Moisture in the resin most often, also trapped air or material degraded by heat.
- Check first
- Dryer temperature, dew point and drying time against the resin data sheet.
Burn marks
- What it looks like
- Black or brown scorch marks, often at the end of fill or in deep corners.
- Usual causes
- Air trapped and compressed at the end of fill because vents are blocked or too small, or injection that is too fast.
- Check first
- Clean the vents where the burn shows, then the injection speed at the end of fill.
Weld lines (knit lines)
- What it looks like
- Visible lines where two flow fronts meet, often around holes. The part can be weak there.
- Usual causes
- Flow fronts too cold when they meet, low injection speed or pressure, poor venting at the meeting point.
- Check first
- Melt and mold temperature, injection speed, and the vent nearest the line.
Flow lines
- What it looks like
- Wavy lines or rings near the gate or across thin sections.
- Usual causes
- Melt cooling as it flows because injection speed, pressure or temperature is too low.
- Check first
- Injection speed and melt temperature against the sheet.
Jetting
- What it looks like
- A snake-like squiggle on the surface that starts at the gate.
- Usual causes
- Melt shot through a small gate into open space too fast, before it touches a wall.
- Check first
- Slow the start of injection. For a lasting fix, change the gate position or size.
Black specks and contamination
- What it looks like
- Dark specks or foreign particles in the part, worst in clear and light colors.
- Usual causes
- Degraded material hanging up in the barrel or hot runner, dirty regrind or loaders, poor purging.
- Check first
- Purge practice and regrind cleanliness, then how long material sits in the barrel.
Sticking and ejector marks
- What it looks like
- Parts stay in the cavity, or show raised or white marks at the ejector pins.
- Usual causes
- Too little cooling, too much pack pressure, poor draft or polish, ejection that is too fast.
- Check first
- Cooling time and pack pressure, then ejector stroke and speed.
Brittle parts
- What it looks like
- Parts crack or snap at assembly or in testing.
- Usual causes
- Wet resin, material degraded by high temperature or long time in the barrel, too much regrind.
- Check first
- The drying record, melt temperature and the regrind ratio.
General guidance for thermoplastics. Your resin supplier's data sheet and your own documented process come first, and on automotive or medical parts a process change may need your customer's approval before it runs.
A 90-day starting plan
One line or product family, two problems, measured before and after. The point of the first 90 days is a result the plant believes and a method it can repeat, not a plant-wide program.
The 90 days, with the gate that ends each stage
- Days 1 to 30Measure one pressDone when: You have two weeks of OEE, mold change time and scrap for the press, and two problems with owners.
- Days 31 to 60Cut the mold change and lock the processDone when: Mold change time and scrap each have a before-and-after number and a written standard.
- Days 61 to 90Hold the gains and spread themDone when: The gains have held for a month and the next press has its baseline.
Days 1 to 30
Measure one press
See where one press loses time, parts and resin.
- Choose the press that holds up the most orders, and name an owner.
- Record OEE by shift with a reason code for every stop.
- Film one mold change and list its steps and times.
- Collect every defect for two weeks in a defect catalogue with photos, by mold.
- Choose the two biggest losses to work on first.
Days 31 to 60
Cut the mold change and lock the process
Attack the two losses and prove the change with numbers.
- Move the mold change steps you can outside the stop, and run the new sequence from a checklist.
- Write the process sheet for the press's main molds and check cushion and shot weight every shift.
- Start a daily care routine on the press, dryer and chiller.
- Set a first-shot approval routine so good parts start sooner after each change.
Days 61 to 90
Hold the gains and spread them
Keep the new standards, protect the skills and start the next press.
- Audit the mold change checklist and the process sheets on every shift.
- Build the setup skills matrix and start cross-training on skills fewer than three people hold.
- Sequence colors and materials with a changeover matrix.
- Share the results and measure the next press.
The KPIs to track
Track them per line and shift, on a board the team sees every day. Set targets from your own baseline, not from someone else's plant.
| KPI | What it tells you | How to measure it | Free help |
|---|---|---|---|
| OEE per press | How much of the planned time the press makes good parts at the standard cycle. | Availability times performance times quality. Performance uses the standard cycle and the cavities running; quality counts good parts against all parts made. | OEE calculatorOEE tracking sheet |
| Mold change time | How long the press makes no good parts during a change. | From the last good part of one job to the first approved part of the next, for every change. | SMED changeover calculatorSMED changeover worksheet |
| Scrap rate | The share of parts and resin thrown away or sold off. | Rejected parts divided by all parts made, per mold, plus purge and startup scrap weighed for each change. | Scrap rate calculator |
| First pass yield | The share of parts that pass inspection without sorting or rework. | Parts passing first time divided by parts inspected, per mold. | First pass yield (FPY) calculator |
| Cycle time against standard | Whether presses run at the cycle the job was quoted at. | Average actual cycle from the press counter against the standard cycle on the process sheet, per mold. | Cycle time calculator |
| MTBF and MTTR | How often presses and auxiliaries fail and how long repairs take. | Run time divided by the number of failures, and total repair time divided by the number of repairs, for each press, dryer, chiller and robot. | MTBF and MTTR calculator |
| Process capability on key dimensions | Whether a mold and process hold a critical dimension inside its tolerance with room to spare. | Measure the dimension on parts from every cavity across a run and compare the spread and centering with the tolerance (Cpk). | Process capability (Cp, Cpk) calculatorControl plan template |
Worked example: OEE for one molding press
One injection molding press with a 4-cavity mold, over one 24-hour day. The numbers are illustrative, chosen to show how the three OEE losses combine; use your own press data.
The calculation, step by step
Example numbersPlanned production time
24 hours is 1,440 minutes, less a 60-minute planned maintenance stop.
1,380 min
Run time
1,380 minutes, less a 90-minute mold change and 60 minutes of unplanned stops.
1,230 min
Availability
1,230 ÷ 1,380
89.1%
Performance
A 30-second standard cycle is 2 shots a minute, so 1,230 × 2 = 2,460 shots were possible. The press made 2,214 shots: 2,214 ÷ 2,460.
90.0%
Quality
2,214 shots × 4 cavities = 8,856 parts, of which 354 were rejected (startup shots and defects), leaving 8,502 good: 8,502 ÷ 8,856.
96.0%
OEE
89.1% × 90.0% × 96.0%
77.0%
Check the OEE another way
Good parts × ideal time per part ÷ planned time: 8,502 × 7.5 s ÷ 82,800 s.
77.0%
Scrap rate
354 ÷ 8,856
4.0%
If the mold change took 45 minutes instead of 90
45 more minutes of run time × 2 shots a minute × 4 cavities, at the standard cycle.
+360 parts
Standards and regulations plants work to
Molders answer to their customers' standards as much as to regulators. These are the ones most plants meet, named so you know what applies; each standard's own text sets its requirements.
ISO 9001
The quality management standard most molders are certified to: documented processes, internal audits, corrective action and training records.
IATF 16949 and PPAP
Automotive molders work to IATF 16949 and submit a production part approval package before parts ship, with a control plan, PFMEA, measurement studies and process capability for key characteristics.
ISO 13485 and FDA 21 CFR 820
Medical device molders work to ISO 13485, and the FDA's device quality rule, 21 CFR 820, has included ISO 13485 by reference since February 2026. Process validation and device records belong in a validated quality management system.
FDA food-contact rules
Food packaging and container molders use resins cleared for food contact under 21 CFR parts 174 to 178, and many also hold a packaging food safety certificate such as BRCGS Packaging Materials.
ANSI/PLASTICS B151.1
The US safety standard for horizontal injection molding machines, covering guarding, interlocks and safe operation.
OSHA machine guarding and lockout
29 CFR 1910.212 for machine guarding, and 29 CFR 1910.147 for controlling hazardous energy during setup, mold changes and maintenance.
ANSI R15.06
Safety requirements for industrial robots and robot cells, including the part-removal robots on presses.
Software does not make a plant compliant with any of these. The routines in this playbook produce the records auditors ask for: checks done, findings closed, changes approved and people trained.
By the numbers
Public figures for this industry or for the wider sector it belongs to, each linked to the report or government table it comes from and checked against it on October 9, 2026. More in our lean manufacturing statistics and benchmark charts.
2.8
Plastics and rubber products manufacturing recorded 2.8 injury and illness cases per 100 full-time workers in 2024, against 2.7 for all manufacturing.
Total recordable cases per 100 full-time workers, U.S. private industry, 2024 data from the Survey of Occupational Injuries and Illnesses. The group covers plastics and rubber products together (NAICS 326).
Source: U.S. Bureau of Labor Statistics, Table 1. Incidence rates of nonfatal occupational injuries and illnesses by industry and case types, 2024 (2024 data, table updated January 22, 2026)
16×
Plants in the top quarter for relying on reactive maintenance had 3.3 times more downtime and 16 times more defects than plants in the bottom quarter.
Same NIST survey. NIST notes the link is an association, not proof of cause.
Source: NIST, Economics of Manufacturing Machinery Maintenance: A Survey and Analysis of U.S. Costs and Benefits (NIST AMS 100-34) (June 2020)
Injury and illness rate by industry, 2024
- Motor vehicles5.6
- Beverage and tobacco3.7
- Furniture3.5
- Food3.3
- Primary metals3.3
- Nonmetallic mineral products, incl. glass3.3
- Fabricated metal products3.2
- Transportation equipment3.2
- Motor vehicle parts2.9
- Plastics and rubber products2.8This industry
- HVAC and refrigeration2.4
- Paper2.4
- Machinery2.3
- All private industry2.3
- Electrical equipment and appliances2.0
- Printing1.6
- Chemicals1.6
Total recordable cases per 100 full-time workers, 2024: Motor vehicles 5.6, Beverage and tobacco 3.7, Furniture 3.5, Food 3.3, Primary metals 3.3, Nonmetallic mineral products, incl. glass 3.3, Fabricated metal products 3.2, Transportation equipment 3.2, Motor vehicle parts 2.9, Plastics and rubber products 2.8, All manufacturing 2.7, HVAC and refrigeration 2.4, Paper 2.4, Machinery 2.3, All private industry 2.3, Electrical equipment and appliances 2, Printing 1.6, Chemicals 1.6.
Free templates, calculators and buyer's guides
Templates (21)
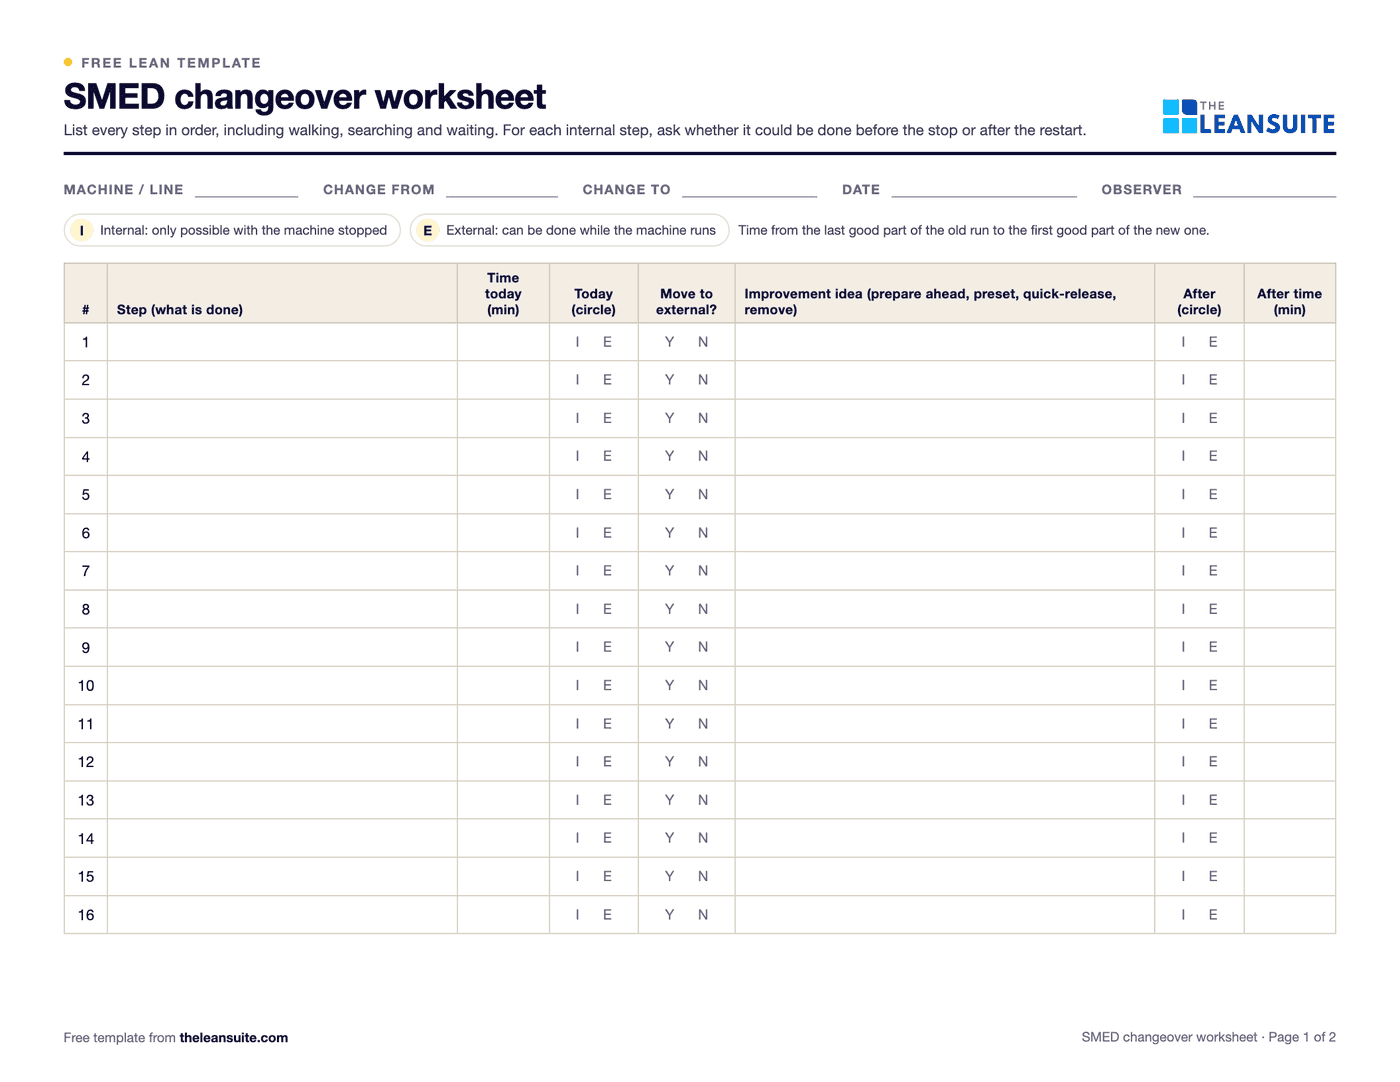 PDF and ExcelSMED changeover worksheetChangeover steps with times, internal or external, what can move, ideas and before/after totals.
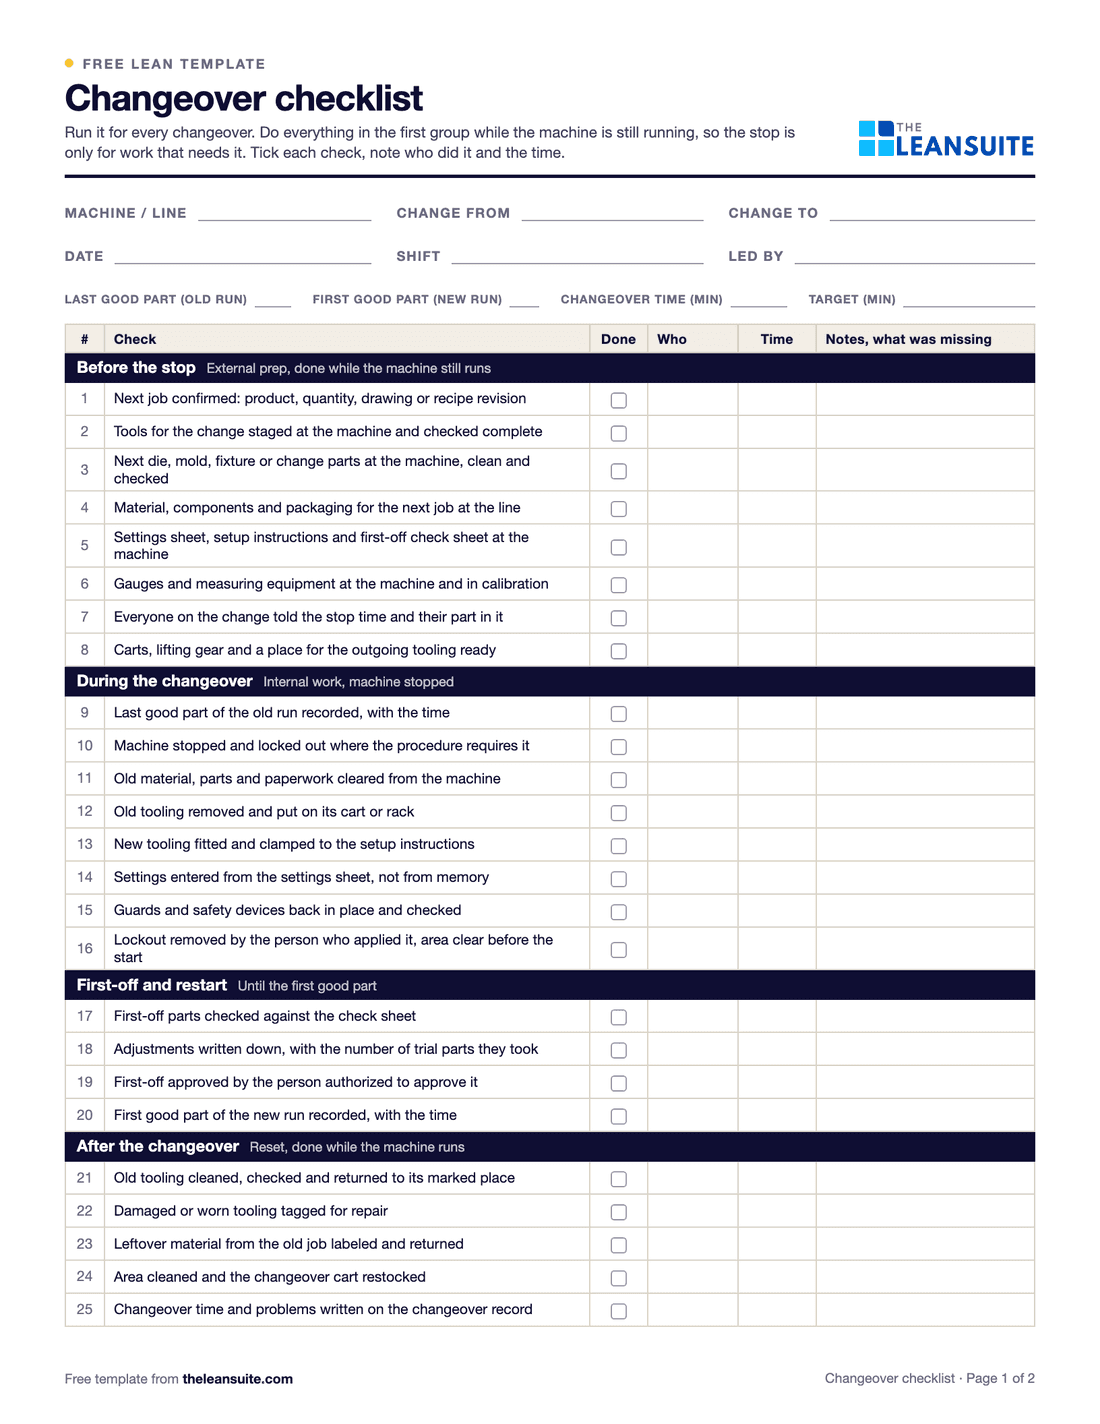 PDF and ExcelChangeover checklist25 checks for every changeover, a record of planned and actual times, and a log of changeover time against target.
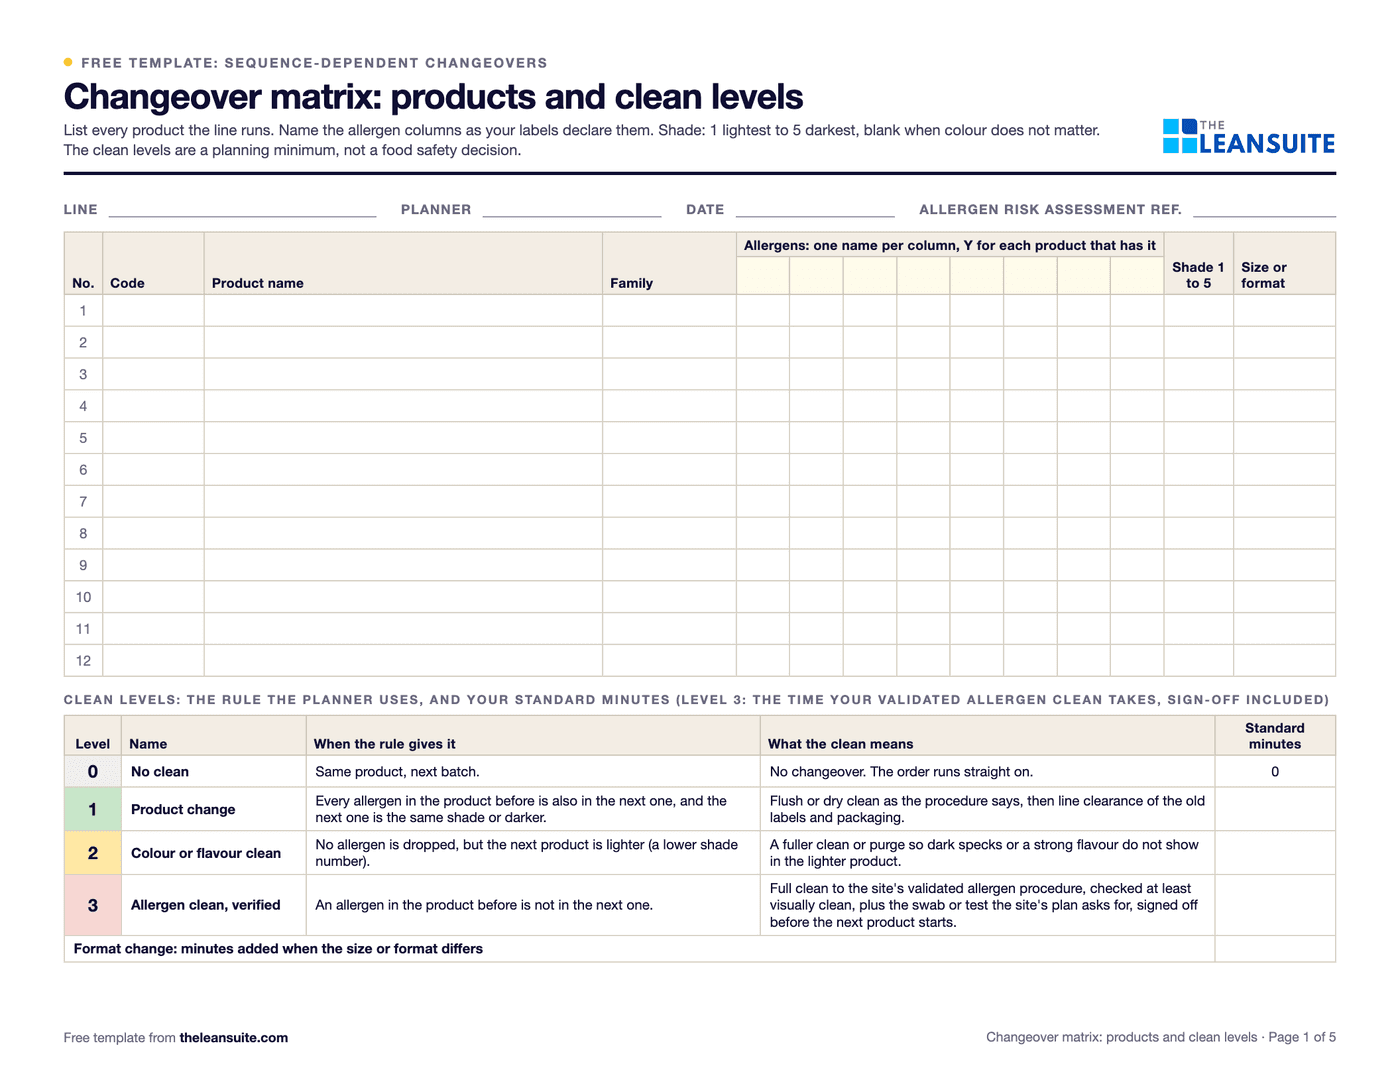 PDF and ExcelChangeover matrix templateA from-to matrix of changeover minutes with the clean each transition needs (allergen, colour, format), and a weekly planner that totals the order and suggests a shorter one.
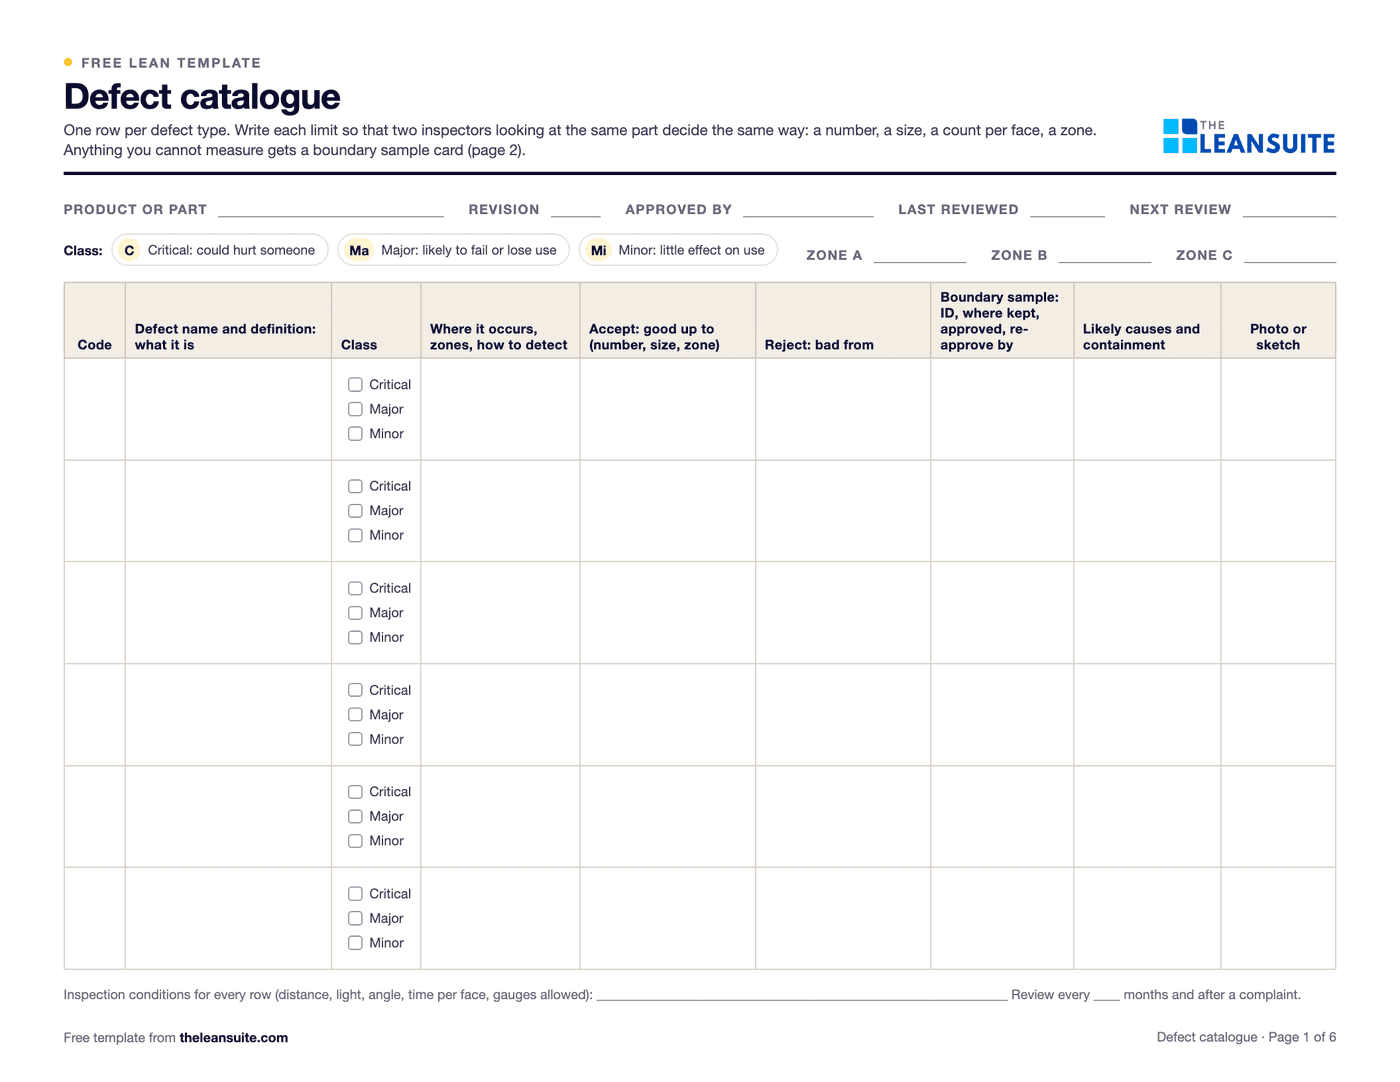 PDF and ExcelDefect catalogue template with boundary samplesEvery defect with a definition, a class and the reason for it, measured accept and reject limits by zone, boundary samples, a defect log with DPU and Pareto, and an inspector agreement check.
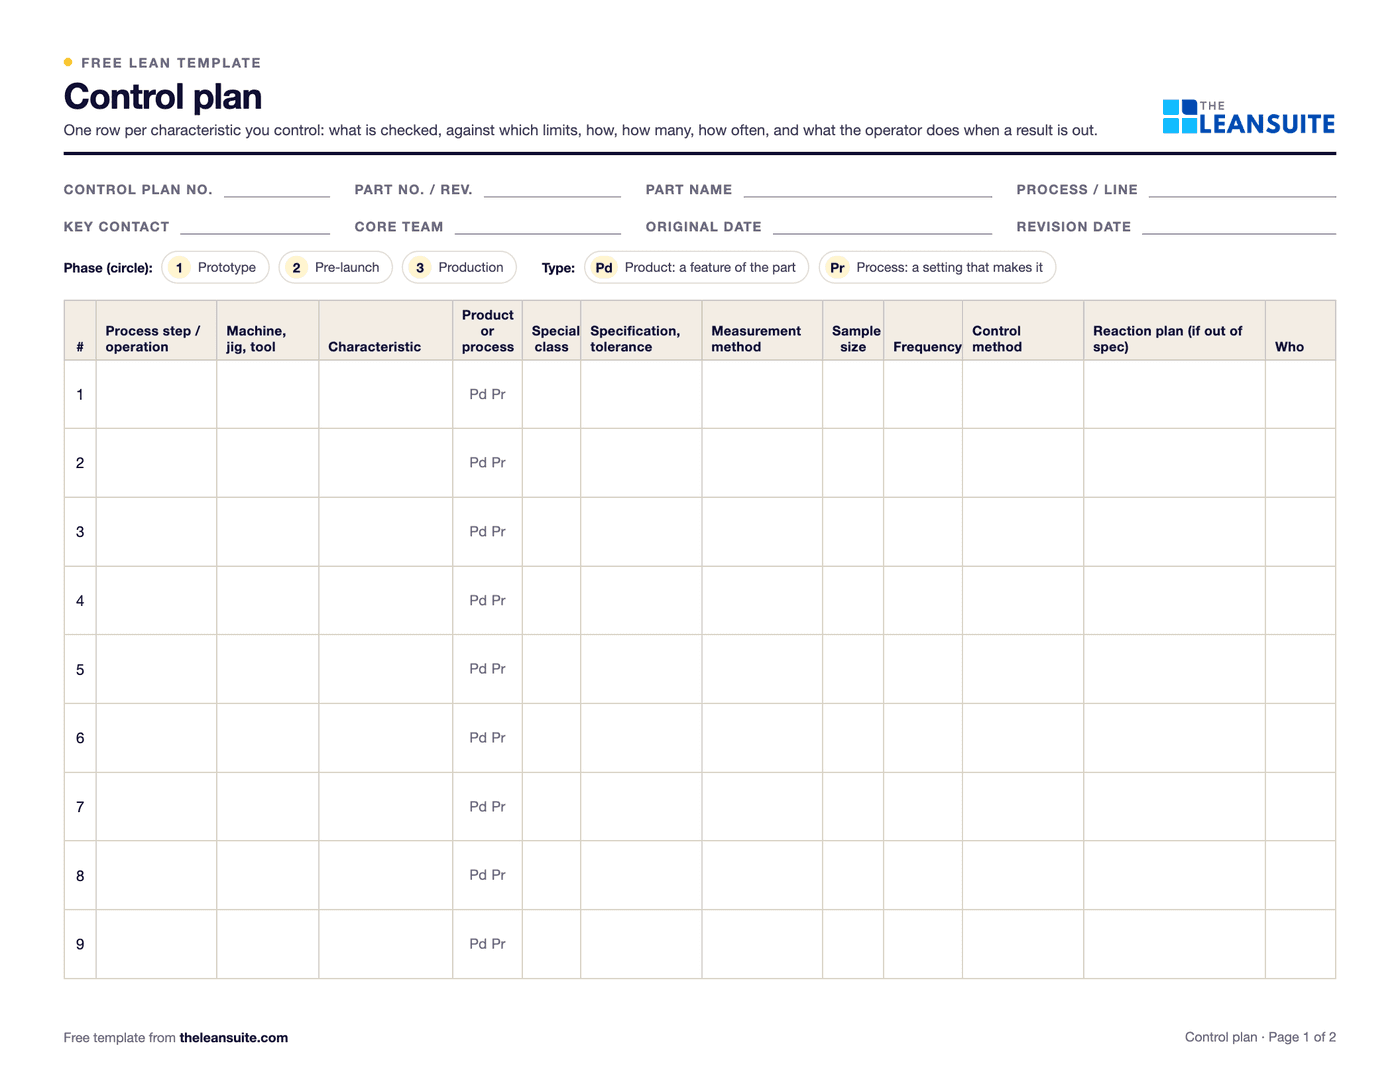 PDF and ExcelControl plan templateWhat is checked at each step, against which limits, how, how often, and what to do when a result is out.
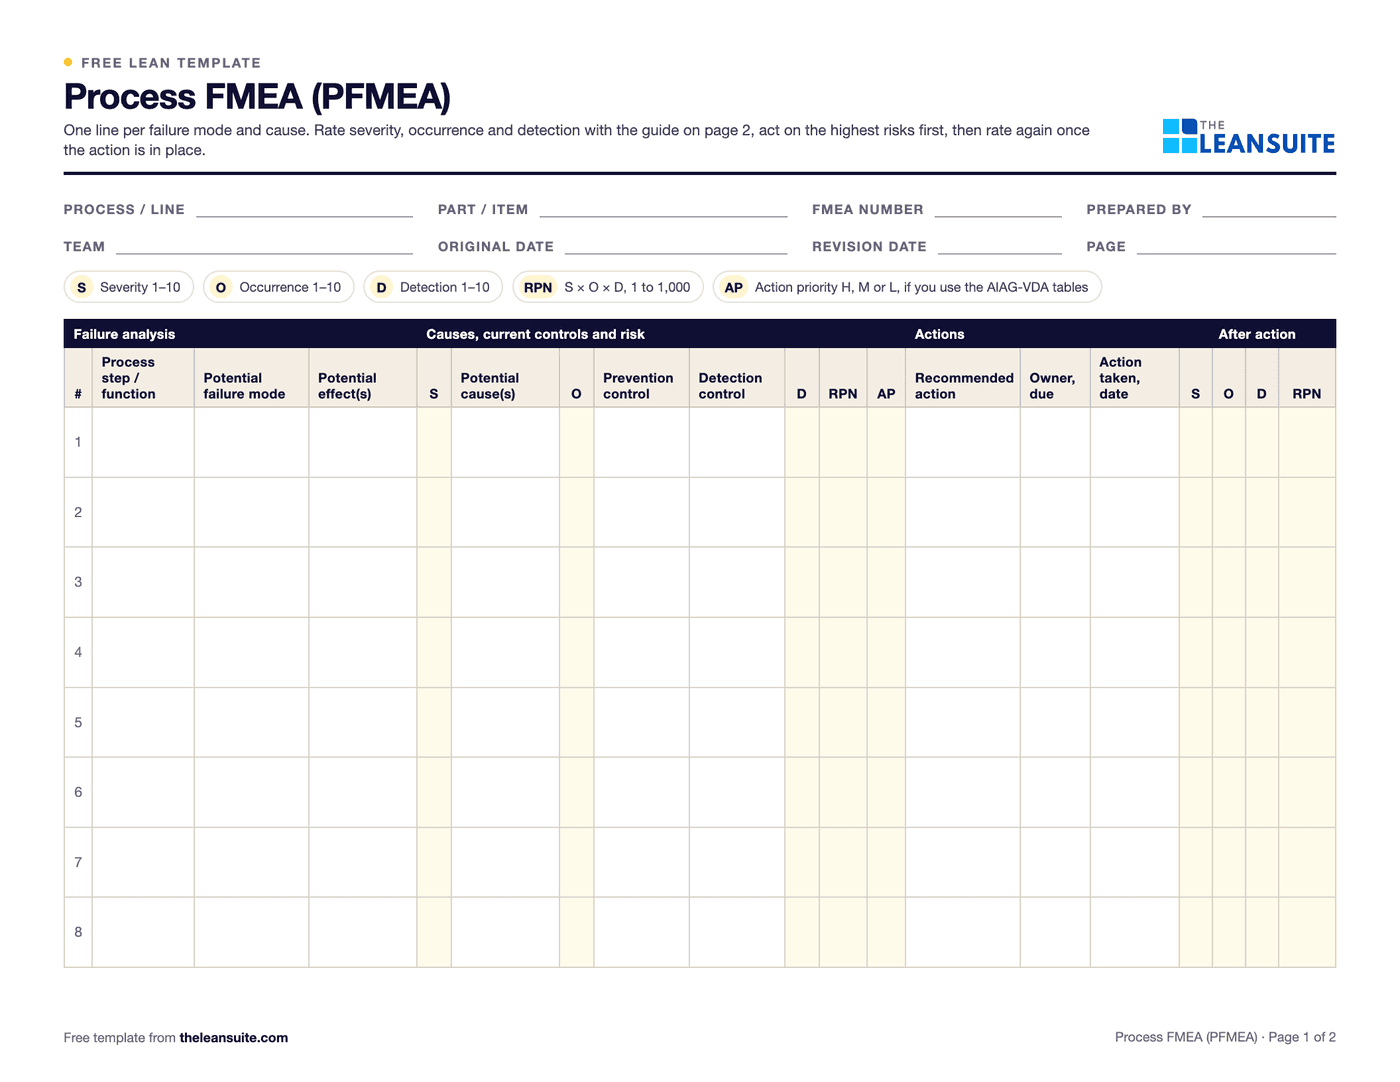 PDF and Excel and WordPFMEA template (process FMEA)Failure modes, effects and causes rated for severity, occurrence and detection, with RPN before and after action.
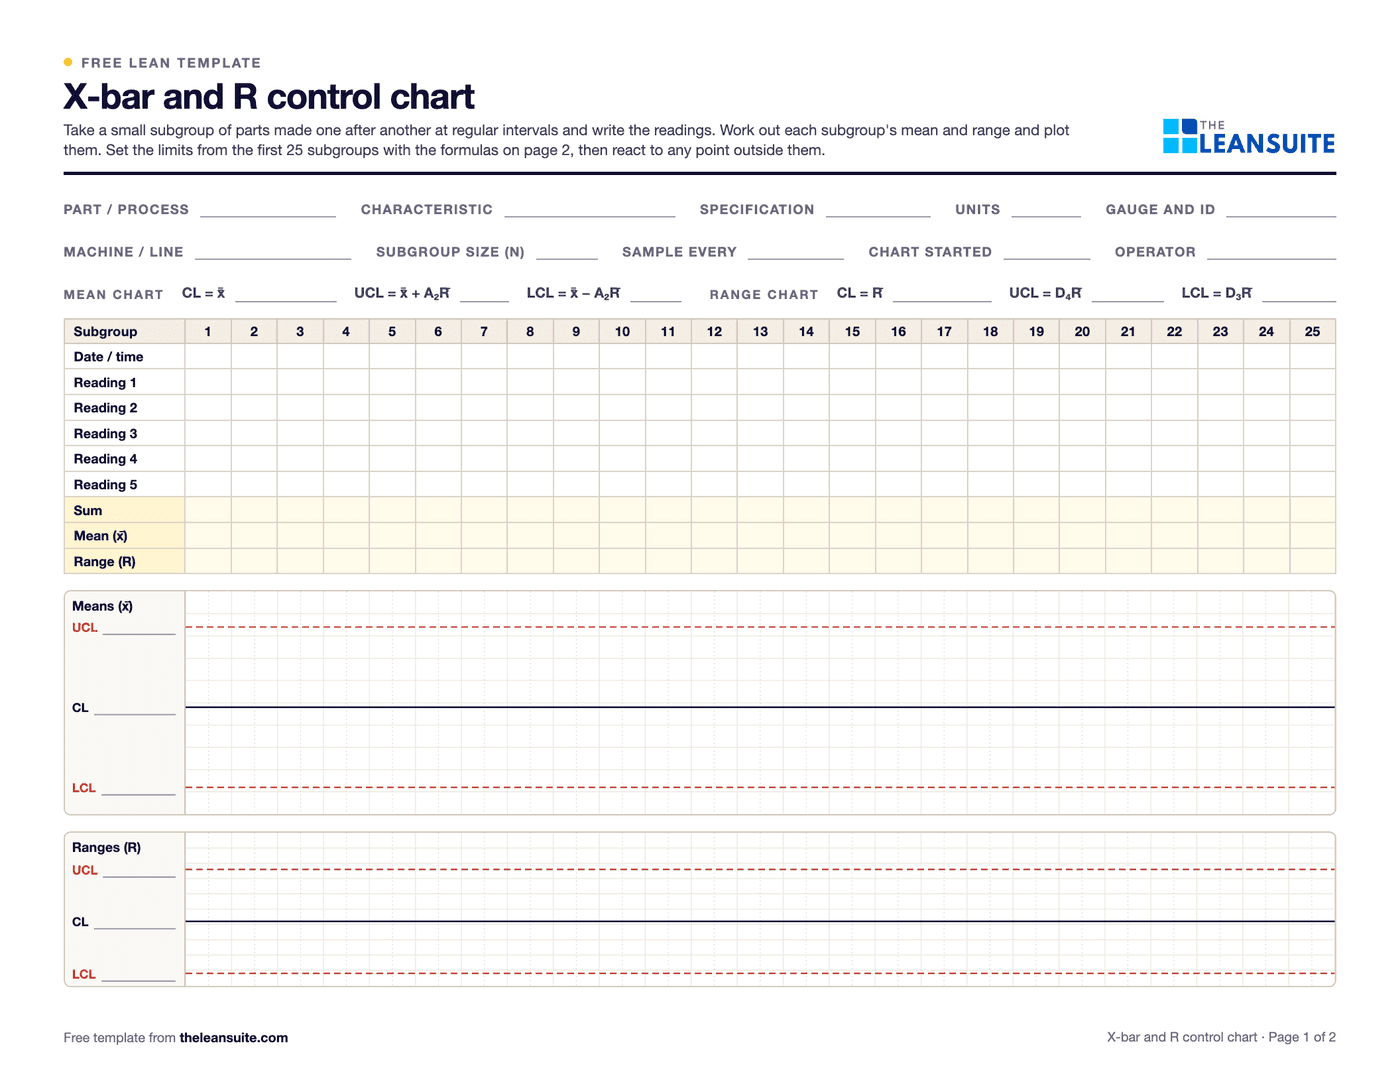 PDF and ExcelX-bar and R control chart template25 subgroups with means and ranges, control limits from A2, D3 and D4, signal flags, both charts and a reaction log.
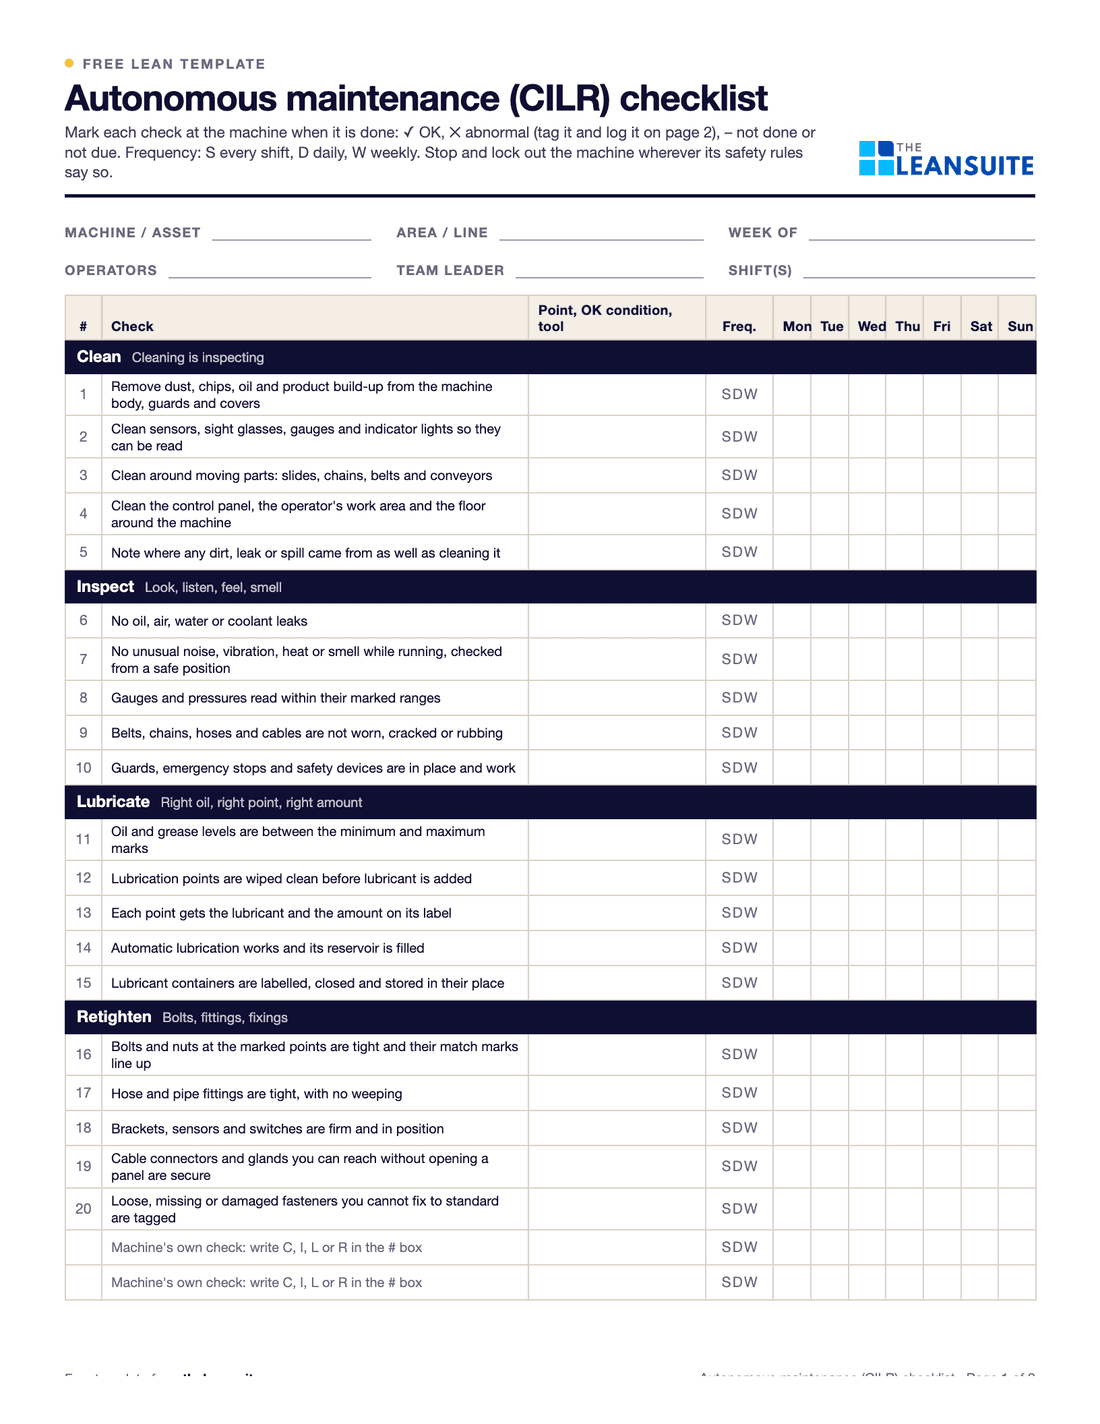 PDF and ExcelAutonomous maintenance (CILR) checklist20 clean, inspect, lubricate and retighten checks with a box per day, an abnormality log and sign-off.
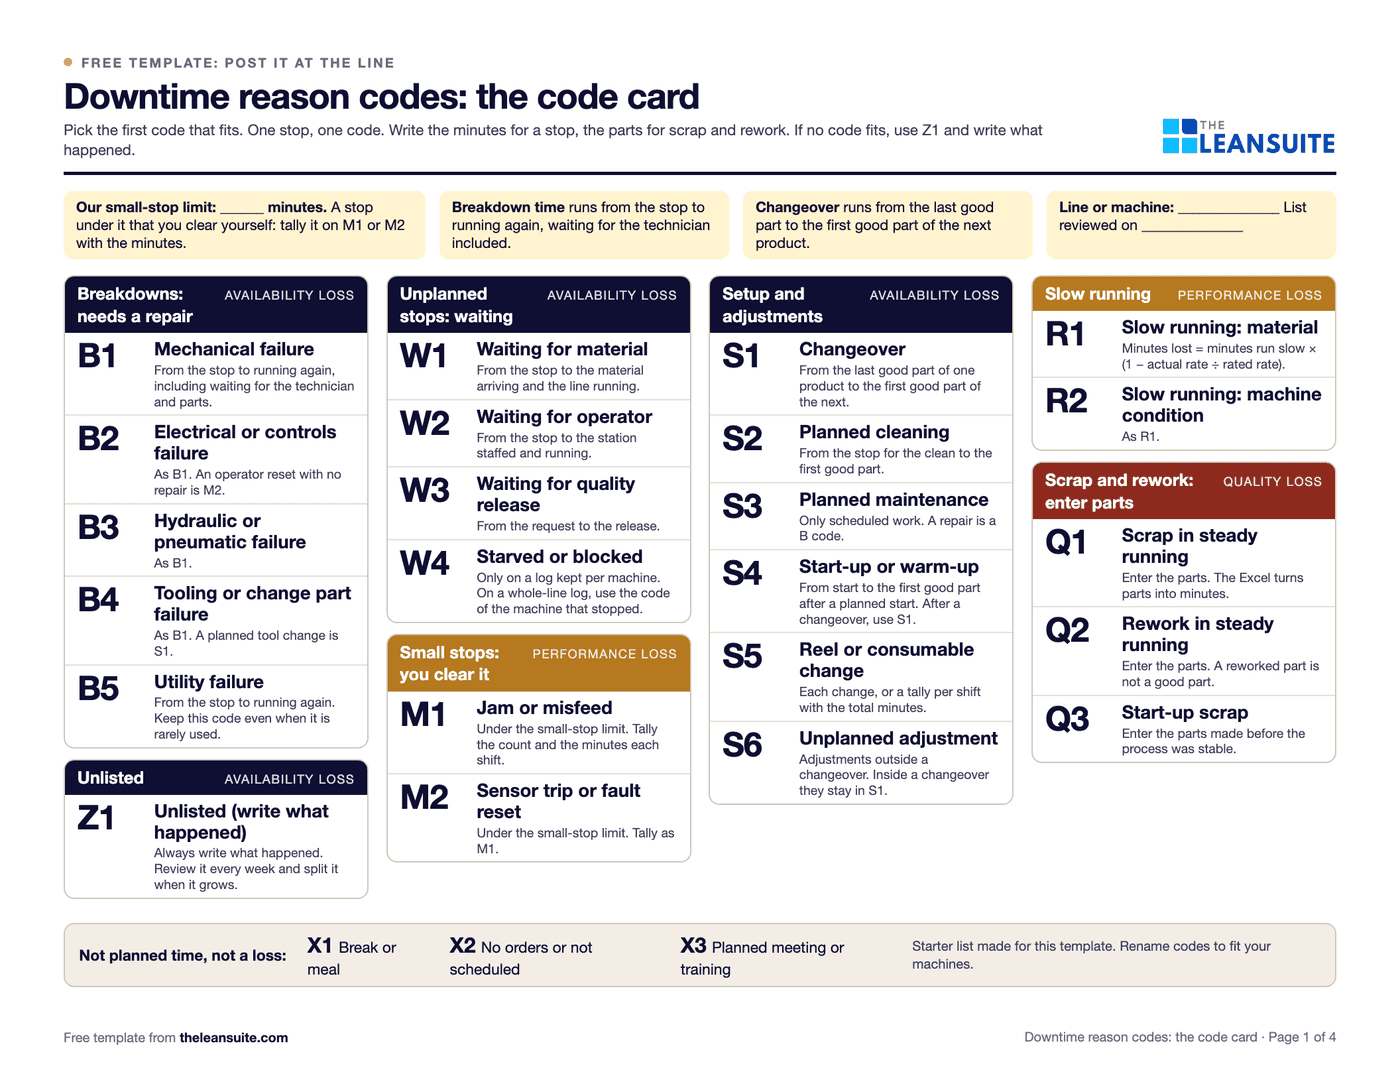 PDF and ExcelDowntime reason codes template26 starter codes mapped to the six big losses, a log with drop-downs, a Pareto by code and by loss, and a code card for the line.
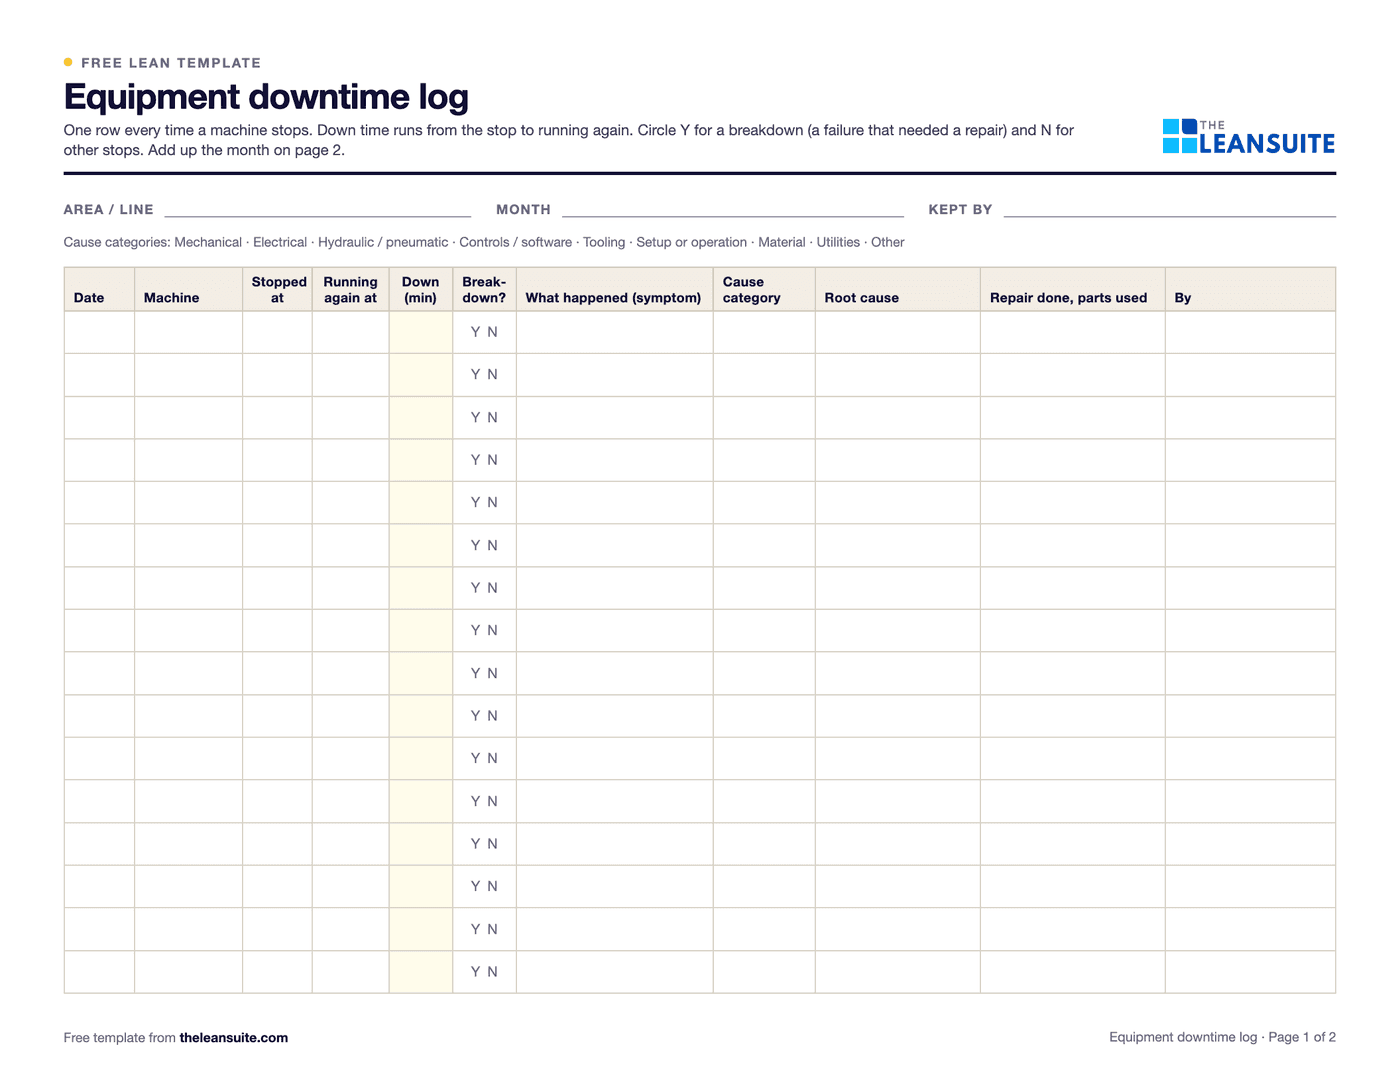 PDF and ExcelEquipment downtime log (MTTR and MTBF)A breakdown and downtime log, with MTTR, MTBF and downtime by machine and cause worked out in Excel.
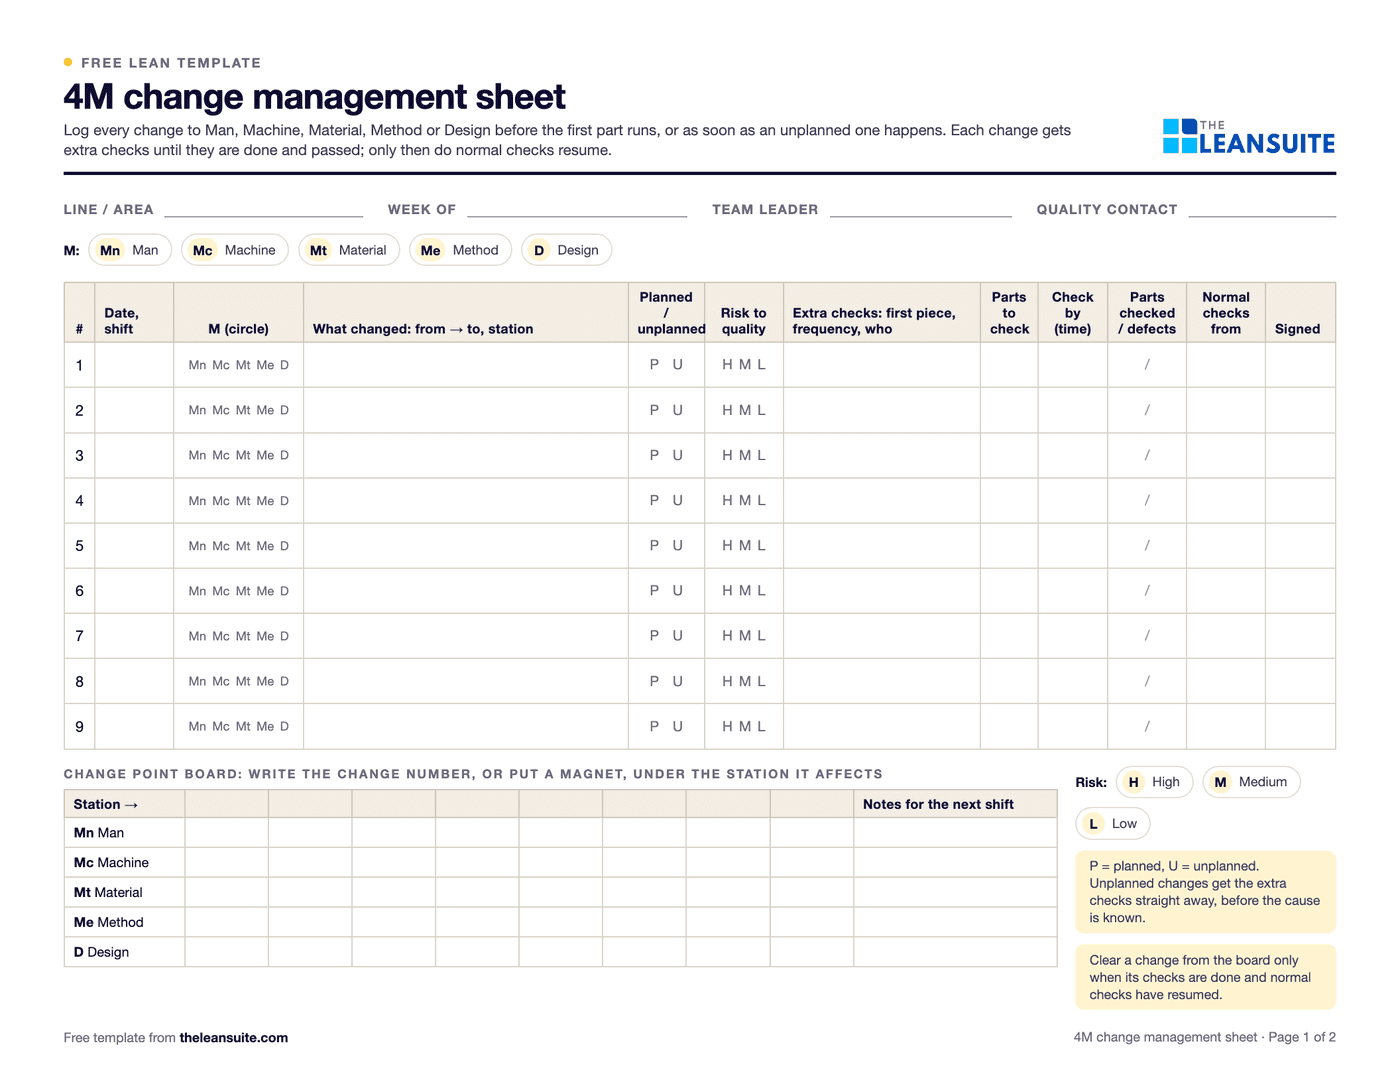 PDF and Excel4M change management sheet (change point)A shift log of every change to Man, Machine, Material, Method or Design, the extra checks after it and when normal checks resume, with a change point board.
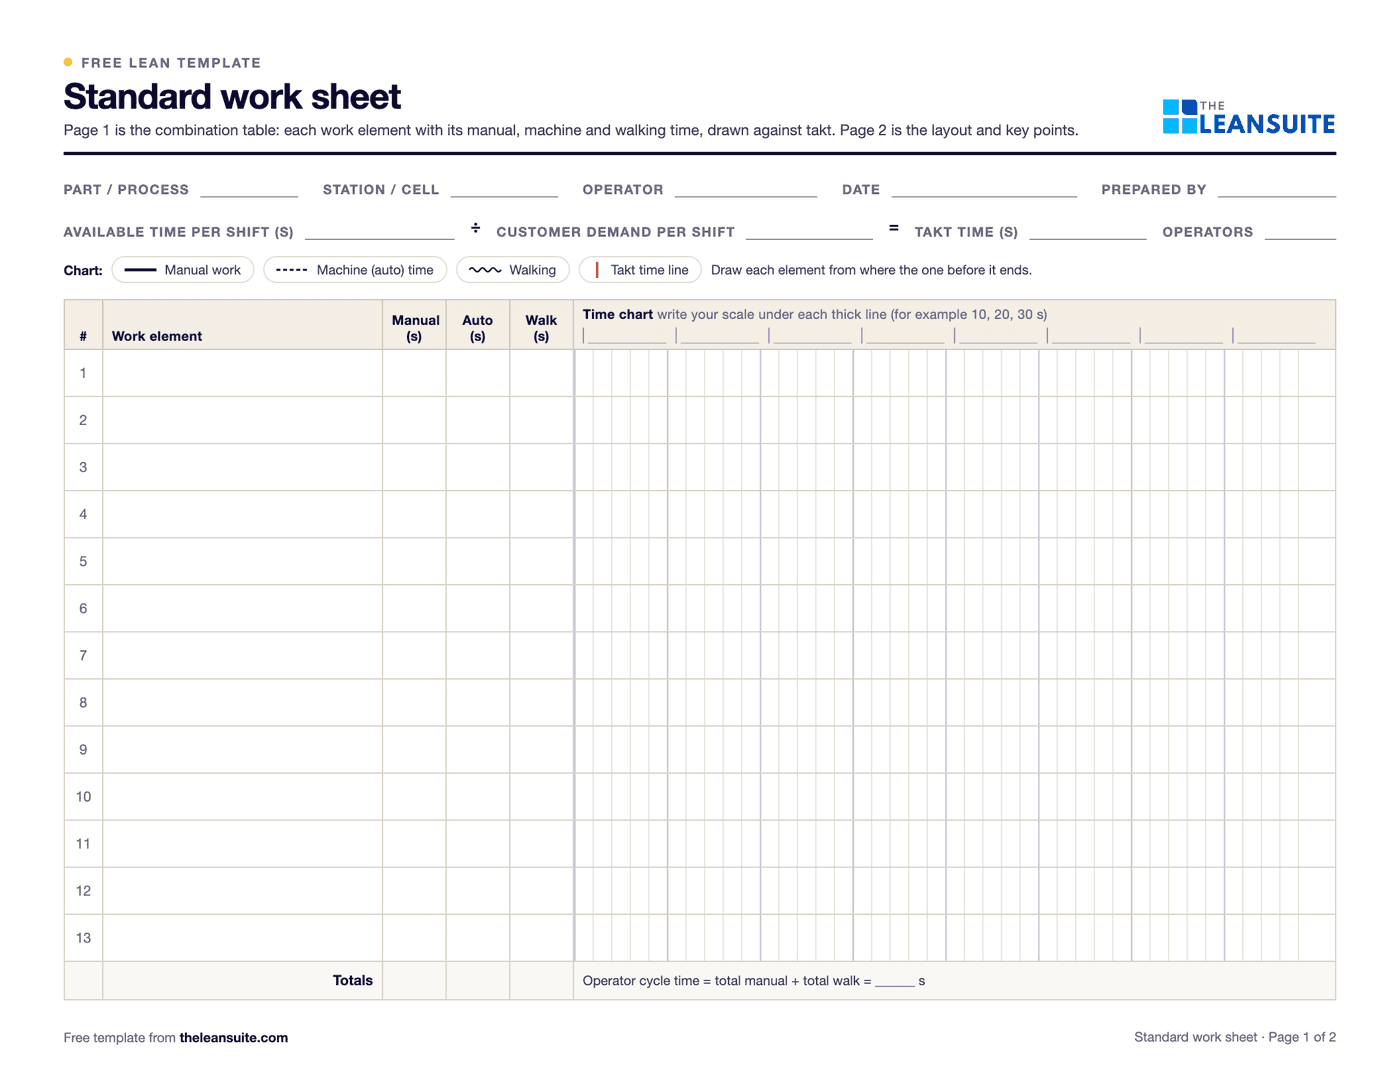 PDF and Excel and WordStandard work sheet templateTakt time, each element's manual, machine and walk time on a time chart, key points and standard WIP.
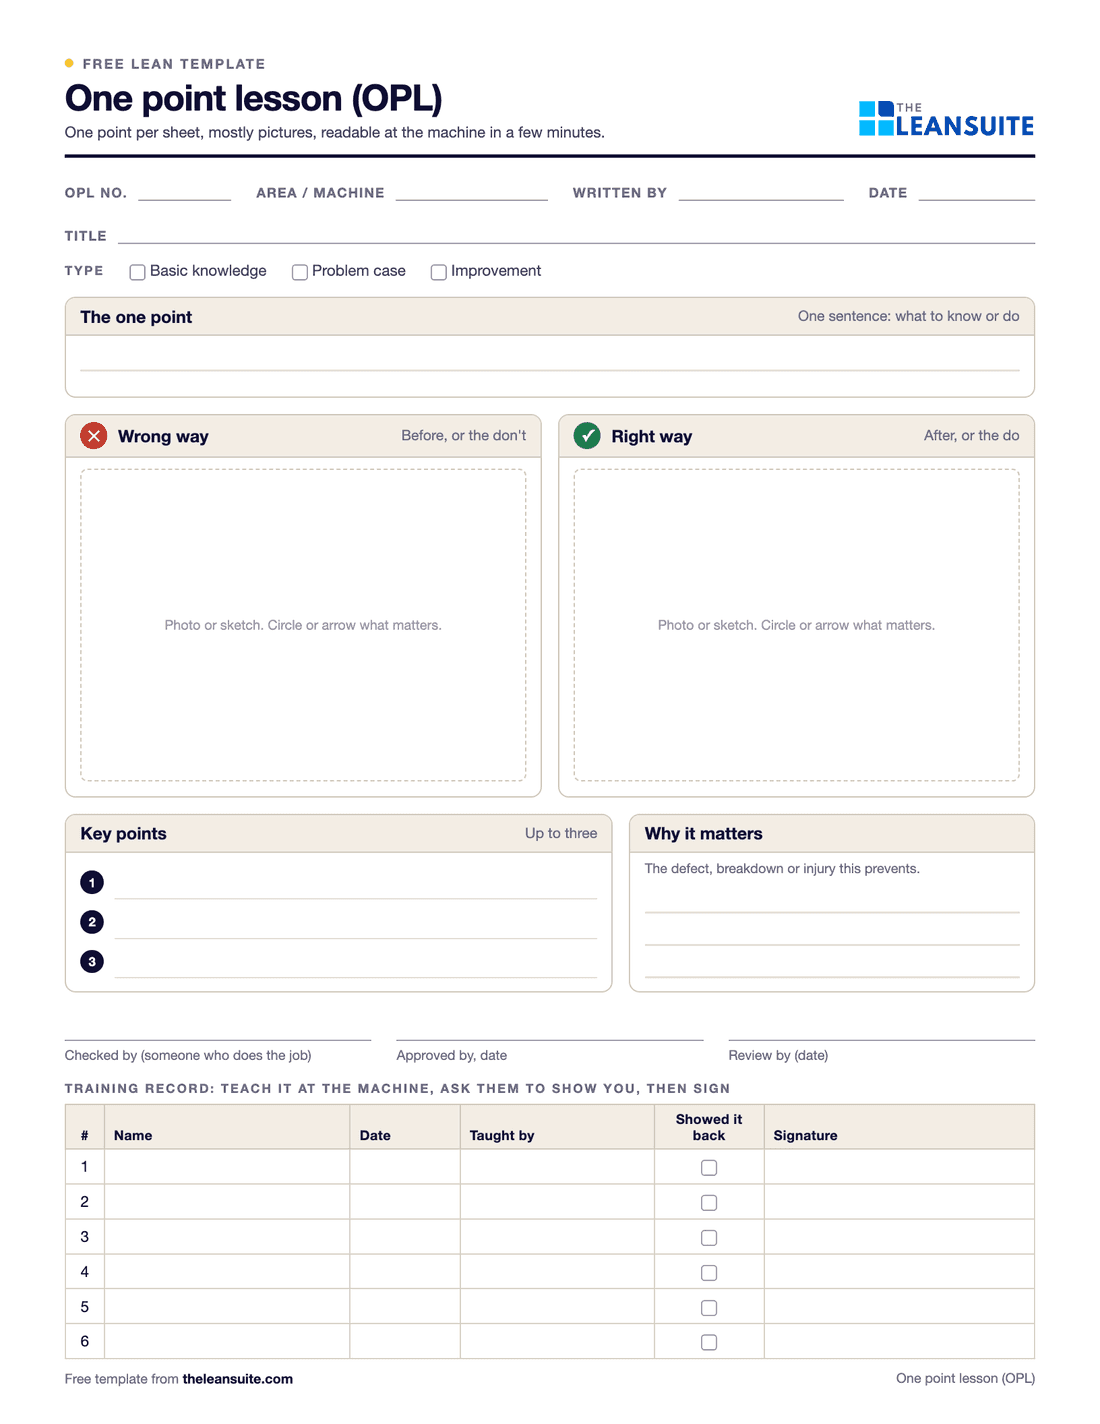 PDF and Excel and WordOne point lesson (OPL) templateOne topic on one page: wrong way and right way pictures, checkable key points, the standard it belongs to and a sign-off record.
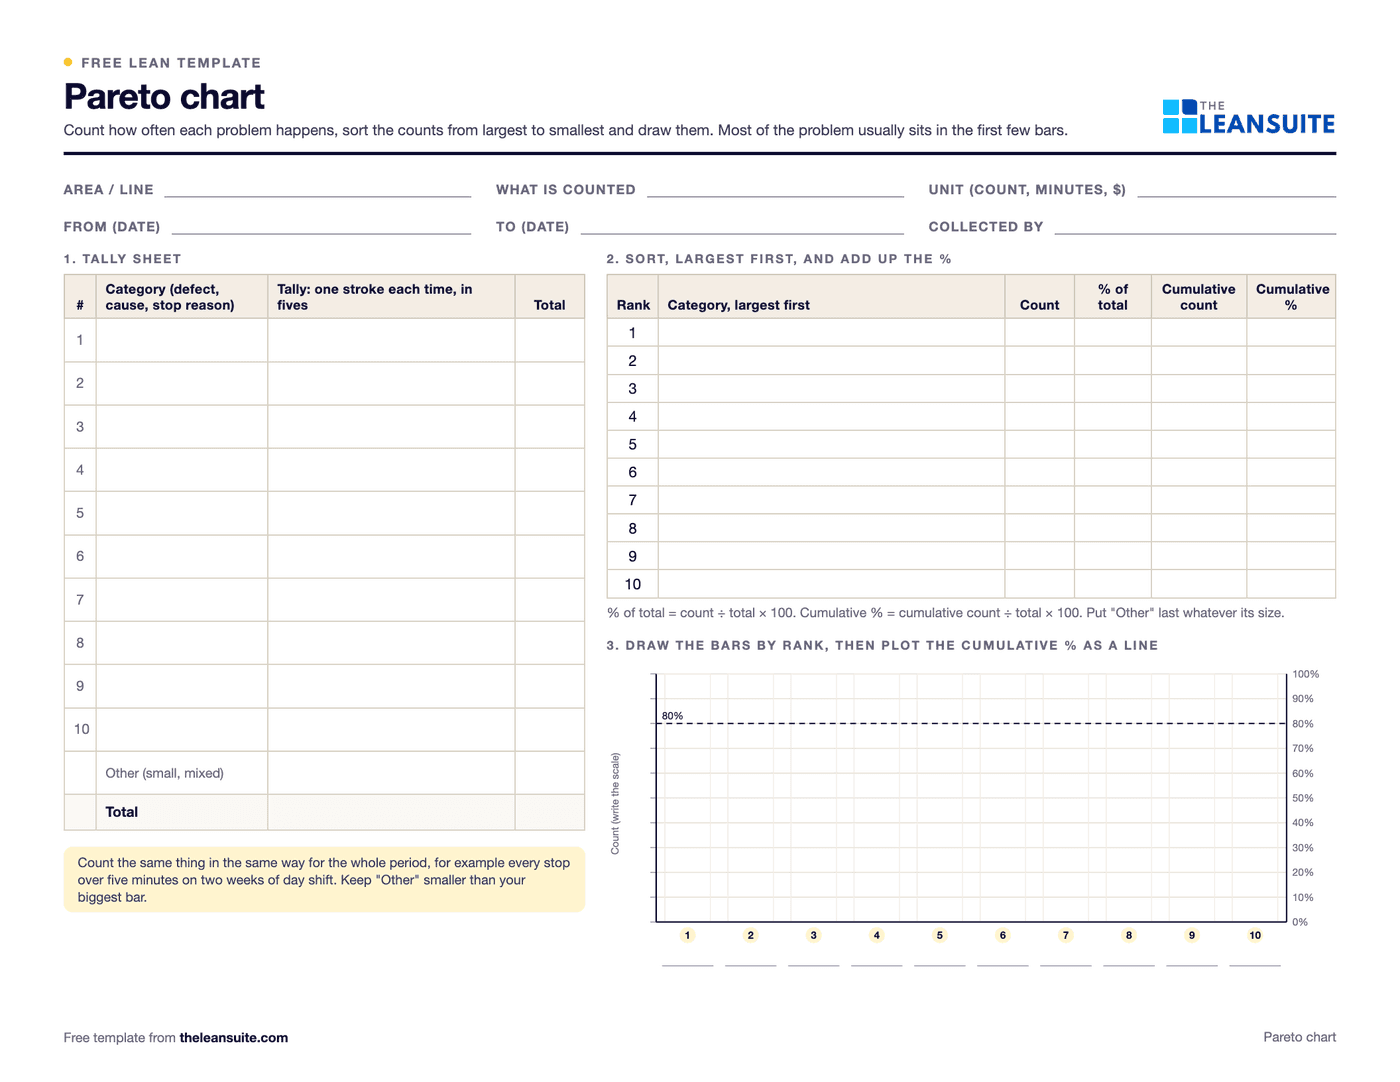 PDF and ExcelPareto chart templateA tally sheet, the Pareto by count and by cost with the cumulative line and the 80% cut, and a before and after comparison. Excel sorts and draws it.
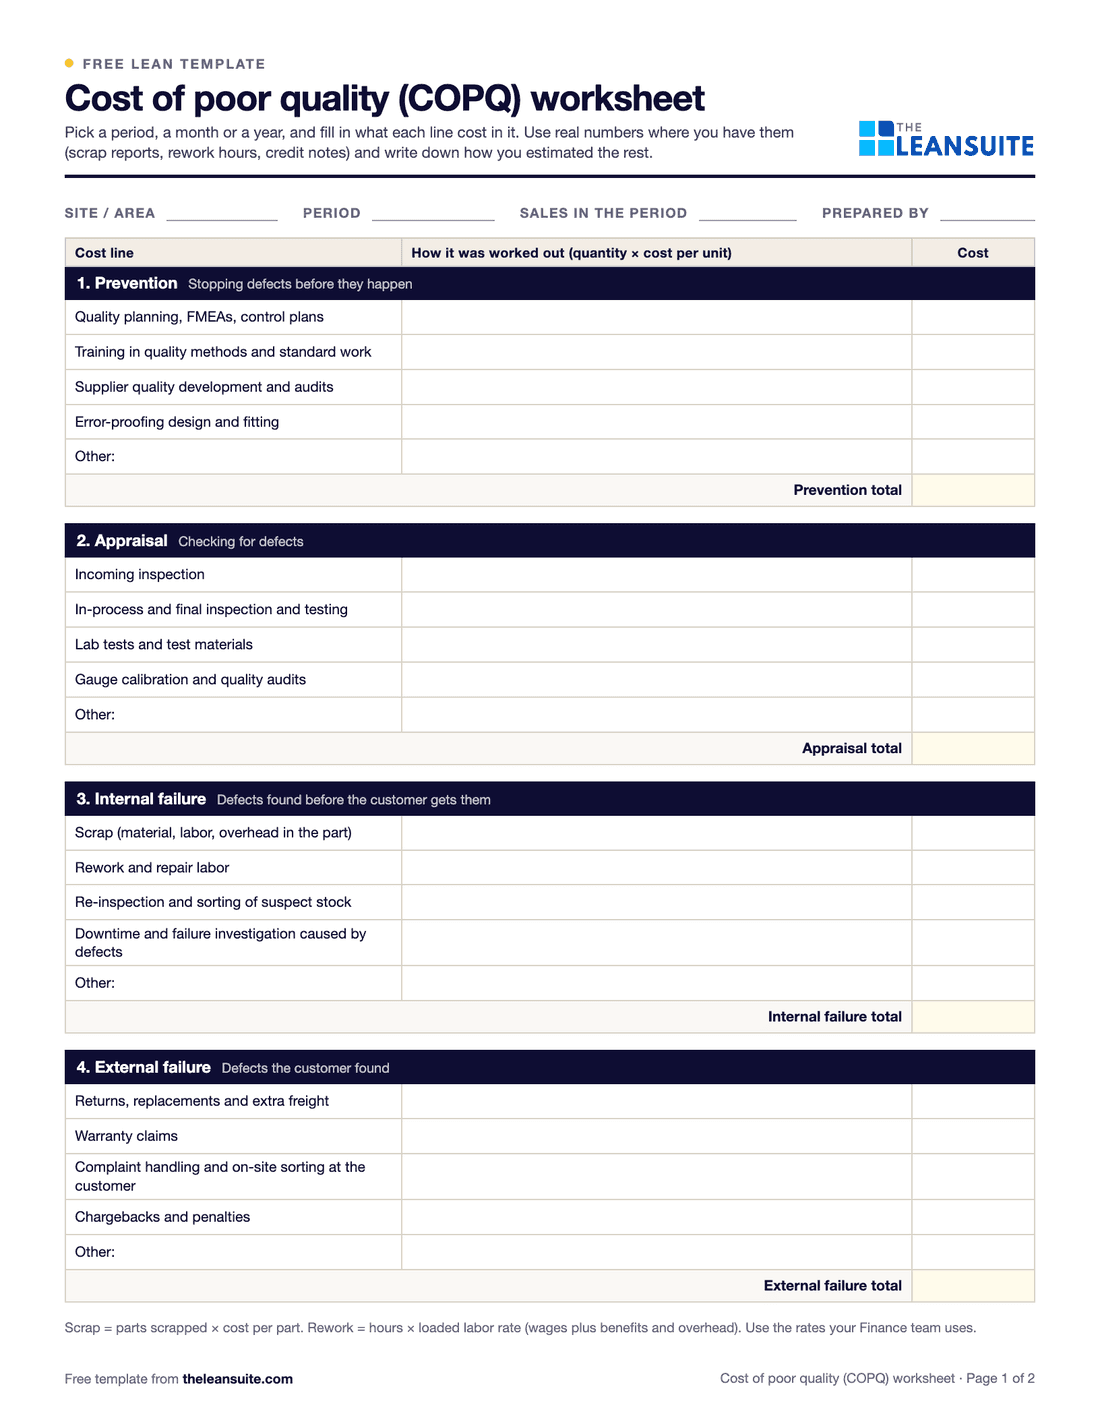 PDF and ExcelCost of poor quality (COPQ) worksheetCost of quality by prevention, appraisal, internal and external failure, with COPQ as a share of sales.
 PDF and ExcelSkills matrix templatePeople by tasks on a 0 to 4 scale, coverage and gaps per task and shift, and a training plan that closes them.
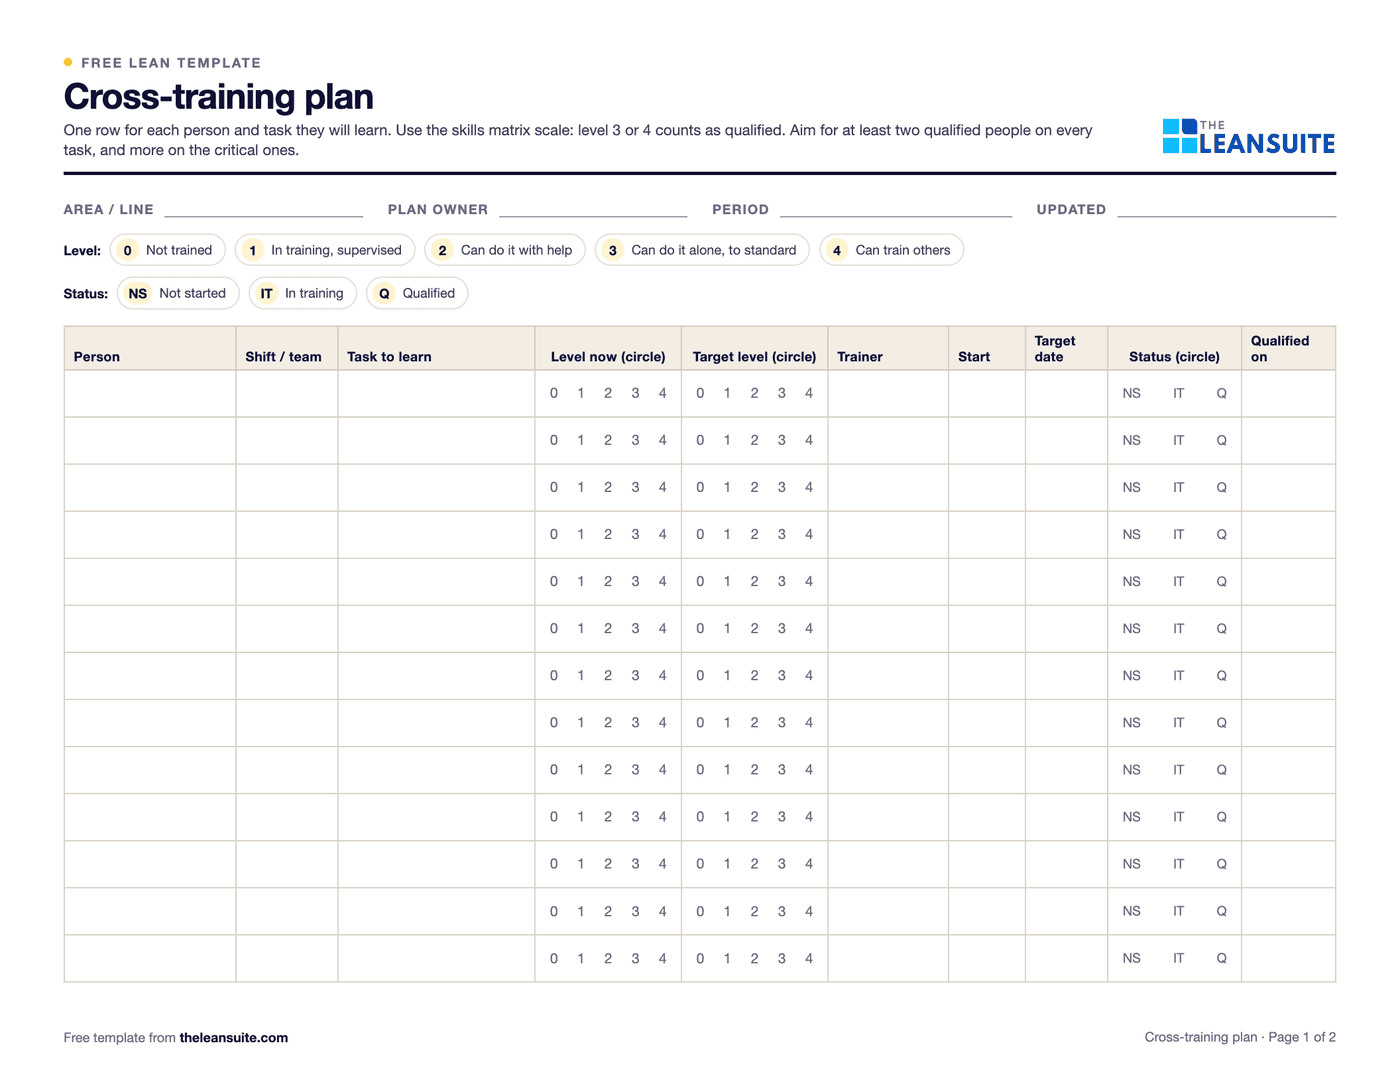 PDF and ExcelCross-training plan templateWho is learning which task, from and to which level, by when, and how many are qualified on each task.
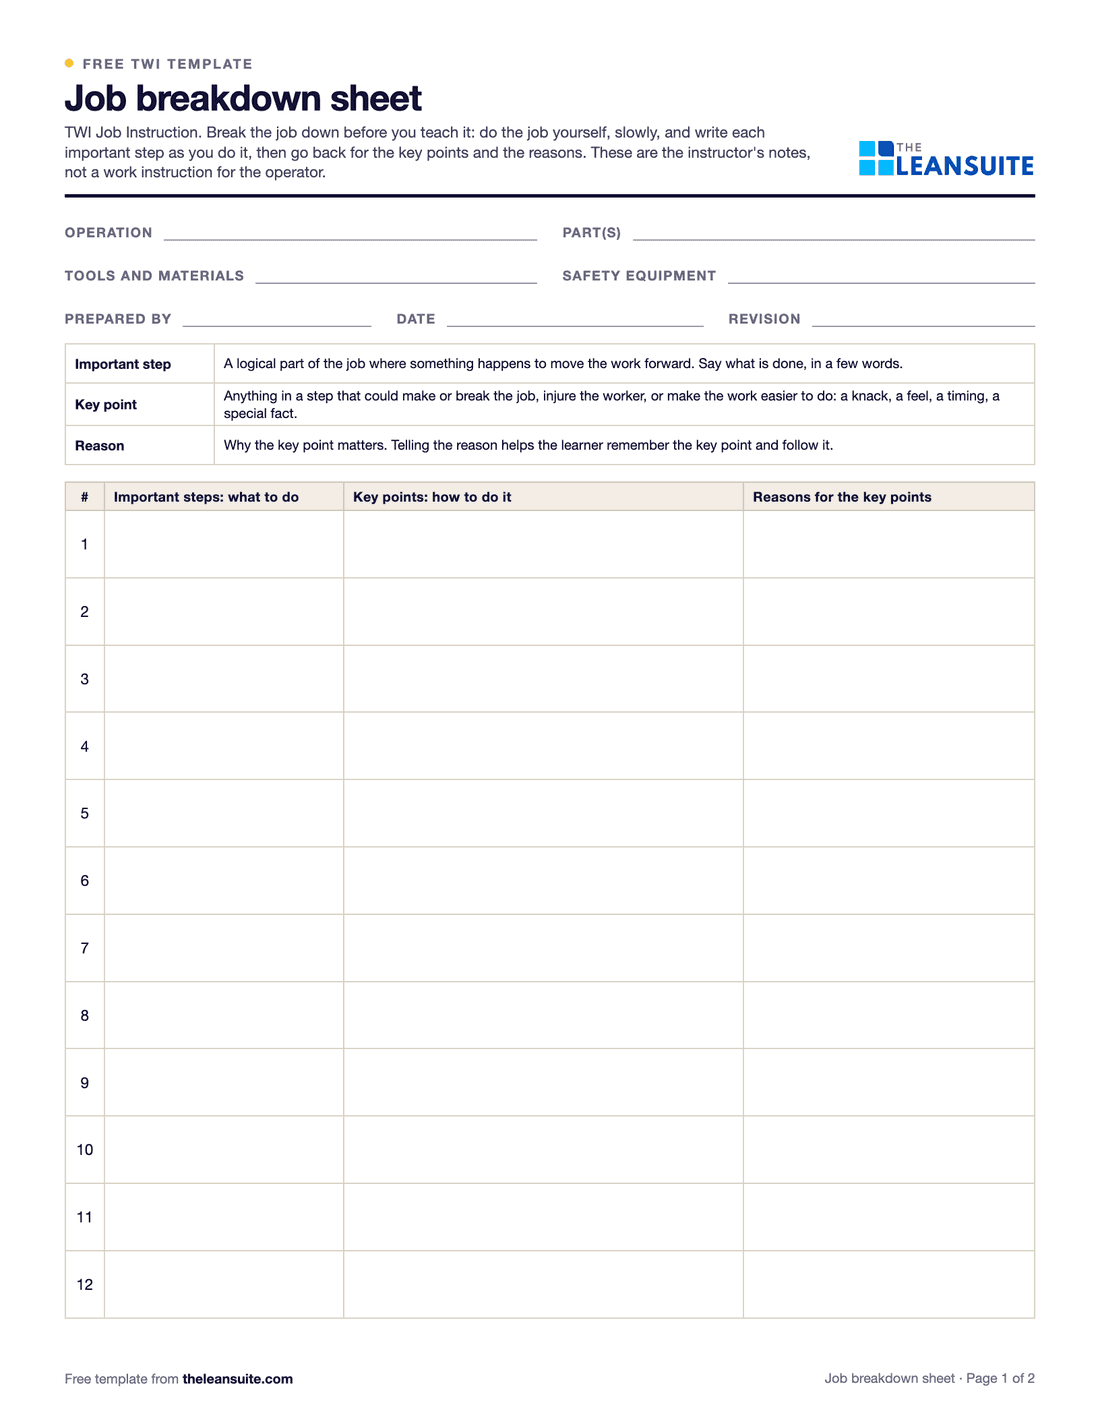 PDF and ExcelTWI job breakdown sheetThe TWI Job Instruction breakdown of a job into important steps, key points and reasons, with a worked example and the four steps.
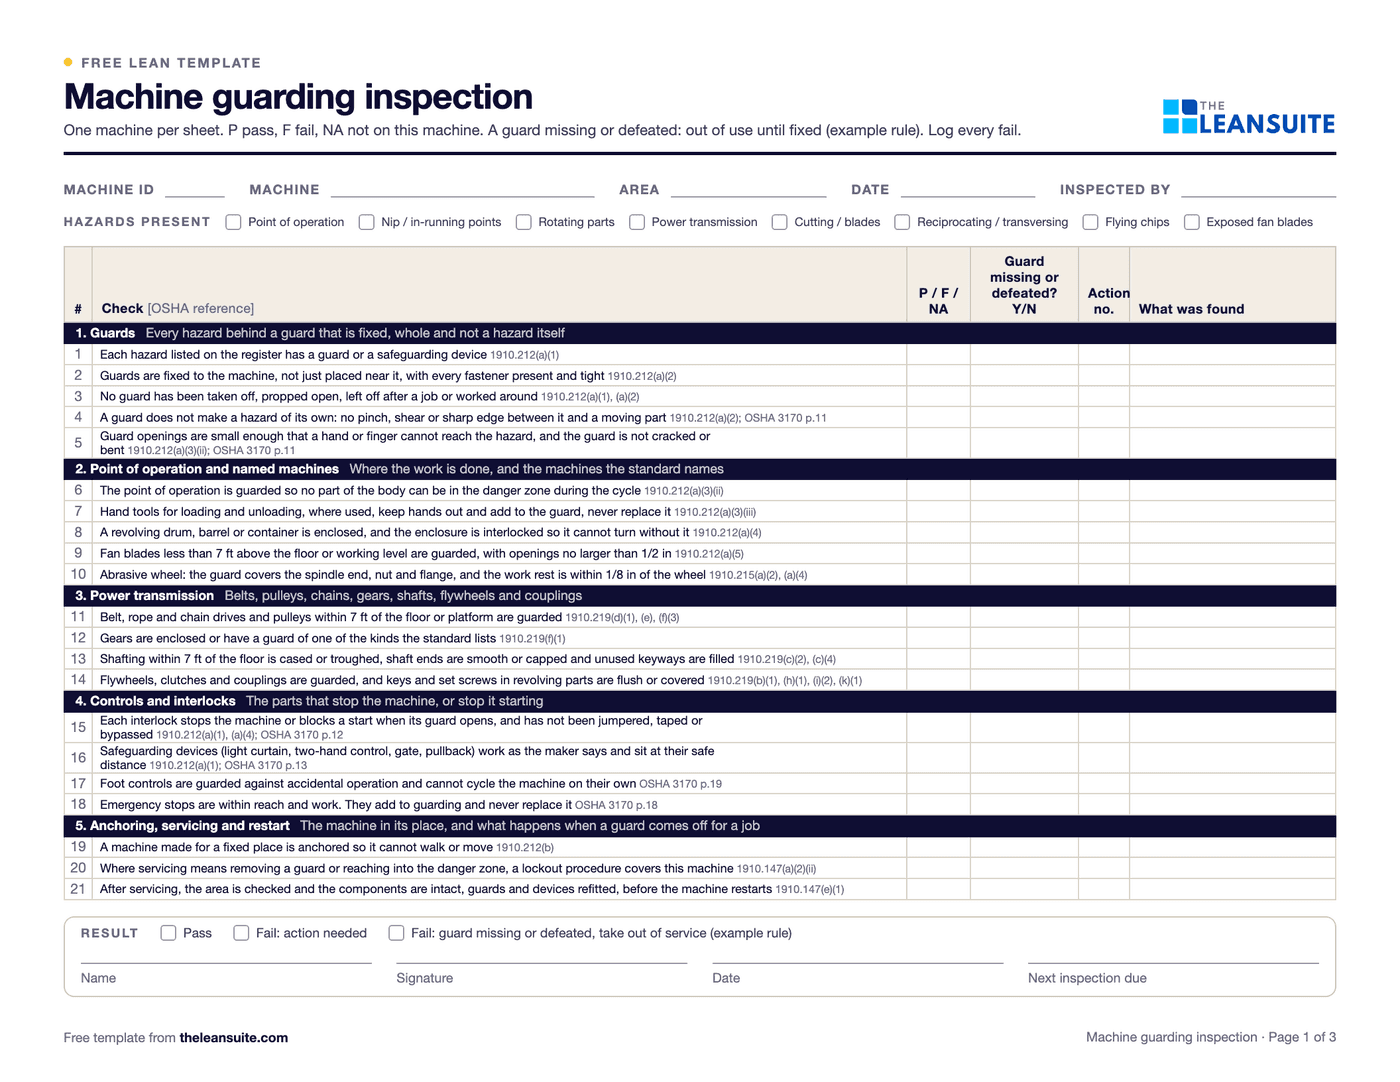 PDF and ExcelMachine guarding inspection sheetA machine register with due dates and a status per machine, 21 checks tied to OSHA 1910.212, .219 and .147, a guard opening check against Table O-10, and an action log.
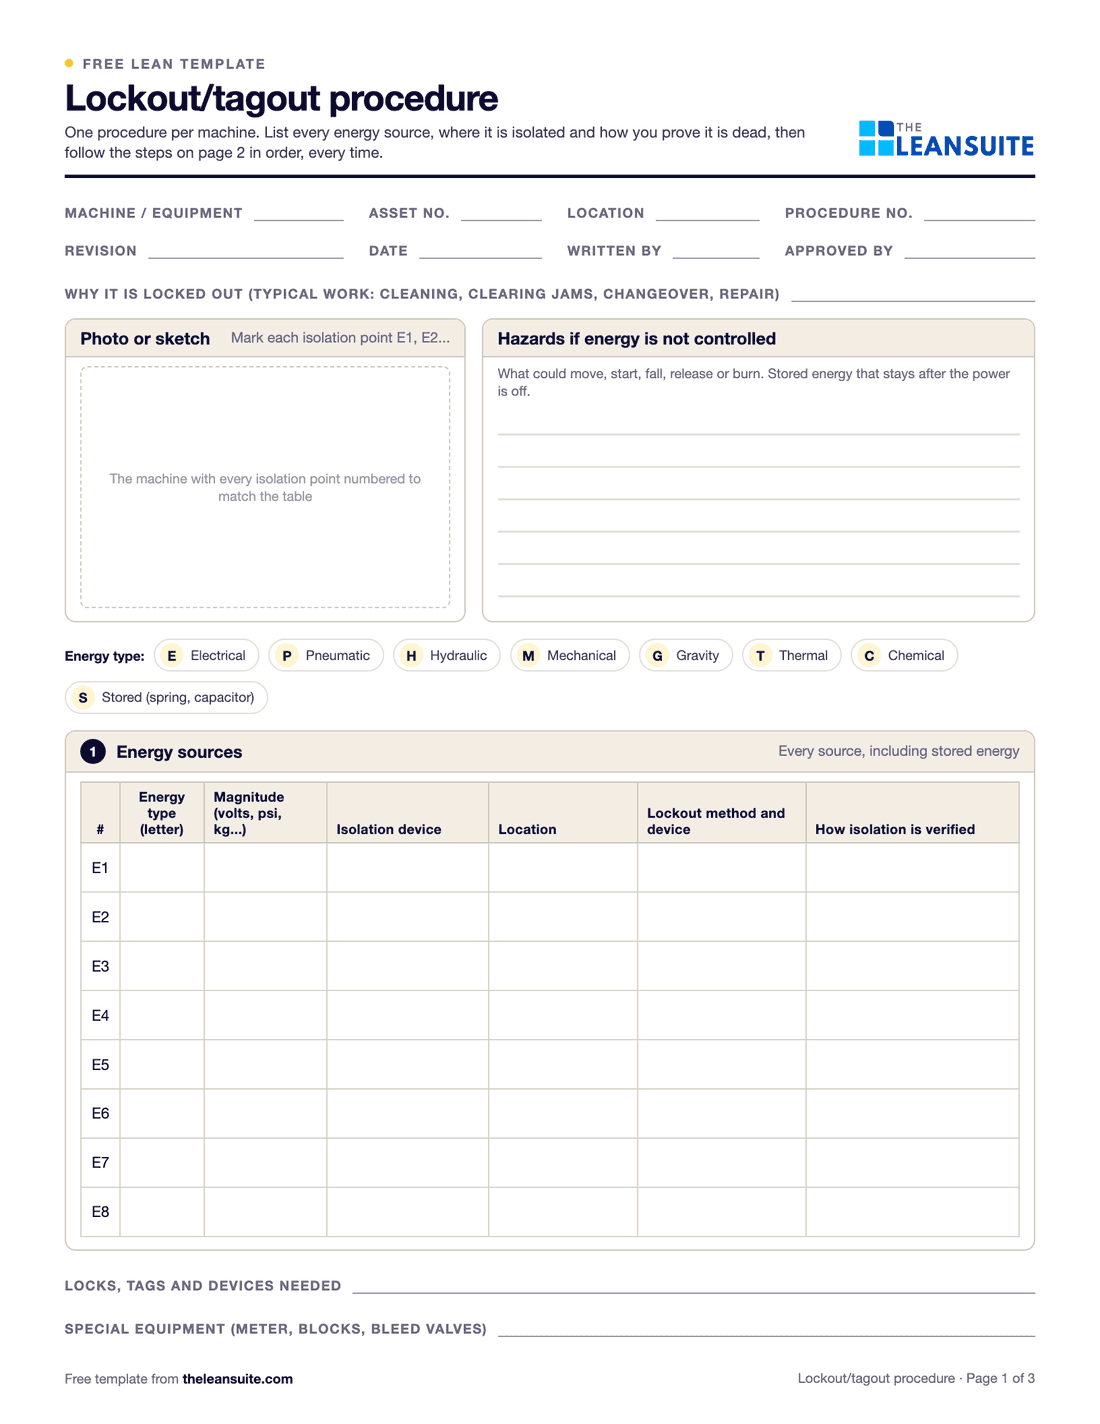 PDF and ExcelLockout/tagout (LOTO) procedure templateA machine-specific LOTO procedure: energy sources and isolation points, the steps from shutdown to restart, and the annual review.
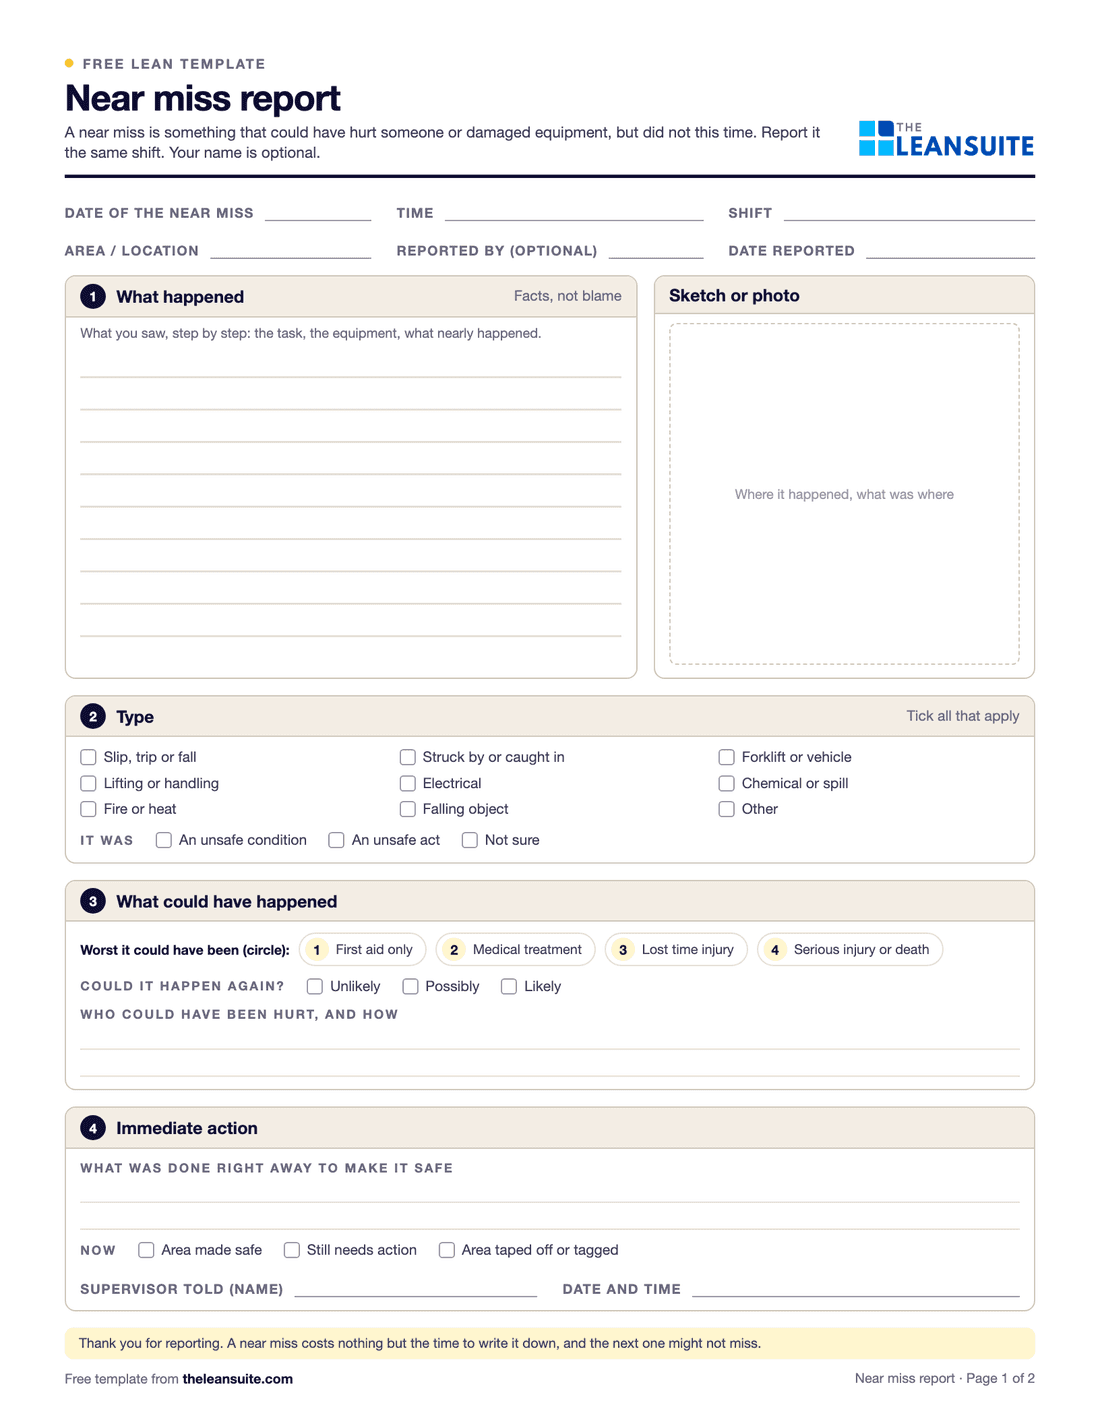 PDF and ExcelNear miss report formA two-page near miss report from the first report to closure, and an Excel log with status and days open.
Calculators (8)
- Free calculatorSMED changeover calculatorTime saved by moving changeover steps from internal to external, capacity freed per week and the smaller batch it allows.
- Free calculatorProcess capability (Cp, Cpk) calculatorCp and Cpk against your specification limits, plus Pp and Ppk from pasted measurements, with a distribution chart.
- Free calculatorScrap rate calculatorScrap rate, the cost of scrap per period and per year, and what reaching a target rate would save.
- Free calculatorOEE calculatorOverall equipment effectiveness from shift time, downtime, ideal cycle time and part counts.
- Free calculatorMTBF and MTTR calculatorMean time between failures, mean time to repair and availability from operating time, failures and repair time.
- Free calculatorCost of poor quality (COPQ) calculatorTotal COPQ and cost of quality, and each as a share of revenue, from the four quality cost categories.
- Free calculatorFirst pass yield (FPY) calculatorFirst pass yield at each step and rolled throughput yield (RTY) across the whole process.
- Free calculatorCycle time calculatorCycle time against takt, units per hour, capacity per shift and the gap to daily demand.
Buyer's guides
LeanSuite pages for these problems
- SMED
- AI SMED changeover analysis
- Quality Prioritization Matrix
- Non-Conformance (NCR)
- Cost of Poor Quality
- Micro-stops
- CILR Checklists
- Autonomous Maintenance
- Loss & Cost Management
- Kaizen & Projects
- Competency Management
- Digital Work Instructions
- Job Cover Matrix
- Lockout/Tagout (LOTO)
- Near Miss Reporting
- Audit Management
How LeanSuite handles each of these is on the page for plastics and injection molding plants.
Whirlpool tackled project visibility and continuous improvement across 14 manufacturing plants with LeanSuite. Read the Whirlpool case study.
FAQ
Lean in plastics and injection molding plants: common questions
Short shots, flash, sink marks, voids, warpage, splay, burn marks, weld lines, flow lines, jetting, black specks, parts that stick and brittle parts. Most trace back to the material, the mold, the machine or the process settings, and many are drift from the documented process rather than a new problem.
Not enough material reaching the cavity: too small a shot or too little cushion, low injection pressure or speed, a cold melt or mold, blocked gates or vents, or a worn check ring that lets melt slip back during injection. Check the cushion and shot size against the process sheet first.
Add the time to close the mold, inject, pack and hold, cool, open and eject the part. Cooling is usually the longest step, so it is where most cycle time savings come from, as long as parts still meet their size and warp limits. Compare each press's actual cycle with the standard: a cycle that creeps up shows as a performance loss in OEE.
Film one change and list every step with its time. Move everything you can do while the press still runs outside the stop: preheat the next mold, dry the material and stage the cart, hoses, clamps and tools. Then shorten the steps that need the press stopped, with quick couplings, standard clamp heights and a set first-shot approval routine.
Availability times performance times quality. Availability is run time divided by planned time, performance is actual shots divided by the shots the standard cycle allows in that run time, and quality is good parts divided by all parts made. Count parts by the cavities actually running, so a blocked cavity shows as lost output.
With the press that holds up the most orders. Measure its OEE, mold change time and scrap for two weeks, cut the mold change with SMED and lock the process sheet for its main molds, then move to the next press.
See LeanSuite on your mold changes and molding defects
Bring the press or mold you want to fix first. We will show you how LeanSuite handles it and what a 90-day pilot would cover.