

Lean playbook · Rubber and tires
Lean playbook for tire and rubber manufacturing plants
Short answer
Lean in a tire or rubber plant starts at the two machines everything flows through: the mixer and the curing press. Keep the mixer running with daily operator care and steady batches, cut curing mold changes with SMED, and trace every tire defect back to the stage where it started, usually building or curing. Test mill and calender safety trips every shift, train tire builders to one standard, and track energy per tire. Measure mixer and press OEE, final inspection first pass yield and scrap before and after.
Last updated:
7 problems on the floor, and the lean methods for each
Each problem says what it looks like, which methods address it, the first moves to make and the number to watch. Pick the one or two that cost your plant most; you do not need all of them at once.
Where a tire plant loses time and quality
Extrusion and calendering
Final finish, uniformity and X-ray
Mixer and mill stops at the head of the plant
Every compound goes through one or two internal mixers, so a stop there starves extruders, calenders and builders within hours. Dust stop leaks, ram and door problems, cooling water faults and drop door wear cause most of the long stops, and the short ones are never written down.
Lean methods
In LeanSuite
Operators log each minor stop in one tap with its category, duration and cause, and Cost Management adds the stops up into a costed loss tree per machine.
First moves
- Write a daily care routine for the mixer and the mills: dust stop leakage, ram and door operation, cooling water flow and temperature, lubrication points and temperature probes.
- Log every mixer stop with a reason code, including short ones, for four weeks.
- Run a breakdown analysis on every long mixer stop and add the check that would have caught it.
Number to watch: Mixer OEE and mean time between failures.
Batch-to-batch compound variation
Two batches of the same compound behave differently at the extruder or in the press. A small ingredient weighed wrong, a batch dumped hot or early, or a filler lot that changed shows up as scorch, poor flow or a rheometer result out of limits, and the batch is held or blended off.
In LeanSuite
Issue Management logs each defect where it is found, the QA Matrix costs and ranks it, and Kaizen & Projects runs the root-cause project.
First moves
- Check the weighing of small ingredients, such as curatives and accelerators, with a barcode or a second check before they reach the mixer.
- Record dump temperature, mix time and energy for every batch, and set limits for each compound.
- Chart the rheometer and Mooney results for each compound and hold any batch outside its limits before it reaches the next stage.
Number to watch: Batches released first time, and batches held, blended off or scrapped.
Curing press mold and bladder changes
A tire mold change means cooling, unbolting, lifting, cleaning, hanging and reheating, then curing until a tire passes. Bladder changes and mold cleaning add more stops, and more sizes in smaller lots mean more changes every week.
In LeanSuite
Run each mold change as a digital checklist in Lean Creator, and Issue Management flags missing items.
First moves
- Film one mold change on a curing press and list every step with its time, from the last good tire to the first good tire.
- Preheat the next mold, stage the lifting gear, bladder and tools, and plan mold cleaning to happen at the same stop as the change.
- Group sizes on each press with a changeover matrix so the changes that are made are the short ones.
Number to watch: Mold change time per press, and cure cycles lost to changes each week.
Tire defects found at final inspection
Blisters, non-fill, open splices, bead problems and uniformity failures turn up at final finish, uniformity testing or X-ray, long after the tire was built. Tires are repaired, downgraded or scrapped, and the cause, often at the building drum or the press, is never traced back.
In LeanSuite
Issue Management logs each defect where it is found, the QA Matrix costs and ranks it, and Kaizen & Projects runs the root-cause project.
First moves
- Build one defect catalogue with photos and a code for each defect, used by inspection, building and curing alike.
- Pareto defects by code and by the builder machine and press each tire came from.
- Work on the top two with a root-cause analysis at the stage where the defect starts, and add a check there.
Number to watch: Final inspection first pass yield, and scrap as a share of tires cured.
Nip points on mills, calenders and building drums
Open mills and calenders pull in hands and clothing at the nip, building drums turn under power, and curing presses hold steam and hydraulic pressure. Safety trip devices and lockout steps only protect people if they are tested and followed every time.
In LeanSuite
Lean Creator runs lockout procedures as photo-verified isolation steps, and only trained, authorized people can start a lockout.
First moves
- Test every mill and calender safety trip at the start of each shift and record the result and the stopping distance.
- Write a lockout procedure for each mixer, mill, calender and press with a photo of every energy source: electrical, hydraulic, pneumatic, steam and heat.
- Report near misses at nip points and hot surfaces, and remove the reason people reach in.
Number to watch: Safety trip tests done and passed, near misses closed, and the recordable injury rate.
Tire builders who each build a little differently
Splices, ply turn-up, bead setting and centering on the drum depend on the builder. New builders make more defects while they learn, and experienced builders each have their own way of doing it, which shows up later as uniformity and splice defects.
In LeanSuite
LeanSuite keeps a live skills matrix: people qualify through training and digital sign-offs, and gaps show up before they cost you a shift.
First moves
- Write a job breakdown for building each tire family with your best builders, with the key points and the reason for each.
- Train new builders to that breakdown and sign them off on each tire family before they build it alone.
- Track green tire and final defects by builder, and coach to the standard rather than blame.
Number to watch: Defects per builder machine, and builders signed off per tire family.
Steam, nitrogen and compressed air losses
Curing runs on steam, hot water or nitrogen, and the plant runs on compressed air. Leaking traps and valves, uninsulated lines and presses left hot while they wait for a mold waste energy every hour, and nobody sees it until the utility bill.
In LeanSuite
Anyone on the floor can tag a leak or waste in seconds, and it goes to an owner with a due date and is tracked until it is fixed.
First moves
- Walk the curing room and the air system with a leak list, tag every leak and failed trap, and fix them in order of size.
- Put presses that wait for more than a set time into a standby state, with a written restart routine.
- Track energy per tire or per kilogram of rubber each week, on the same board as output and scrap.
Number to watch: Energy per tire or per kilogram, and open leaks.
More small fixes in the production, maintenance and safety sections of the kaizen idea bank.
Tire defects: what they look like and where they start
Most tire defects are found at the end of the line but start much earlier, at building or curing, and some go back to the compound. Code each defect the same way at every stage, and trace it back to the builder machine and press it came from.
Blisters and separations
- What it looks like
- A raised bubble or a gap between layers, at the shoulder, sidewall or under the tread.
- Where it usually starts
- Air, moisture or volatiles trapped between components: lost tack, poor stitching, contamination, blocked vents or undercure.
- Check first
- Component age and tack, stitching on the drum, then mold vents and the cure record.
Non-fill (light areas)
- What it looks like
- Tread or sidewall detail that did not fully form in the mold.
- Where it usually starts
- Too little material where it is needed, trapped air, blocked vents or low shaping and cure pressure.
- Check first
- Green tire weight and component dimensions, then mold vents and press pressures.
Open or poor splices
- What it looks like
- A visible seam or gap where a tread, sidewall, ply or inner liner joins.
- Where it usually starts
- Wrong overlap or cut, poor stitching, or components that have lost their tack.
- Check first
- Splice length and position against the build specification, and component age.
Bead defects
- What it looks like
- A kinked, off-center or exposed bead, or excess rubber at the bead toe.
- Where it usually starts
- Bead setting on the drum, bead wire or apex quality, loading in the press.
- Check first
- Bead setting and centering on the builder, then press loading.
Uniformity failures
- What it looks like
- Radial or lateral force variation or conicity above the limit on the uniformity machine.
- Where it usually starts
- Splices bunched in one place, components off center on the drum, uneven ply tension, uneven loading in the press.
- Check first
- Splice spread and component centering at building, by builder machine.
Cord faults on X-ray
- What it looks like
- Open, wavy or bunched cords in the body ply or belts, or a misplaced belt edge.
- Where it usually starts
- Ply and belt dimensions, how the green tire shaped in the press, component handling.
- Check first
- Belt and ply widths and positions at building, then shaping settings.
Trapped air and bare spots
- What it looks like
- Smooth, shiny patches or pits on the surface where rubber did not meet the mold.
- Where it usually starts
- Blocked or too few vents, mold release or contamination, an uneven green tire surface.
- Check first
- Vent cleanliness and the mold cleaning record.
Backrind
- What it looks like
- Torn, ragged rubber along the mold parting line.
- Where it usually starts
- Compound that starts to cure too soon (scorch), mold temperature, or rubber expanding as the mold opens.
- Check first
- Compound scorch results for the batch, then mold temperature.
Undercure and porosity
- What it looks like
- Soft, spongy or porous rubber, often in the thickest section.
- Where it usually starts
- Cure time, temperature or pressure below the specification, or a fault in steam or nitrogen supply.
- Check first
- The press cure record for that tire against the cure specification.
Molded rubber parts share most of these: non-fill, blisters, backrind, flash and trapped air have the same roots in compound, venting and cure. Your tire and compound specifications come first.
A 90-day starting plan
One line or product family, two problems, measured before and after. The point of the first 90 days is a result the plant believes and a method it can repeat, not a plant-wide program.
The 90 days, with the gate that ends each stage
- Days 1 to 30Measure the mixer and one press lineDone when: You have two weeks of OEE, mold change time and defect data, and two problems with owners.
- Days 31 to 60Fix the two biggest lossesDone when: Each change has a before-and-after number and a written standard.
- Days 61 to 90Hold the gains and spread themDone when: The gains have held for a month and the next press row has its baseline.
Days 1 to 30
Measure the mixer and one press line
See where the plant loses time and tires at its two bottlenecks.
- Name an owner for the mixer and for one row of curing presses.
- Record OEE on the mixer and the presses by shift, with a reason code for every stop.
- Film one curing mold change and list its steps and times.
- Start one defect catalogue and Pareto final inspection defects for two weeks.
- Choose the two biggest losses to work on first.
Days 31 to 60
Fix the two biggest losses
Attack the two losses and prove the change with numbers.
- Start the daily care routine on the mixer and the mills.
- Run the new mold change sequence from a checklist, with molds preheated before the stop.
- Run a root-cause analysis on the top tire defect at the stage where it starts.
- Test mill and calender safety trips every shift and record the results.
Days 61 to 90
Hold the gains and spread them
Keep the new standards, train builders to one method and start the next area.
- Audit the care routines and mold change checklist on every shift.
- Write job breakdowns for the main tire families and start signing builders off.
- Run a leak walk in the curing room and start tracking energy per tire.
- Share the results and measure the next press row.
The KPIs to track
Track them per line and shift, on a board the team sees every day. Set targets from your own baseline, not from someone else's plant.
| KPI | What it tells you | How to measure it | Free help |
|---|---|---|---|
| Mixer and press OEE | How much of the planned time the mixer and each curing press make good output at the standard cycle. | Availability times performance times quality. For the mixer, count good batches at the standard mix cycle; for a press, good tires at the standard cure time. | OEE calculatorOEE tracking sheet |
| Final inspection first pass yield | The share of tires that pass final inspection, uniformity and X-ray without repair. | Tires passing first time divided by tires inspected, per day and per tire size. | First pass yield (FPY) calculator |
| Scrap rate | The share of cured tires, or kilograms of compound, that cannot be sold. | Tires scrapped divided by tires cured, plus compound scrapped as a share of compound mixed. | Scrap rate calculator |
| Mold change time | How long a curing press makes no good tires during a change. | From the last good tire of one size to the first good tire of the next, for every change. | SMED changeover calculatorSMED changeover worksheet |
| Batches released first time | How steady the mixing is, before problems reach the next stage. | Batches that pass rheometer and viscosity checks first time divided by batches mixed, per compound. | X-bar and R control chart template |
| Recordable injury rate (TRIR) | How often people are hurt badly enough to record. | Recordable cases times 200,000 divided by hours worked. | TRIR and DART rate calculator |
| Energy per tire | How much steam, gas and power each tire takes, and whether waste is falling. | Energy used in a week, from the utility meters, divided by tires cured that week; use kilograms of rubber for molded parts. | Energy use and EnPI tracker |
Worked example: first pass yield and the defects behind it
One day of final inspection in a tire plant. The numbers are illustrative, chosen to show how first pass yield, scrap and a defect Pareto fit together; use your own inspection data.
The calculation, step by step
Example numbersTires cured and inspected
One day, all sizes.
2,400
Passed first time
No repair, no second test.
2,280
Failed first time
2,400 less 2,280. Of these, 72 were repaired and passed, and 48 were scrapped.
120
First pass yield
2,280 ÷ 2,400
95.0%
Scrap rate
48 ÷ 2,400
2.0%
Defect Pareto of the 120
Blisters 40, uniformity 35, non-fill 25, all others 20.
120
Share of failures from the top two
(40 + 35) ÷ 120
62.5%
If blisters and uniformity failures were halved
Half of 75 is 37.5, so about 37 more tires pass first time: (2,280 + 37) ÷ 2,400.
96.5%
Standards and regulations plants work to
Tire plants answer to vehicle safety law and to their customers; molded and extruded rubber plants mostly to their customers. These are the ones most plants meet, named so you know what applies; each standard's own text sets its requirements.
IATF 16949
The automotive quality management standard for tire and rubber parts makers that supply vehicle makers, with control plans, PFMEA and production part approval.
FMVSS 139
The U.S. federal motor vehicle safety standard for new tires on light vehicles, which sets the performance tests tires must pass.
DOT tire identification and recordkeeping (49 CFR 574)
The rules for the tire identification number molded into each tire, and for the records that make recalls possible.
UN ECE tire regulations
Regulations such as R30, R54 and R117 for tires sold in Europe and other countries that apply them, covering approval tests, rolling resistance, wet grip and noise.
OSHA 29 CFR 1910.216
OSHA's standard for mills and calenders in the rubber and plastics industries, covering safety trip controls and stopping distances.
OSHA lockout (29 CFR 1910.147)
Control of hazardous energy when mixers, mills, calenders and presses are serviced, cleaned or changed over.
ISO 9001 and ISO 14001
The quality and environmental management standards most rubber plants are certified to.
Software does not make a plant compliant with any of these, and no lean routine replaces tire testing. The routines in this playbook produce the records auditors ask for: checks done, findings closed and people trained.
By the numbers
Public figures for this industry or for the wider sector it belongs to, each linked to the report or government table it comes from and checked against it on October 9, 2026. More in our lean manufacturing statistics and benchmark charts.
2.8
Plastics and rubber products manufacturing, which includes tire plants, recorded 2.8 injury and illness cases per 100 full-time workers in 2024, against 2.7 for all manufacturing.
Total recordable cases per 100 full-time workers, U.S. private industry, 2024 data from the Survey of Occupational Injuries and Illnesses. The group covers plastics and rubber products together (NAICS 326); tires are part of it.
Source: U.S. Bureau of Labor Statistics, Table 1. Incidence rates of nonfatal occupational injuries and illnesses by industry and case types, 2024 (2024 data, table updated January 22, 2026)
1.8
In the same group, 1.8 cases per 100 full-time workers in 2024 were serious enough to mean days away from work, job restriction or transfer.
Total recordable cases per 100 full-time workers, U.S. private industry, 2024 data from the Survey of Occupational Injuries and Illnesses. The group covers plastics and rubber products together (NAICS 326); tires are part of it.
Source: U.S. Bureau of Labor Statistics, Table 1. Incidence rates of nonfatal occupational injuries and illnesses by industry and case types, 2024 (2024 data, table updated January 22, 2026)
Injury and illness rate by industry, 2024
- Motor vehicles5.6
- Beverage and tobacco3.7
- Furniture3.5
- Food3.3
- Primary metals3.3
- Nonmetallic mineral products, incl. glass3.3
- Fabricated metal products3.2
- Transportation equipment3.2
- Motor vehicle parts2.9
- Plastics and rubber products2.8This industry
- HVAC and refrigeration2.4
- Paper2.4
- Machinery2.3
- All private industry2.3
- Electrical equipment and appliances2.0
- Printing1.6
- Chemicals1.6
Total recordable cases per 100 full-time workers, 2024: Motor vehicles 5.6, Beverage and tobacco 3.7, Furniture 3.5, Food 3.3, Primary metals 3.3, Nonmetallic mineral products, incl. glass 3.3, Fabricated metal products 3.2, Transportation equipment 3.2, Motor vehicle parts 2.9, Plastics and rubber products 2.8, All manufacturing 2.7, HVAC and refrigeration 2.4, Paper 2.4, Machinery 2.3, All private industry 2.3, Electrical equipment and appliances 2, Printing 1.6, Chemicals 1.6.
Free templates, calculators and buyer's guides
Templates (24)
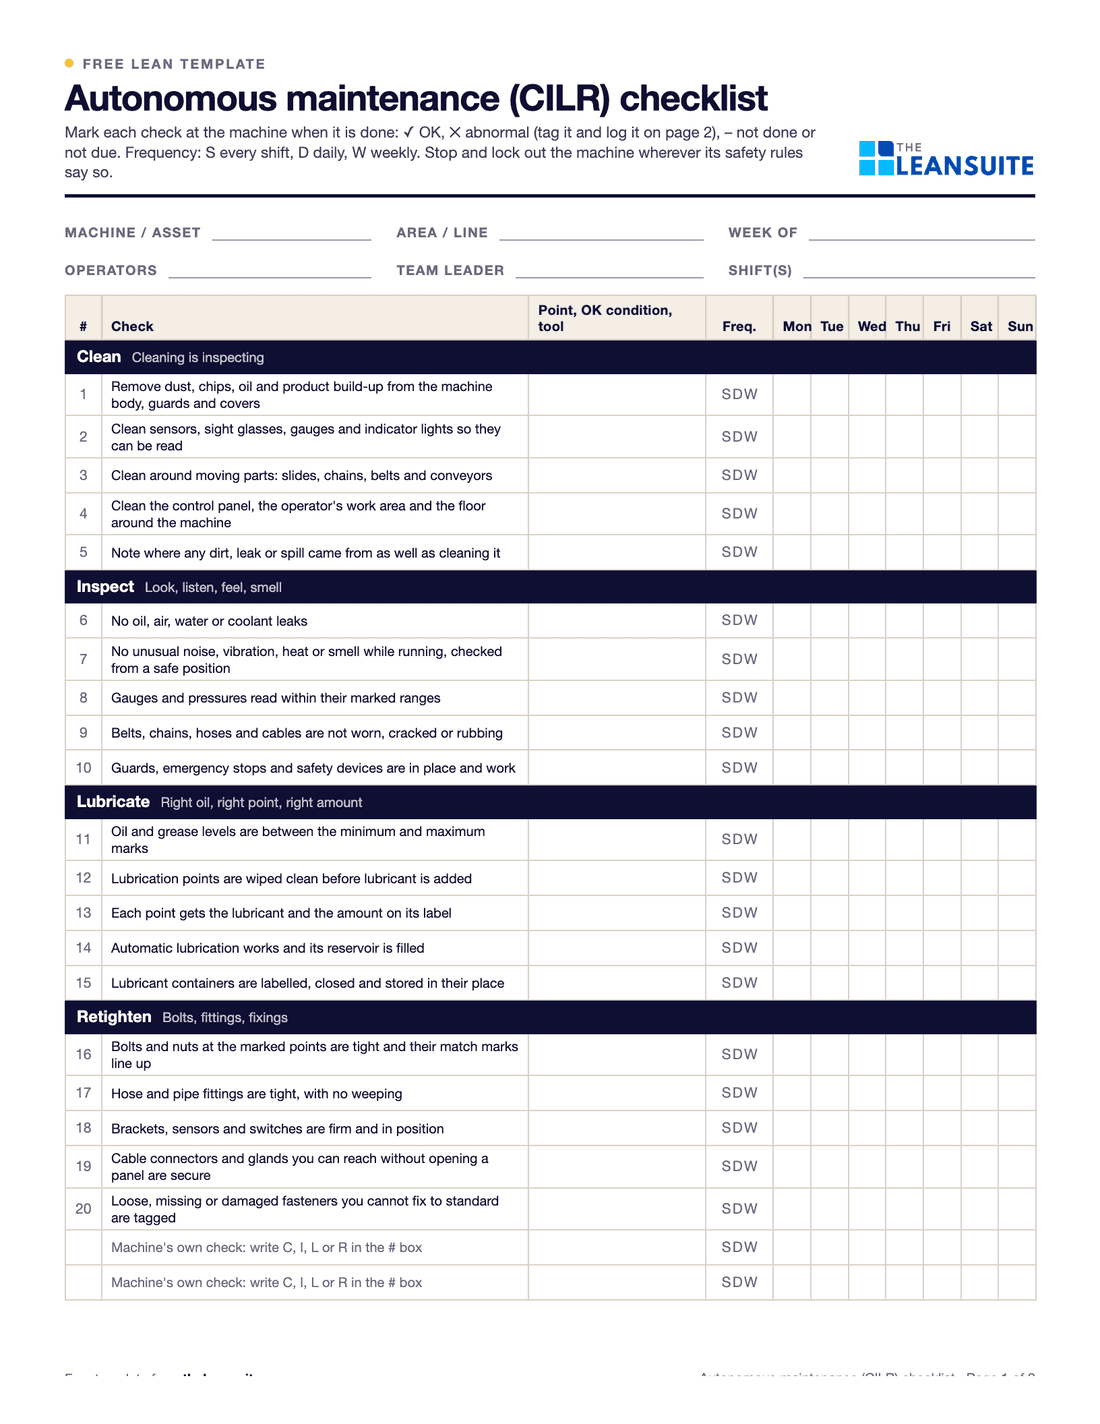 PDF and ExcelAutonomous maintenance (CILR) checklist20 clean, inspect, lubricate and retighten checks with a box per day, an abnormality log and sign-off.
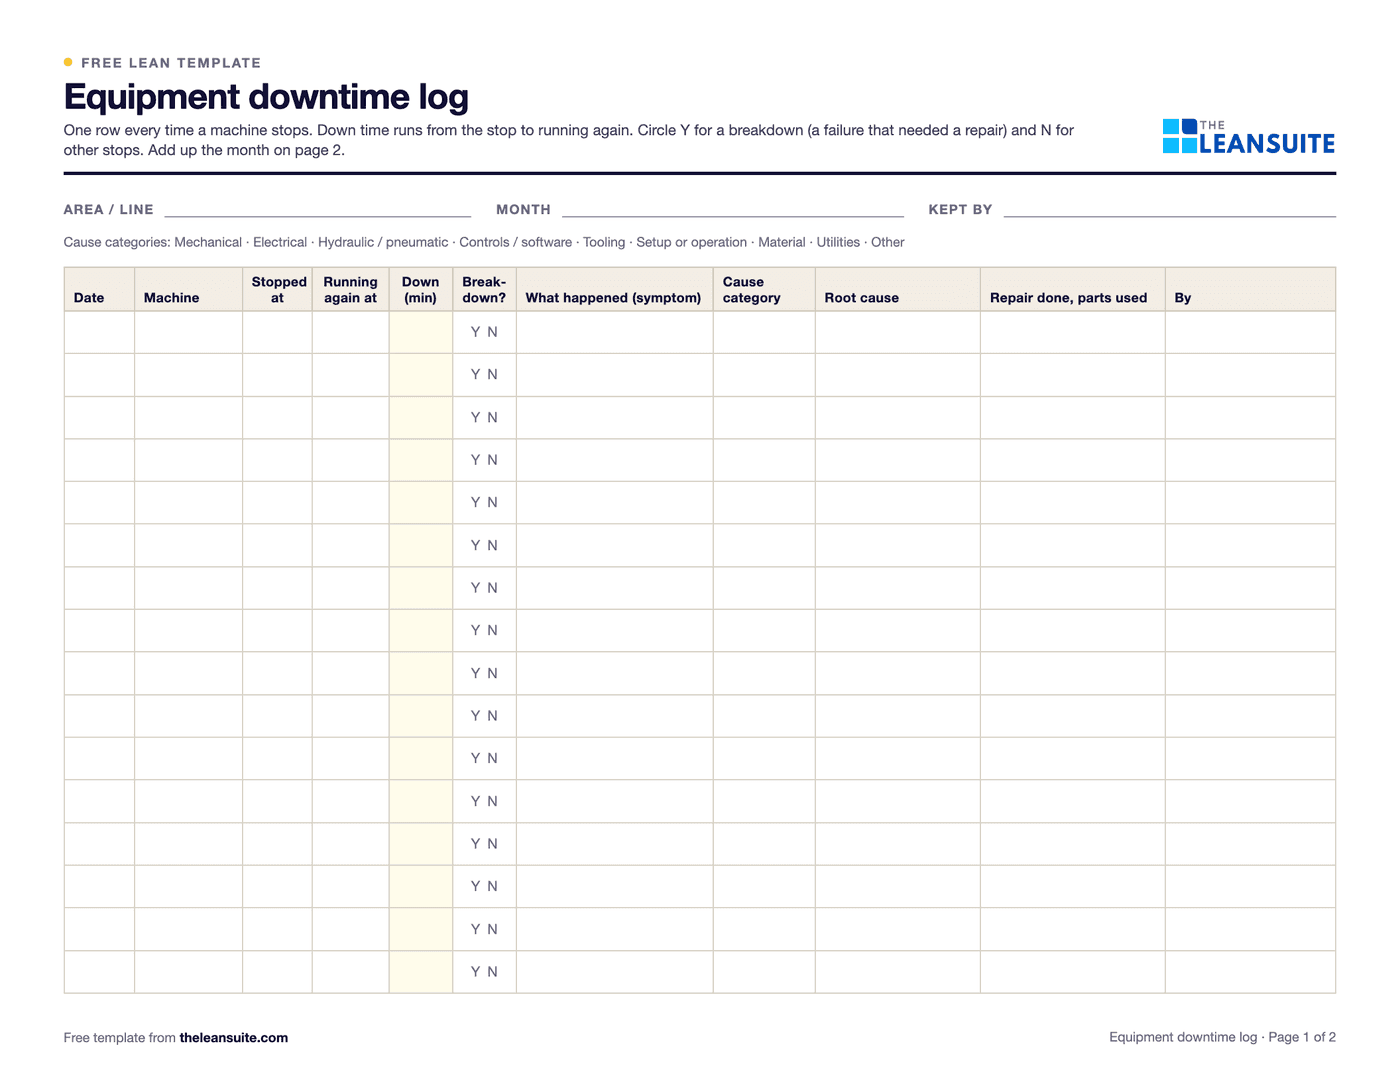 PDF and ExcelEquipment downtime log (MTTR and MTBF)A breakdown and downtime log, with MTTR, MTBF and downtime by machine and cause worked out in Excel.
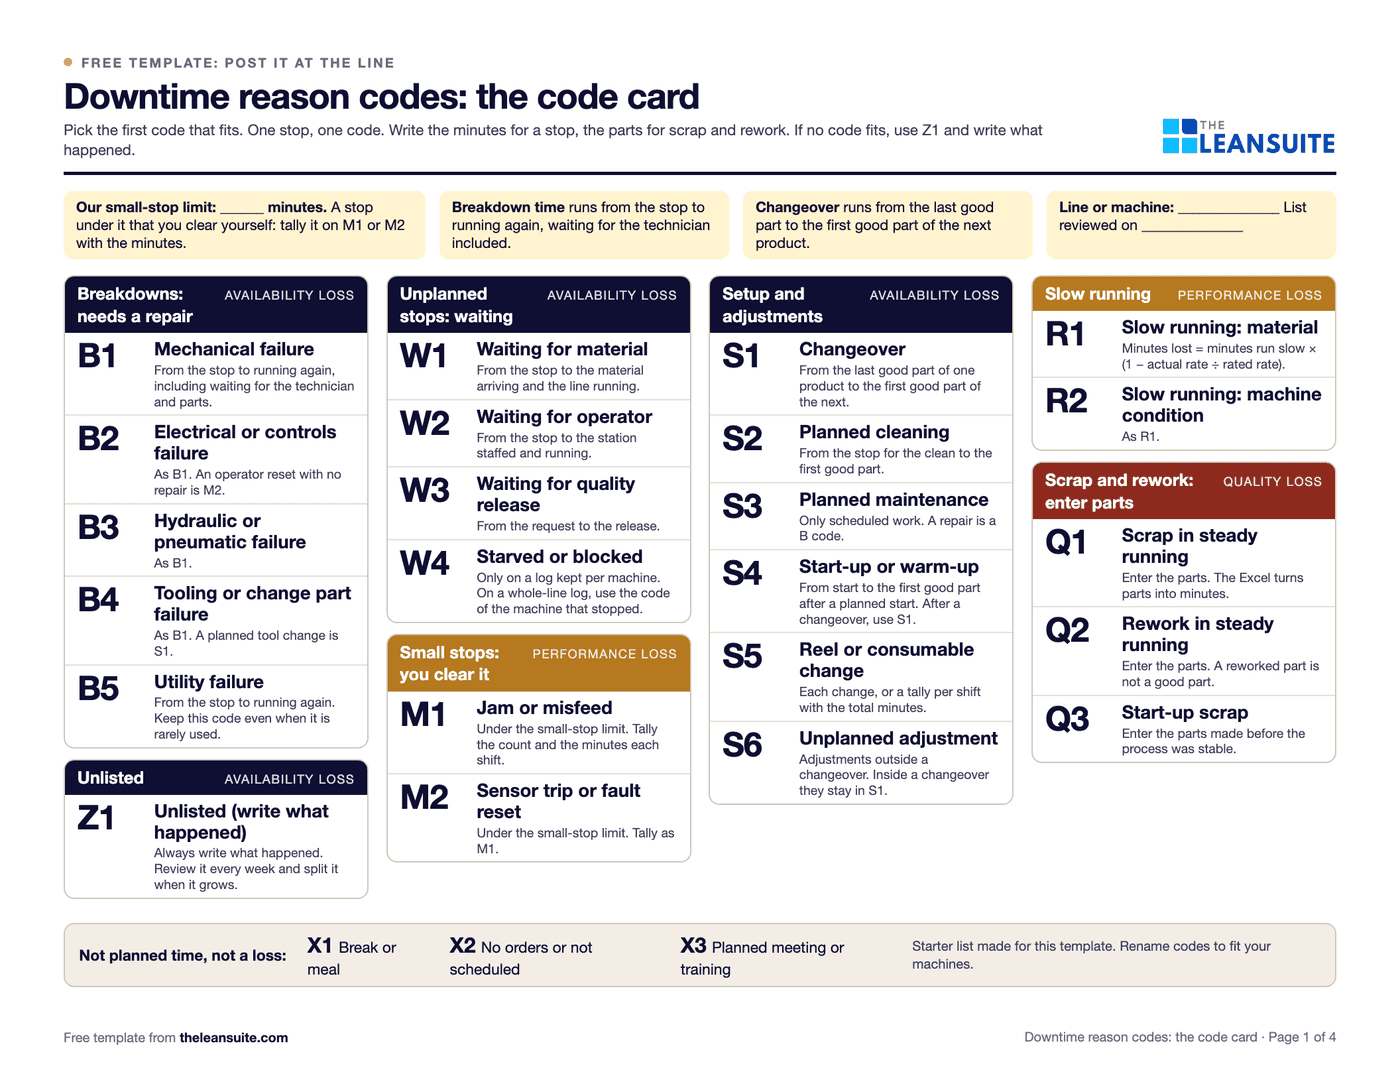 PDF and ExcelDowntime reason codes template26 starter codes mapped to the six big losses, a log with drop-downs, a Pareto by code and by loss, and a code card for the line.
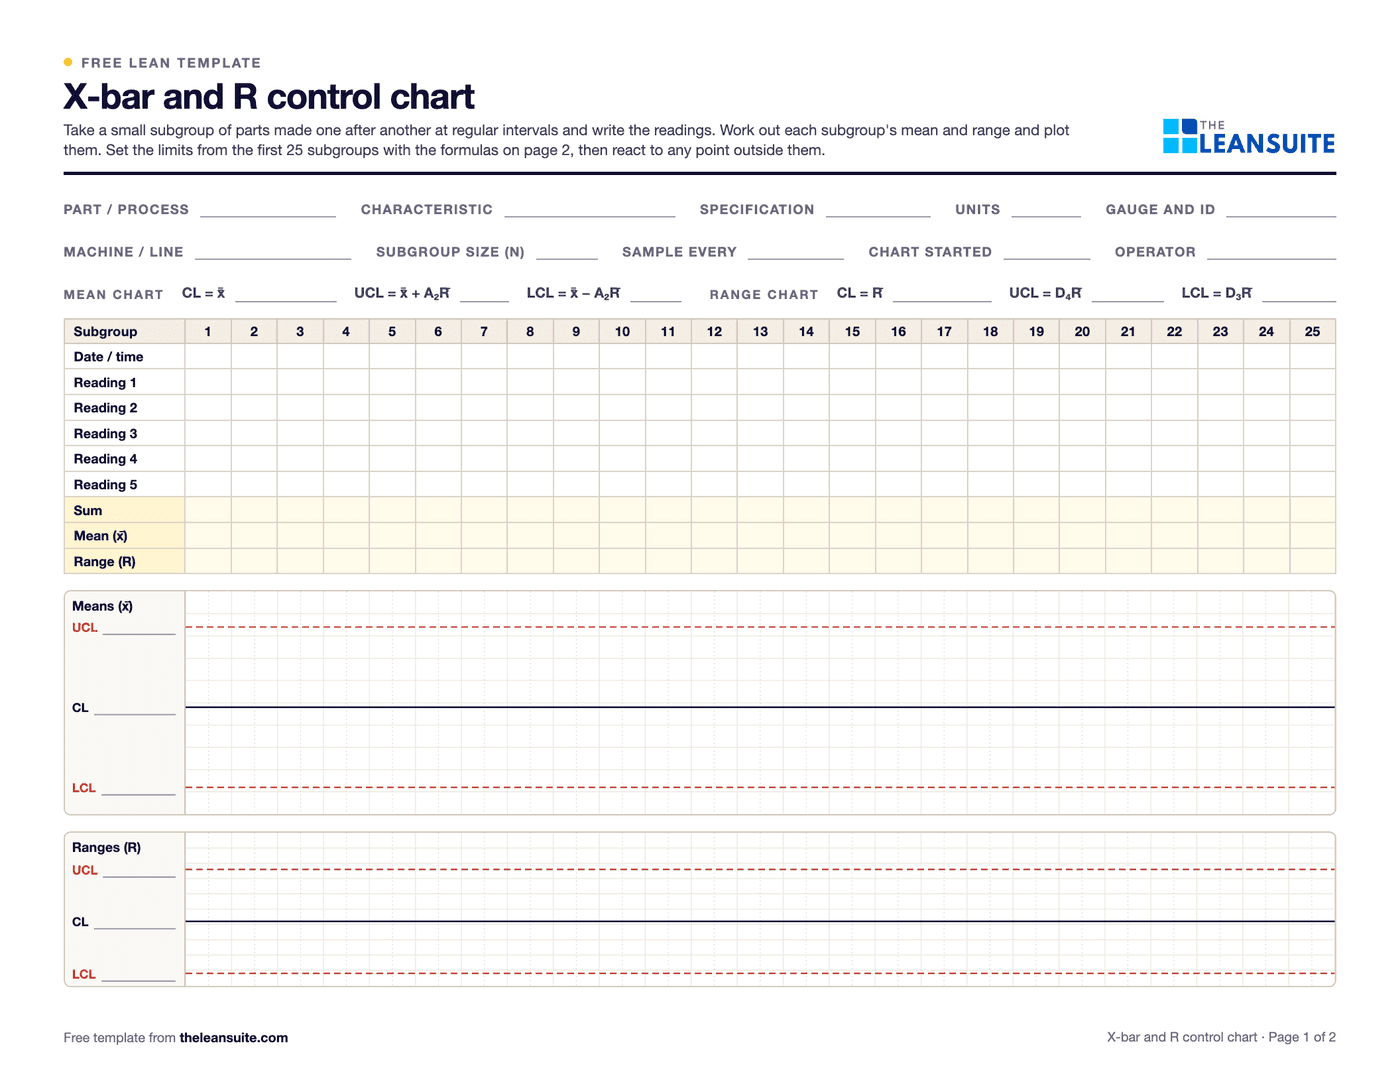 PDF and ExcelX-bar and R control chart template25 subgroups with means and ranges, control limits from A2, D3 and D4, signal flags, both charts and a reaction log.
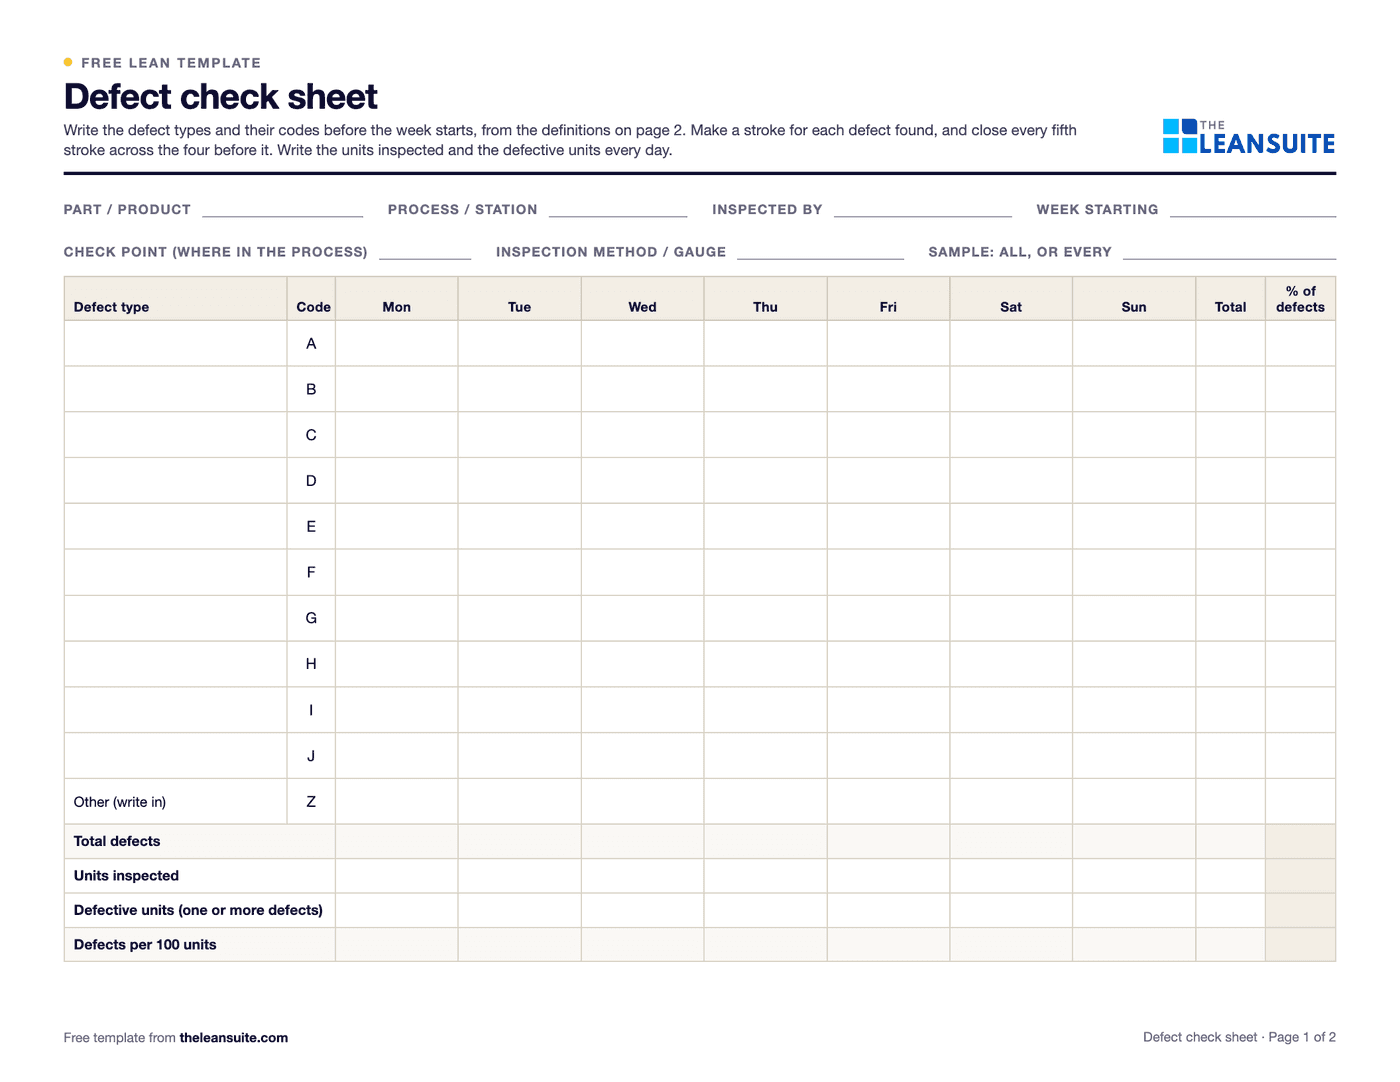 PDF and ExcelDefect check sheetTally defects by type and day, with units inspected, defect rates, a location sheet and the week's Pareto.
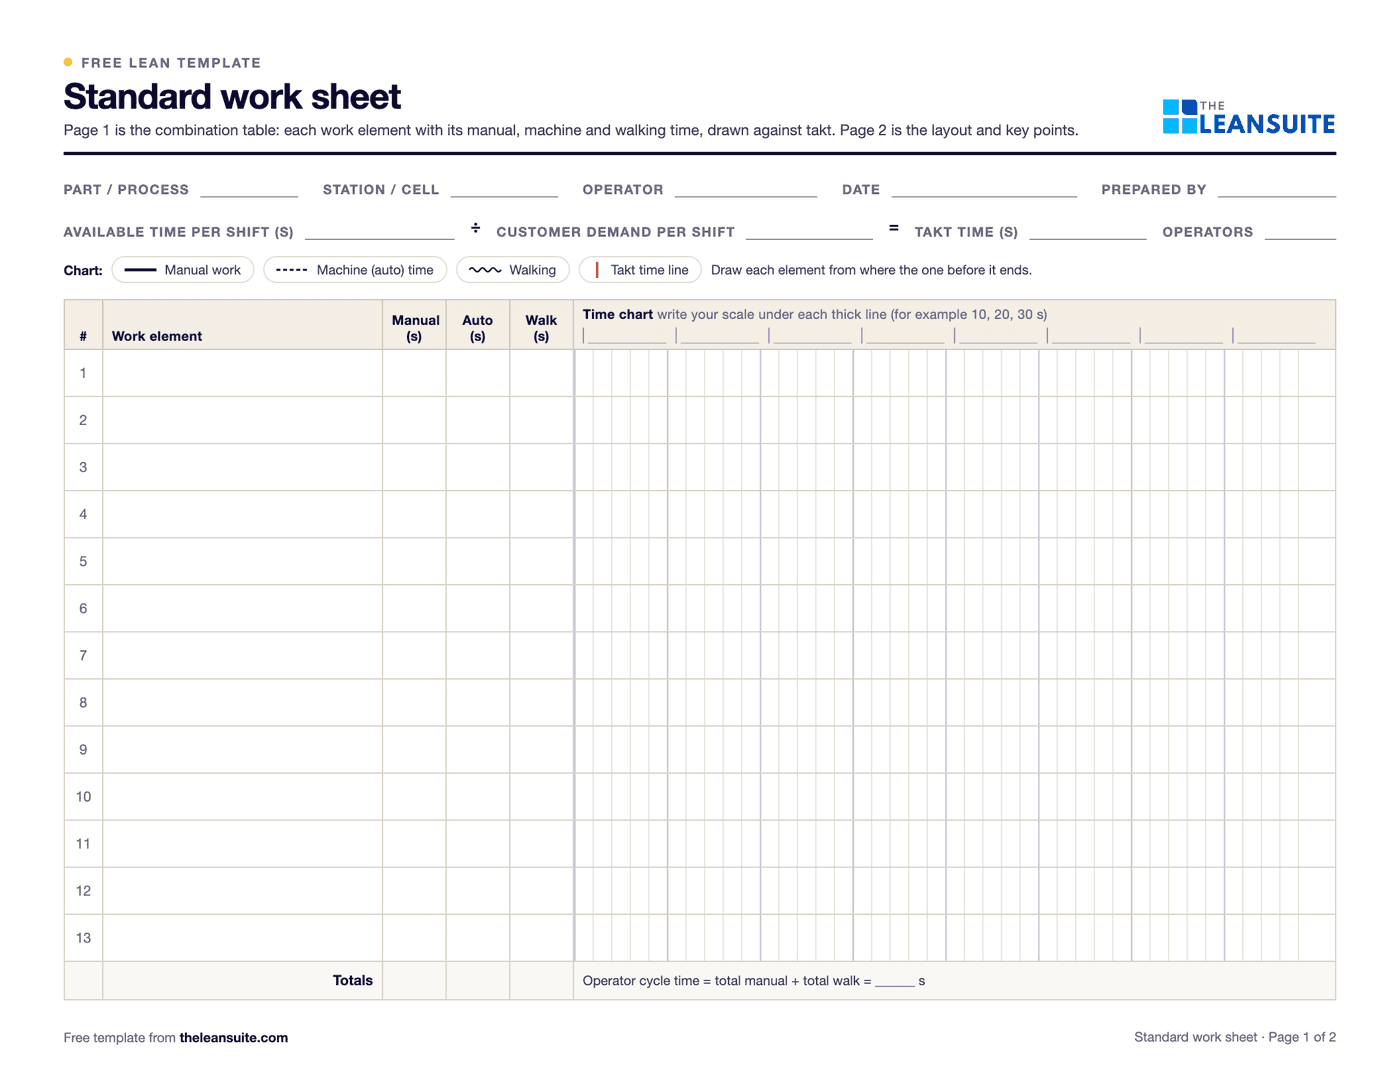 PDF and Excel and WordStandard work sheet templateTakt time, each element's manual, machine and walk time on a time chart, key points and standard WIP.
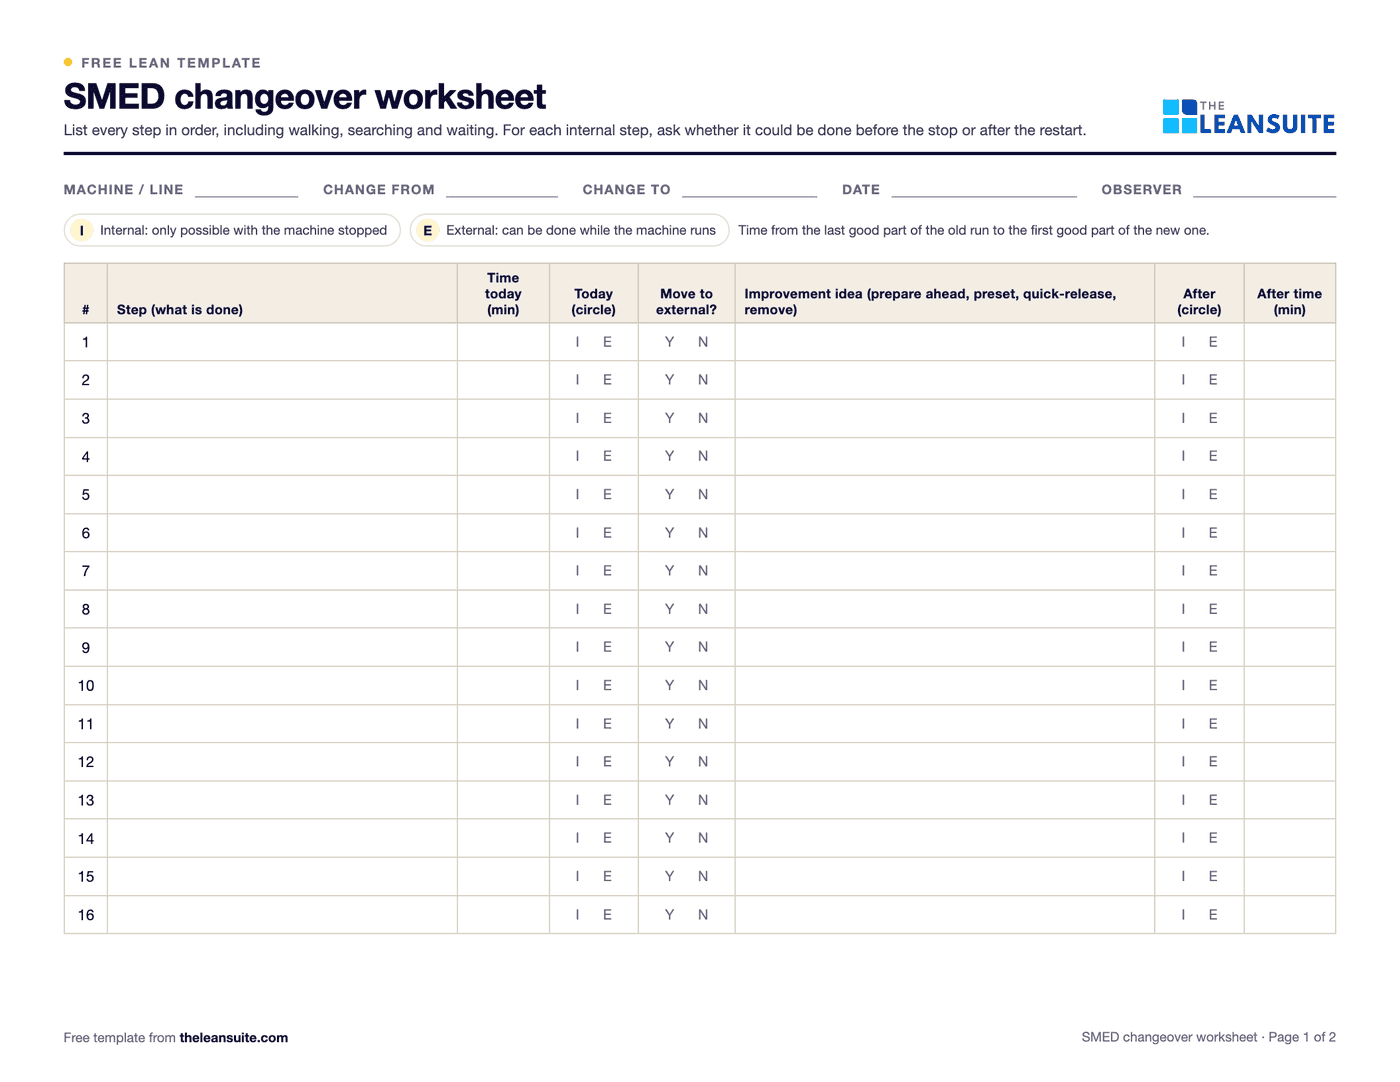 PDF and ExcelSMED changeover worksheetChangeover steps with times, internal or external, what can move, ideas and before/after totals.
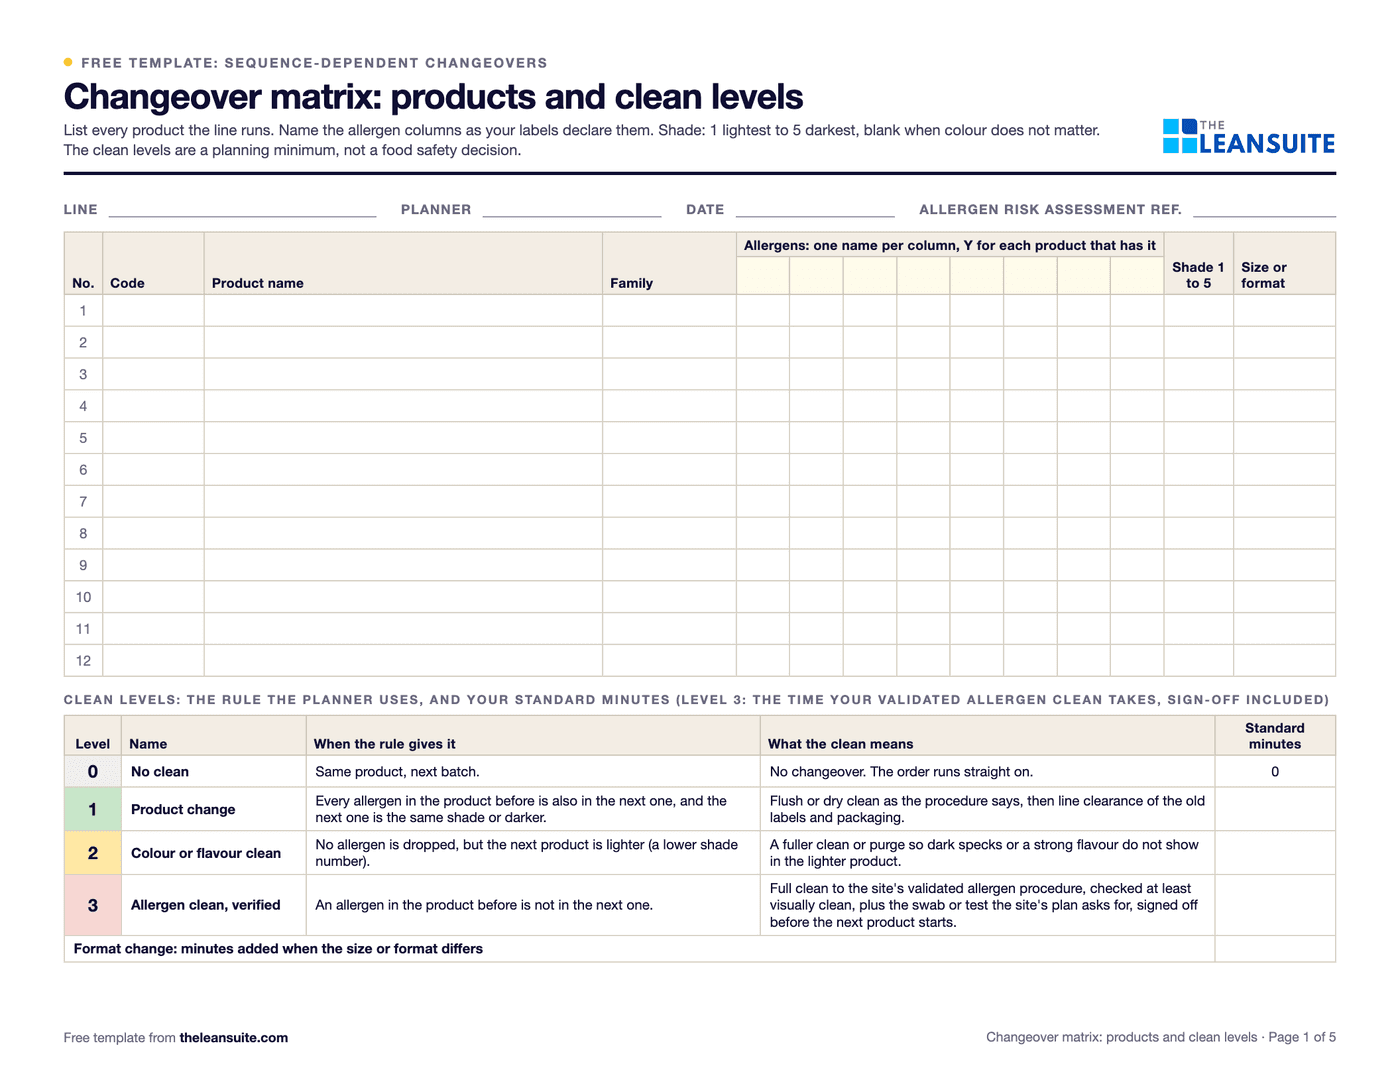 PDF and ExcelChangeover matrix templateA from-to matrix of changeover minutes with the clean each transition needs (allergen, colour, format), and a weekly planner that totals the order and suggests a shorter one.
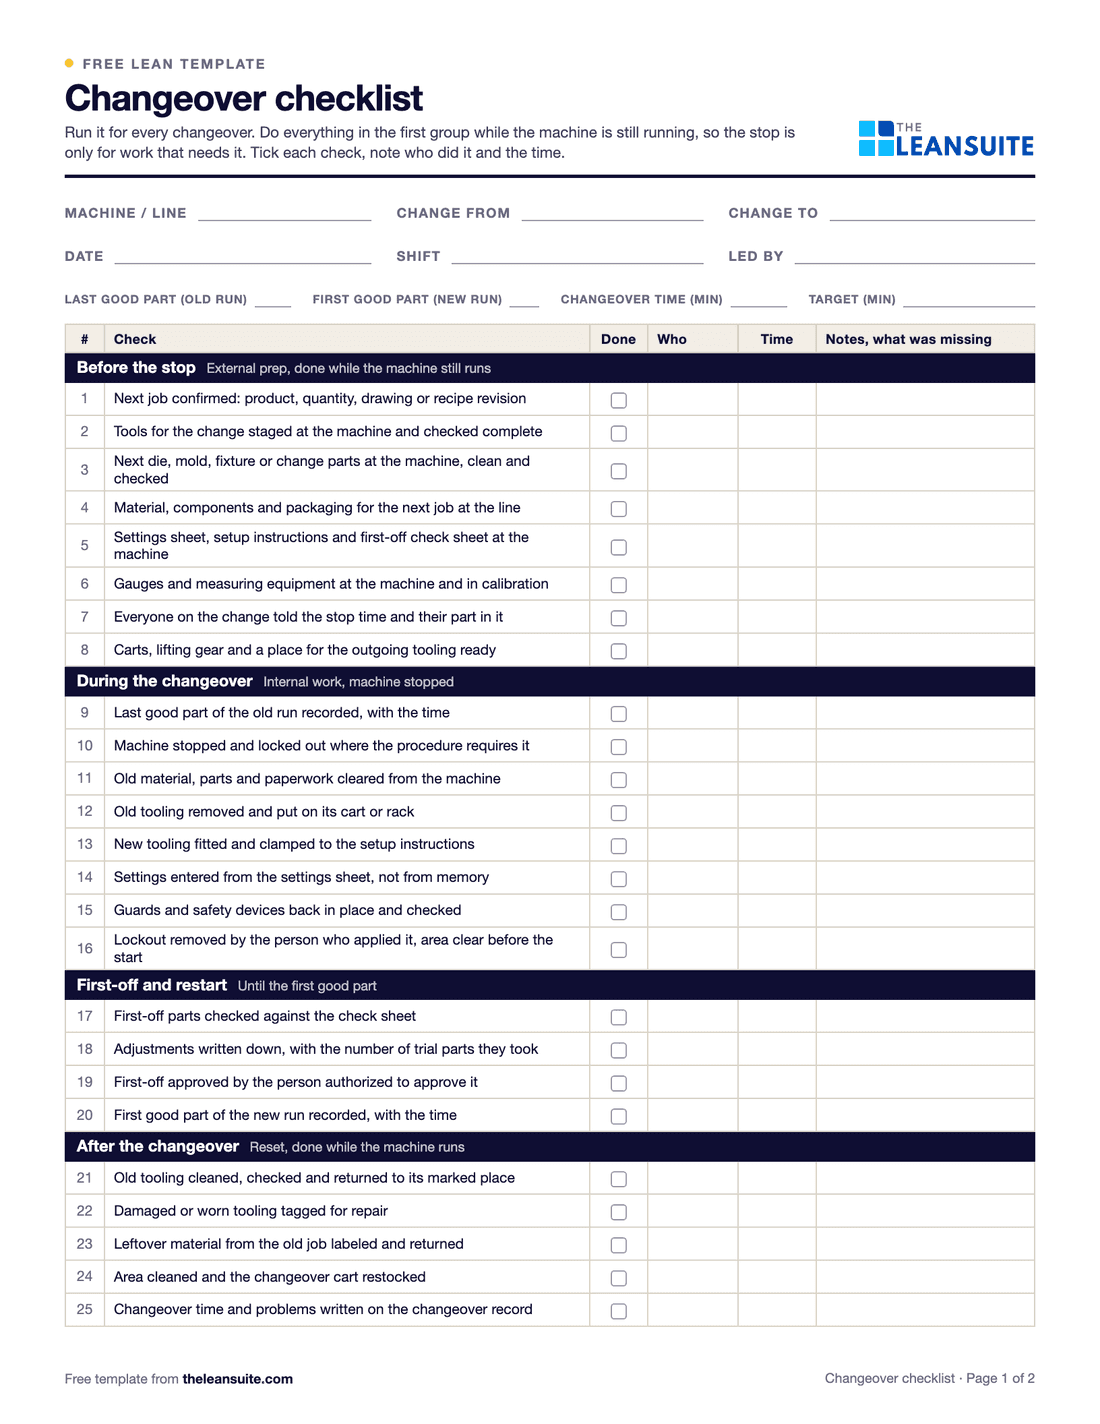 PDF and ExcelChangeover checklist25 checks for every changeover, a record of planned and actual times, and a log of changeover time against target.
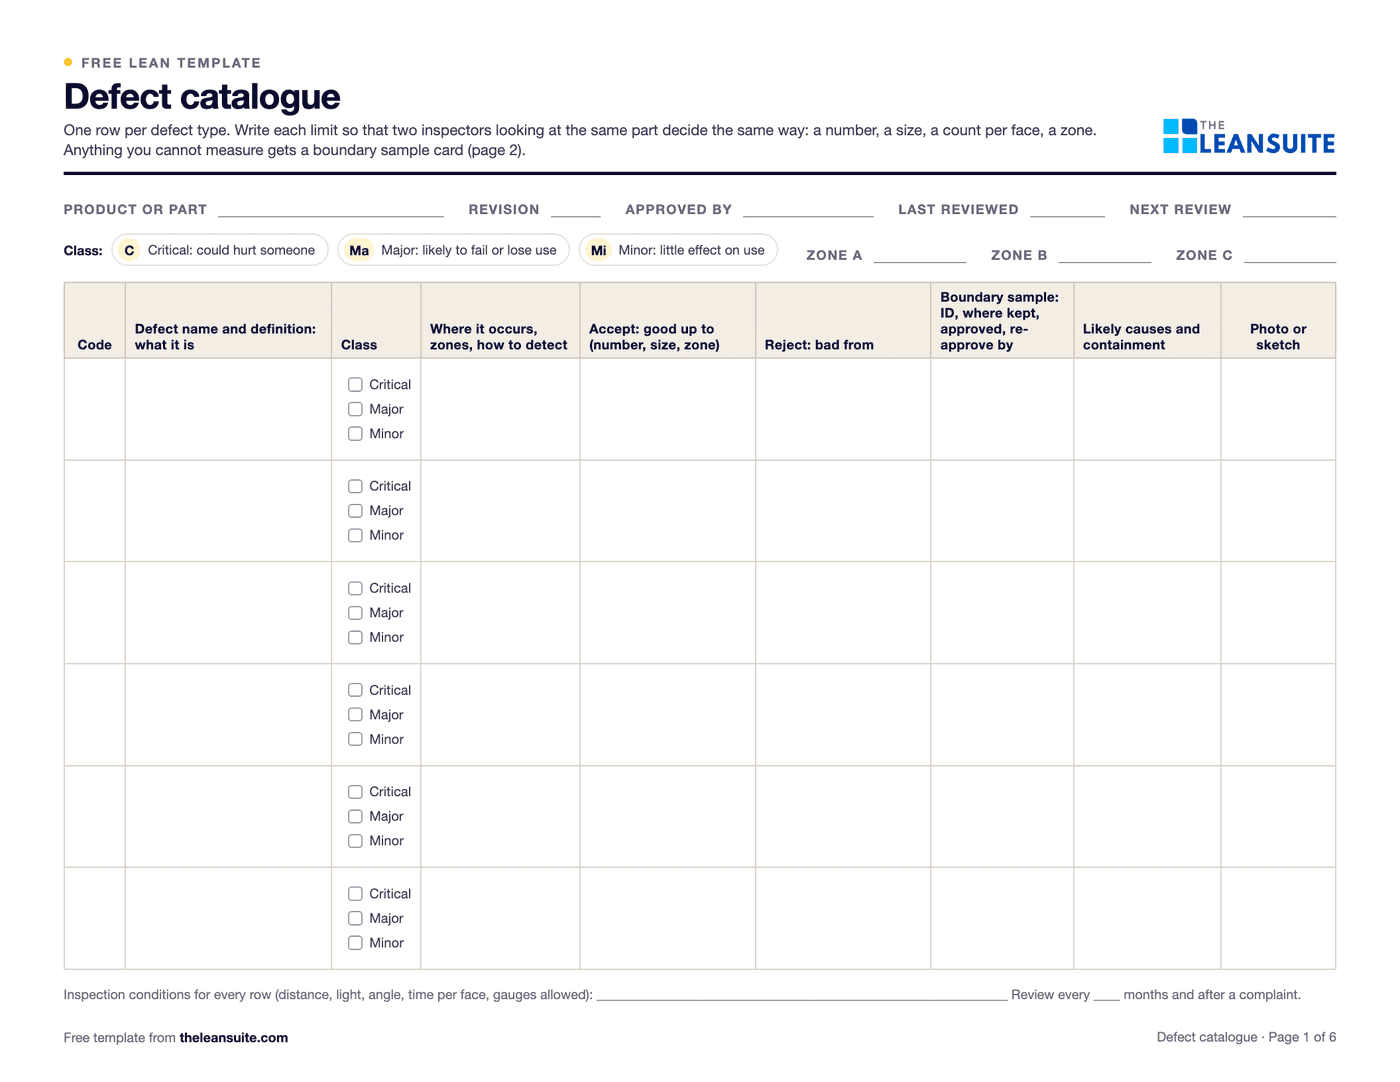 PDF and ExcelDefect catalogue template with boundary samplesEvery defect with a definition, a class and the reason for it, measured accept and reject limits by zone, boundary samples, a defect log with DPU and Pareto, and an inspector agreement check.
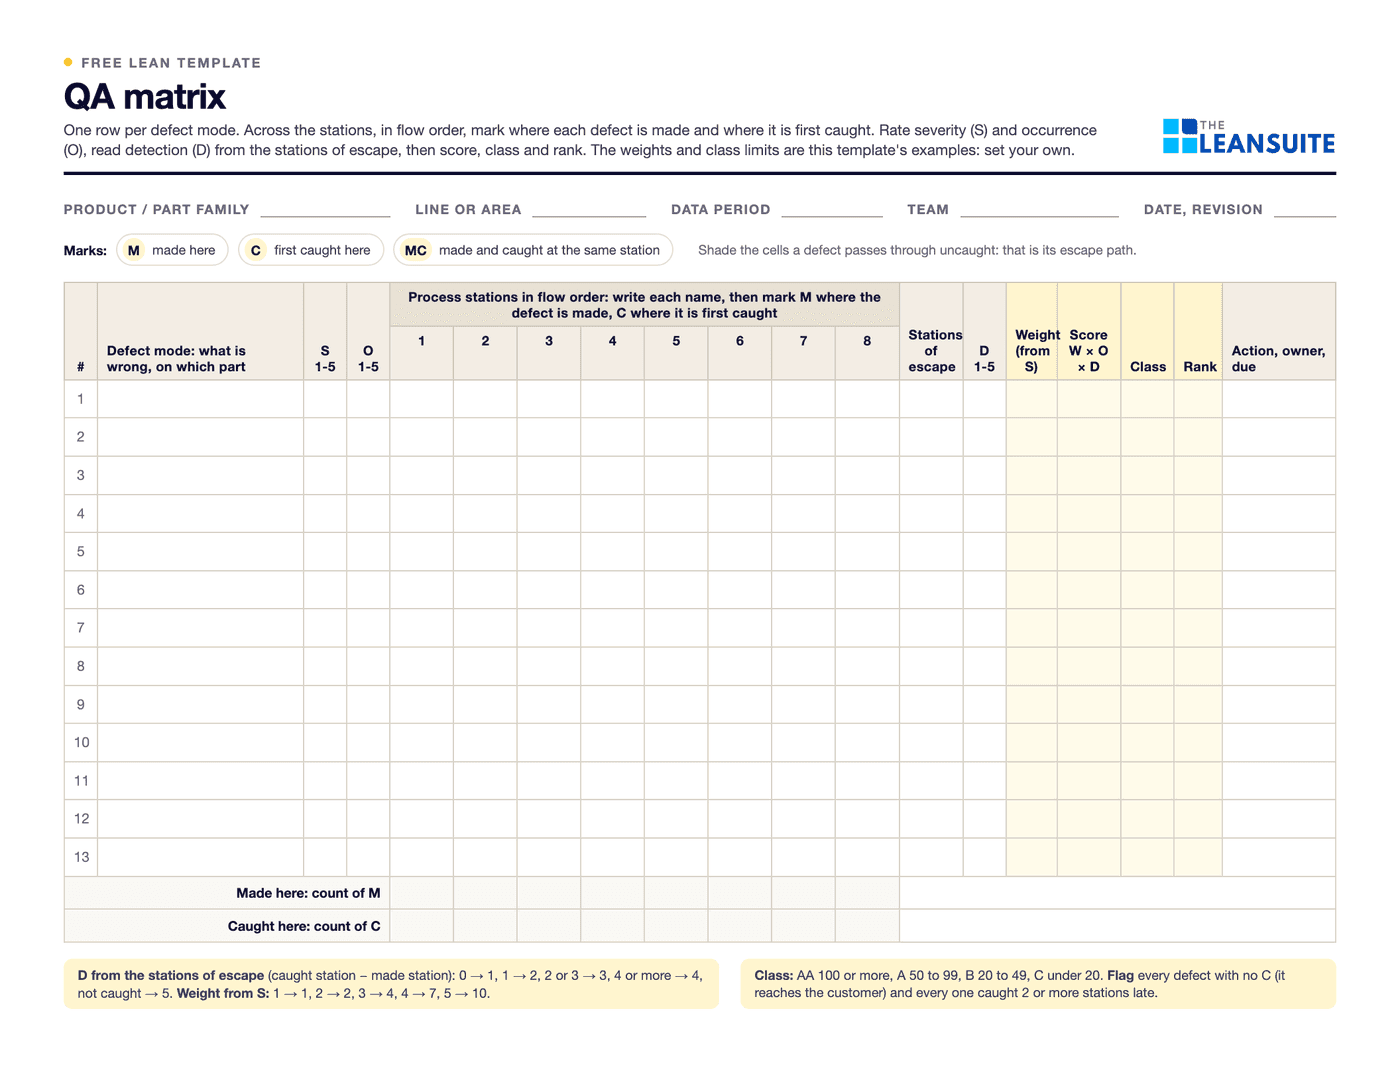 PDF and ExcelQA matrix templateDefect modes against stations in flow order: where each is made and first caught, a weight × occurrence × detection score, an AA to C class and the escapes flagged.
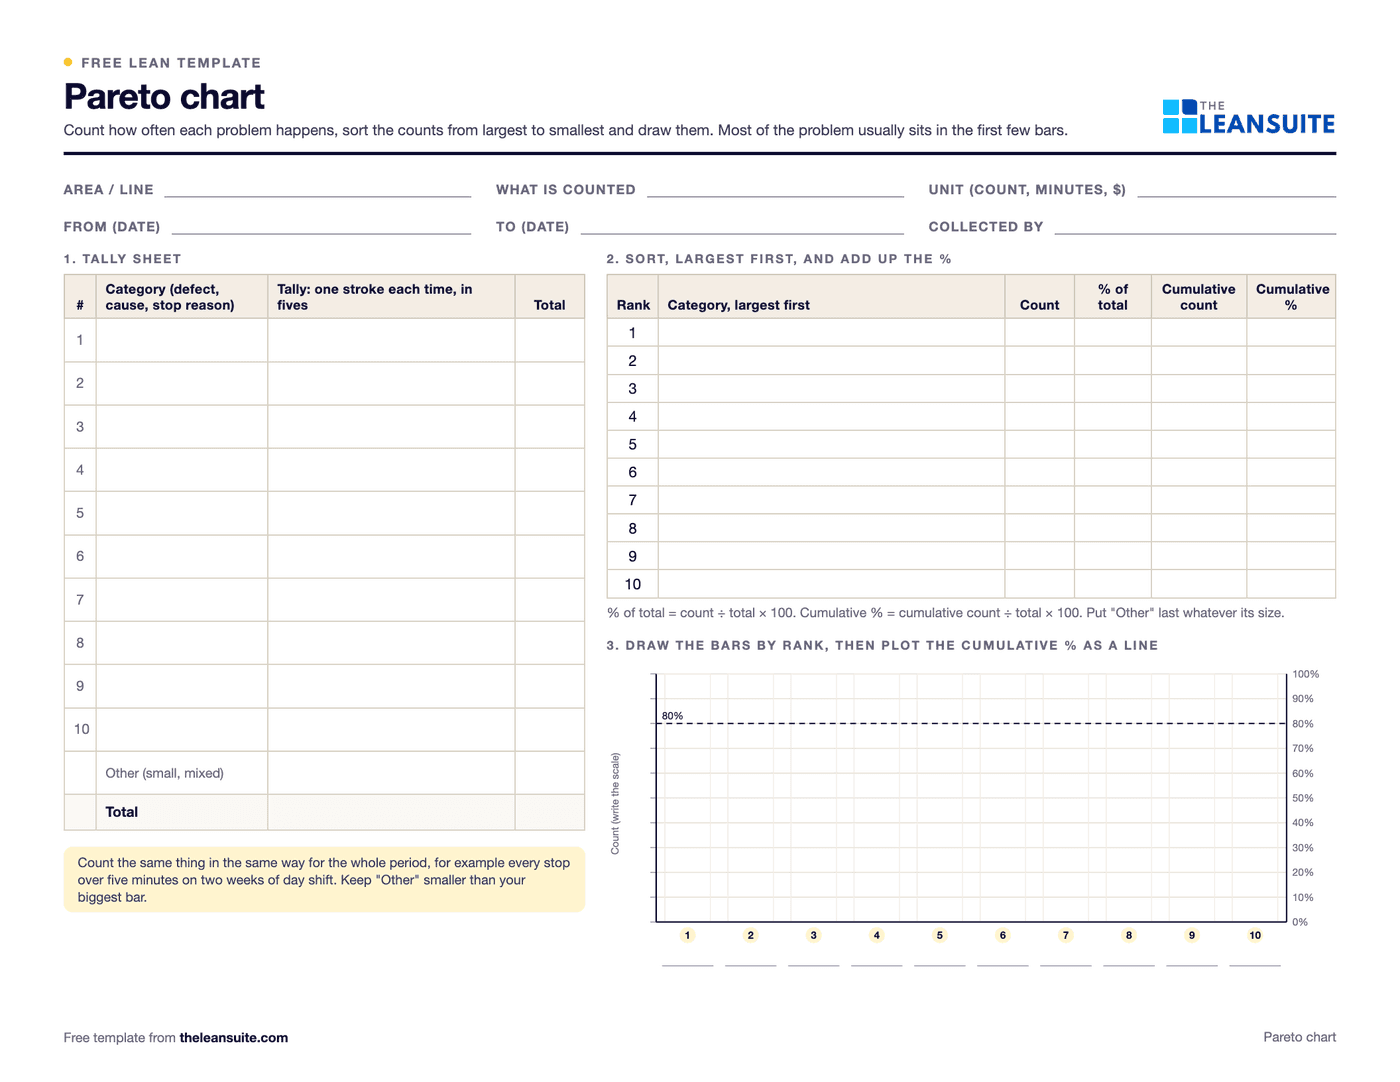 PDF and ExcelPareto chart templateA tally sheet, the Pareto by count and by cost with the cumulative line and the 80% cut, and a before and after comparison. Excel sorts and draws it.
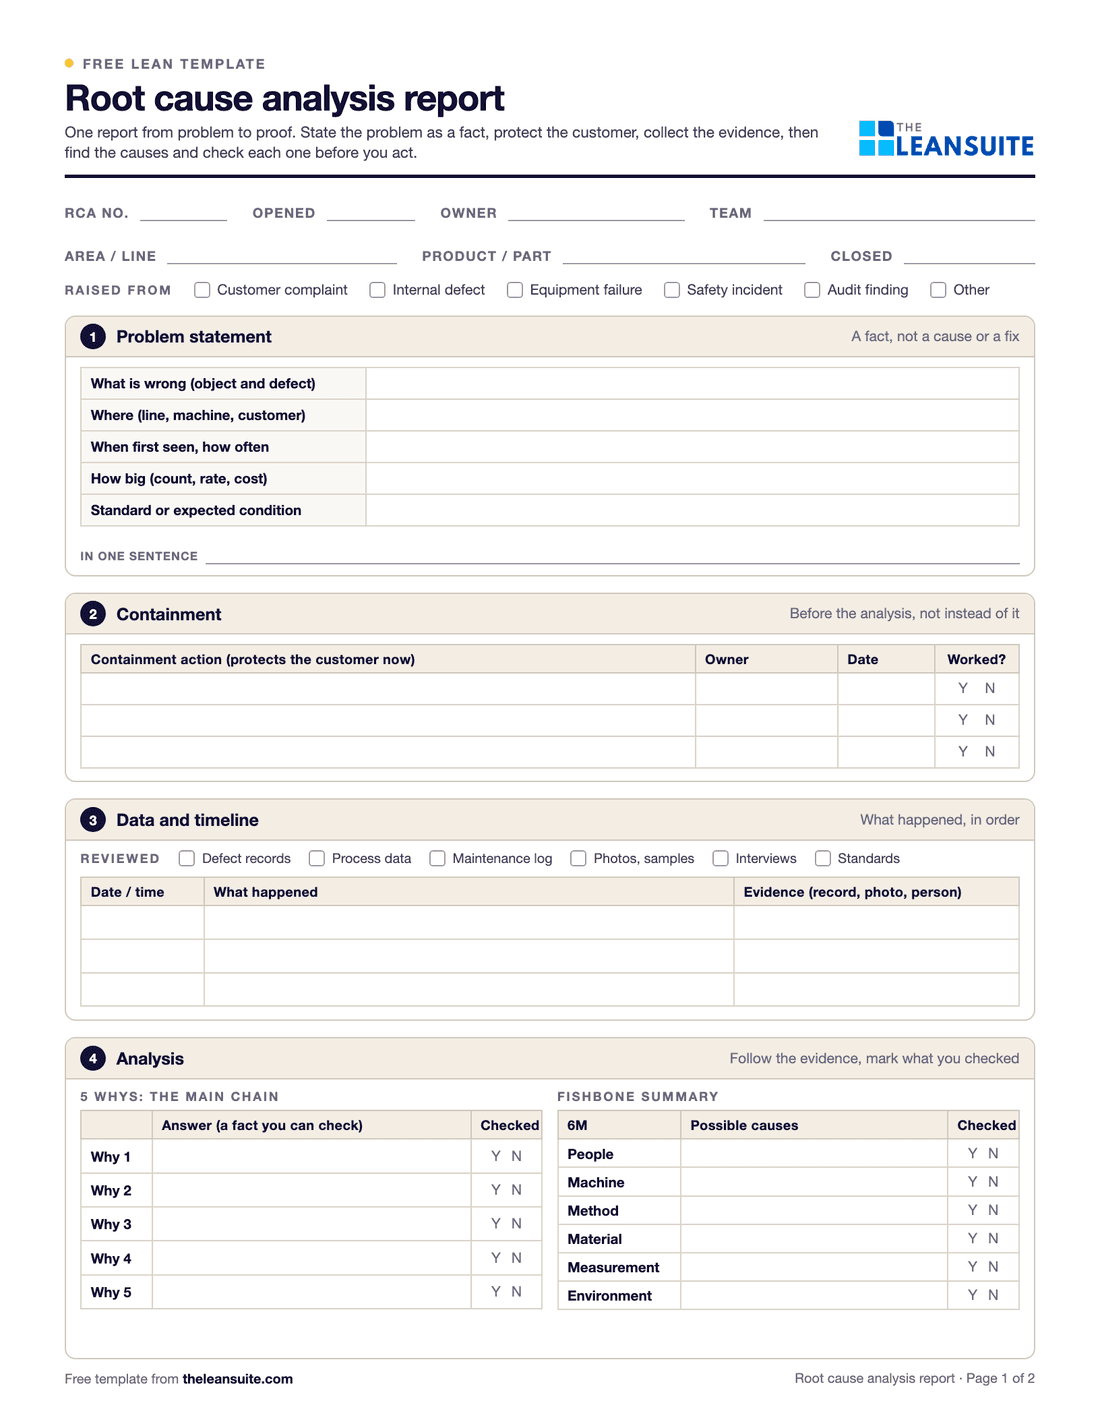 PDF and ExcelRoot cause analysis templateOne report from problem statement to proof: containment, evidence, analysis, verified causes, actions and the effectiveness check.
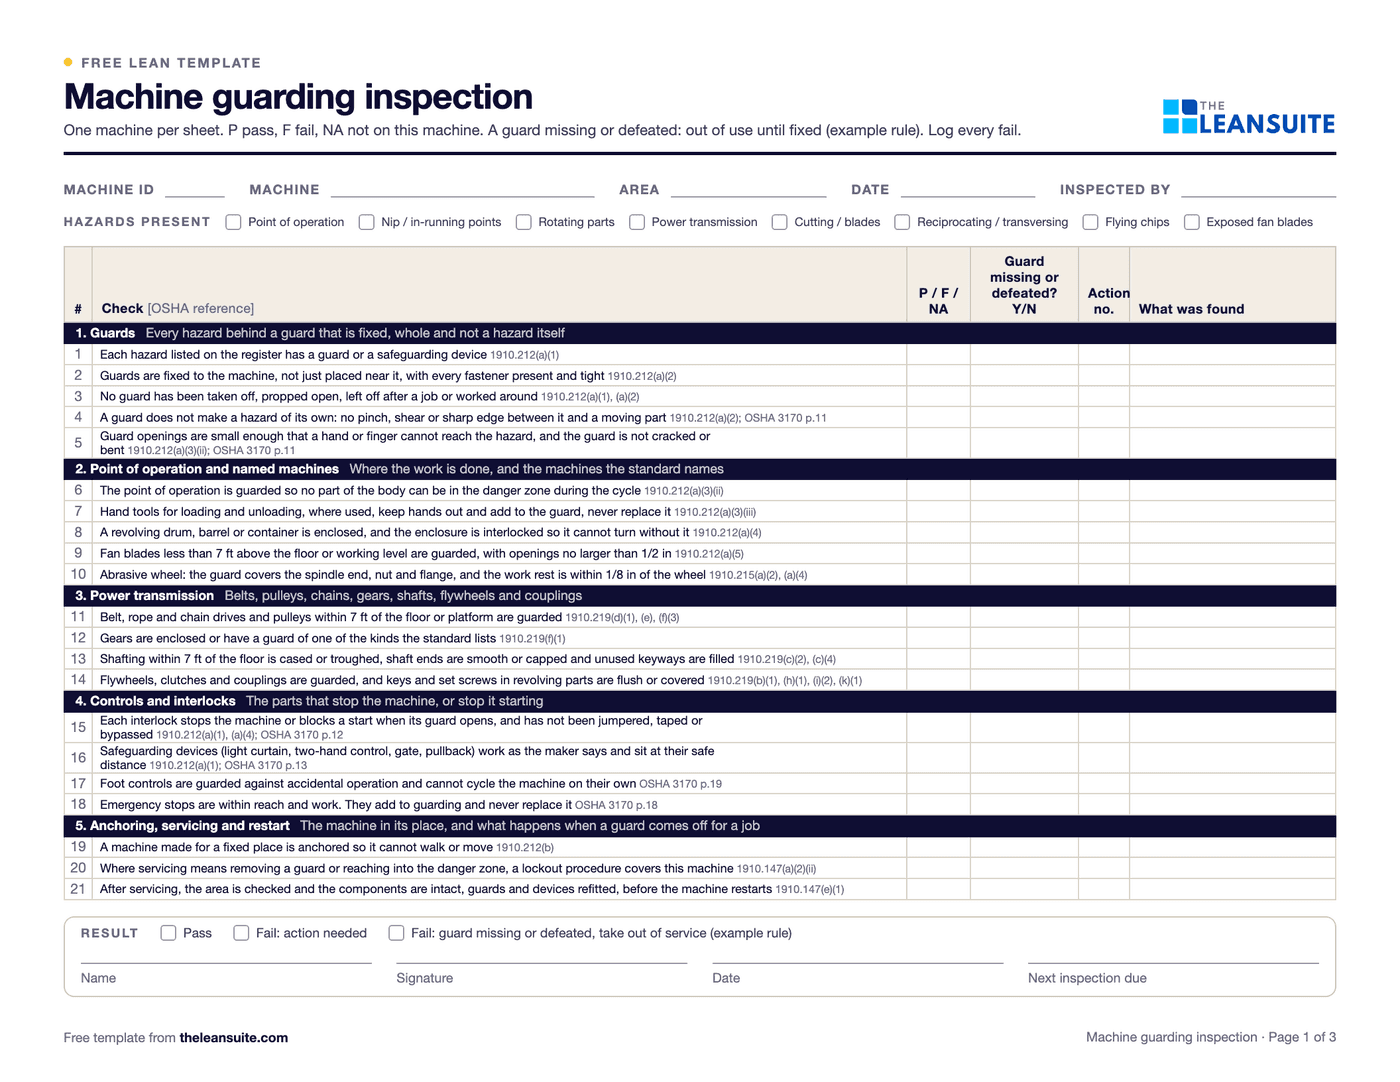 PDF and ExcelMachine guarding inspection sheetA machine register with due dates and a status per machine, 21 checks tied to OSHA 1910.212, .219 and .147, a guard opening check against Table O-10, and an action log.
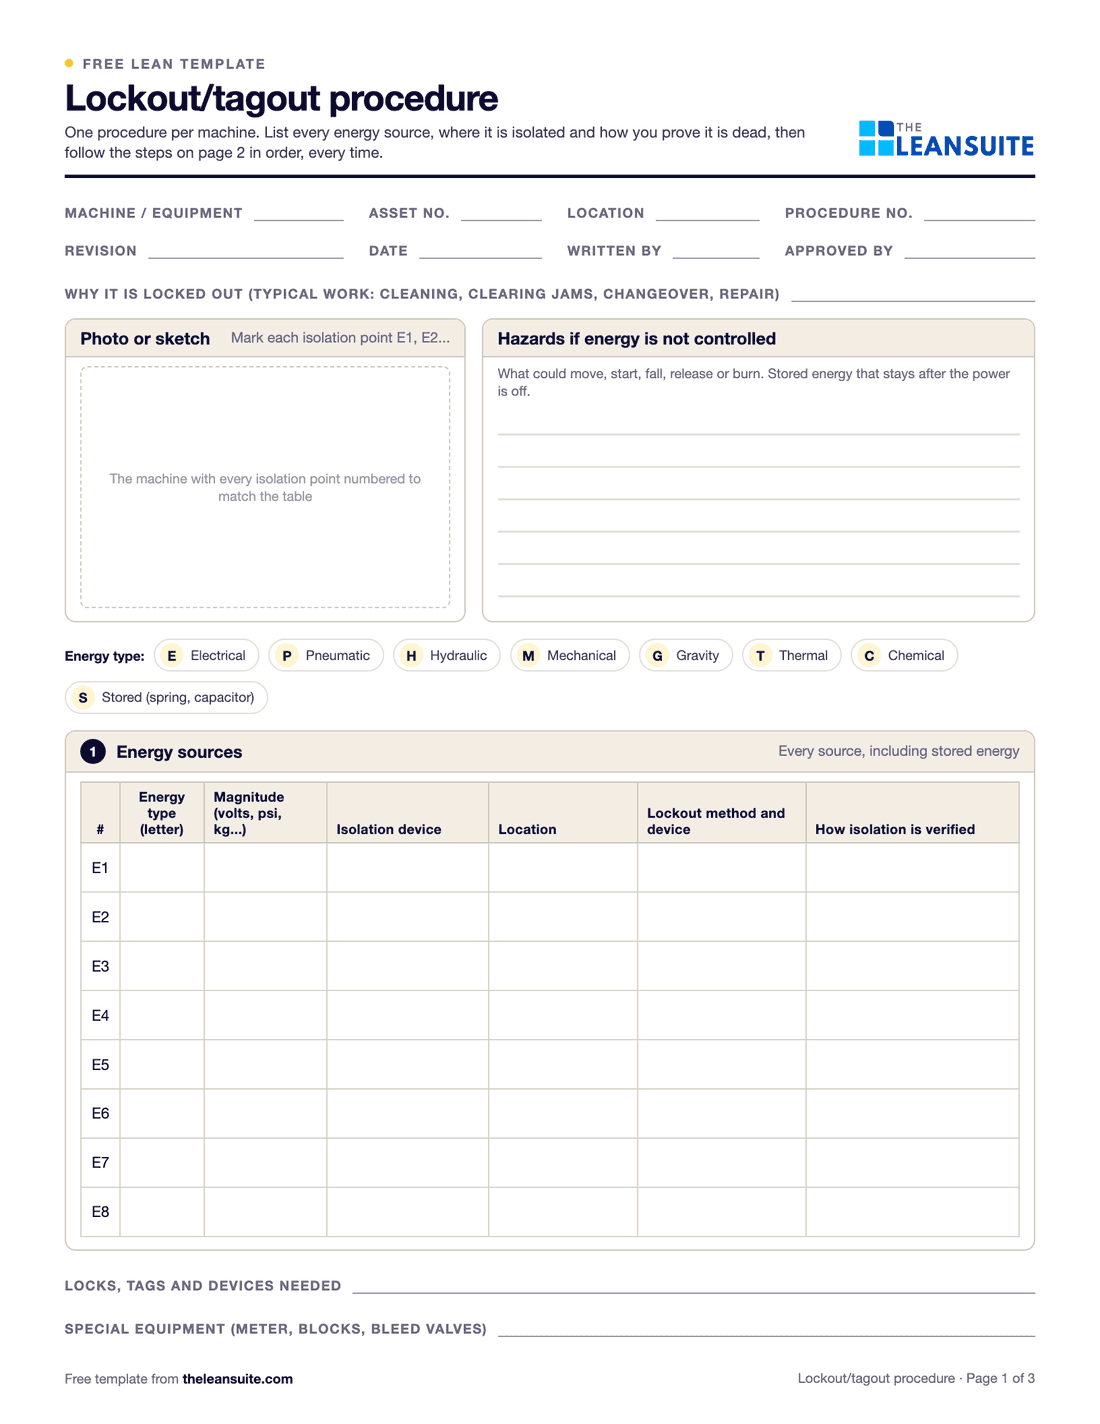 PDF and ExcelLockout/tagout (LOTO) procedure templateA machine-specific LOTO procedure: energy sources and isolation points, the steps from shutdown to restart, and the annual review.
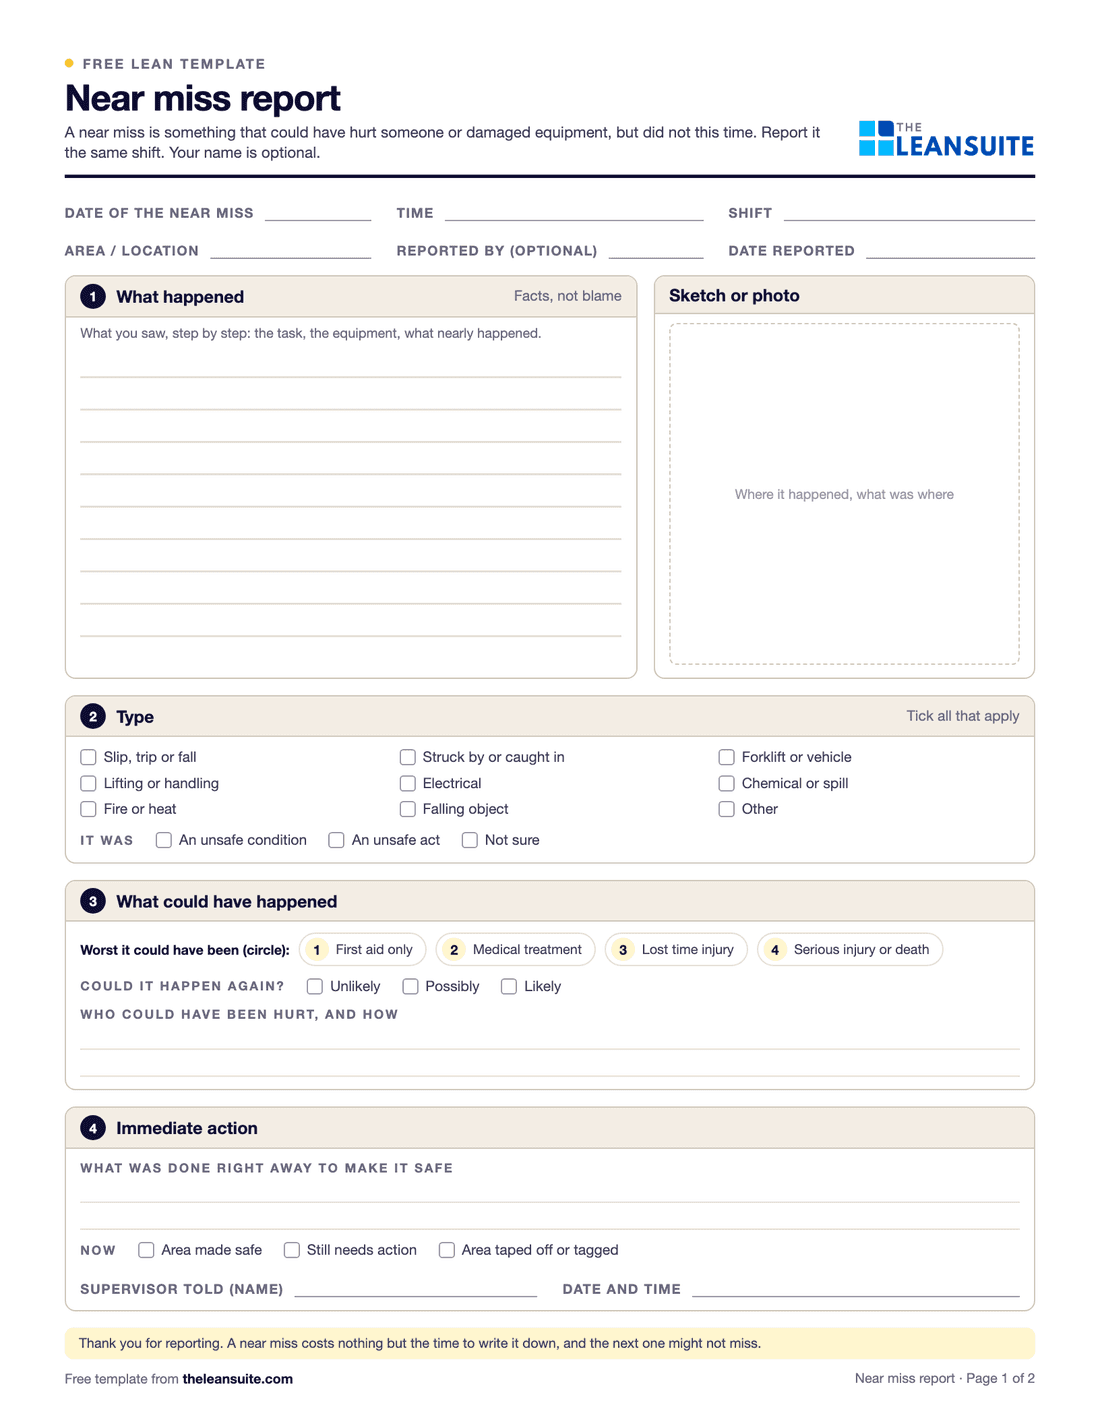 PDF and ExcelNear miss report formA two-page near miss report from the first report to closure, and an Excel log with status and days open.
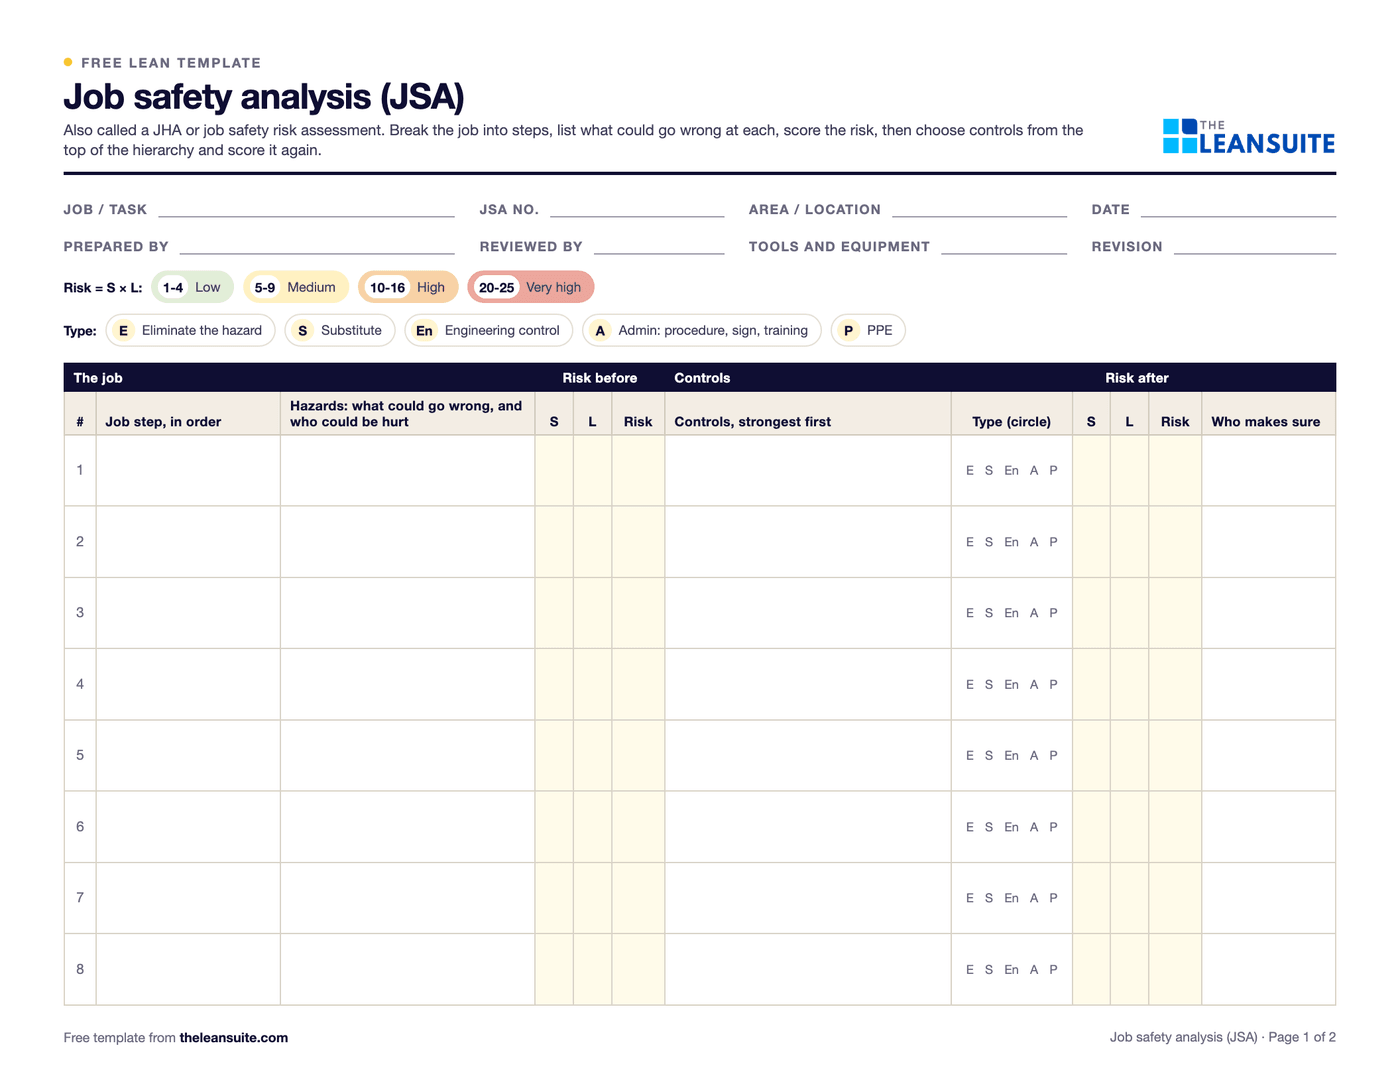 PDF and ExcelJob safety analysis (JSA) templateJob steps, hazards, risk scored before and after the controls, the hierarchy of controls, PPE and sign-off.
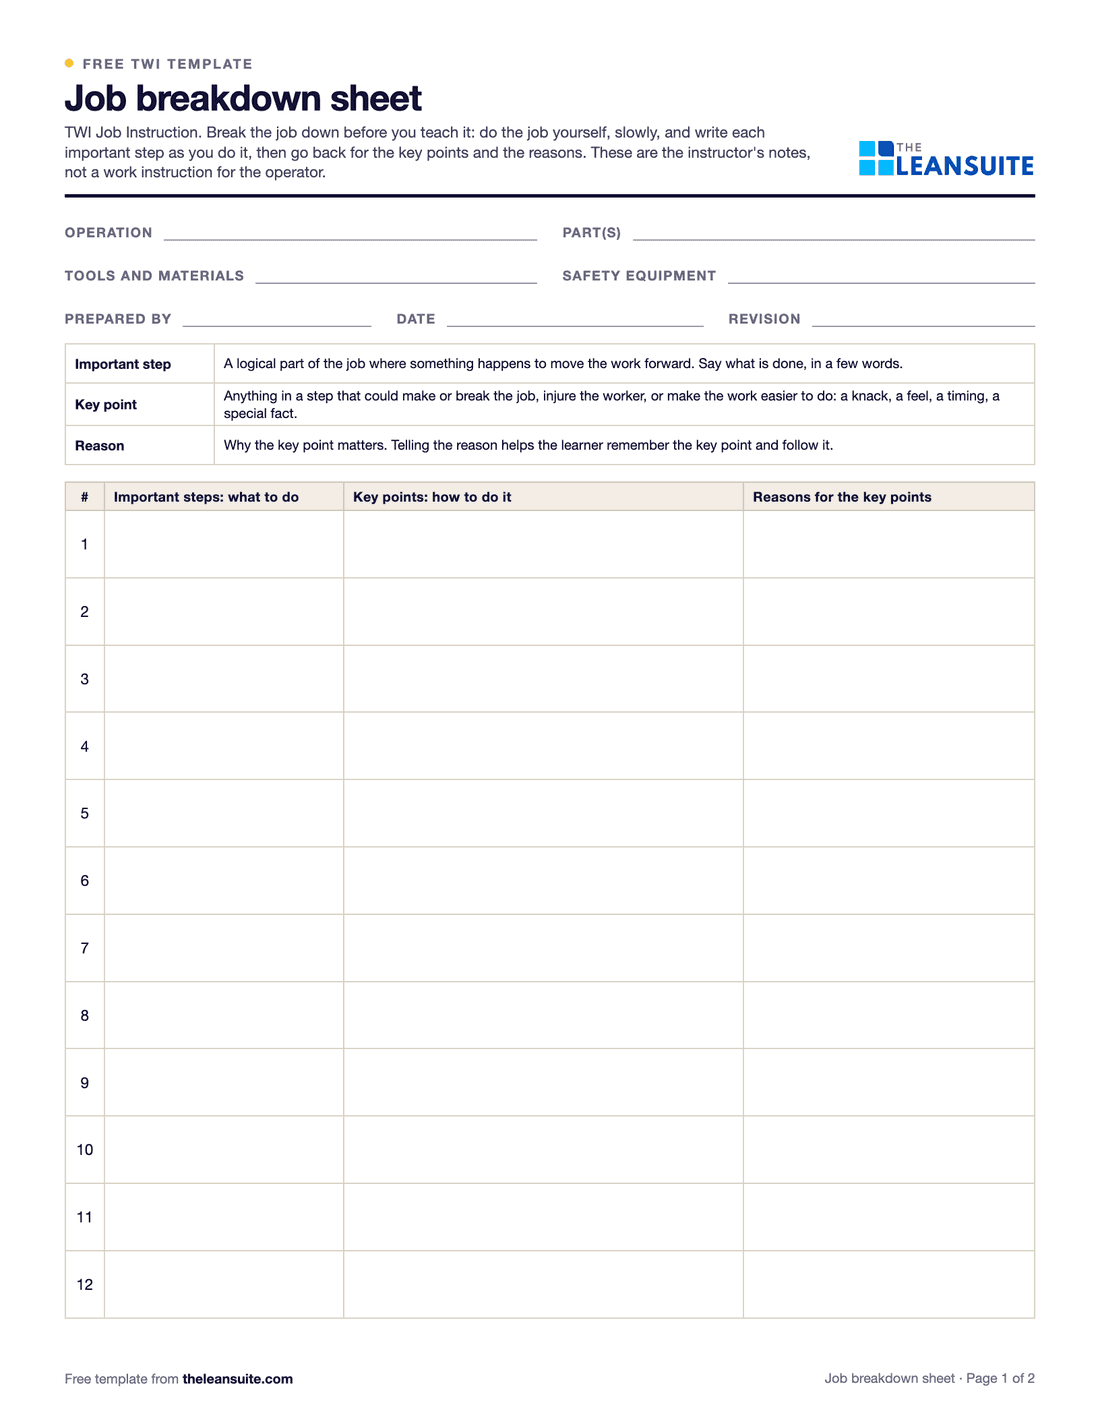 PDF and ExcelTWI job breakdown sheetThe TWI Job Instruction breakdown of a job into important steps, key points and reasons, with a worked example and the four steps.
 PDF and ExcelSkills matrix templatePeople by tasks on a 0 to 4 scale, coverage and gaps per task and shift, and a training plan that closes them.
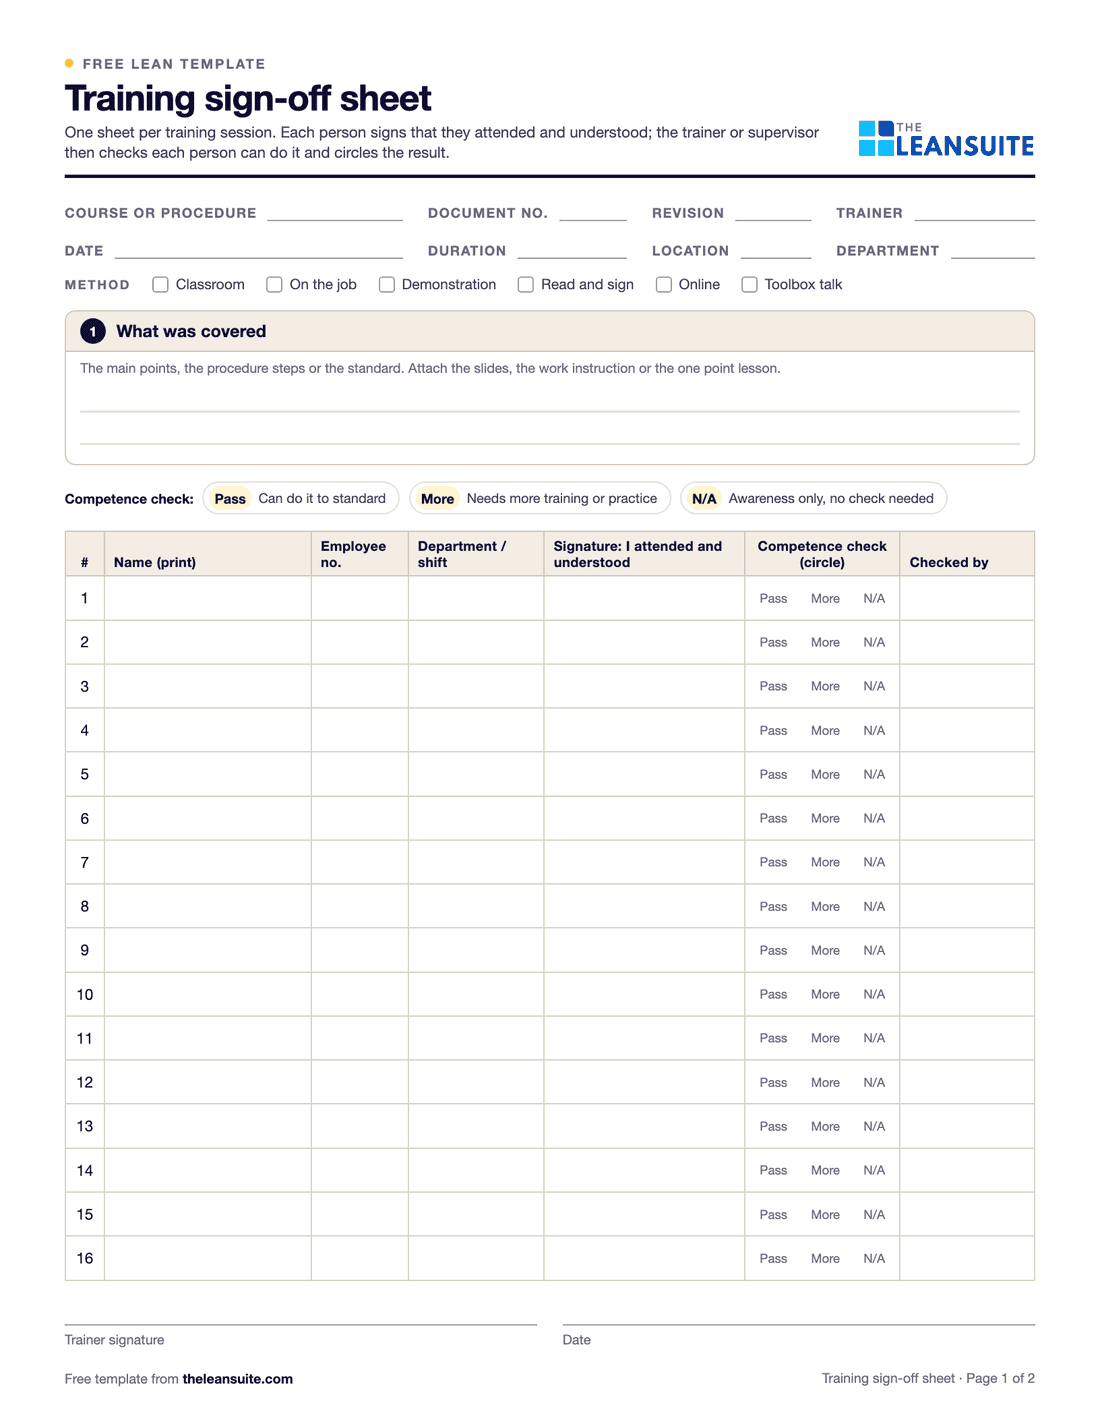 PDF and ExcelTraining sign-off sheetAn attendance and sign-off record where each person signs they understood, with a competence check and an Excel log.
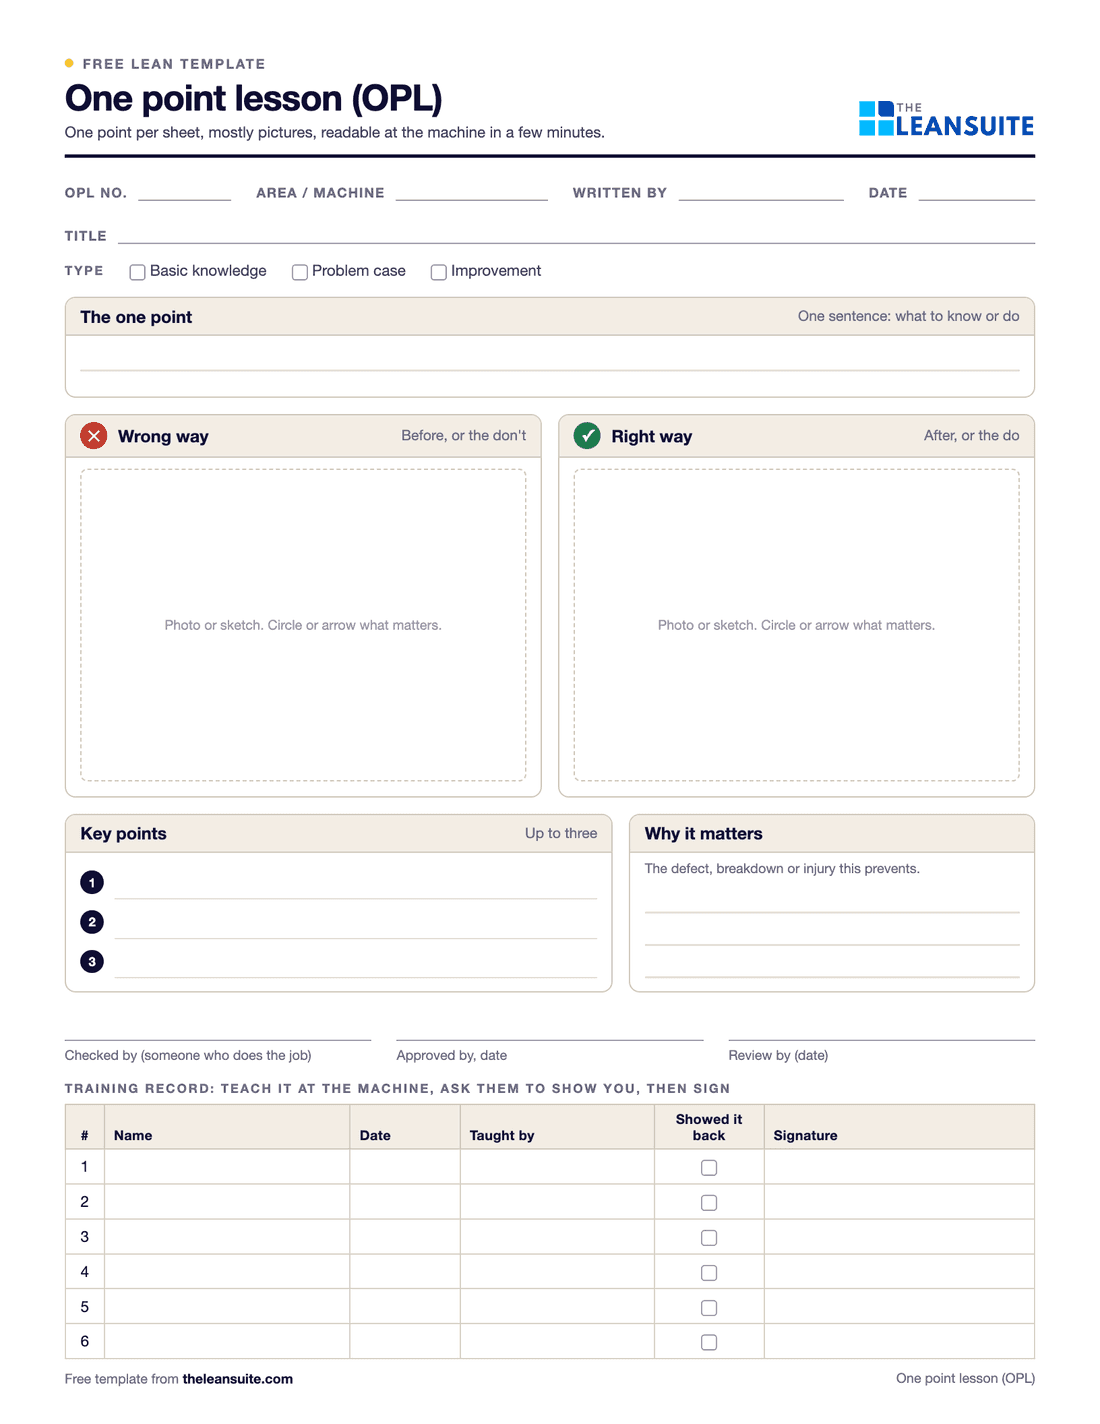 PDF and Excel and WordOne point lesson (OPL) templateOne topic on one page: wrong way and right way pictures, checkable key points, the standard it belongs to and a sign-off record.
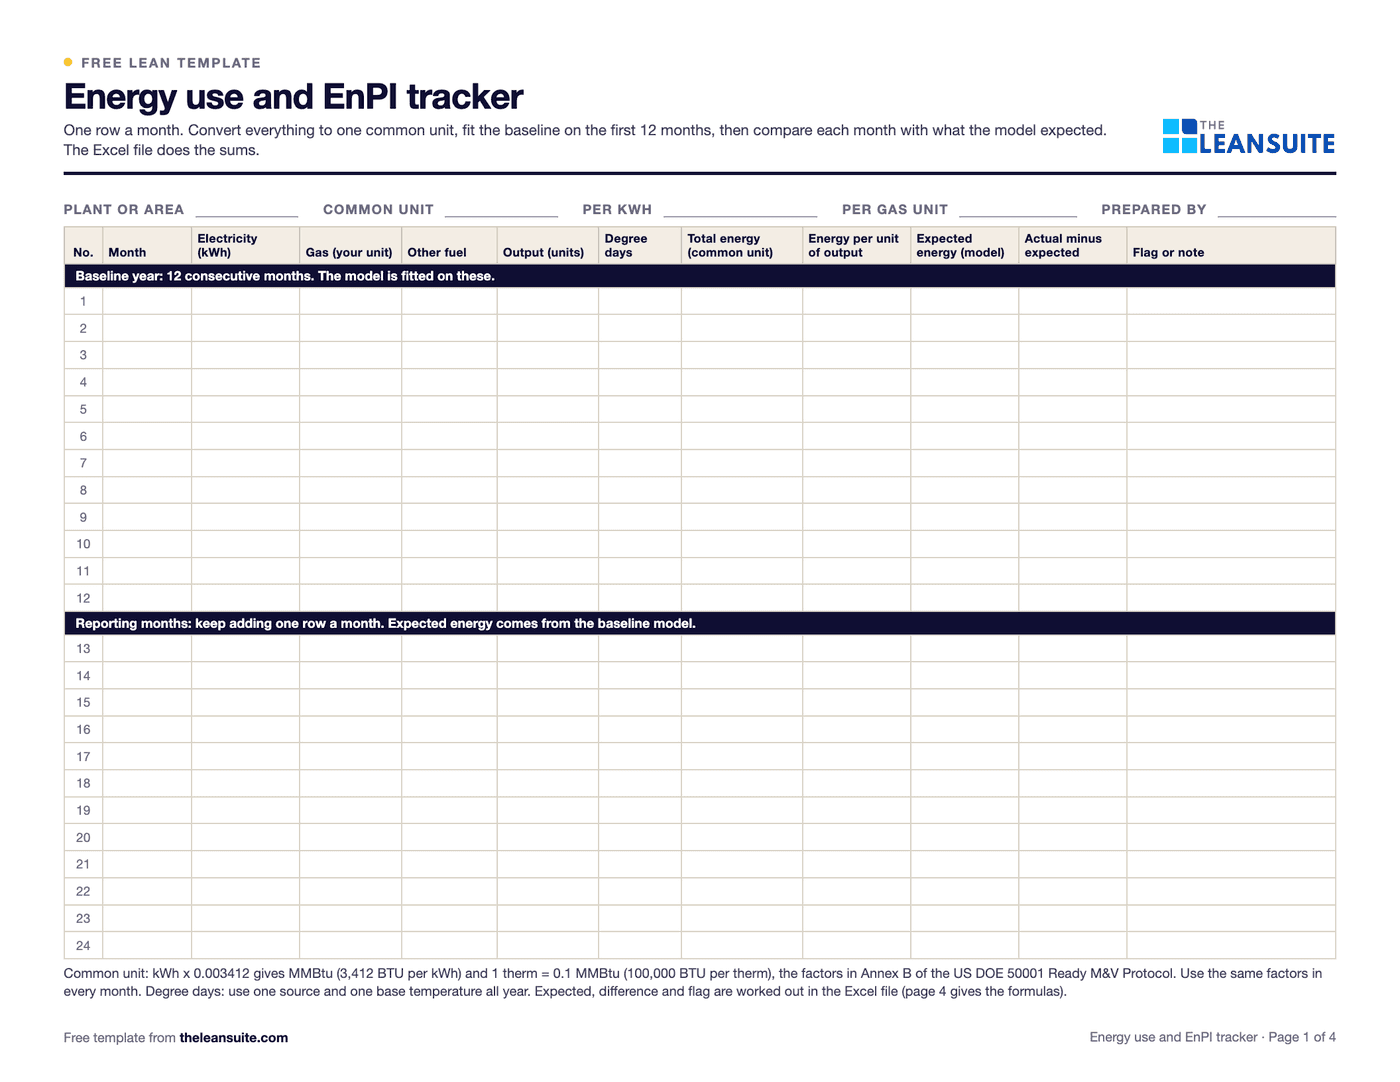 PDF and ExcelEnergy use and EnPI trackerMonthly electricity, gas and fuel in one unit, a 12-month regression baseline, expected against actual energy for each month, an EnPI ratio, the running saving and the tests that say whether the model can be trusted.
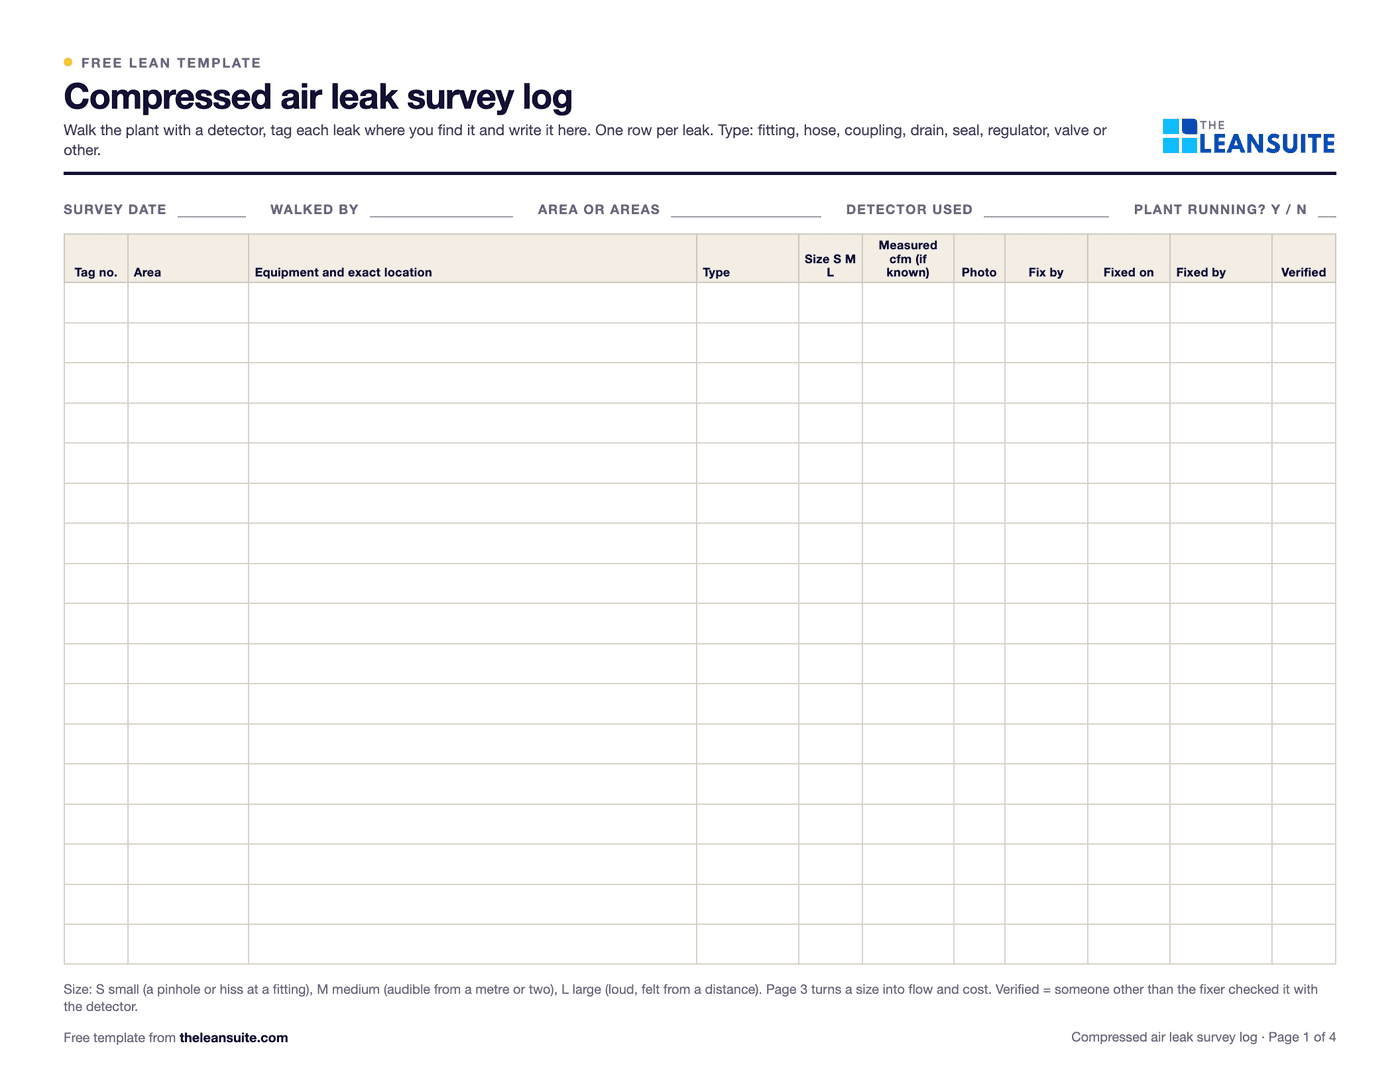 PDF and ExcelCompressed air leak survey logWalk sheet, printable leak tags and a tracker that puts an annual cost on every leak and follows it to a verified fix.
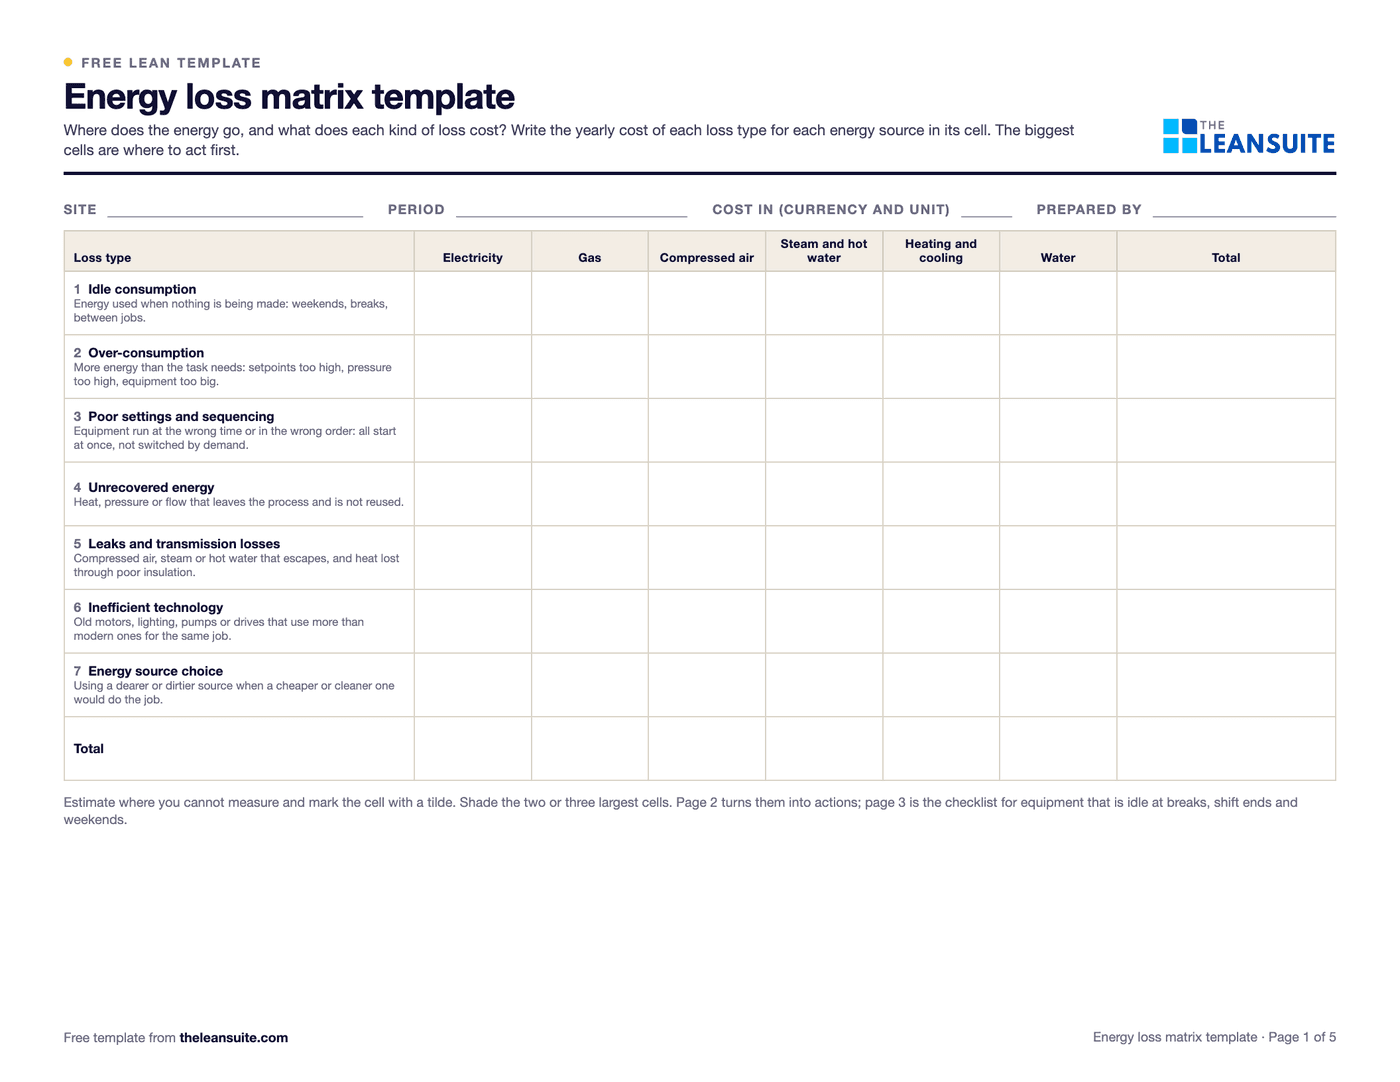 PDF and ExcelEnergy loss matrix templateSeven types of energy loss by six energy sources with a cost in each cell, an action plan and an idle-period shutdown checklist.
Calculators (7)
- Free calculatorOEE calculatorOverall equipment effectiveness from shift time, downtime, ideal cycle time and part counts.
- Free calculatorMTBF and MTTR calculatorMean time between failures, mean time to repair and availability from operating time, failures and repair time.
- Free calculatorSMED changeover calculatorTime saved by moving changeover steps from internal to external, capacity freed per week and the smaller batch it allows.
- Free calculatorFirst pass yield (FPY) calculatorFirst pass yield at each step and rolled throughput yield (RTY) across the whole process.
- Free calculatorScrap rate calculatorScrap rate, the cost of scrap per period and per year, and what reaching a target rate would save.
- Free calculatorTRIR and DART rate calculatorOSHA recordable and DART incident rates from your 300A case counts and hours, and what one more case does to them.
- Free calculatorCompressed air leak cost calculatorAir lost, kW and cost a year for each tagged leak from its size and the pressure, ranked so the biggest gets fixed first.
Buyer's guides
LeanSuite pages for these problems
- Micro-stops
- CILR Checklists
- Autonomous Maintenance
- SMED
- AI SMED changeover analysis
- Quality Prioritization Matrix
- Non-Conformance (NCR)
- Cost of Poor Quality
- Lockout/Tagout (LOTO)
- Near Miss Reporting
- Audit Management
- Competency Management
- Digital Work Instructions
- Cross Training
- Issue Management
- KPI Dashboards
How LeanSuite handles each of these is on the page for tire and rubber plants.
Whirlpool tackled project visibility and continuous improvement across 14 manufacturing plants with LeanSuite. Read the Whirlpool case study.
FAQ
Lean in tire and rubber plants: common questions
In five main stages. Rubber, carbon black, oils and chemicals are mixed into compounds; the compounds are extruded into treads and sidewalls and calendered onto fabric and steel cord; a builder puts the components together on a drum into a green tire; the green tire is cured in a heated mold under pressure; and the finished tire is trimmed and checked for appearance, uniformity and, for many types, internal faults by X-ray.
Blisters and separations, non-fill, open or poor splices, bead defects, trapped air, backrind, undercure and uniformity failures such as force variation and conicity, plus cord spacing faults found by X-ray. Most start at building or curing, and many go back to compound or component variation earlier on.
Mixing blends raw rubber with fillers, oils and chemicals into a compound, usually in an internal mixer in one or more stages, with the curatives added last at a lower temperature. Every product in the plant goes through it, so a mixer stop or a batch out of limits shows up as stops and defects in every later stage.
Air, moisture or volatiles trapped between layers that expand during cure. Common sources are components that have lost their tack, poor stitching on the drum, contamination between plies, blocked mold vents and undercure. Check component age and stitching first, then the vents and the cure record.
Film one change and list every step with its time. Preheat the next mold before the press stops, stage the lifting gear, bladder and tools, and clean the mold at the same stop. Then group sizes on each press so the changes you make are the short ones.
Mixer and press OEE, final inspection first pass yield, scrap rate, mold change time, batches released first time, the recordable injury rate and energy per tire. Track them per press row and per shift.
See LeanSuite on your mixers, presses and tire defects
Bring the routine you want to fix first. We will show you how LeanSuite handles it and what a 90-day pilot would cover.