

Lean playbook · Cosmetics and personal care
Lean playbook for cosmetics and personal care plants
Short answer
Lean in a cosmetics plant starts on the filling line, where many SKUs and short runs turn changeovers into the biggest loss. Time one changeover and split it into internal and external steps. Sequence SKUs so fewer changes need a full clean. Make line clearance a checklist with a second check. Find the cause of every out-of-spec batch instead of adjusting it and moving on. Then log the small stops on fillers and cappers and chart fill weights, so the line runs faster and gives away less product.
Last updated:
7 problems on the floor, and the lean methods for each
Each problem says what it looks like, which methods address it, the first moves to make and the number to watch. Pick the one or two that cost your plant most; you do not need all of them at once.
Where a cosmetics compounding and filling line loses time and quality
Weigh and dispense
Hold and QC release
Label, pack and palletize
Across the whole line
SKU changeovers on filling lines
Each new shade, fragrance or pack size means stopping the filler, cleaning the hopper and nozzles, swapping format parts and loading new components. With short runs, the line can spend hours a shift changing over.
In LeanSuite
Run each changeover as a visual checklist in Lean Creator and require a photo on the steps that matter most.
First moves
- Film or time one changeover and list every step with its time.
- Move the steps that can be done while the line runs, such as fetching format parts and staging labels, before the stop.
- Build a changeover matrix and sequence SKUs from light to dark and from unfragranced to fragranced, so fewer changes need a full clean.
Number to watch: Changeover time per SKU change, from last good unit to first good unit at full speed.
Label and component mix-ups
A label roll, carton or leaflet from the last SKU stays at the labeler or case packer and ends up on the next product. The clearance sheet is signed, but nobody can say which stations were actually checked.
Lean methods
In LeanSuite
Audit management in LeanSuite lets you build, schedule and run any shop floor audit or inspection, from layered process audits to gemba walks, and turn every finding into a tracked action.
First moves
- Write the line clearance as a checklist that names every station and every component, from bulk to shipper.
- Have a second person verify the clearance before the first unit runs, and ask for a photo at the labeler and coder.
- Use different colors or barcodes for look-alike components, and scan labels at the labeler where you can.
Number to watch: Line clearance pass rate at the first check, and mix-ups found after release.
Out-of-spec batches
A weighing error or a mixing step run differently by another shift leaves a batch off on viscosity, pH or color. It is adjusted or reworked in the tank, filling waits, and the cause is rarely written down.
Lean methods
In LeanSuite
Each non-conformance is captured with photos and routed to quality and engineering.
First moves
- Treat every adjustment as a deviation, with the batch, the test that failed and what was added.
- Run a fishbone with the compounder and the lab on the top recurring failure, and check weighing, temperatures and mixing times first.
- Lock the fix into the batch instruction and train every compounder on it.
Number to watch: Right-first-time batches: batches released with no adjustment or rework.
Micro-stops on fillers, cappers and labelers
Tipped bottles, cap jams, pump misfeeds and labeler and carton stops each take a minute or two to clear. They are fixed on the spot and never logged, so the line runs below its rate with no clear reason.
In LeanSuite
Operators log each minor stop as it happens, with category, duration and contributing factor.
First moves
- Log every stop over a set threshold for two weeks, with the machine and a reason code.
- Pareto the stops by reason and fix the top one with the operators and maintenance.
- Add the cleaning and adjustment that prevent it to the operators' daily checks.
Number to watch: Filling-line OEE, with micro-stops counted as their own loss.
Fill weight giveaway
To make sure no unit is underfilled, fillers are set above the label weight. Each tube or bottle carries a little extra product, and on a high-volume line that adds up to whole batches a year.
In LeanSuite
Control charts handle giveaway, and no LeanSuite page covers them yet. Chart fill weights by head on the free template on this card.
What LeanSuite tracks around it
LeanSuite's KPI dashboards for manufacturing track every KPI against its target, with RAG ranges, KPI trees and live huddle boards, so operators and the plant manager act on the same numbers.
First moves
- Weigh a sample from each filling head at set intervals and plot it on a control chart.
- Find and fix the heads with the widest spread before lowering the target.
- Lower the target in small steps once the process is stable and capable.
Number to watch: Average fill weight above label claim, per head.
Cleaning between batches
Tanks, transfer hoses and filler parts must be cleaned and sanitized between batches. Cleaning takes as long as the person doing it, steps are skipped at the end of a shift, and the log shows a signature, not what was done.
In LeanSuite
Schedule sanitation, pre-op and equipment care checklists every shift, weekly or after a changeover, with pictures and videos for each step.
First moves
- Write one cleaning standard per tank and filler, with the steps, times and photos of a clean result.
- Time cleaning like a changeover and move parts washing off the line with spare sets.
- Check cleaning records weekly and follow up every skipped or late clean.
Number to watch: Cleaning time per changeover, and cleaning checks completed on time.
GMP training for new and temporary staff
Launches and seasonal peaks bring in temporary staff who need GMP, hygiene and line training before they touch product. Training by shadowing teaches each person a slightly different method, and the records sit in binders.
In LeanSuite
A learning plan gives every new hire the same courses and on-the-job sign-offs, and the skills matrix updates on completion, so supervisors see who is cleared to run each line.
First moves
- Build a skills matrix by line and station, with GMP and hygiene as the first row for everyone.
- Write job breakdowns for filling, clearance and cleaning, and train new people with them.
- Set a refresher interval for GMP training and check overdue training at the weekly meeting.
Number to watch: Share of people on each shift fully trained for the station they run.
More small fixes in the production, quality and maintenance sections of the kaizen idea bank.
A 90-day starting plan
One line or product family, two problems, measured before and after. The point of the first 90 days is a result the plant believes and a method it can repeat, not a plant-wide program.
The 90 days, with the gate that ends each stage
- Days 1 to 30Pick one filling line and measure itDone when: You have baseline numbers and two problems with owners.
- Days 31 to 60Cut changeovers and close the gapsDone when: Each change has a before-and-after number and a written standard.
- Days 61 to 90Hold the gains and spread themDone when: The gains have held for a month and the next line has its baseline.
Days 1 to 30
Pick one filling line and measure it
See where one filling line loses time and quality.
- Choose the filling line with the most changeovers or the lowest OEE, and name an owner.
- Time three changeovers and log every stop over two minutes for two weeks.
- Measure OEE, changeover time, right-first-time batches and line clearance findings.
- Start a short daily meeting at the line with the shift lead, quality and maintenance.
- Choose the two biggest losses to work on first.
Days 31 to 60
Cut changeovers and close the gaps
Attack the two problems and prove the change with numbers.
- Run a SMED workshop on the most frequent changeover and write the new standard.
- Build the changeover matrix and agree a SKU sequence with planning.
- Rewrite line clearance as a checklist with a second check and photos at the labeler.
- Fix the top micro-stop and add its prevention to the daily checks.
Days 61 to 90
Hold the gains and spread them
Keep the new standards in place and start the next line.
- Audit the changeover, clearance and cleaning standards on every shift.
- Train every operator on the new standards and update the skills matrix.
- Start control charts for fill weight on the highest-volume SKU.
- Share the results and pick the next line.
The KPIs to track
Track them per line and shift, on a board the team sees every day. Set targets from your own baseline, not from someone else's plant.
| KPI | What it tells you | How to measure it | Free help |
|---|---|---|---|
| Filling-line OEE | How much of planned time the line spends filling good units at full speed. | Availability × performance × quality, per line and shift. Count changeovers and micro-stops as separate losses. | OEE calculatorOEE tracking sheet |
| Changeover time | How long the line stops between SKUs, and whether the new standard holds. | Last good unit of one SKU to first good unit of the next at full speed, for every changeover. | SMED changeover calculatorSMED changeover worksheet |
| Right-first-time batches | How often a batch passes QC with no adjustment or rework. | Batches released with no adjustment or rework divided by batches made, per product family. | First pass yield (FPY) calculator |
| Line clearance pass rate | Whether line clearance finds leftovers before they reach product. | Clearances passed at the first check divided by clearances done, with every finding logged. | Changeover checklist |
| Fill weight giveaway | How much product is given away above the label claim. | Average fill weight minus label weight, per head, from the control chart samples. | Process capability (Cp, Cpk) calculatorX-bar and R control chart template |
| Training coverage | Whether each shift has enough trained people for its stations. | People fully trained for the station they run divided by people on the shift, from the skills matrix. | Training matrix template with expiry dates |
By the numbers
Public figures for this industry or for the wider sector it belongs to, each linked to the report or government table it comes from and checked against it on September 26, 2026. More in our lean manufacturing statistics and benchmark charts.
$36,000
In fast-moving consumer goods, the sector that includes cosmetics and personal care, a lost hour of production costs about $36,000.
Siemens survey of large plants in four sectors; FMCG was the lowest-cost of the four, and Siemens notes its hourly costs have stayed relatively stable since 2019.
Source: Siemens, The True Cost of Downtime 2024 (Senseye Predictive Maintenance) (2024)
27 hours
A large plant loses an average of 27 hours a month to unplanned downtime, down from 39 hours in 2019.
Average across the large plants in the Siemens survey, which covered automotive, FMCG, heavy industry and oil and gas.
Source: Siemens, The True Cost of Downtime 2024 (Senseye Predictive Maintenance) (2024)
81 minutes
Getting production running again after a stoppage takes 81 minutes on average, up from 49 minutes five years earlier.
Same Siemens survey. Siemens links the slower recovery to the loss of skilled maintenance staff and harder-to-source spare parts.
Source: Siemens, The True Cost of Downtime 2024 (Senseye Predictive Maintenance) (2024)
Injury and illness rate by industry, 2024
- Motor vehicles5.6
- Beverage and tobacco3.7
- Furniture3.5
- Food3.3
- Primary metals3.3
- Nonmetallic mineral products, incl. glass3.3
- Fabricated metal products3.2
- Transportation equipment3.2
- Motor vehicle parts2.9
- Plastics and rubber products2.8
- HVAC and refrigeration2.4
- Paper2.4
- Machinery2.3
- All private industry2.3
- Electrical equipment and appliances2.0
- Printing1.6
- Chemicals1.6
Total recordable cases per 100 full-time workers, 2024: Motor vehicles 5.6, Beverage and tobacco 3.7, Furniture 3.5, Food 3.3, Primary metals 3.3, Nonmetallic mineral products, incl. glass 3.3, Fabricated metal products 3.2, Transportation equipment 3.2, Motor vehicle parts 2.9, Plastics and rubber products 2.8, All manufacturing 2.7, HVAC and refrigeration 2.4, Paper 2.4, Machinery 2.3, All private industry 2.3, Electrical equipment and appliances 2, Printing 1.6, Chemicals 1.6.
Free templates, calculators and buyer's guides
Templates (18)
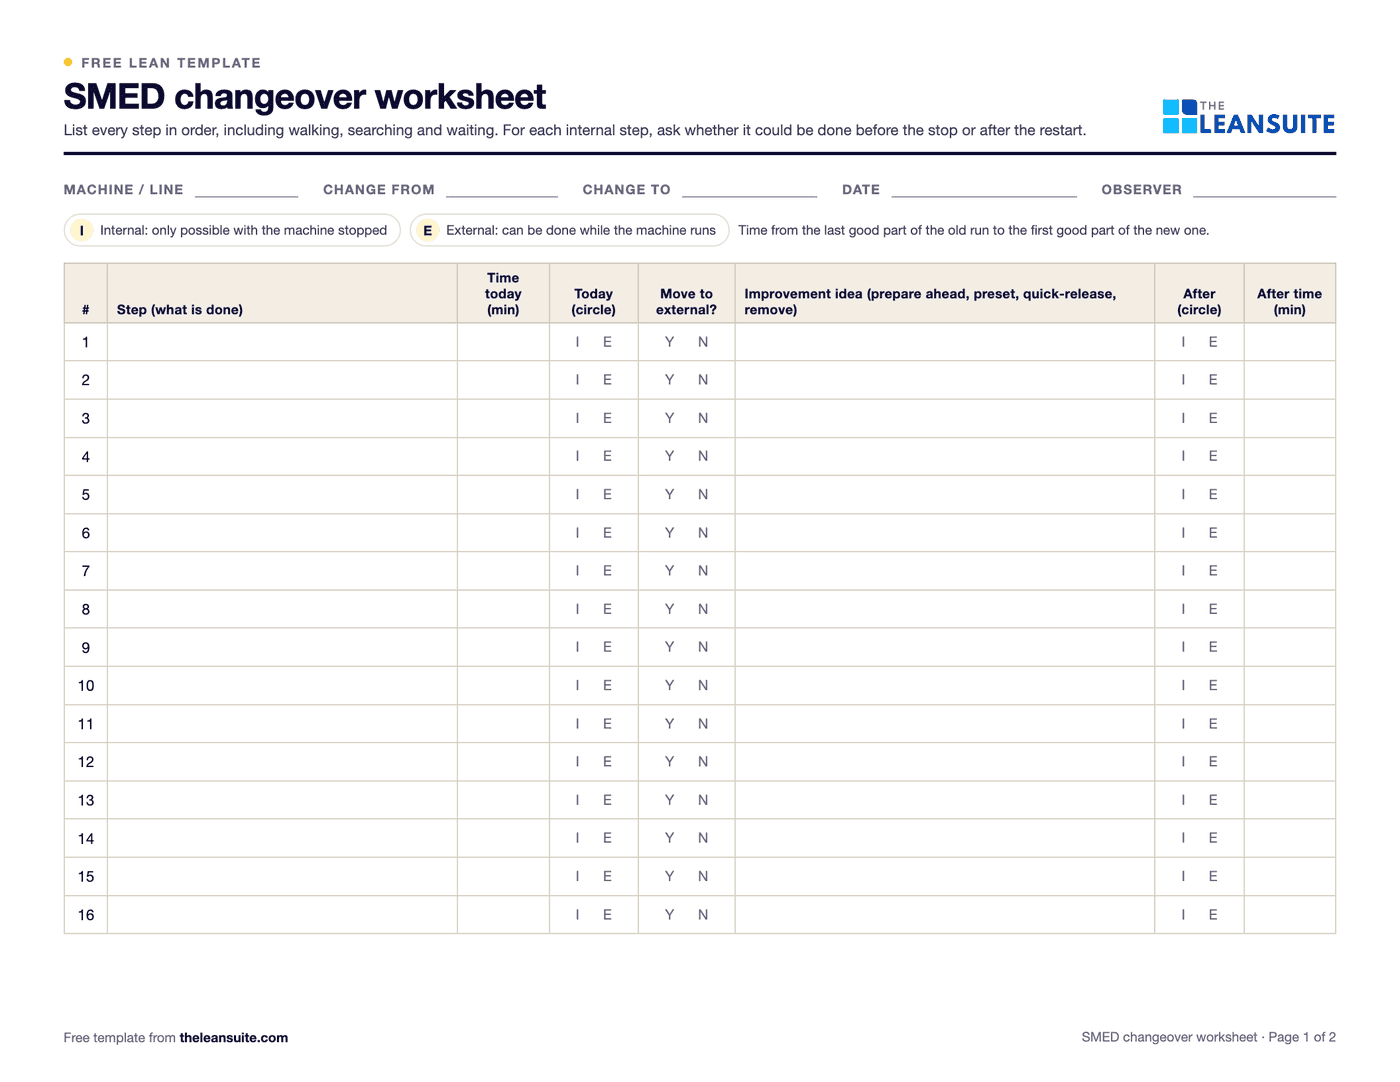 PDF and ExcelSMED changeover worksheetChangeover steps with times, internal or external, what can move, ideas and before/after totals.
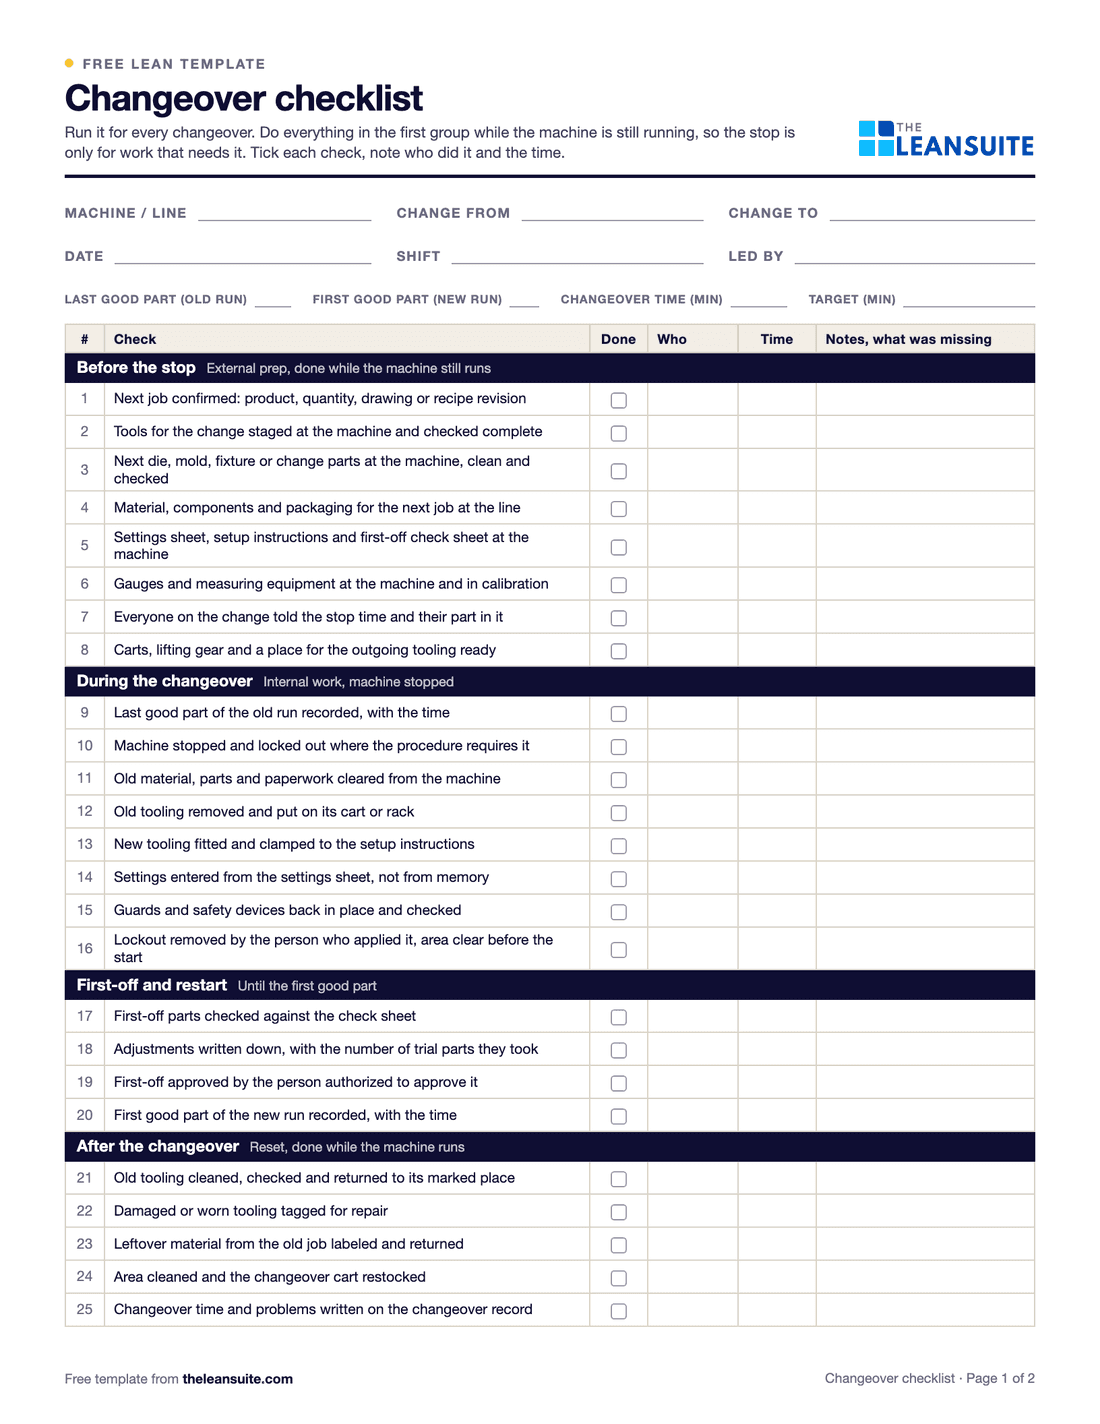 PDF and ExcelChangeover checklist25 checks for every changeover, a record of planned and actual times, and a log of changeover time against target.
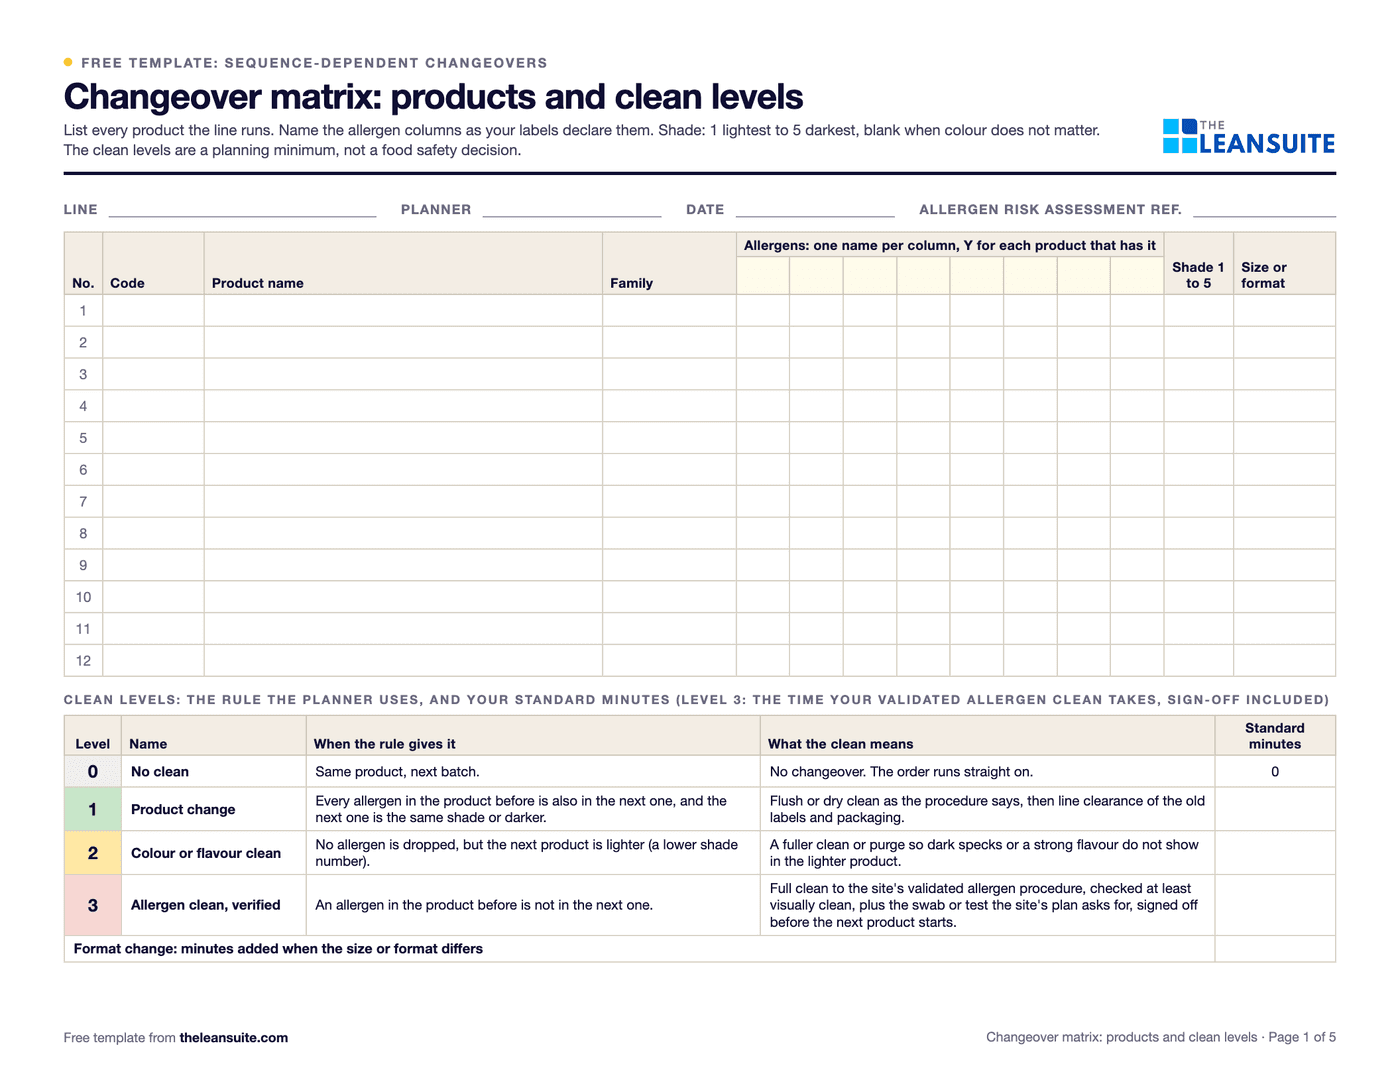 PDF and ExcelChangeover matrix templateA from-to matrix of changeover minutes with the clean each transition needs (allergen, colour, format), and a weekly planner that totals the order and suggests a shorter one.
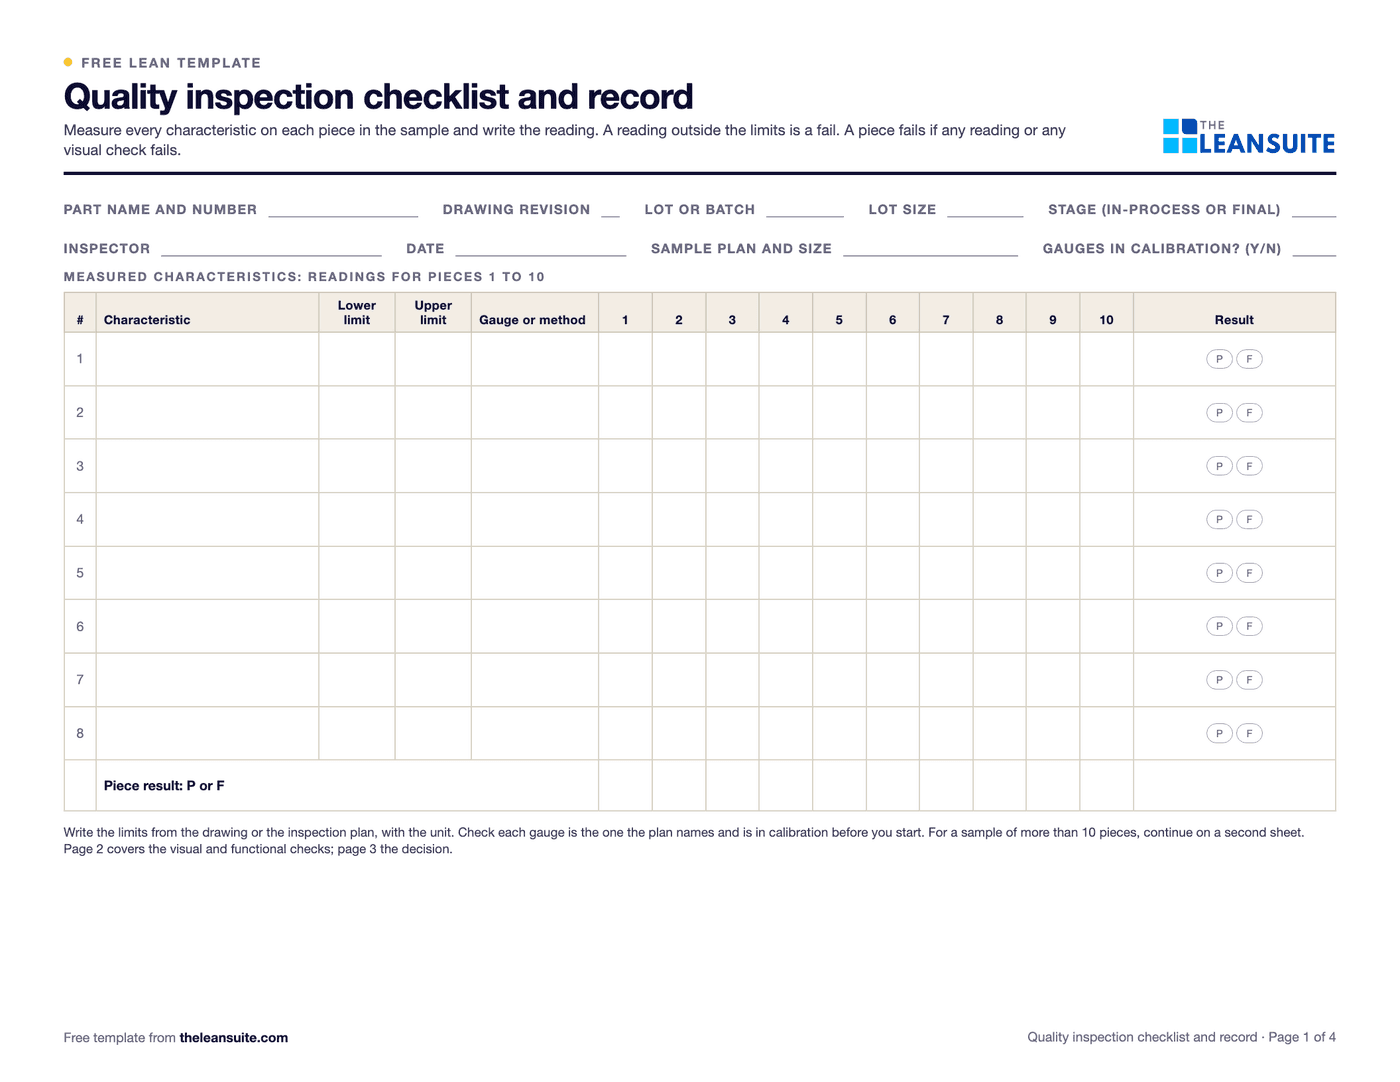 PDF and ExcelQuality inspection checklistAn in-process and final inspection record: measured characteristics, visual checks, a decision and first pass yield.
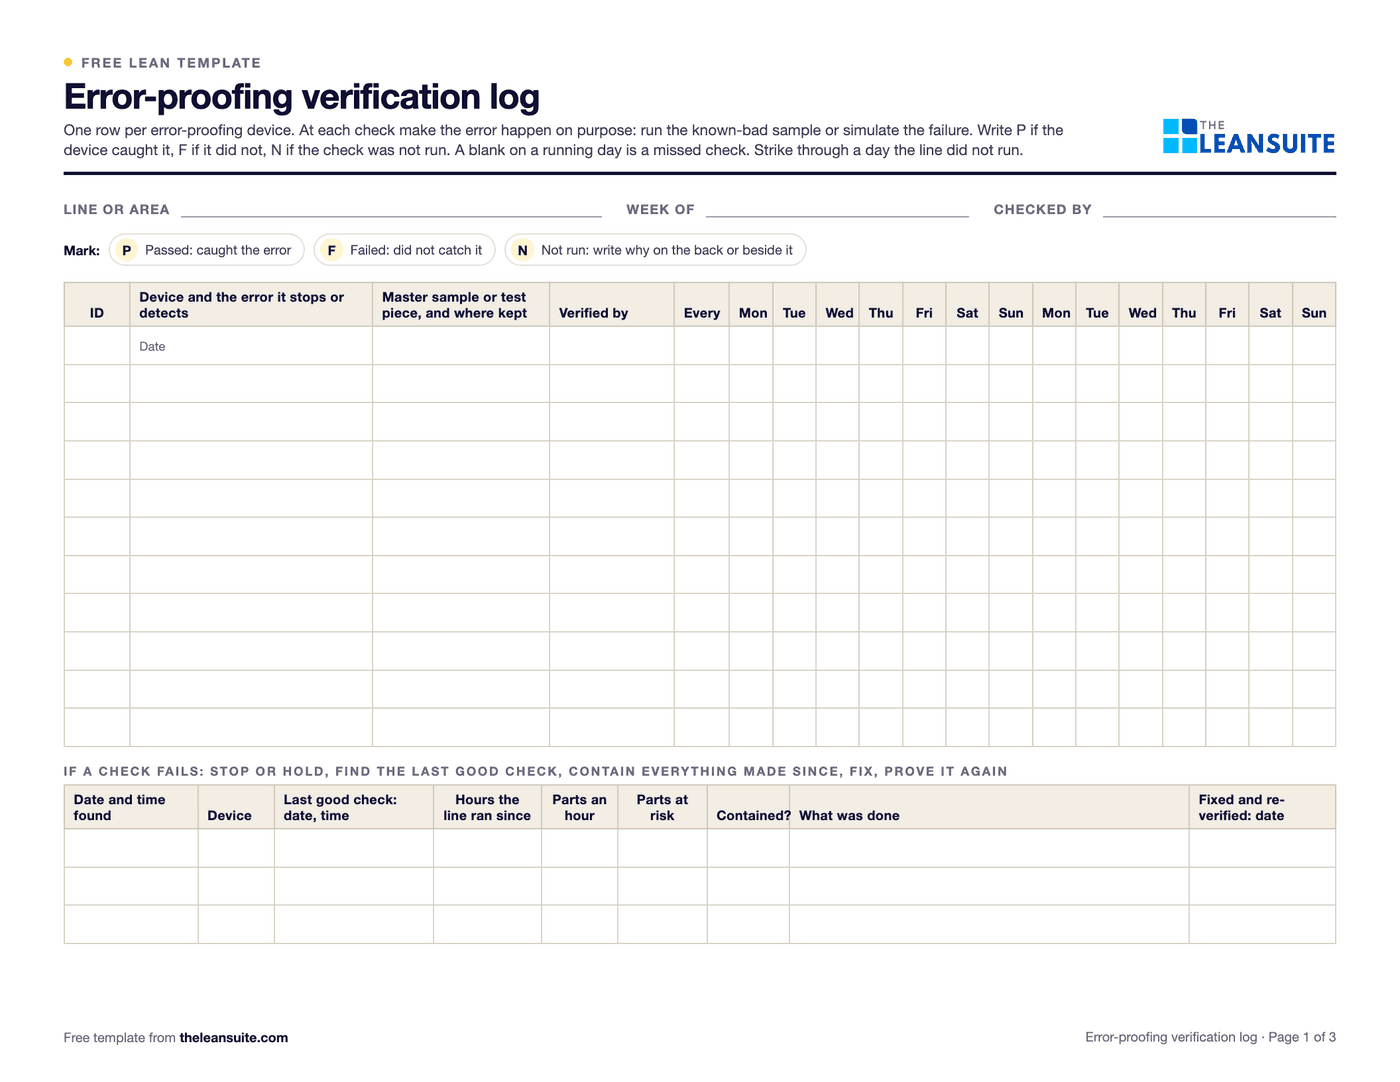 PDF and ExcelError-proofing verification log (daily master-sample check)Each poka-yoke device proved every day or week with a known-bad sample, with missed checks counted and the hours and parts at risk worked out when one fails.
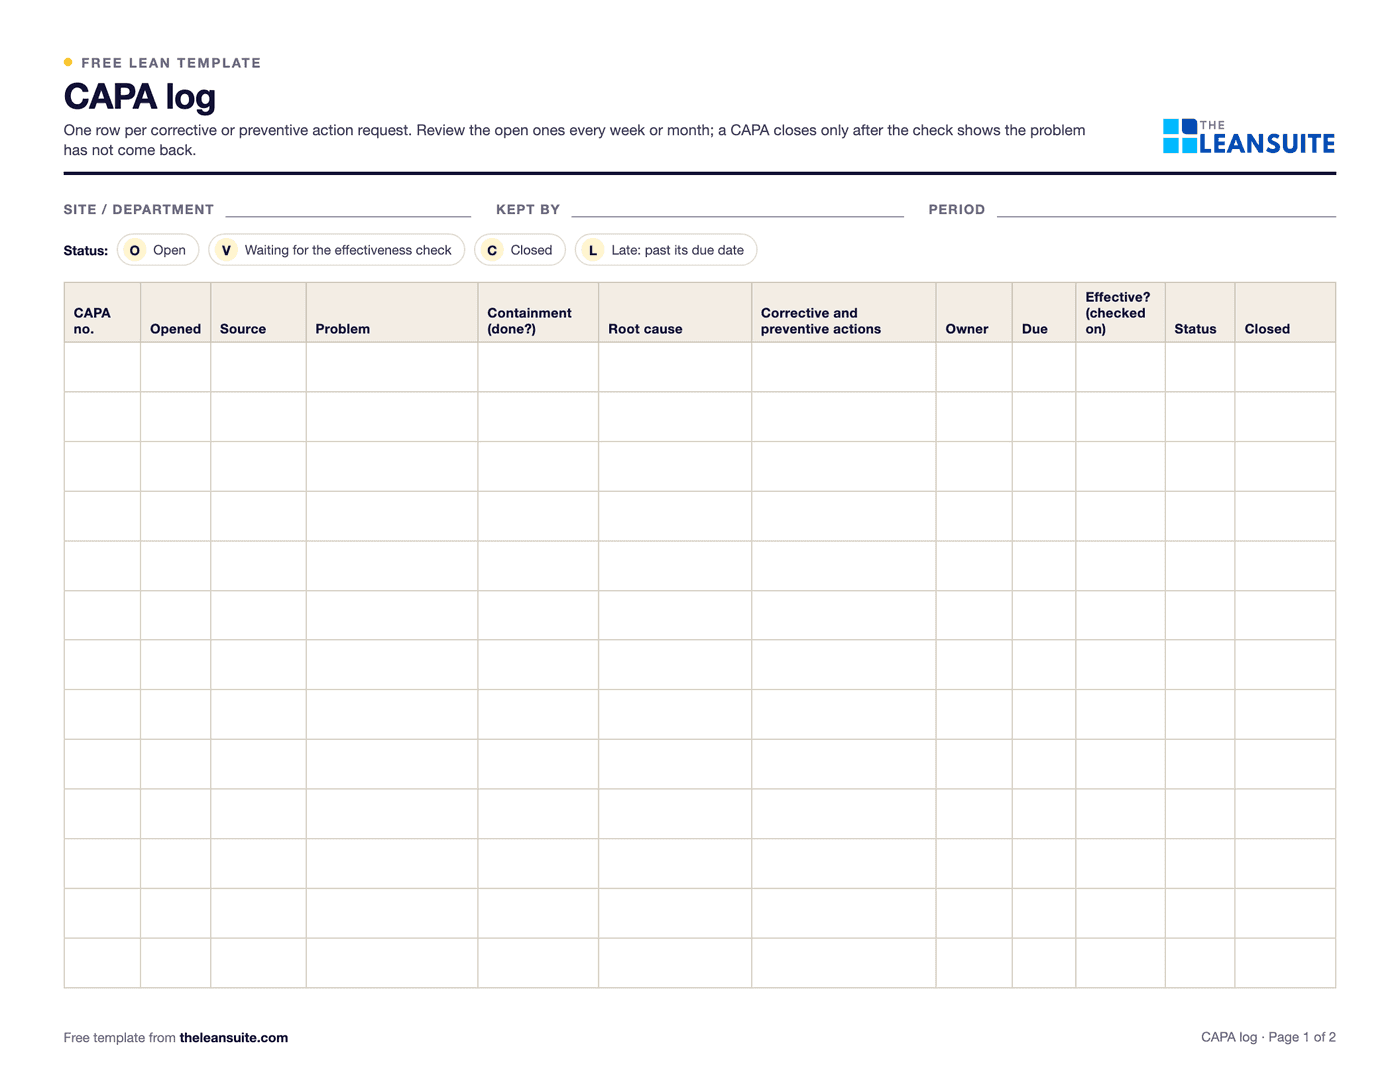 PDF and Excel and WordCAPA log templateAn Excel CAPA tracker with status, days open, late flags and counts by source, plus a printable log and monthly review.
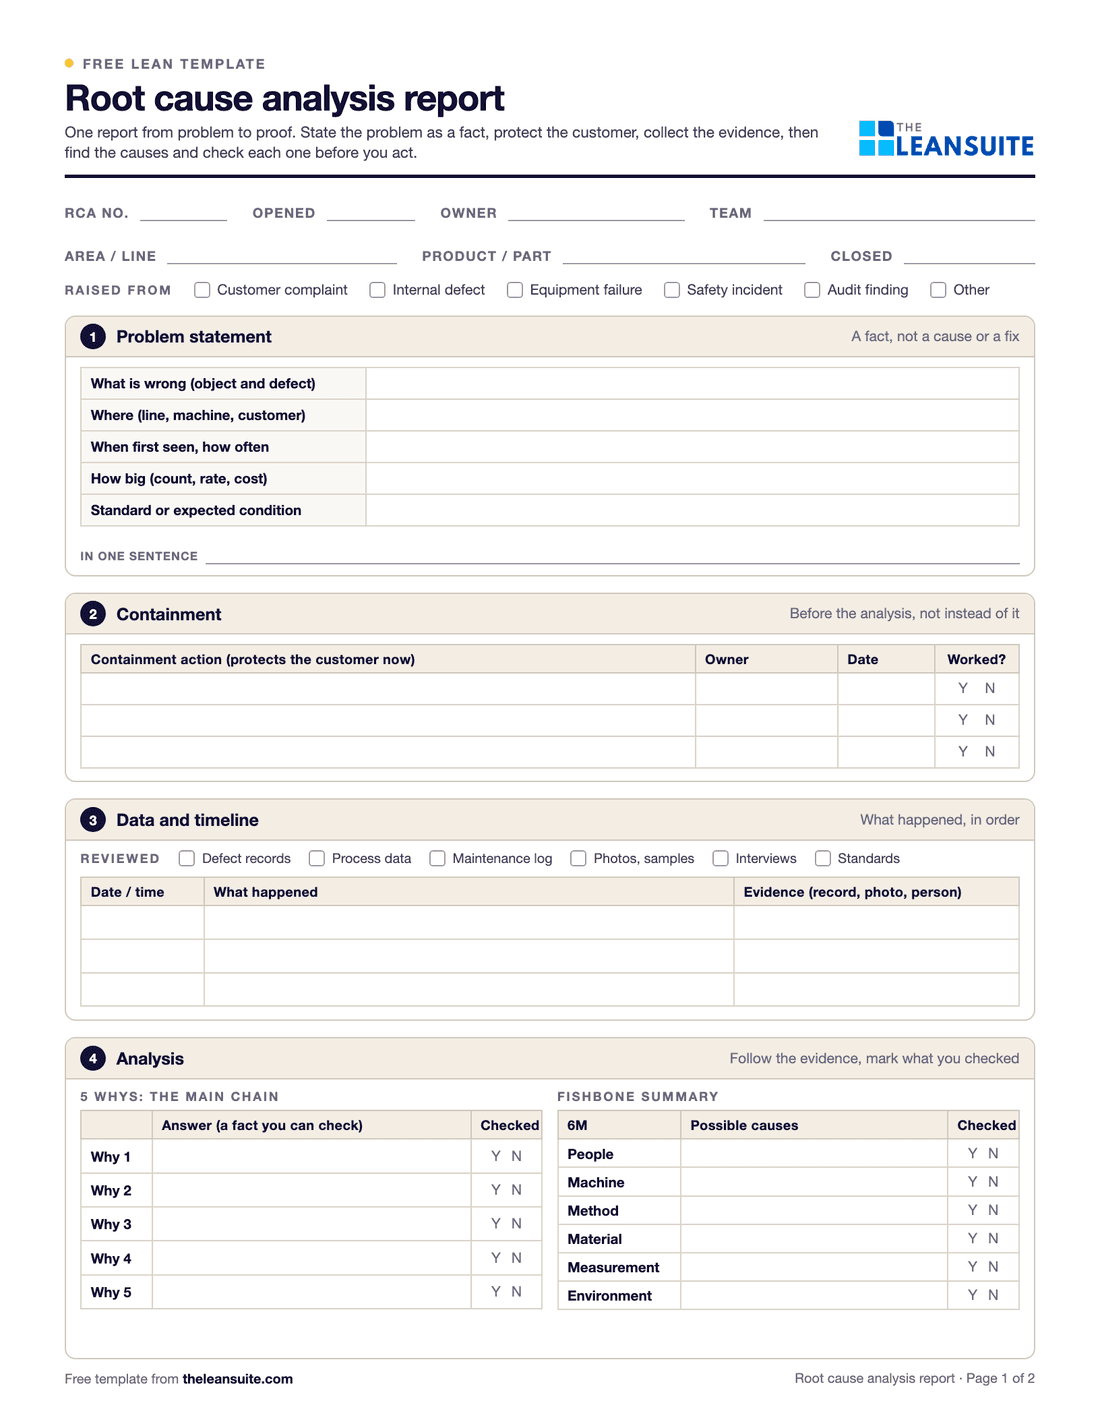 PDF and ExcelRoot cause analysis templateOne report from problem statement to proof: containment, evidence, analysis, verified causes, actions and the effectiveness check.
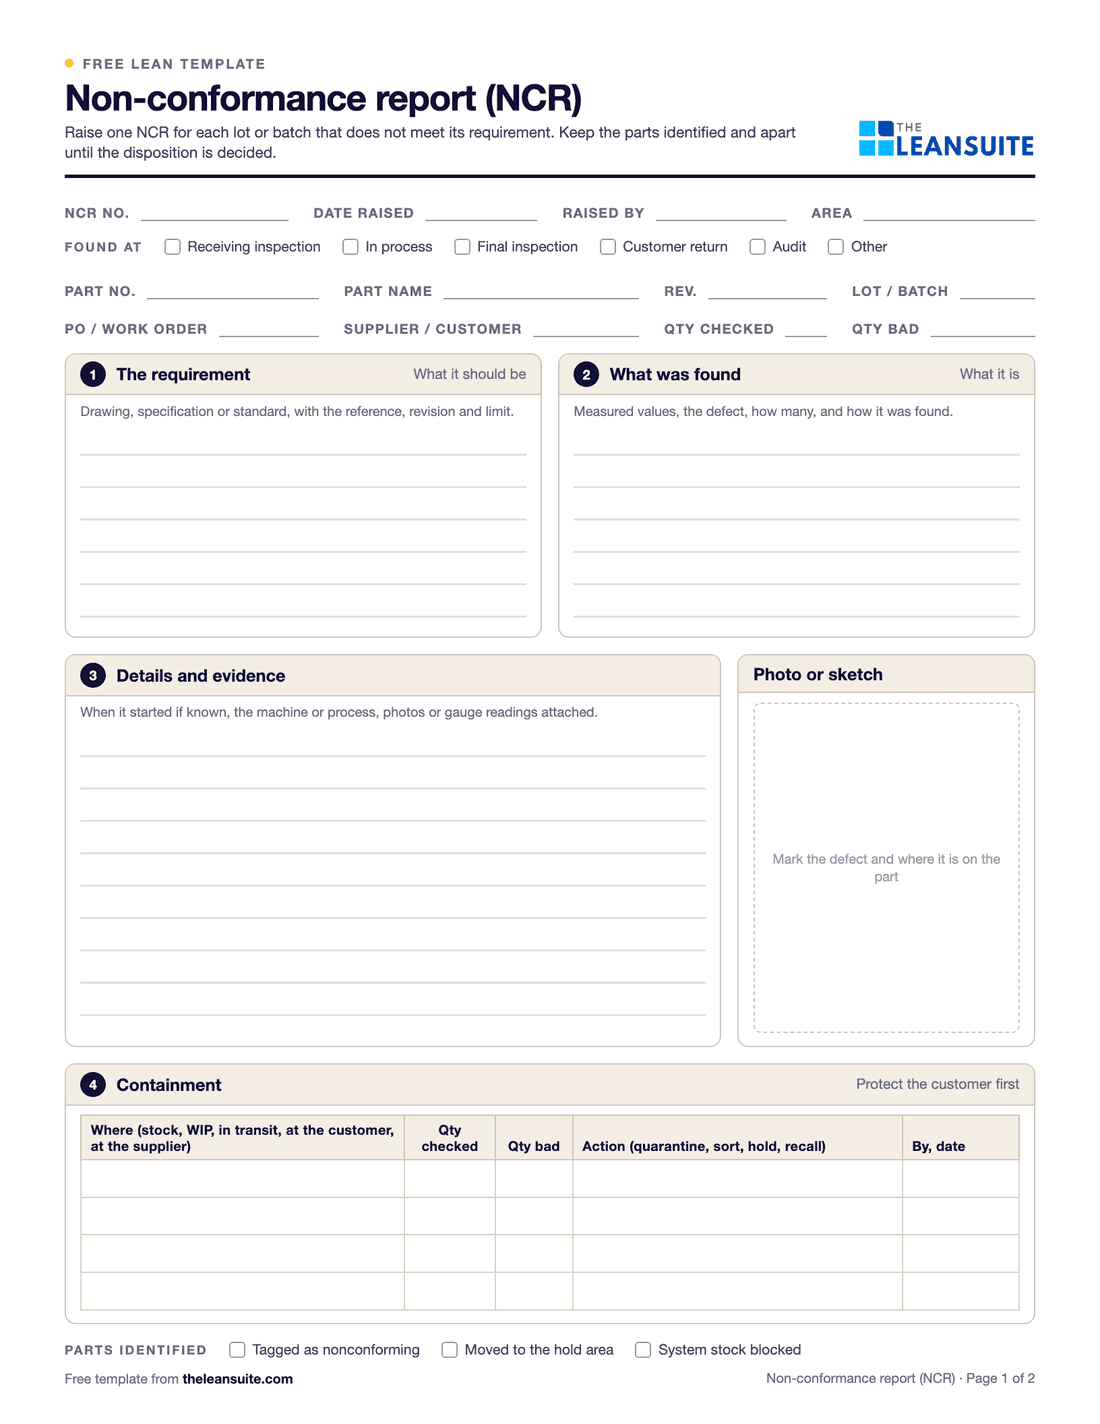 PDF and Excel and WordNon-conformance report (NCR) formA two-page NCR from the requirement against what was found to disposition and closure, and an Excel NCR log.
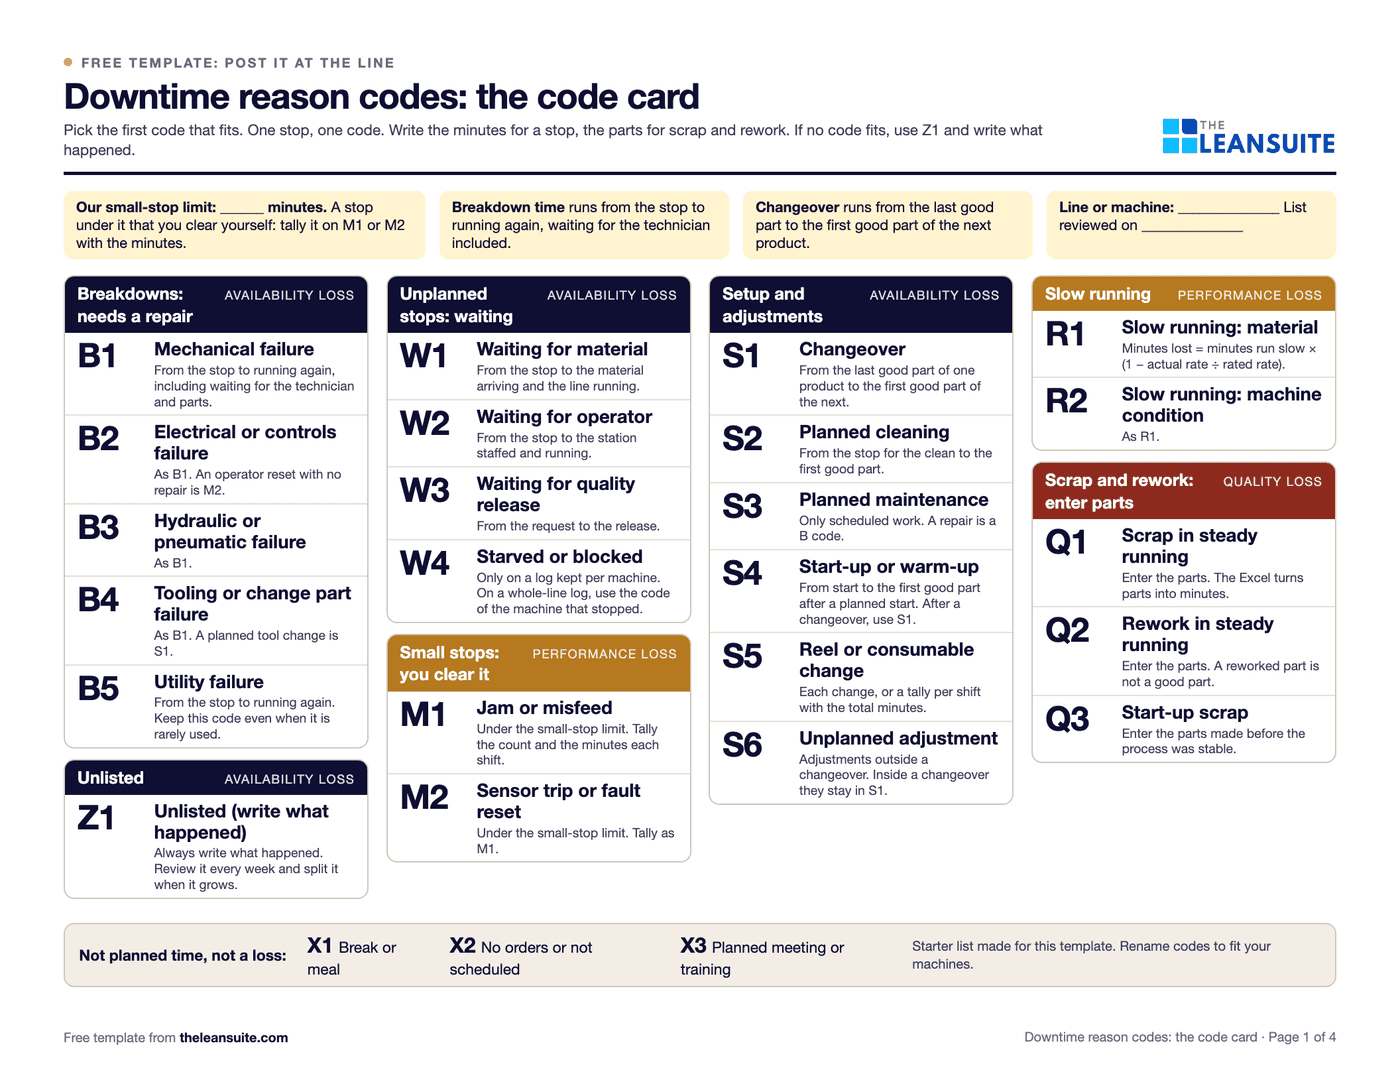 PDF and ExcelDowntime reason codes template26 starter codes mapped to the six big losses, a log with drop-downs, a Pareto by code and by loss, and a code card for the line.
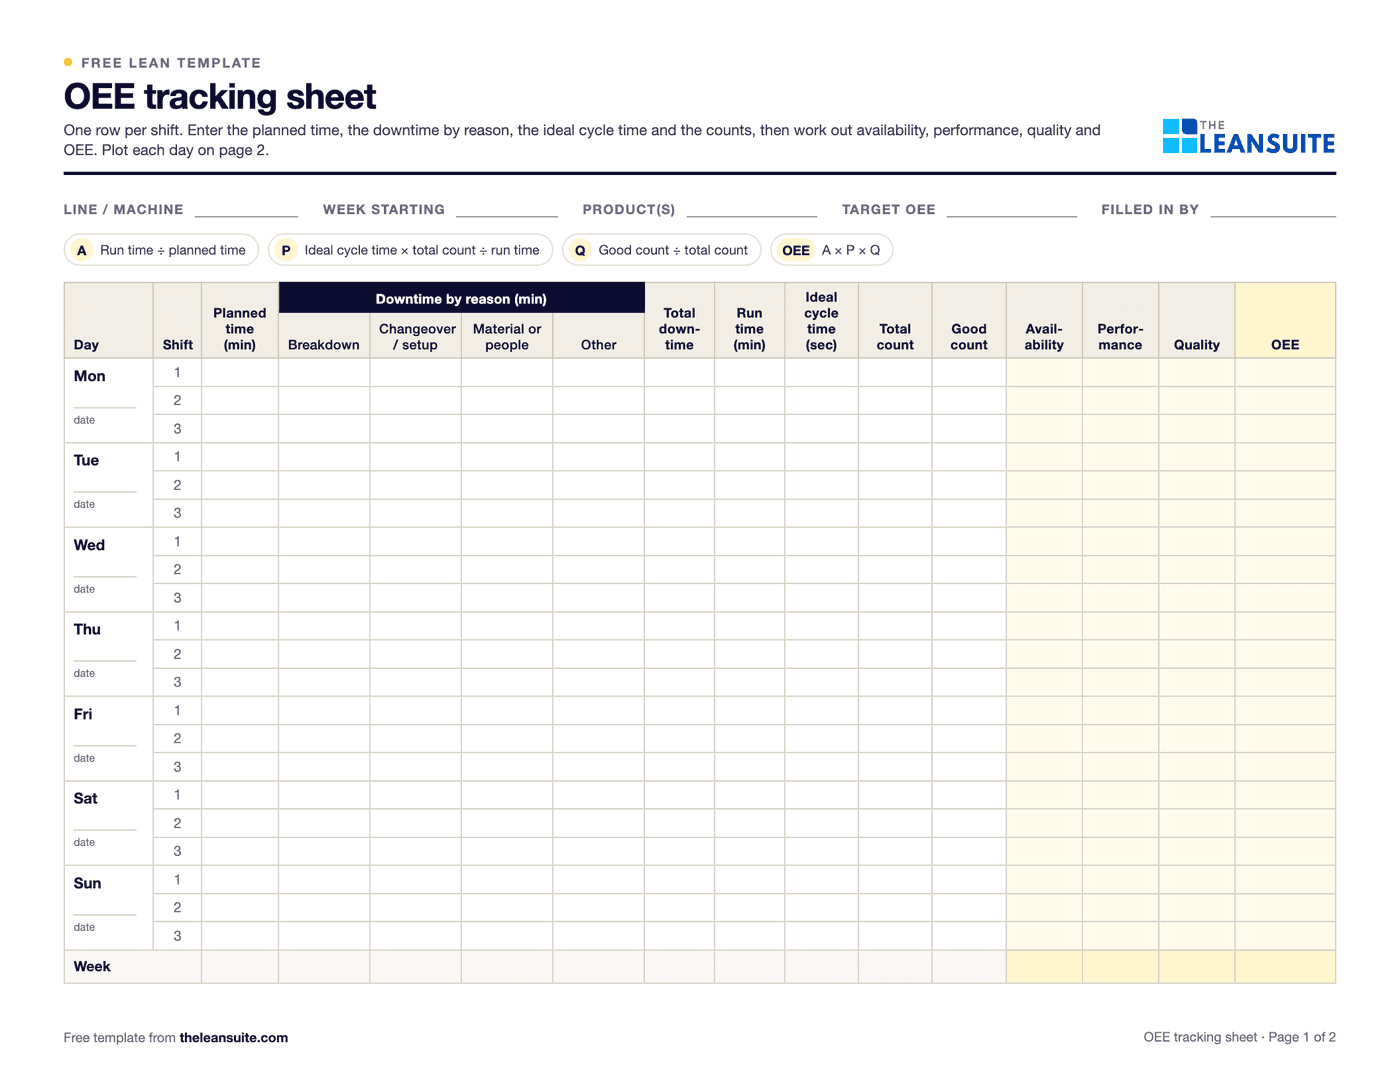 PDF and ExcelOEE tracking sheetOne row per shift for a week. The Excel version works out availability, performance, quality and OEE and charts the week.
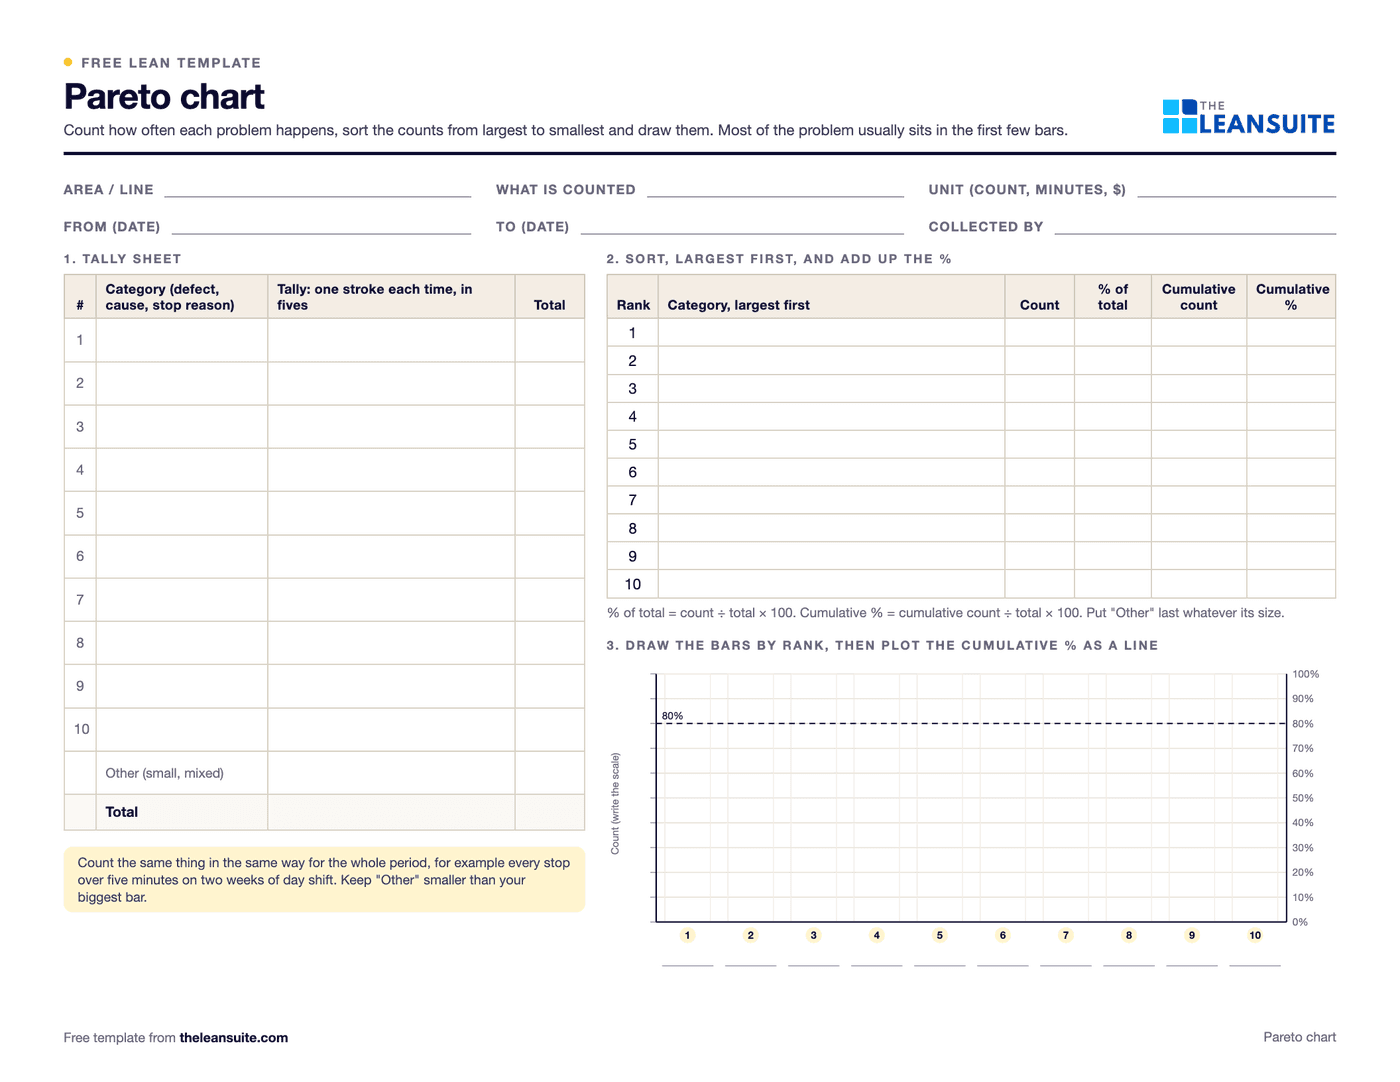 PDF and ExcelPareto chart templateA tally sheet, the Pareto by count and by cost with the cumulative line and the 80% cut, and a before and after comparison. Excel sorts and draws it.
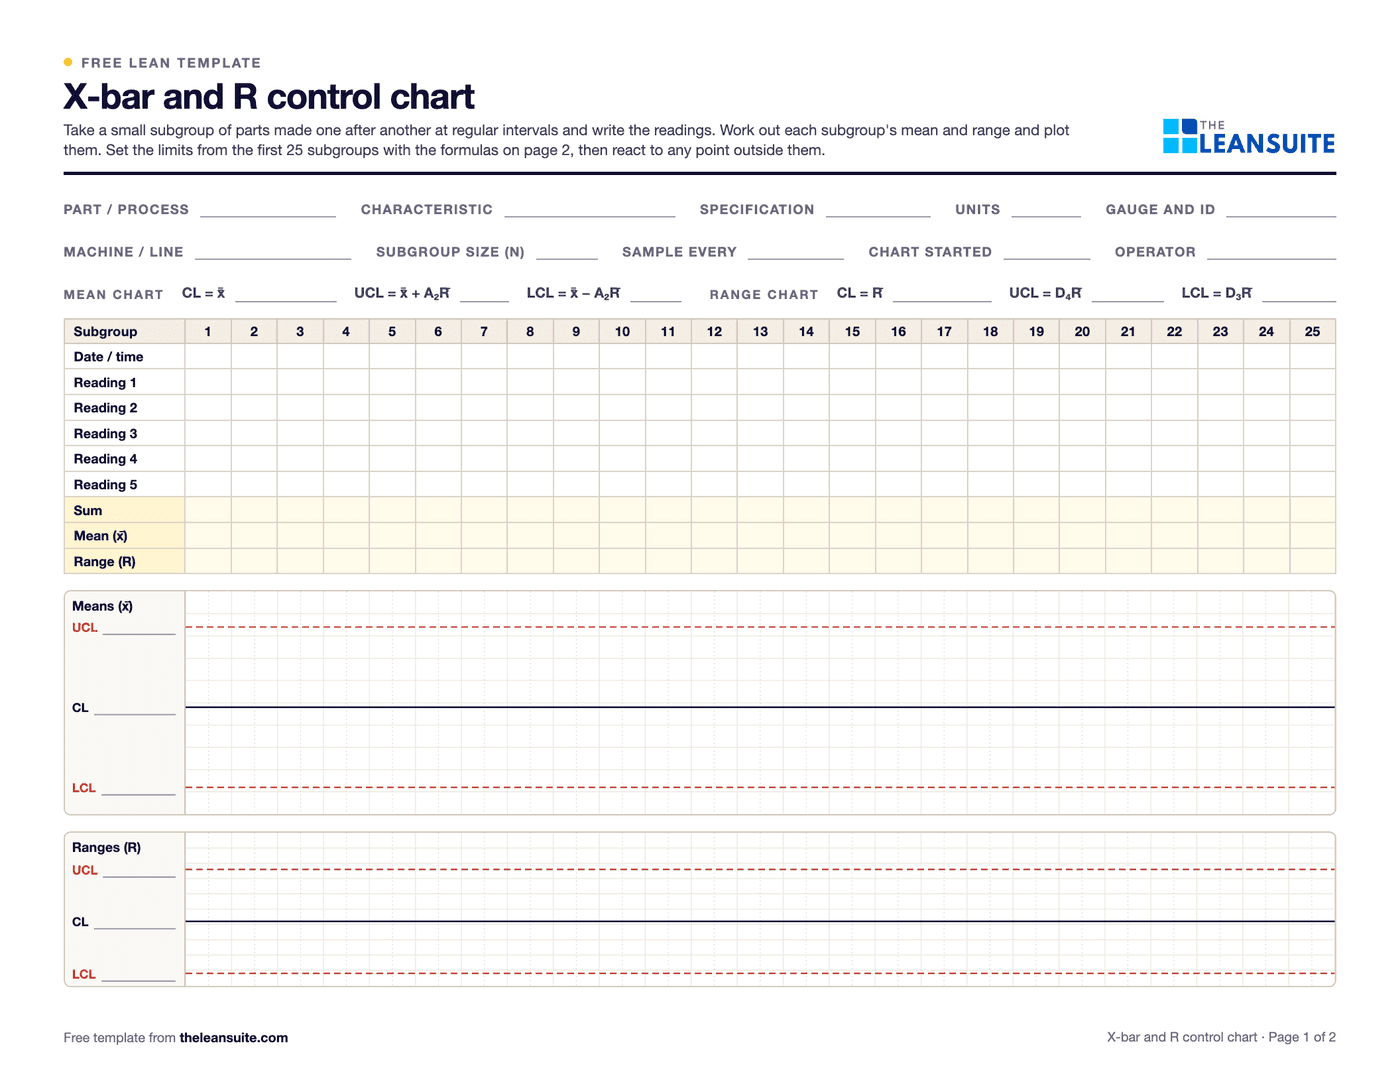 PDF and ExcelX-bar and R control chart template25 subgroups with means and ranges, control limits from A2, D3 and D4, signal flags, both charts and a reaction log.
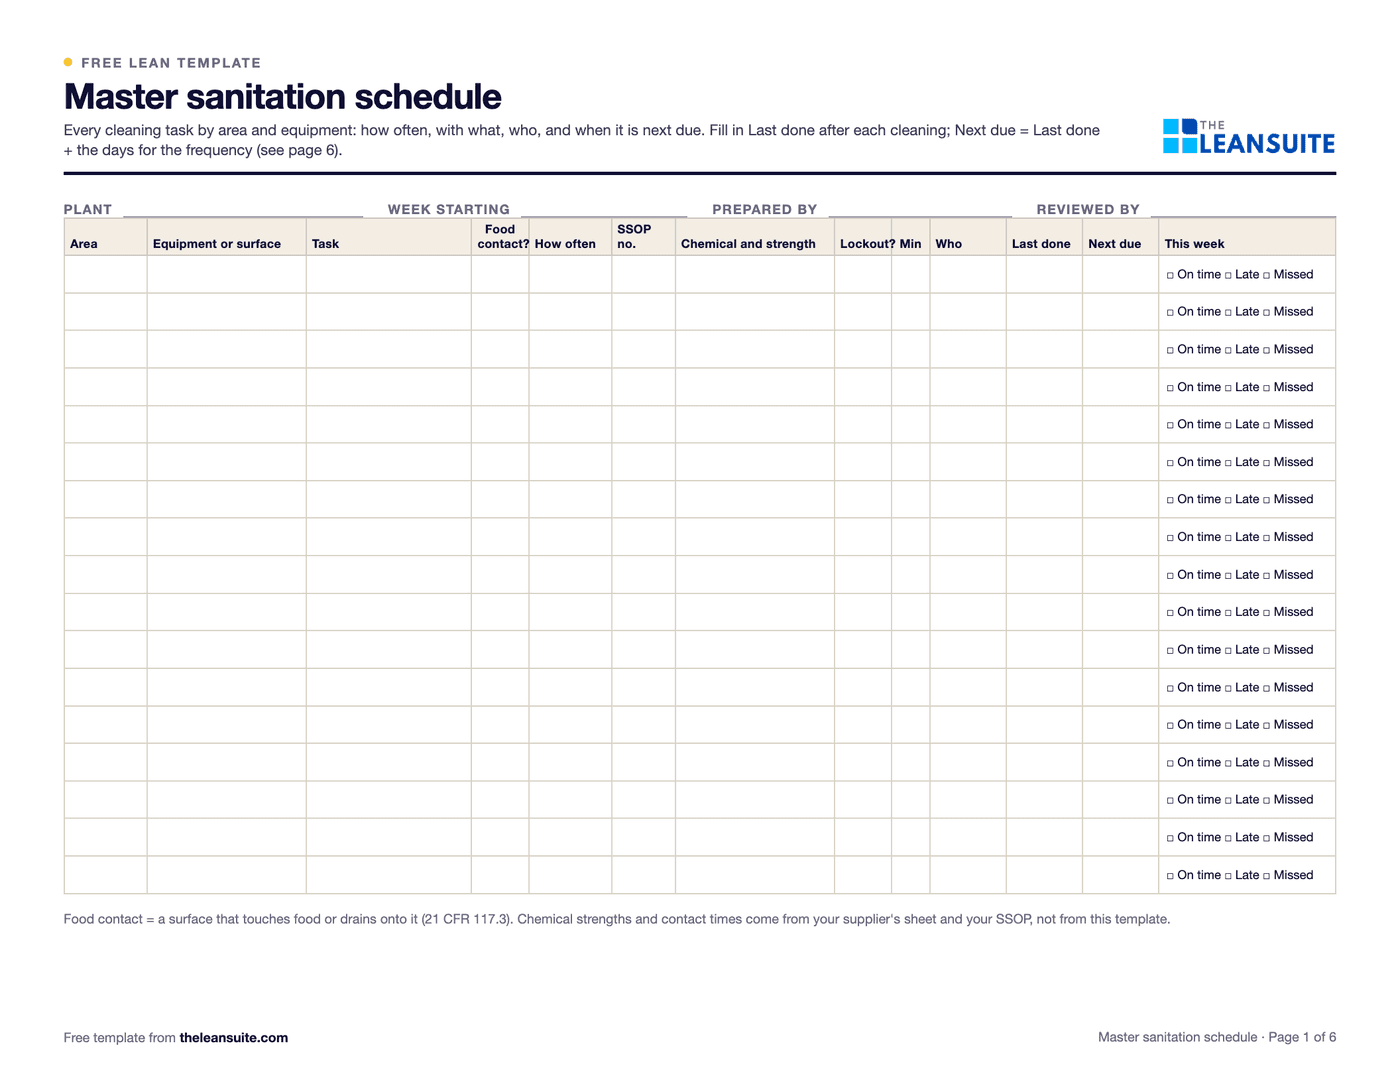 PDF and ExcelMaster sanitation schedule with pre-op verificationA master list of cleaning tasks by area and equipment with frequency, chemical, lockout, who and next due date, a weekly on-time count, and the pre-operational verification log with a release step.
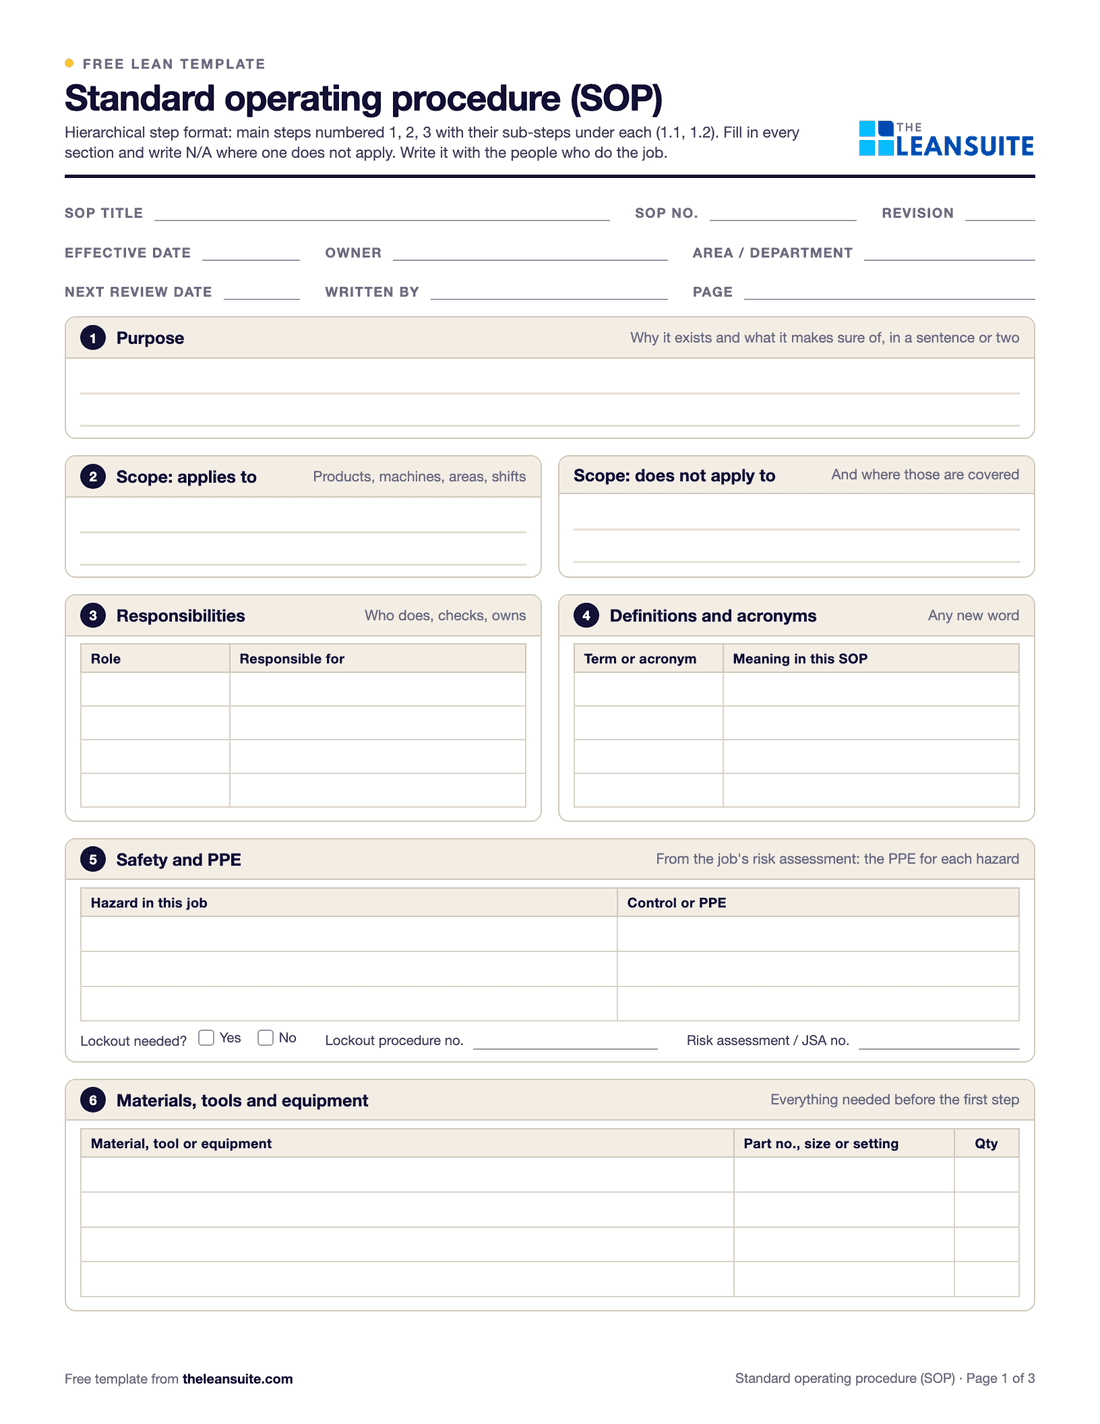 PDF and ExcelStandard operating procedure (SOP) templateA full SOP in the hierarchical step format, from purpose and scope to the steps, records, revision history and approvals, with review checks and an SOP register.
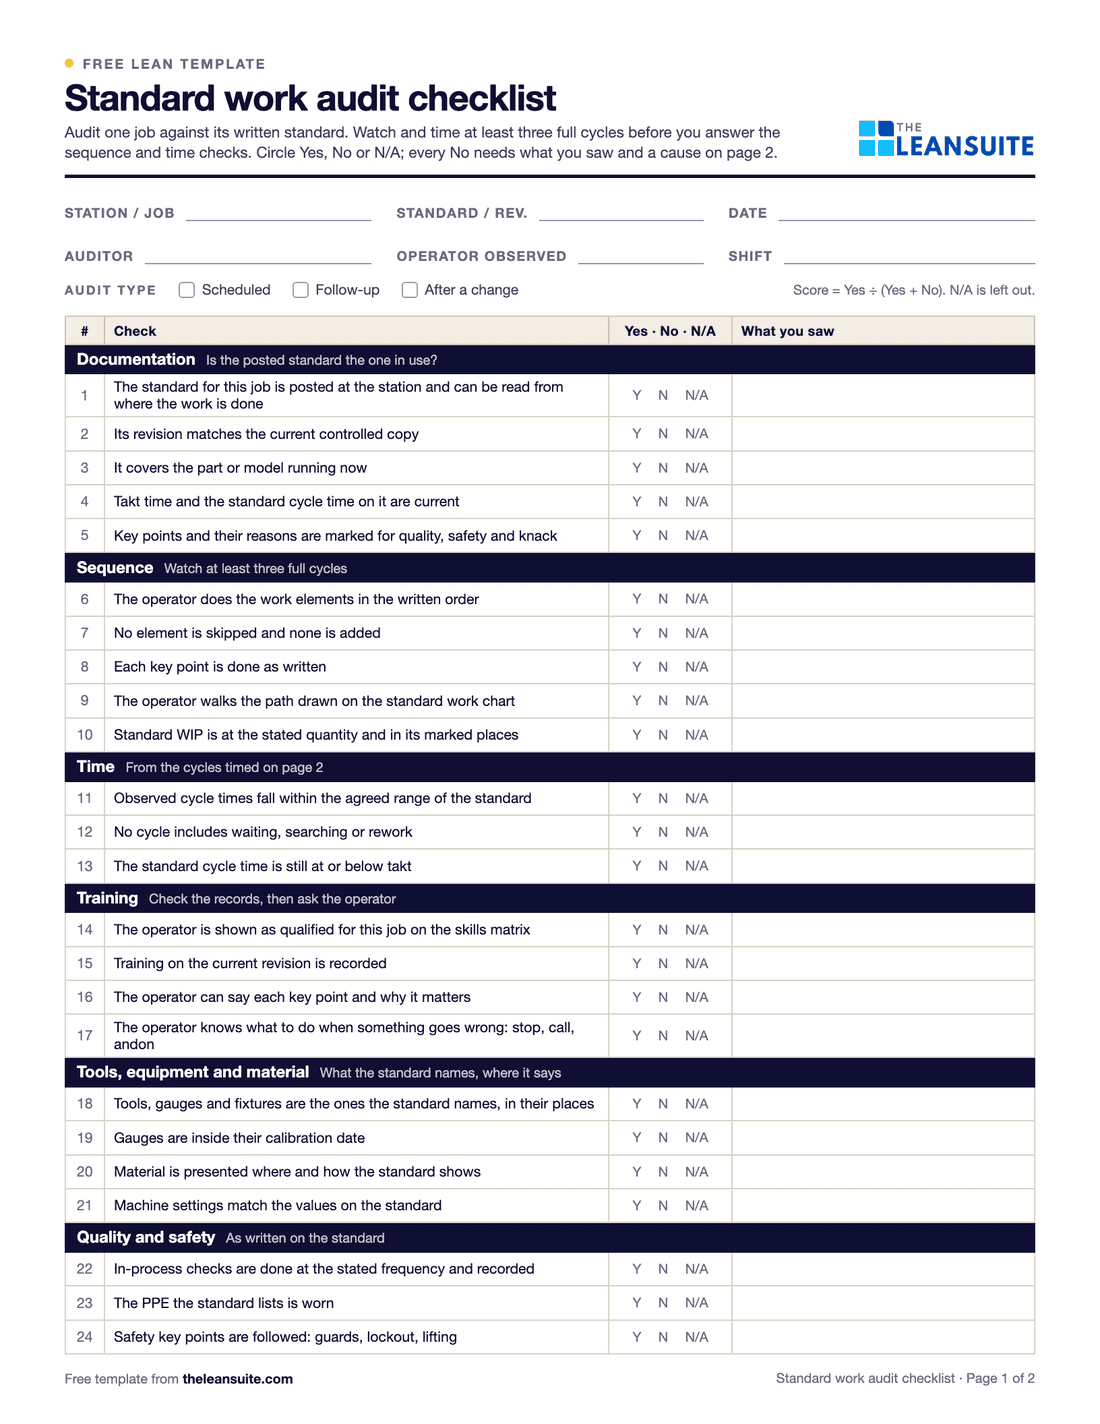 PDF and ExcelStandard work audit checklist24 checks of a job against its written standard, ten timed cycles, and each gap sorted by cause before anyone acts.
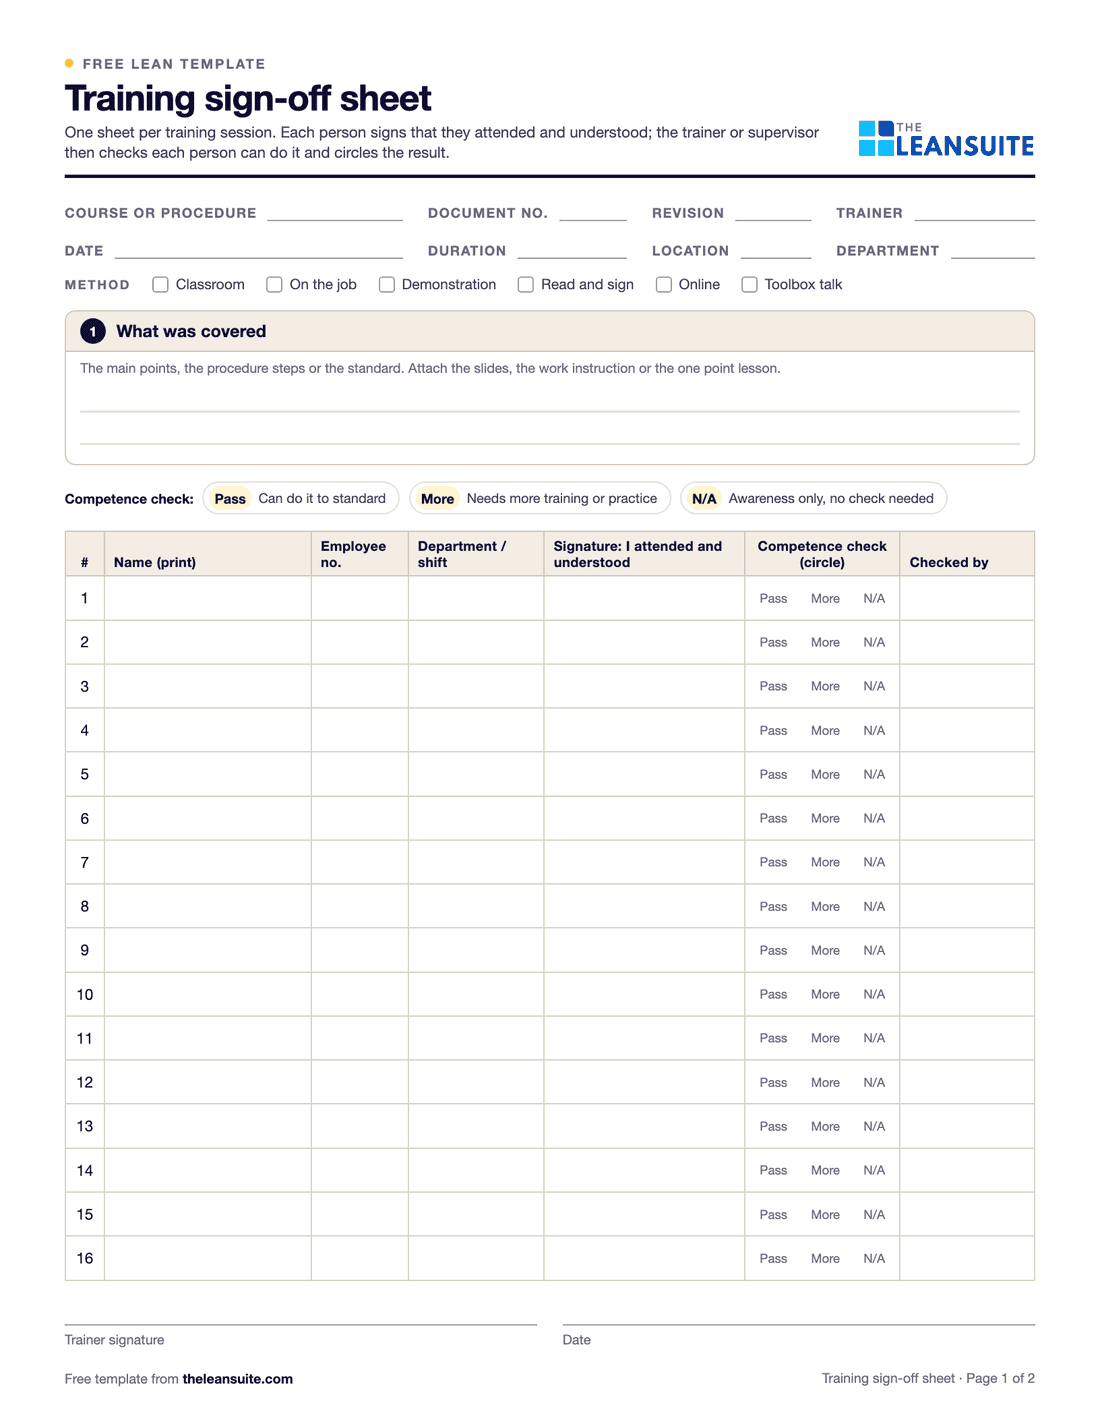 PDF and ExcelTraining sign-off sheetAn attendance and sign-off record where each person signs they understood, with a competence check and an Excel log.
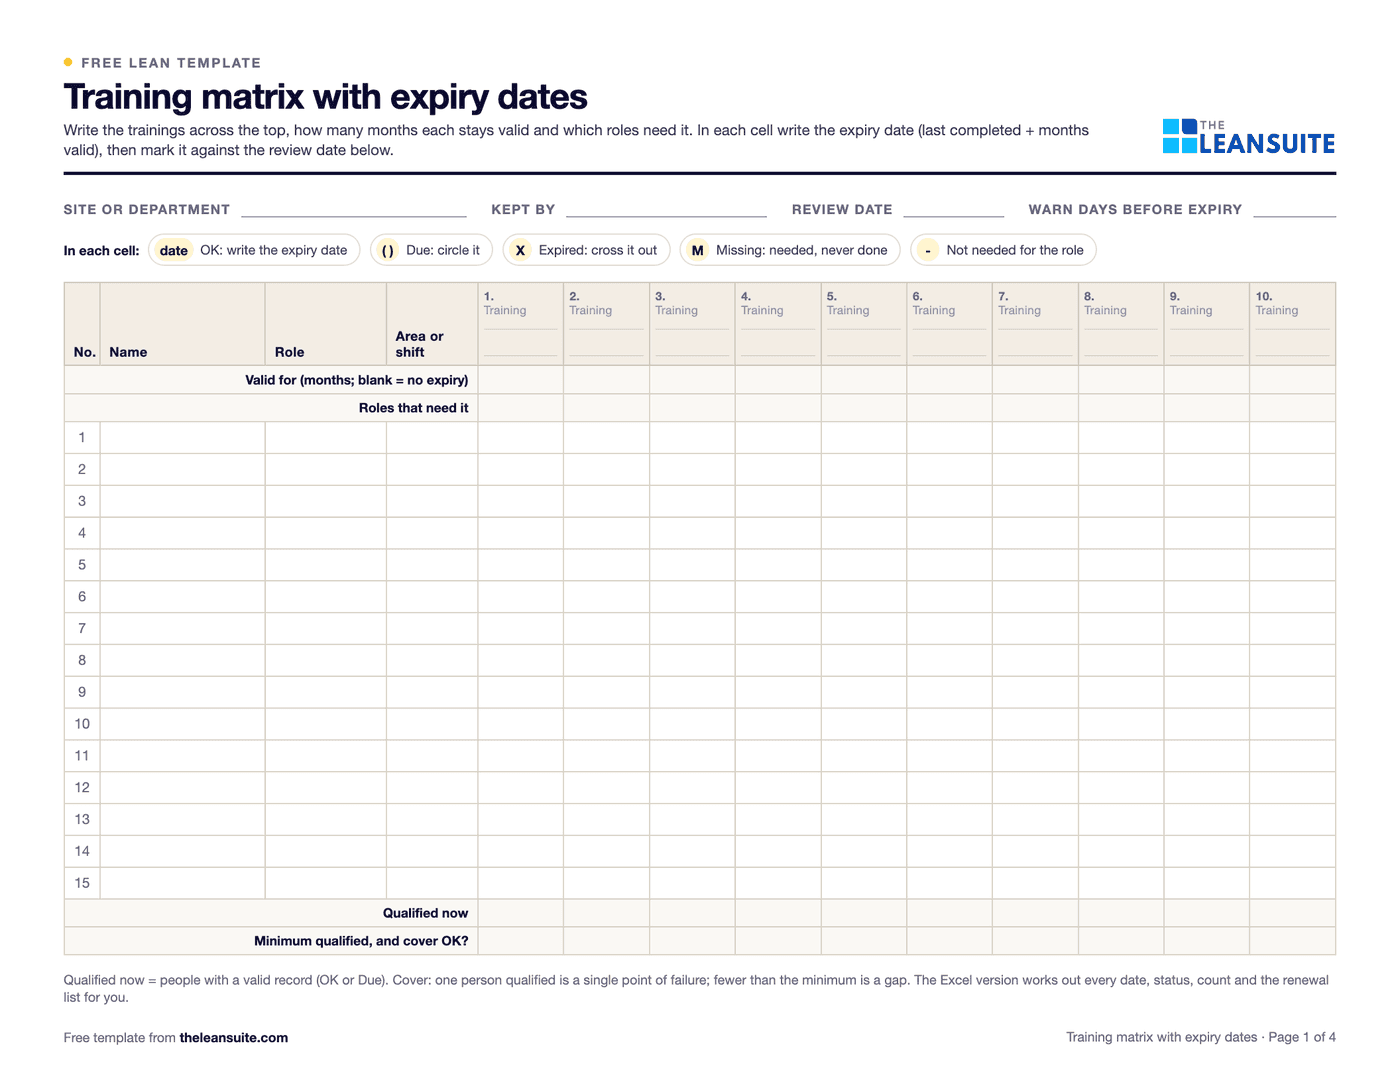 PDF and ExcelTraining matrix template with expiry datesPeople by required trainings with expiry dates, OK, due, expired and missing flags, compliance by person and area, cover per training and a renewal list.
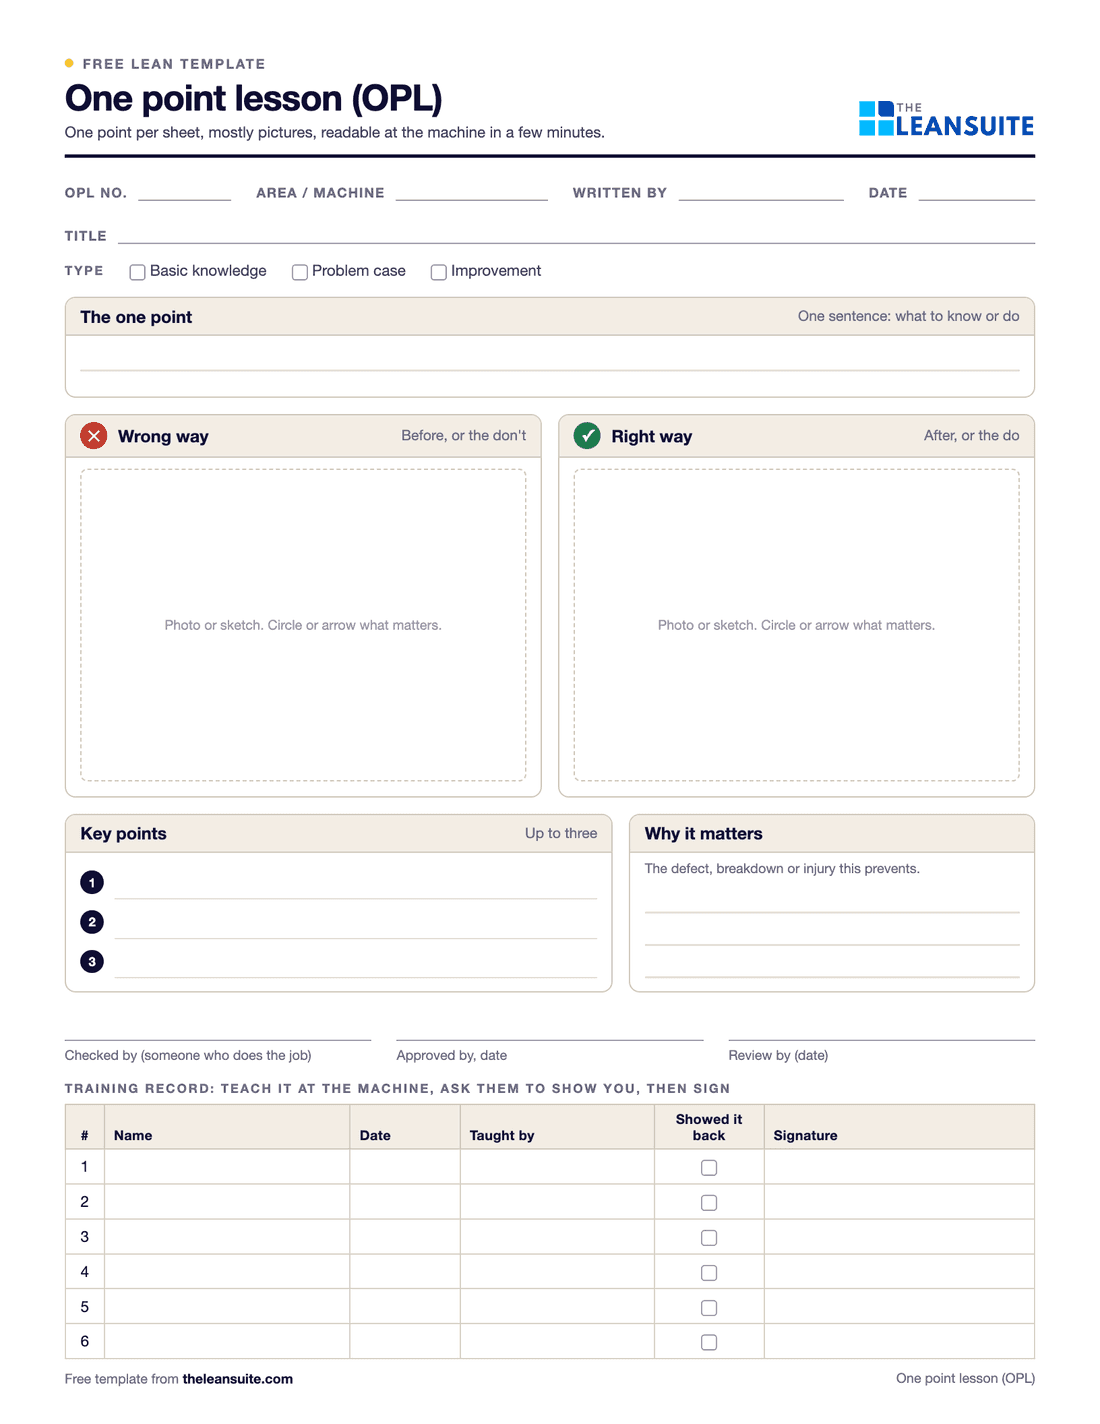 PDF and Excel and WordOne point lesson (OPL) templateOne topic on one page: wrong way and right way pictures, checkable key points, the standard it belongs to and a sign-off record.
Calculators (5)
- Free calculatorSMED changeover calculatorTime saved by moving changeover steps from internal to external, capacity freed per week and the smaller batch it allows.
- Free calculatorFirst pass yield (FPY) calculatorFirst pass yield at each step and rolled throughput yield (RTY) across the whole process.
- Free calculatorCost of poor quality (COPQ) calculatorTotal COPQ and cost of quality, and each as a share of revenue, from the four quality cost categories.
- Free calculatorOEE calculatorOverall equipment effectiveness from shift time, downtime, ideal cycle time and part counts.
- Free calculatorProcess capability (Cp, Cpk) calculatorCp and Cpk against your specification limits, plus Pp and Ppk from pasted measurements, with a distribution chart.
Buyer's guides
LeanSuite pages for these problems
- SMED
- AI SMED changeover analysis
- Audit Management
- Checklists
- Non-Conformance (NCR)
- Corrective Action Log
- Micro-stops
- Loss & Cost Management
- CILR Checklists
- Trainings (LMS)
- Competency Management
- AI SOPs
How LeanSuite handles each of these is on the page for cosmetics and personal care plants.
Companies that use LeanSuite include Unilever.
Whirlpool tackled project visibility and continuous improvement across 14 manufacturing plants with LeanSuite. Read the Whirlpool case study.
FAQ
Lean in cosmetics and personal care plants: common questions
Yes, and high SKU counts are where it pays most. The work shifts from speed to changeovers: shorter changeovers make short runs affordable, and a sequence that runs light to dark and unfragranced to fragranced cuts the number of full cleans.
On the filling line with the most changeovers. Time three changeovers, log the small stops for two weeks and measure OEE and right-first-time batches. Then fix the two biggest losses before moving to the next line.
Make line clearance a written checklist that names every station and component, have a second person verify it before the first unit runs, and error-proof look-alike components with colors, barcodes or a label scanner at the labeler.
Filling-line OEE, changeover time, right-first-time batches, line clearance pass rate, fill weight giveaway and training coverage. Track them per line and per shift, and review them at a short daily meeting.
See LeanSuite on your changeovers and line clearance
Bring the routine you want to fix first. We will show you how LeanSuite handles it and what a 90-day pilot would cover.