Skip to content

Lean playbook · Glass

Lean playbook for glass manufacturing plants

Short answer

In a glass plant the furnace never stops, so lean starts with pack-to-melt: the share of the glass melted that ends up packed and sold. Split the loss by where it happens: job changes, forming defects, machine stops at the hot and cold end, and inspection rejects. Then work on the biggest piece first. SMED shortens job changes. A daily care routine and breakdown analysis cut stops. A defect tally by type and by the area that makes it points the hot end and the cold end at the same problem.

Last updated:

7 problems on the floor, and the lean methods for each

Each problem says what it looks like, which methods address it, the first moves to make and the number to watch. Pick the one or two that cost your plant most; you do not need all of them at once.

Where a glass plant loses time and quality

A simplified line, not a plant layout. Select a number to jump to that problem.
  1. Job changes that take hours to settle

    Changing the ware on an IS machine means new molds, plungers, settings and swabbing, and a new thickness or width on a float line takes hours to settle. The furnace keeps pulling the whole time, so the glass made until the line is back to speed and quality goes back as cullet.

    In LeanSuite

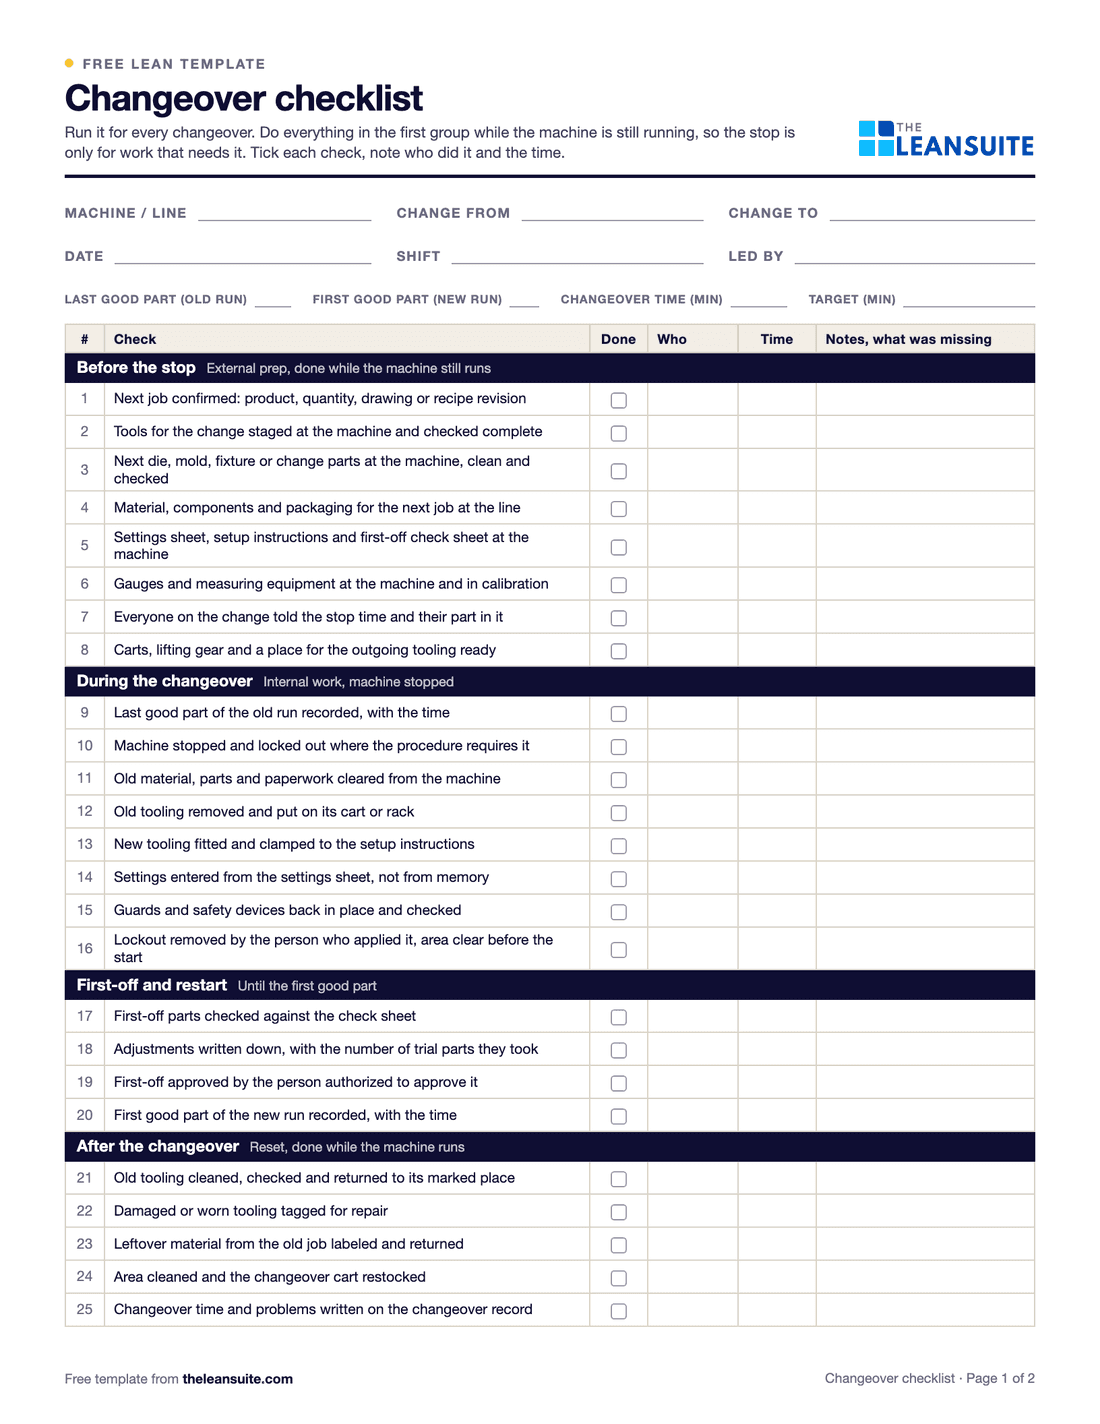
    Run each changeover as a visual checklist in Lean Creator and require a photo on the steps that matter most.

    First moves

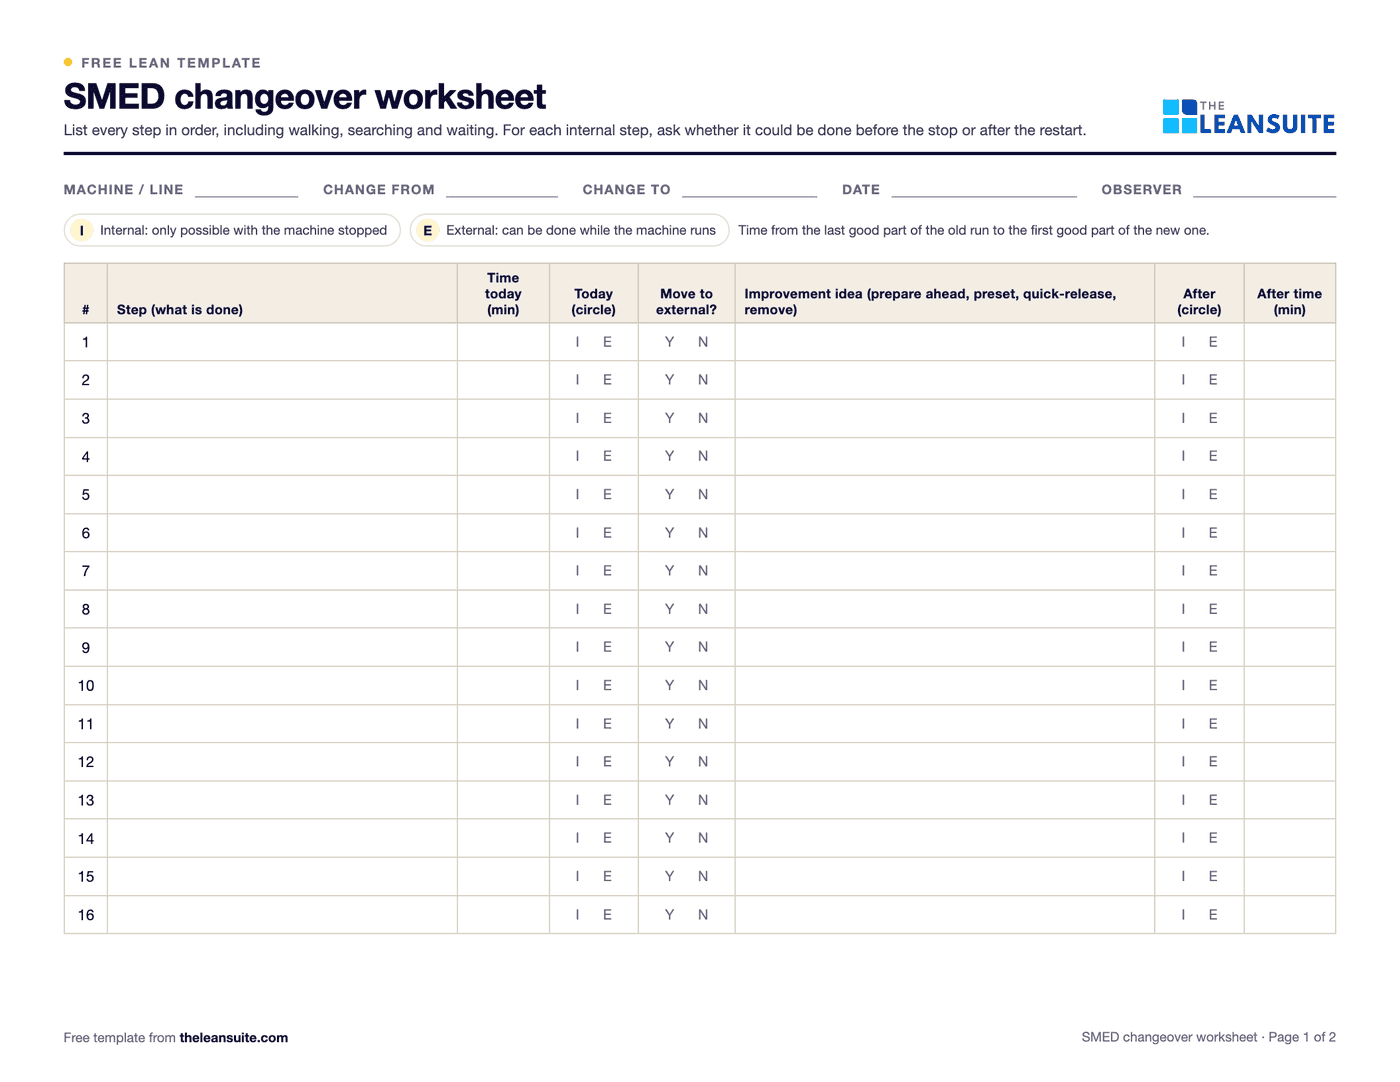
    1. Film one job change and list every step, marking which ones need the section or line stopped.
    2. Prepare and preheat the next molds and parts off the machine, with a checked kit, before the change starts.
    3. Record the settings that produced good ware for each job, and start the next run of that job from them.
    4. Measure the change to the first ware that passes inspection at full speed, not to the first gob.

    Number to watch: Job change time to good ware at full speed, and tonnes lost per change.

  2. Defects made upstream and found at the cold end

    Stones and seeds start in the batch house and the furnace, checks, thin walls and finish defects at forming, and stress in the lehr, but they are all counted at the cold end. Without knowing where each defect starts and what it costs, each area blames the one before it.

    In LeanSuite

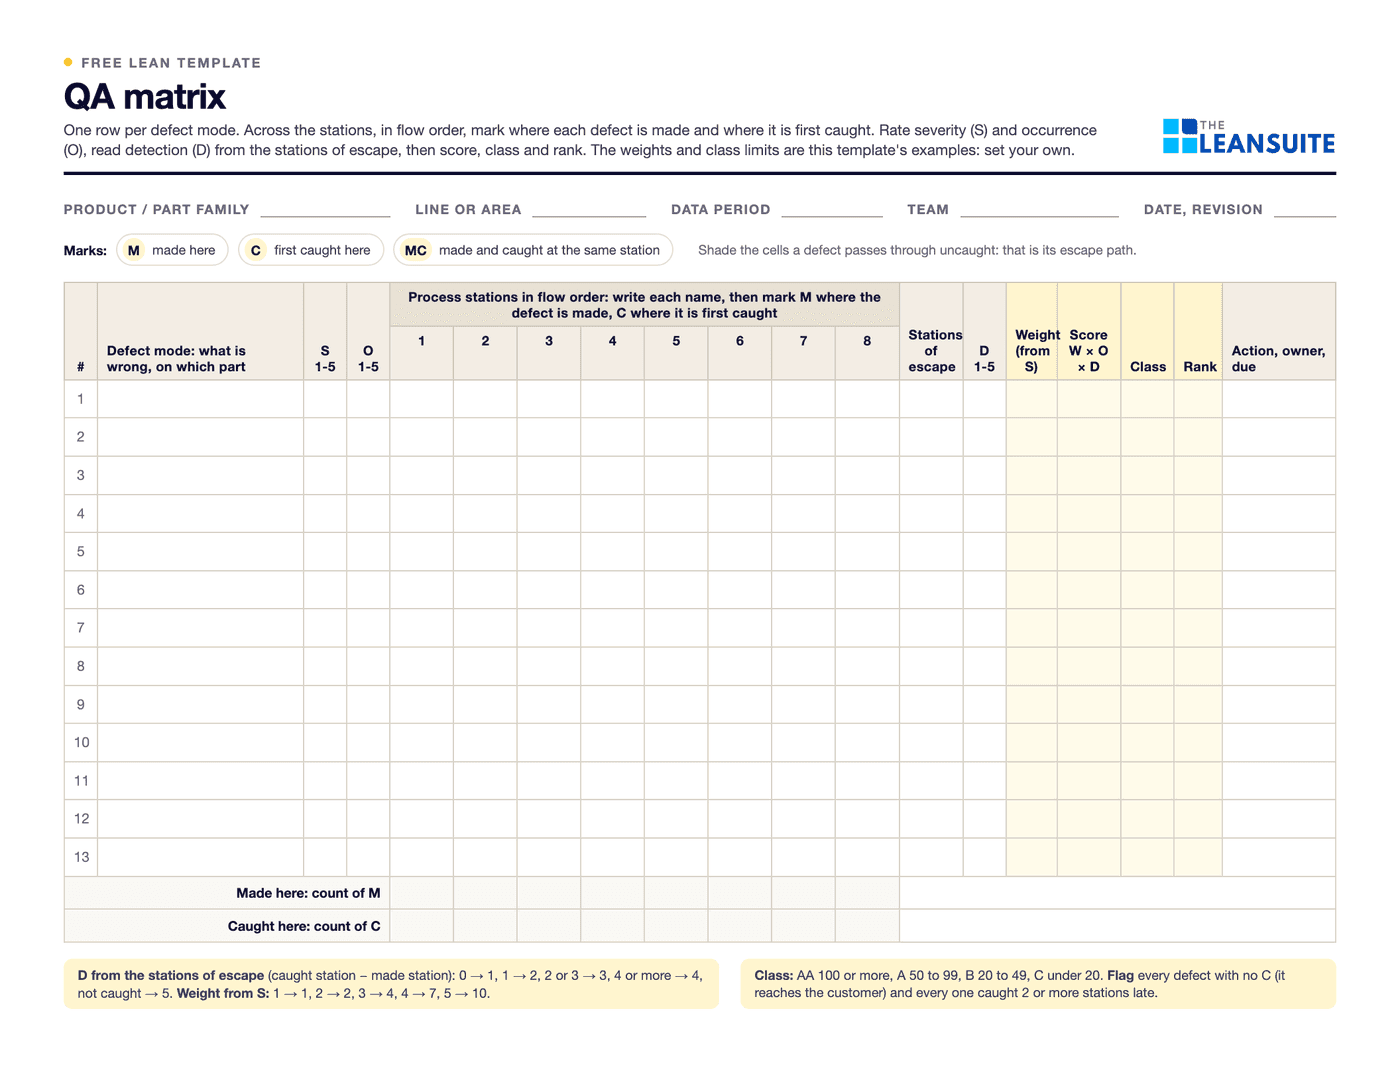
    The QA Matrix gives every internal and customer defect an AA, A, B or C priority from cost, frequency, severity and detection point, with weights you set.

    First moves

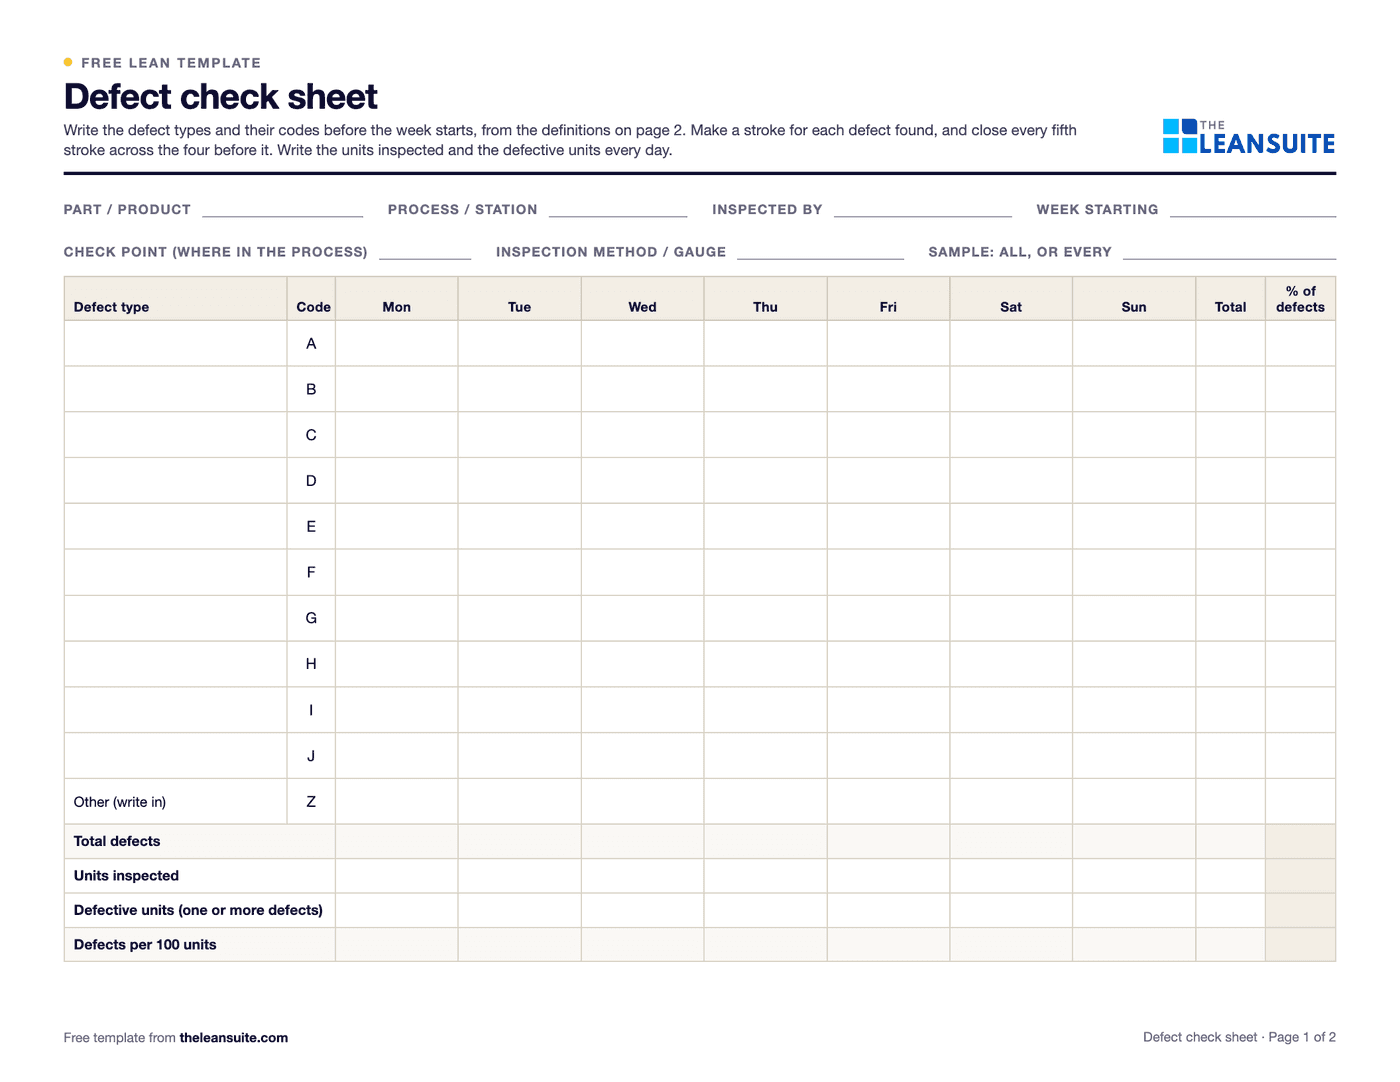
    1. Tally cold-end rejects by defect type and by forming section or cavity every shift.
    2. Mark on a QA matrix where each defect is made and where it is first found.
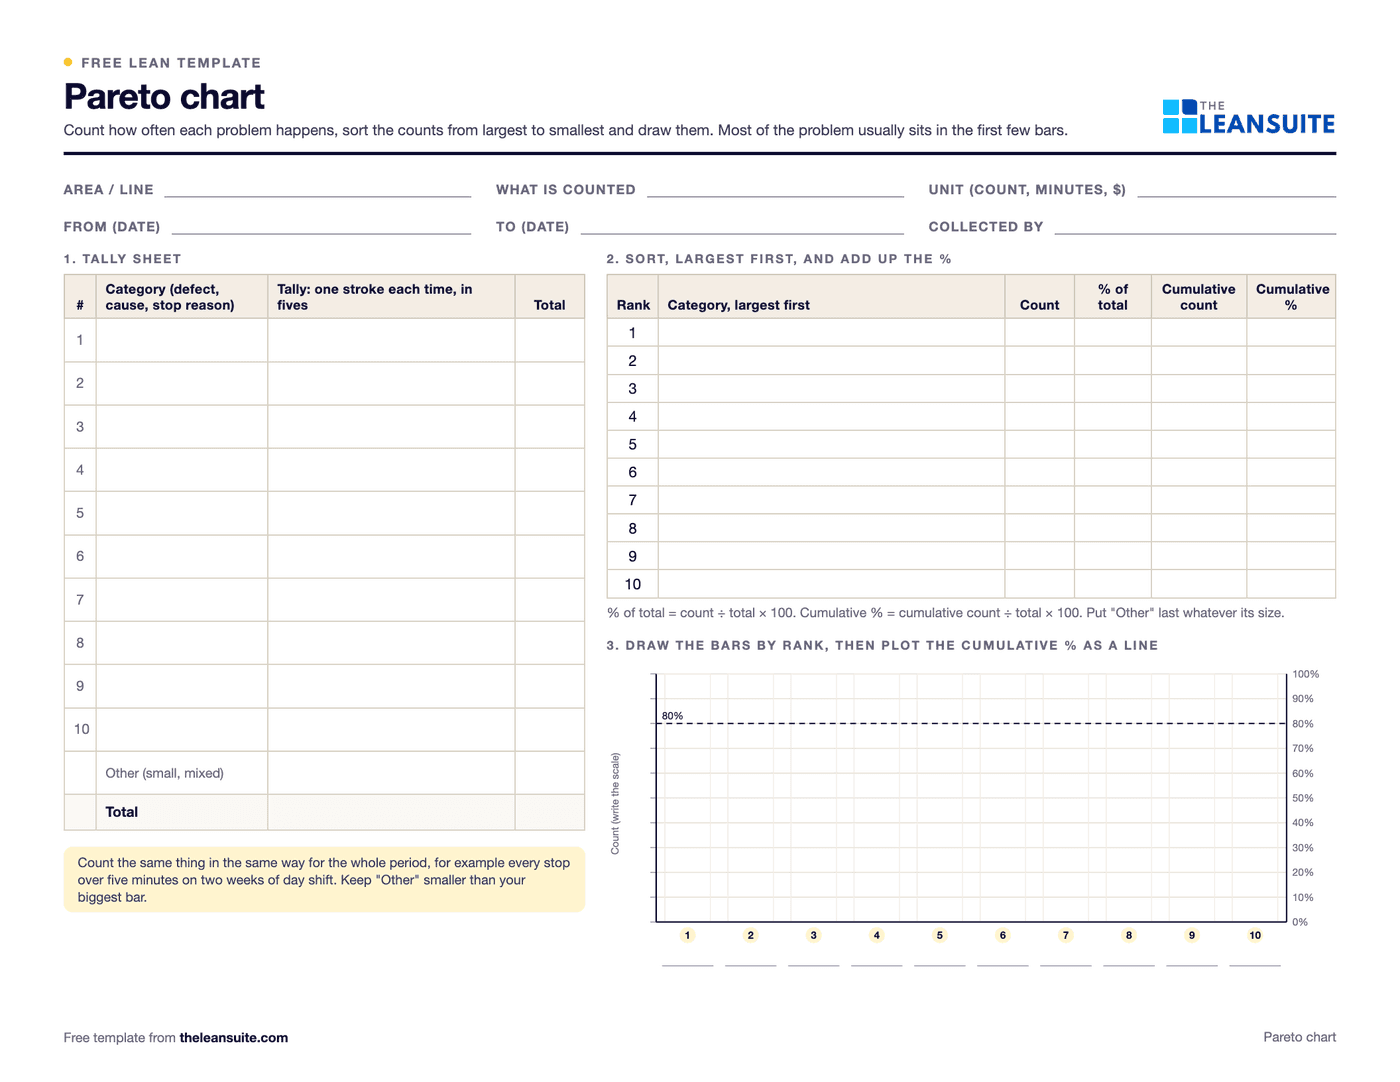
    3. Pareto the rejects by tonnes lost and take the top defect to the area that makes it.
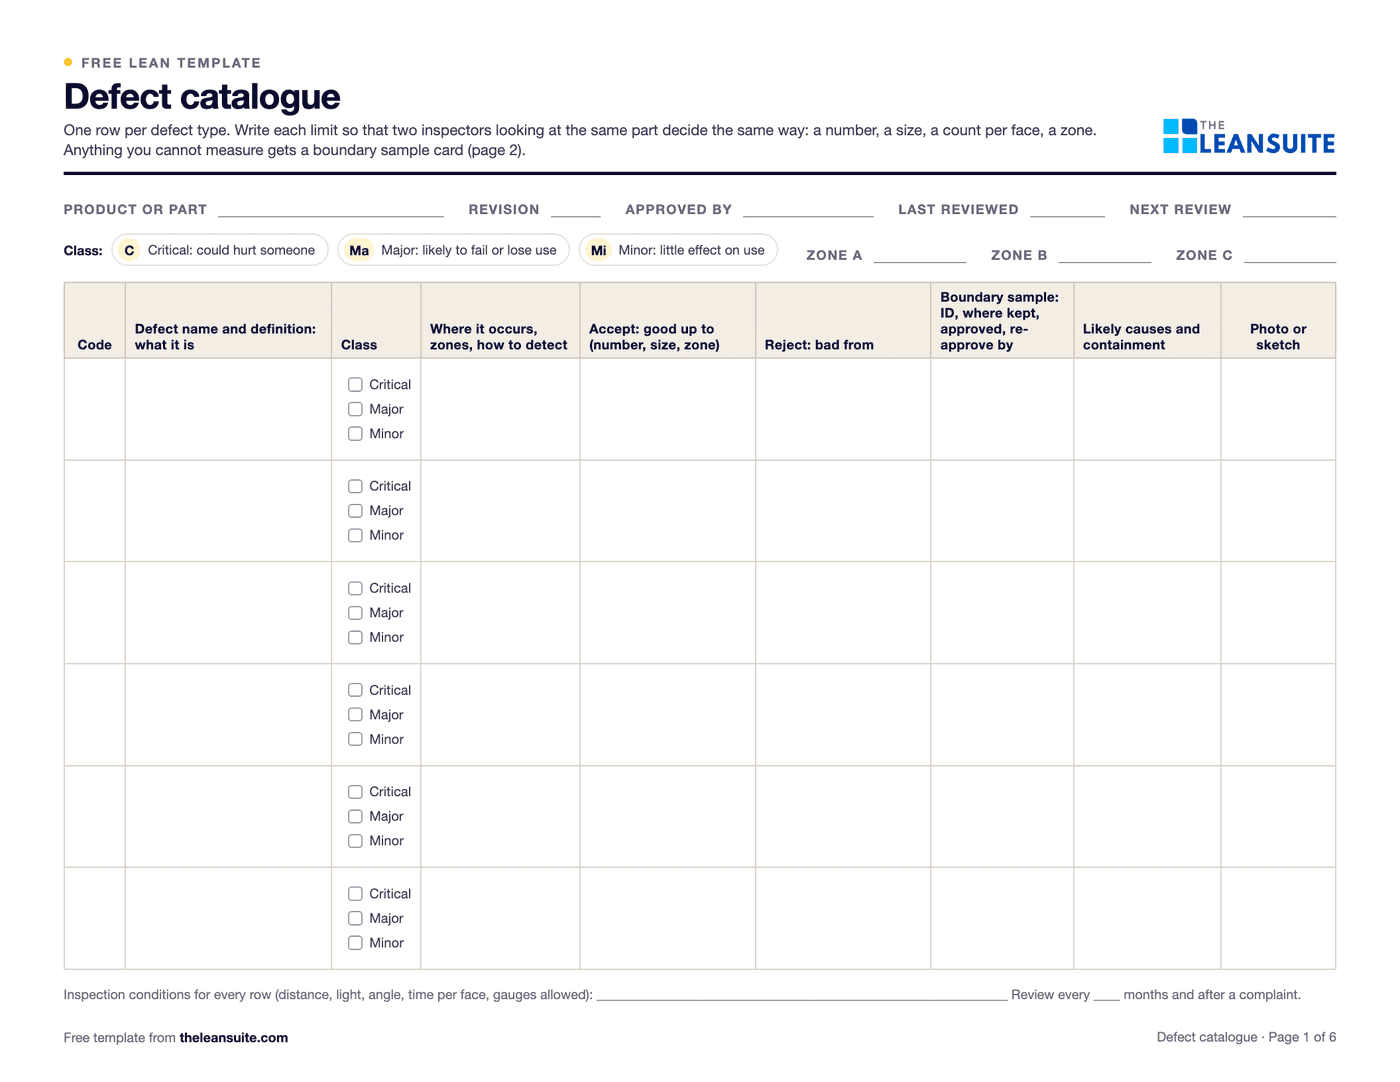
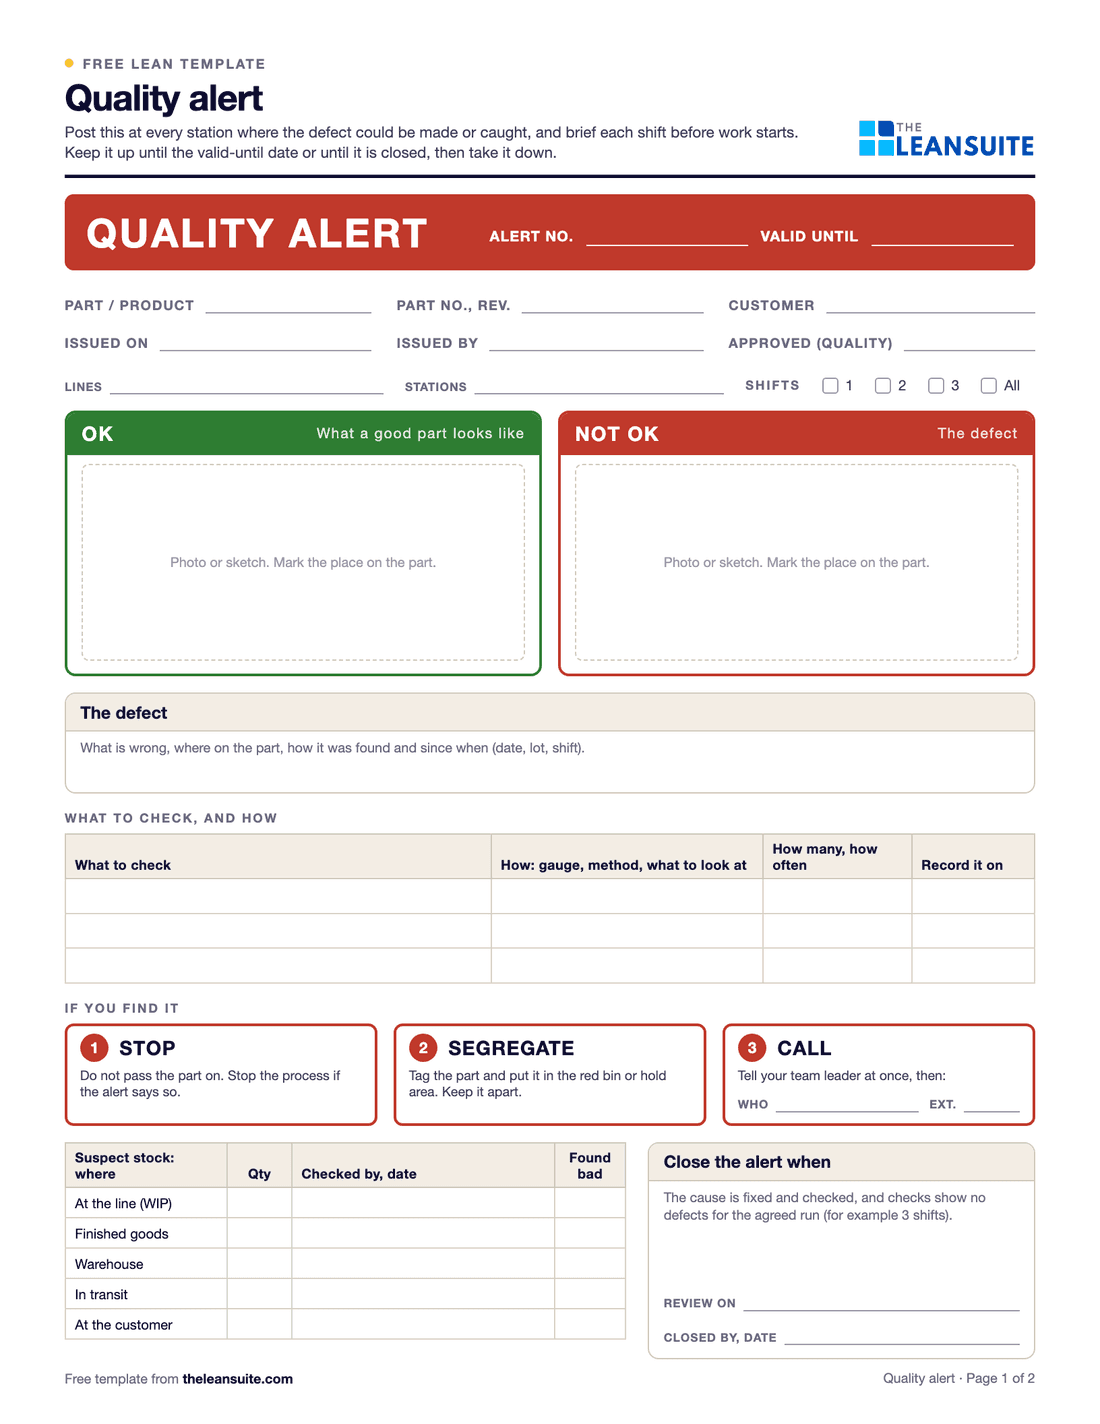
    4. Agree photos of acceptable and unacceptable ware for each critical defect, and post them at the hot end and the cold end.

    Number to watch: Rejects by defect type, as a share of ware inspected.

  3. Stops on forming machines, conveyors and the cold end

    Forming machines, conveyors, lehr belts, inspection machines and palletizers stop for jams, wear and missed lubrication. The furnace does not stop with them, so every minute down is glass melted and sent back as cullet.

    First moves

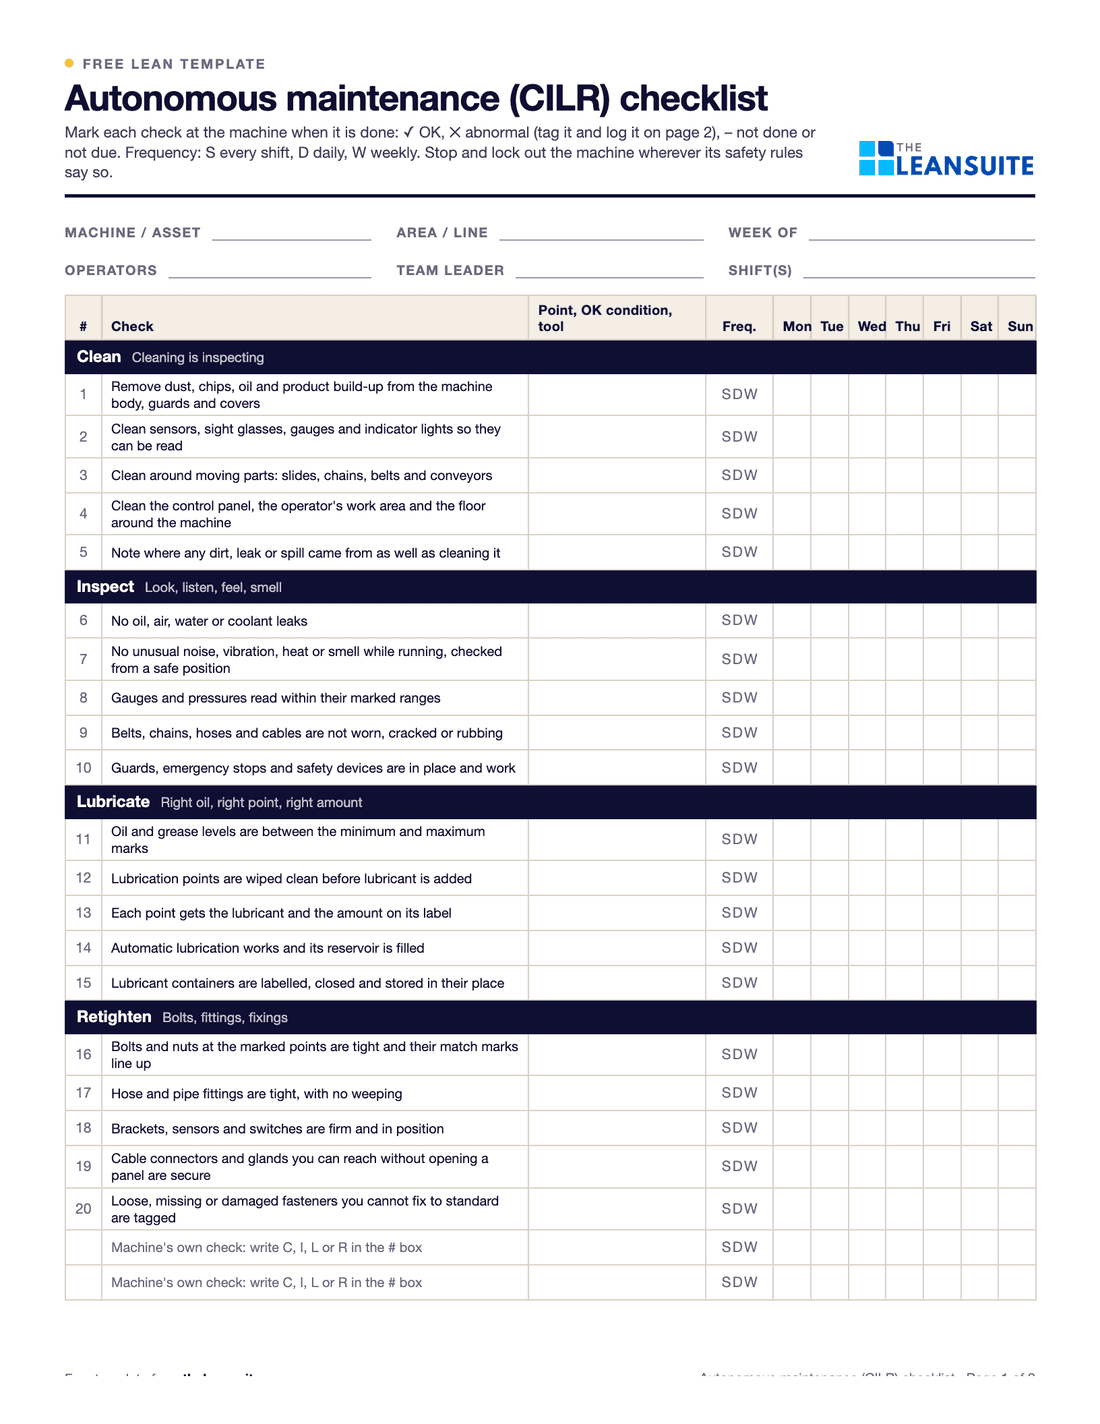
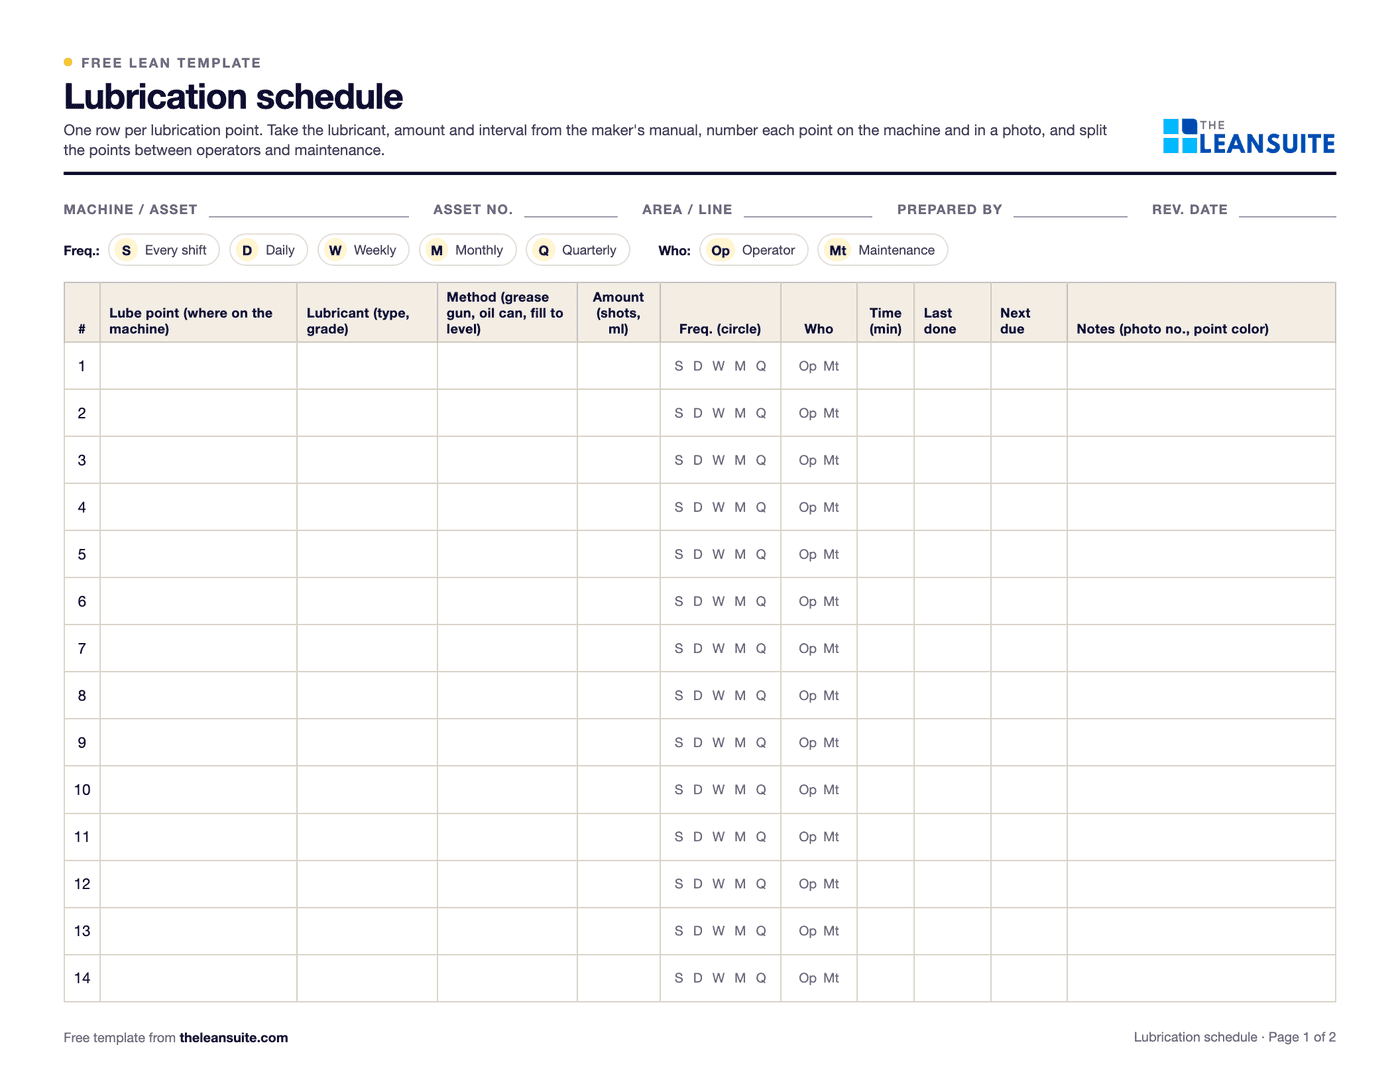
    1. Write a daily clean, inspect, lubricate and retighten routine for the machine that stops most, with photos of the OK condition.
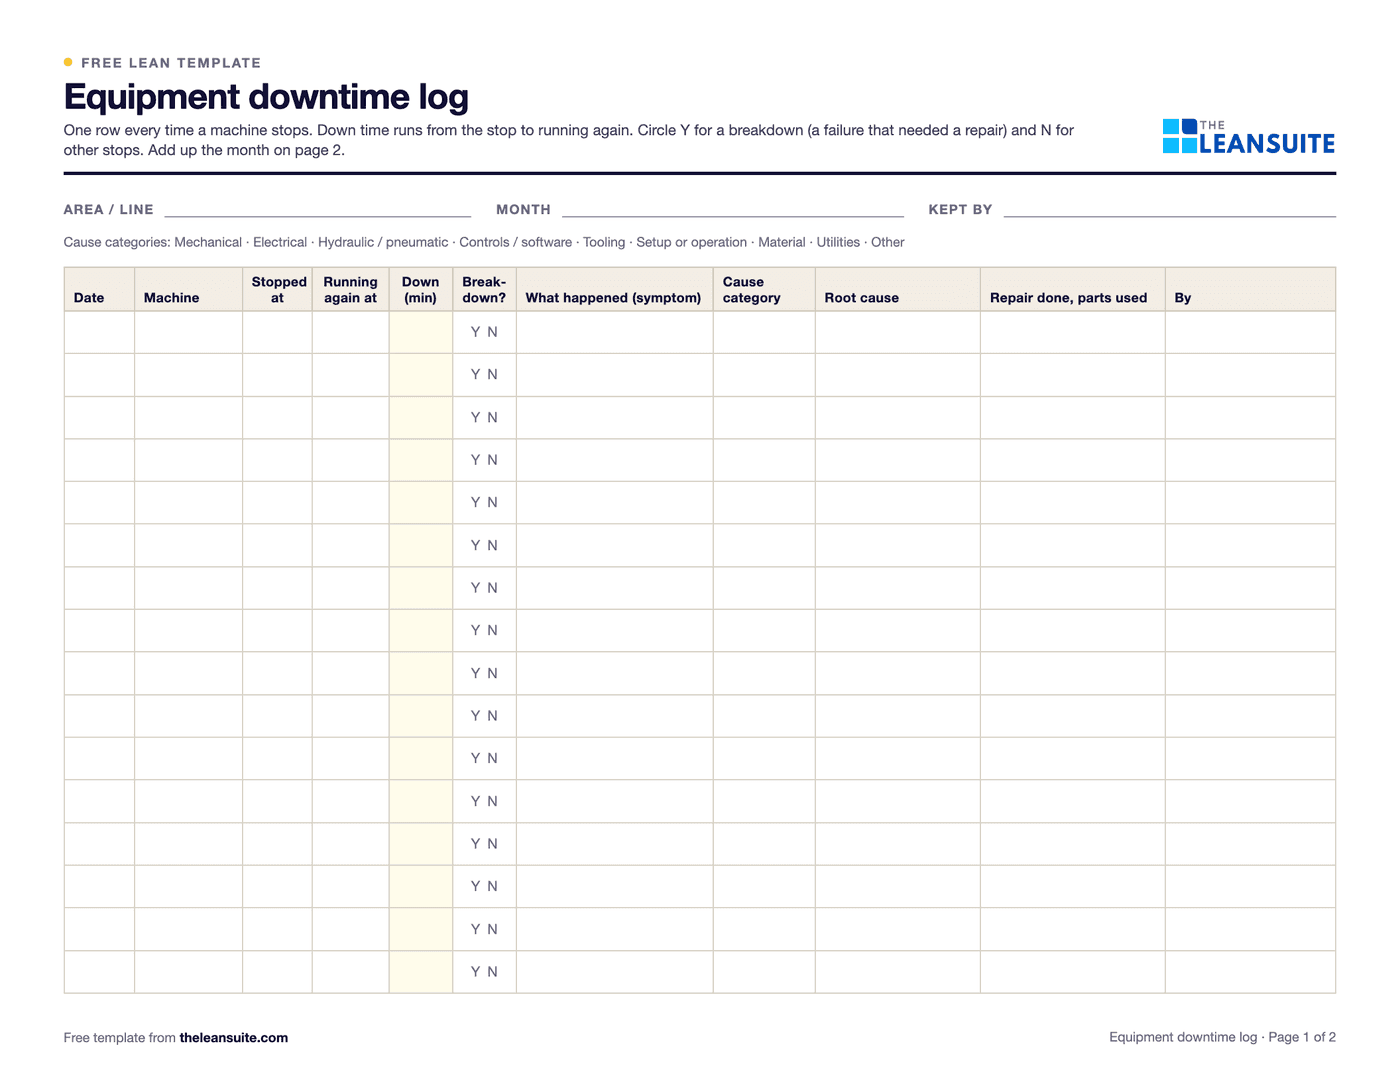
    2. Log every stop with its cause and duration, at the hot end and the cold end.
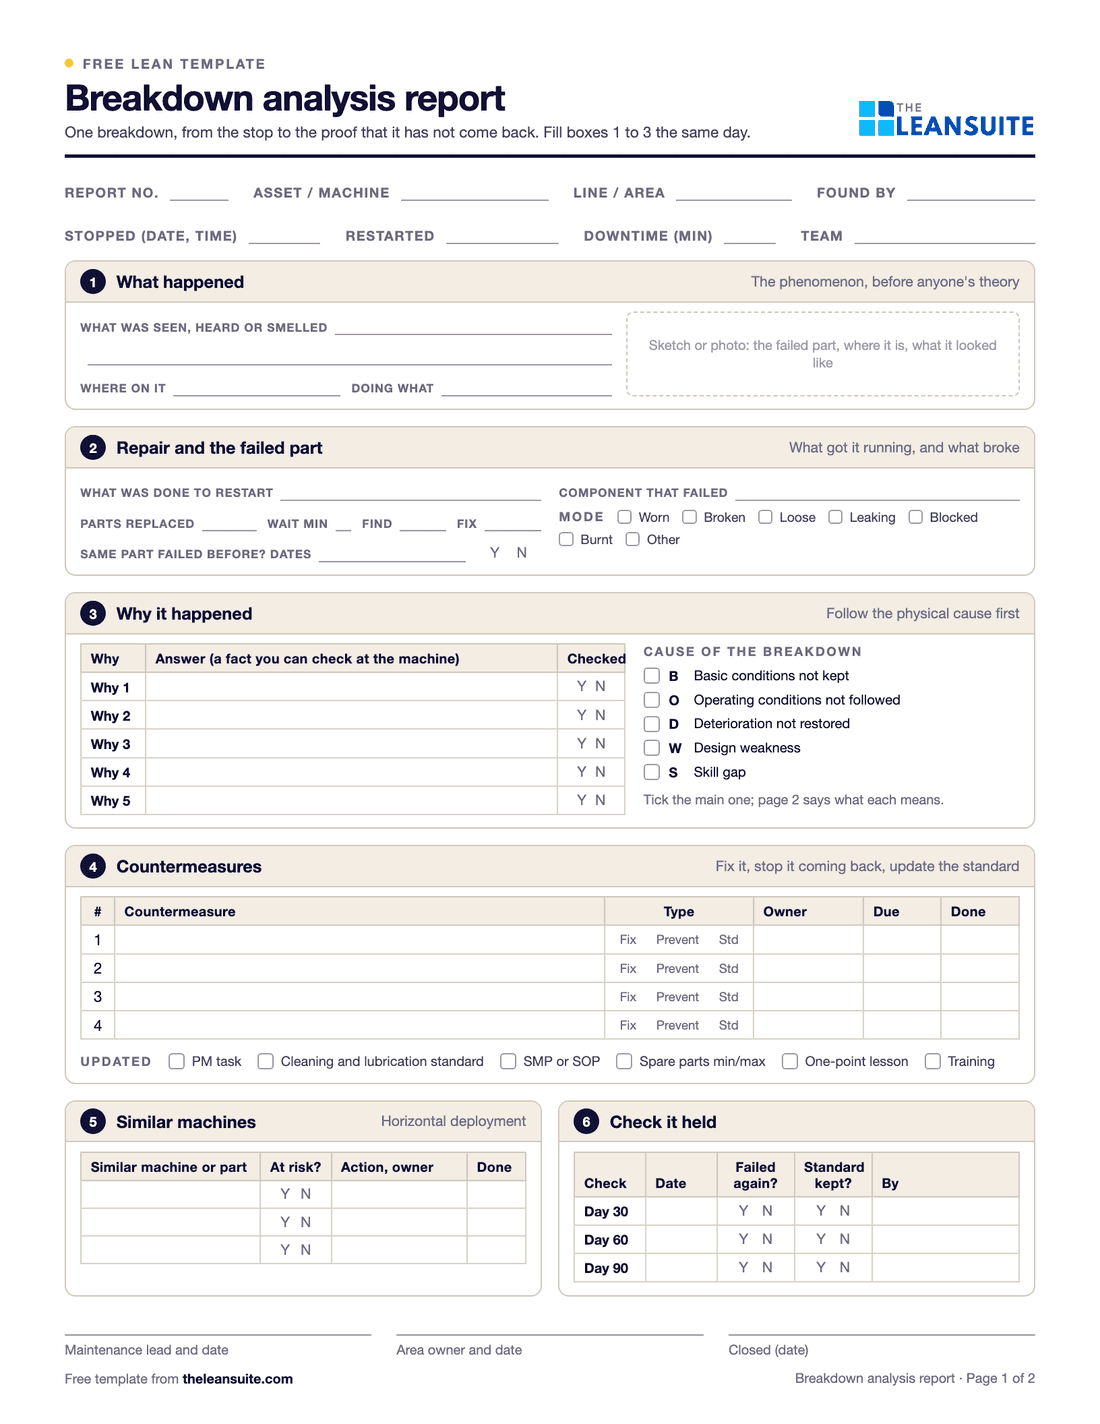
    3. Analyse the longest breakdowns with maintenance, and fix the cause, not just the part.
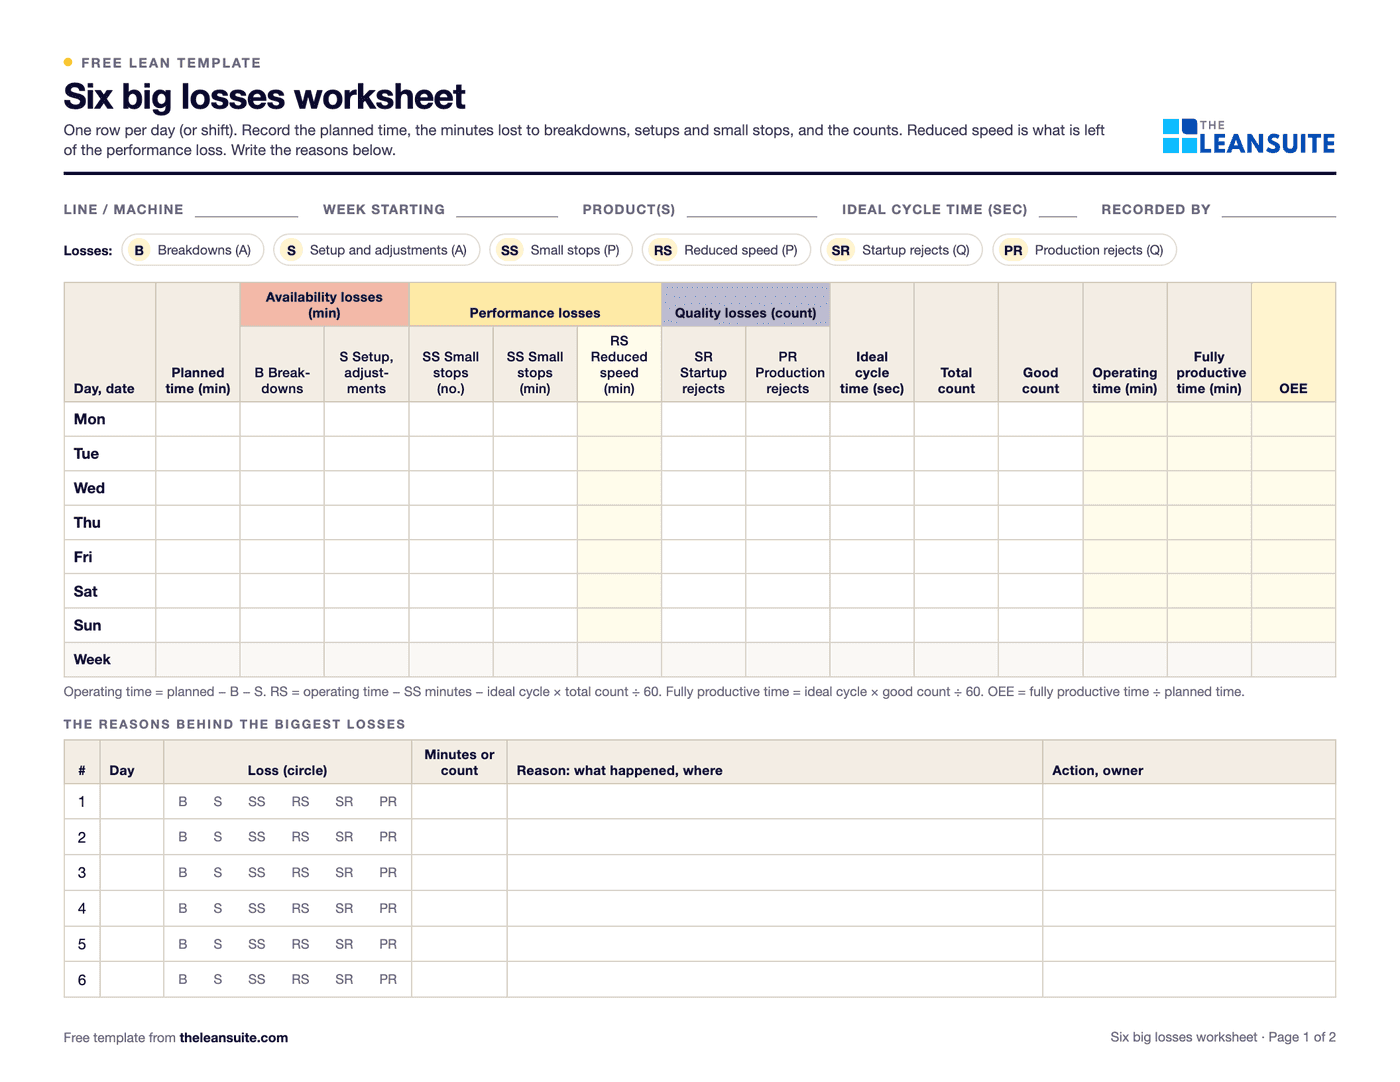
    4. Work out OEE for the line every shift, so the gain shows.

    Number to watch: Line OEE, and stops per shift by machine.

  4. Glass melted that never gets packed

    Losses are spread across the hot end, the lehr, inspection and packing, and each area counts its own. Nobody sees in one place how many tonnes go back as cullet each day, why, and what that costs in energy and furnace capacity.

    In LeanSuite

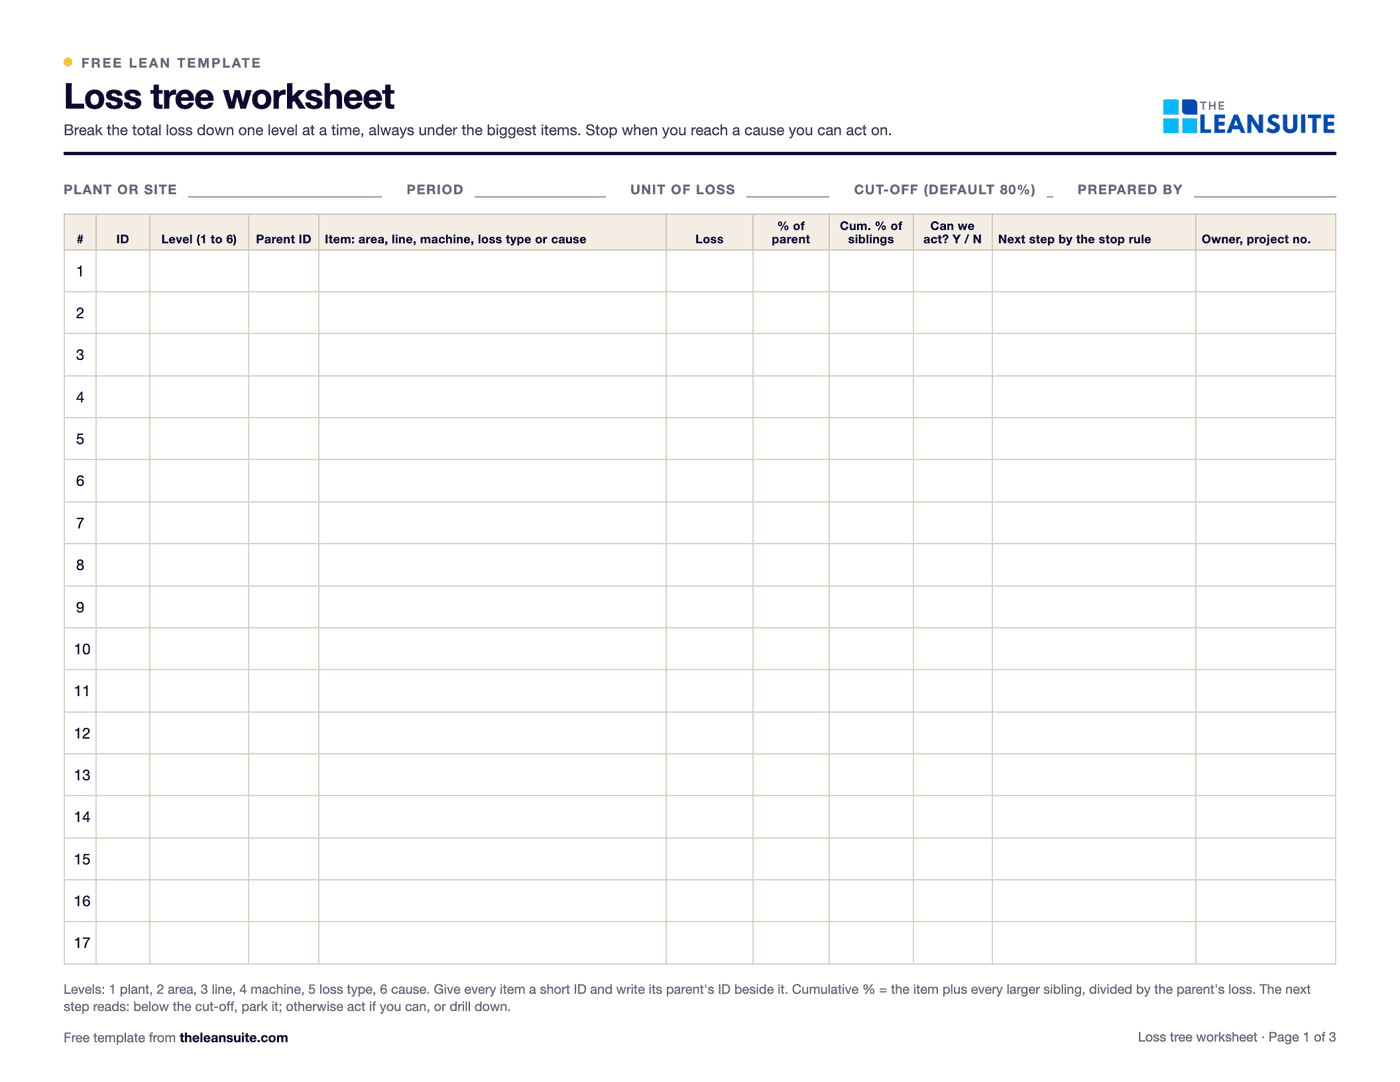
    Loss and cost management imports your loss data and builds a loss tree that puts a cost on each loss.

    First moves

    1. Work out pack-to-melt every day from the furnace pull and the tonnes packed.
    2. Split the loss into job changes, stops, hot-end rejects and cold-end rejects.
    3. Review the split each morning, and give the biggest piece an owner.

    Number to watch: Pack-to-melt, as a percentage, every day.

  5. Hot molds, broken glass and silica

    Swabbing and working near hot molds, cuts from broken glass at the cold end and in cutting, heavy pallets and silica dust in the batch house are part of every shift.

    In LeanSuite

    Anyone can report a near miss by scanning a station QR code with their phone, anonymously if you allow it, and each hazard becomes a corrective action with a due date.

    First moves

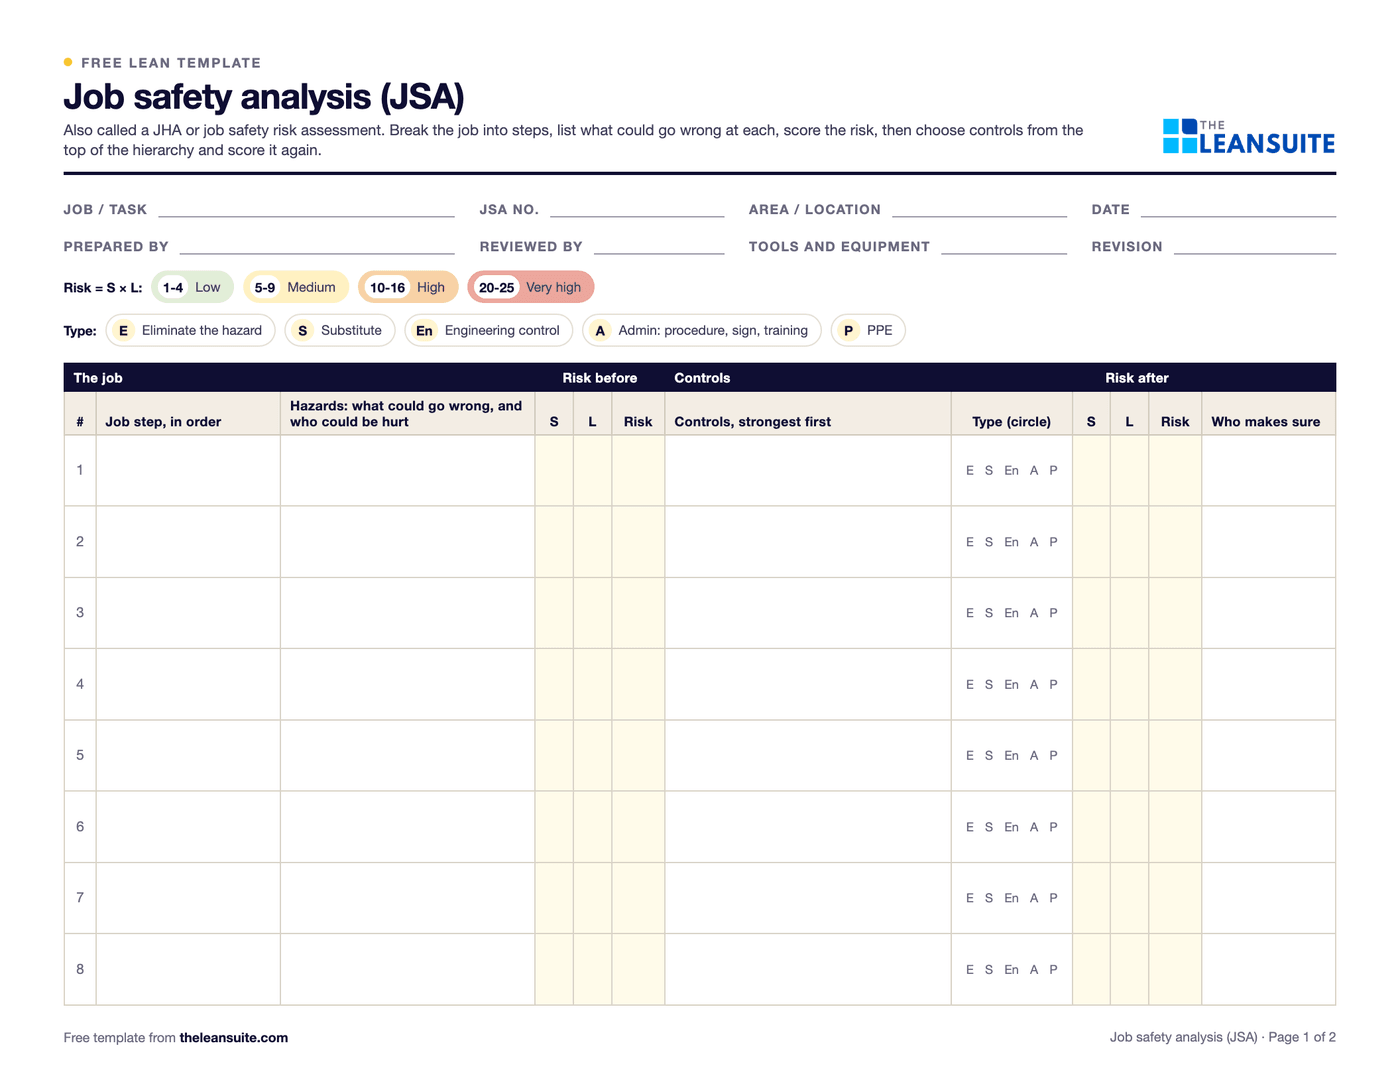
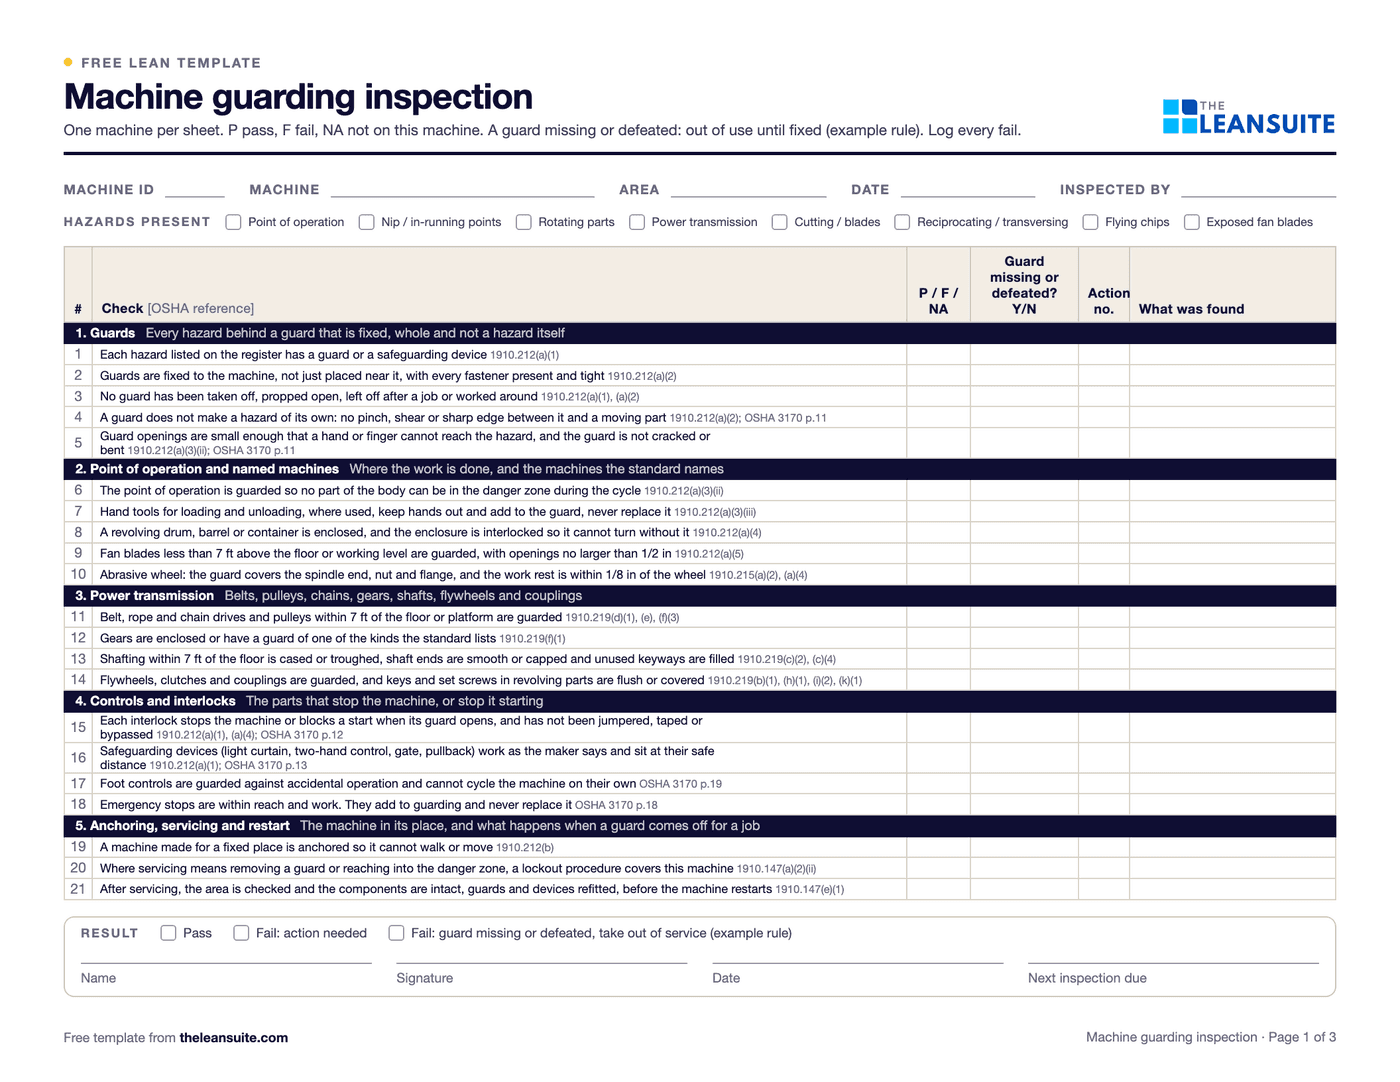
    1. Write a job safety analysis for swabbing, mold changes and clearing jams, with the crews who do them.
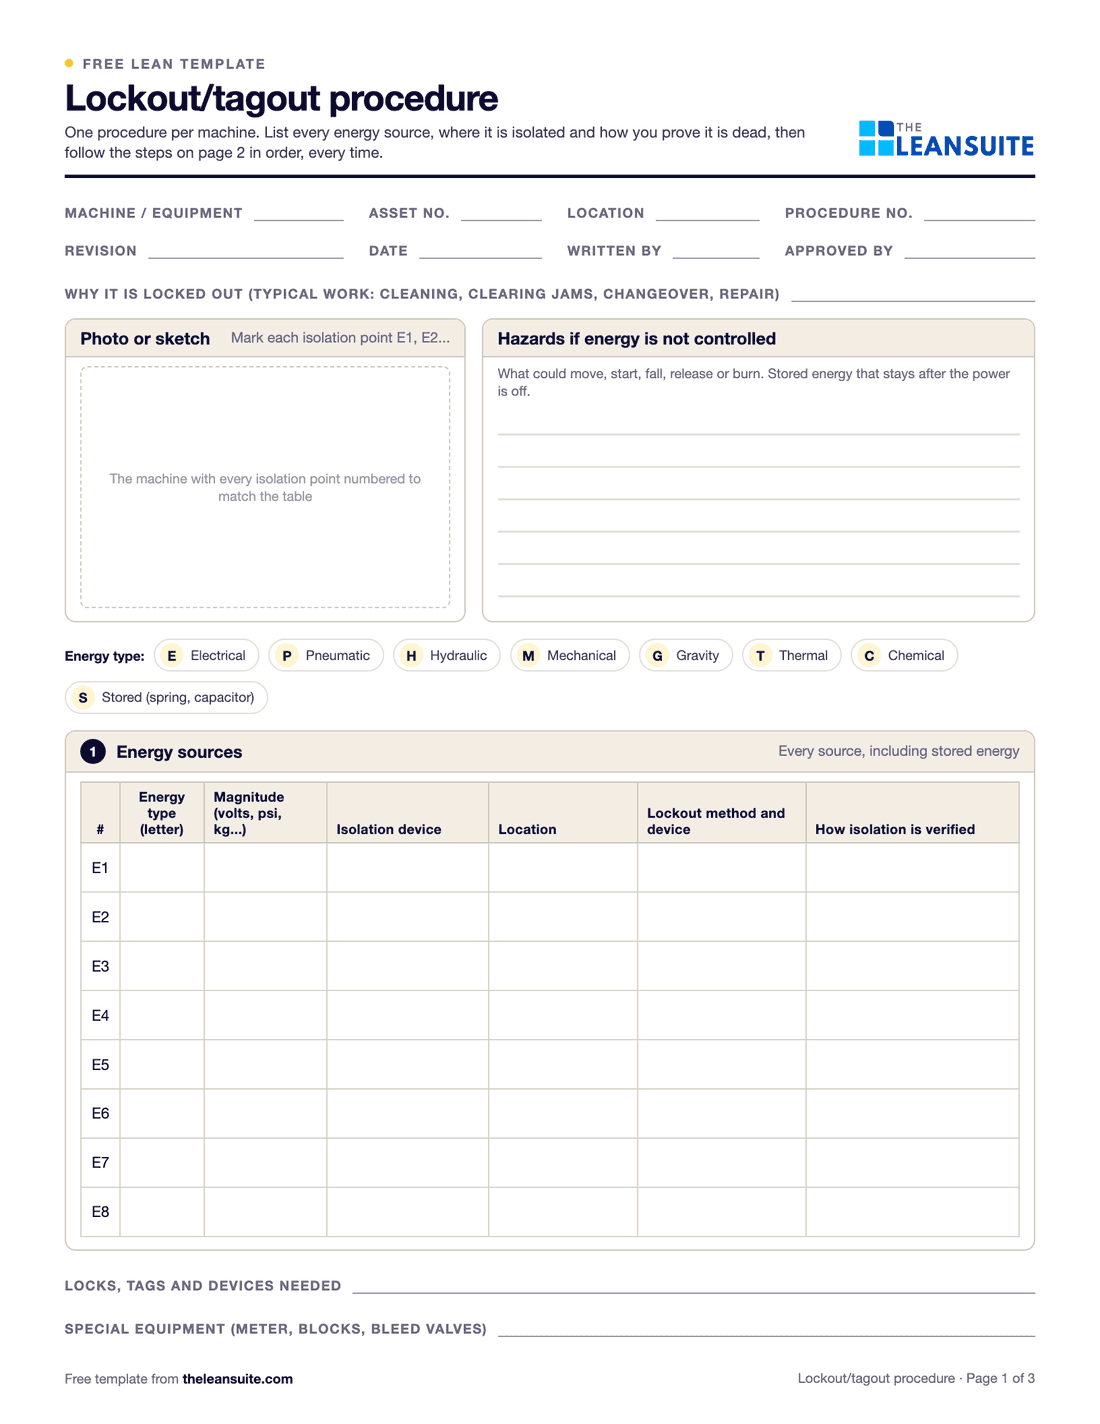
    2. Write a lockout procedure for each forming and handling machine, with a photo of every isolation point.
    3. Check cut-resistant gloves, sleeves and guards at the cold end on a schedule.
    4. Make near-miss reporting quick, and tell people what changed after each report.

    Number to watch: Near misses reported and closed, and the recordable injury rate.

  6. Critical defects that reach the customer

    A check in a bottle finish or a stone in a pane missed at inspection leads to a complaint, a hold of everything made around it and a sort. When the follow-up lives in email, the same escape comes back.

    In LeanSuite

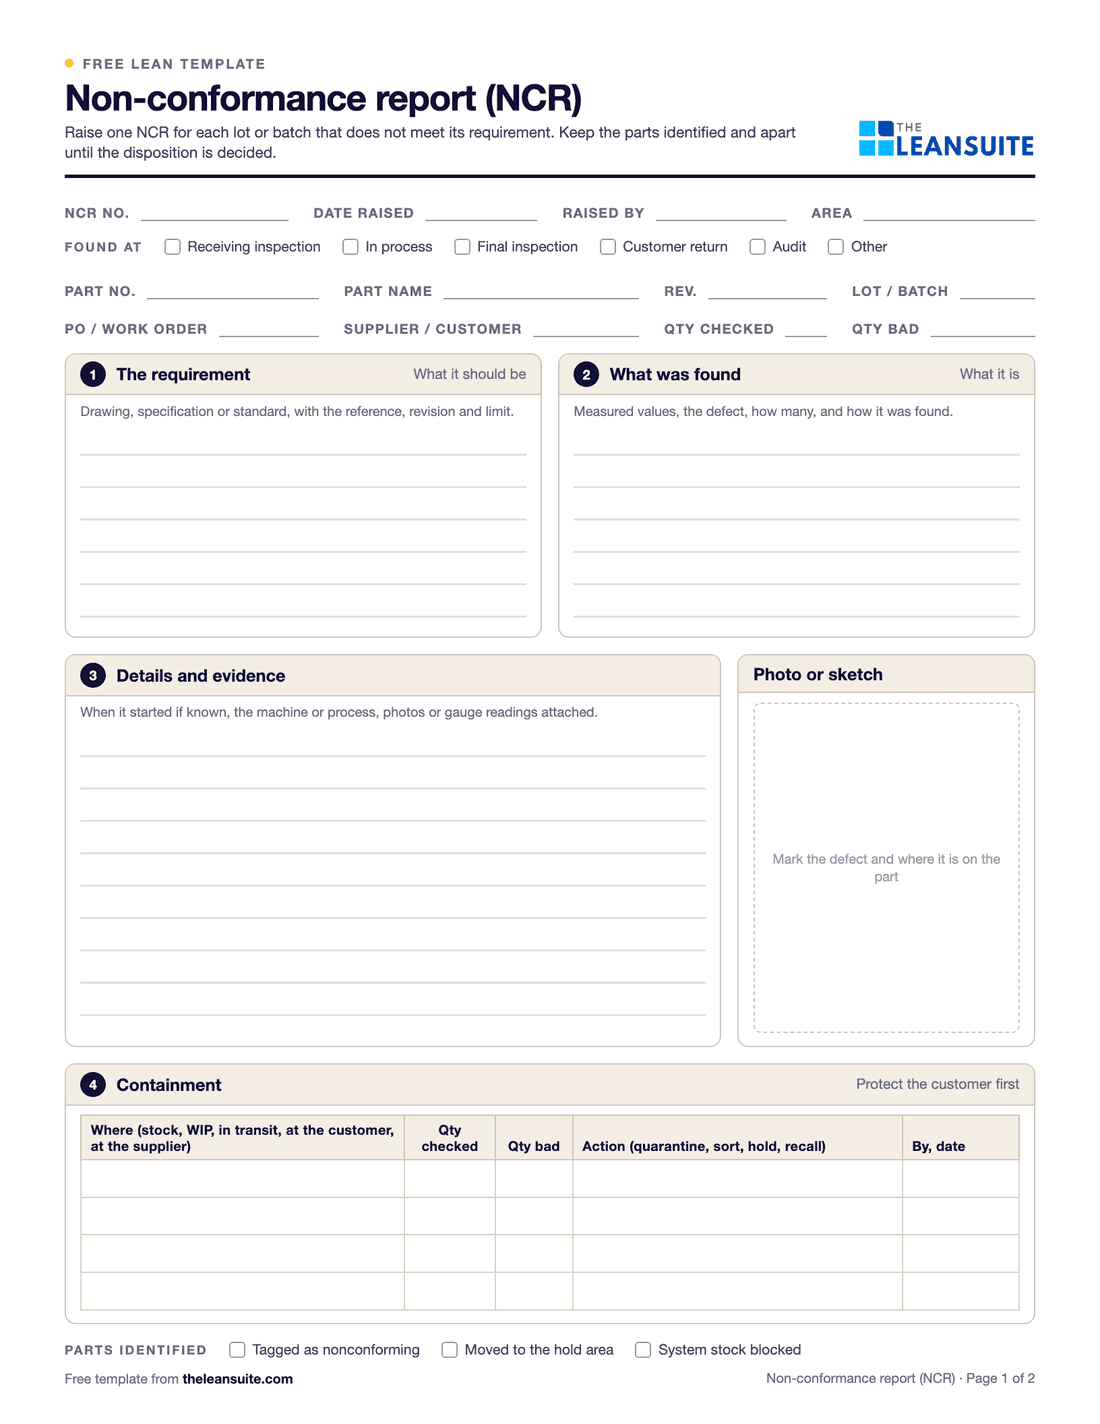
    Each non-conformance is captured with photos and routed to quality and engineering.

    First moves

    1. Agree a containment routine for a complaint: which pallets to hold, by date, time and cavity, within hours.
    2. Test the inspection machines with known defective samples at the start of each shift.
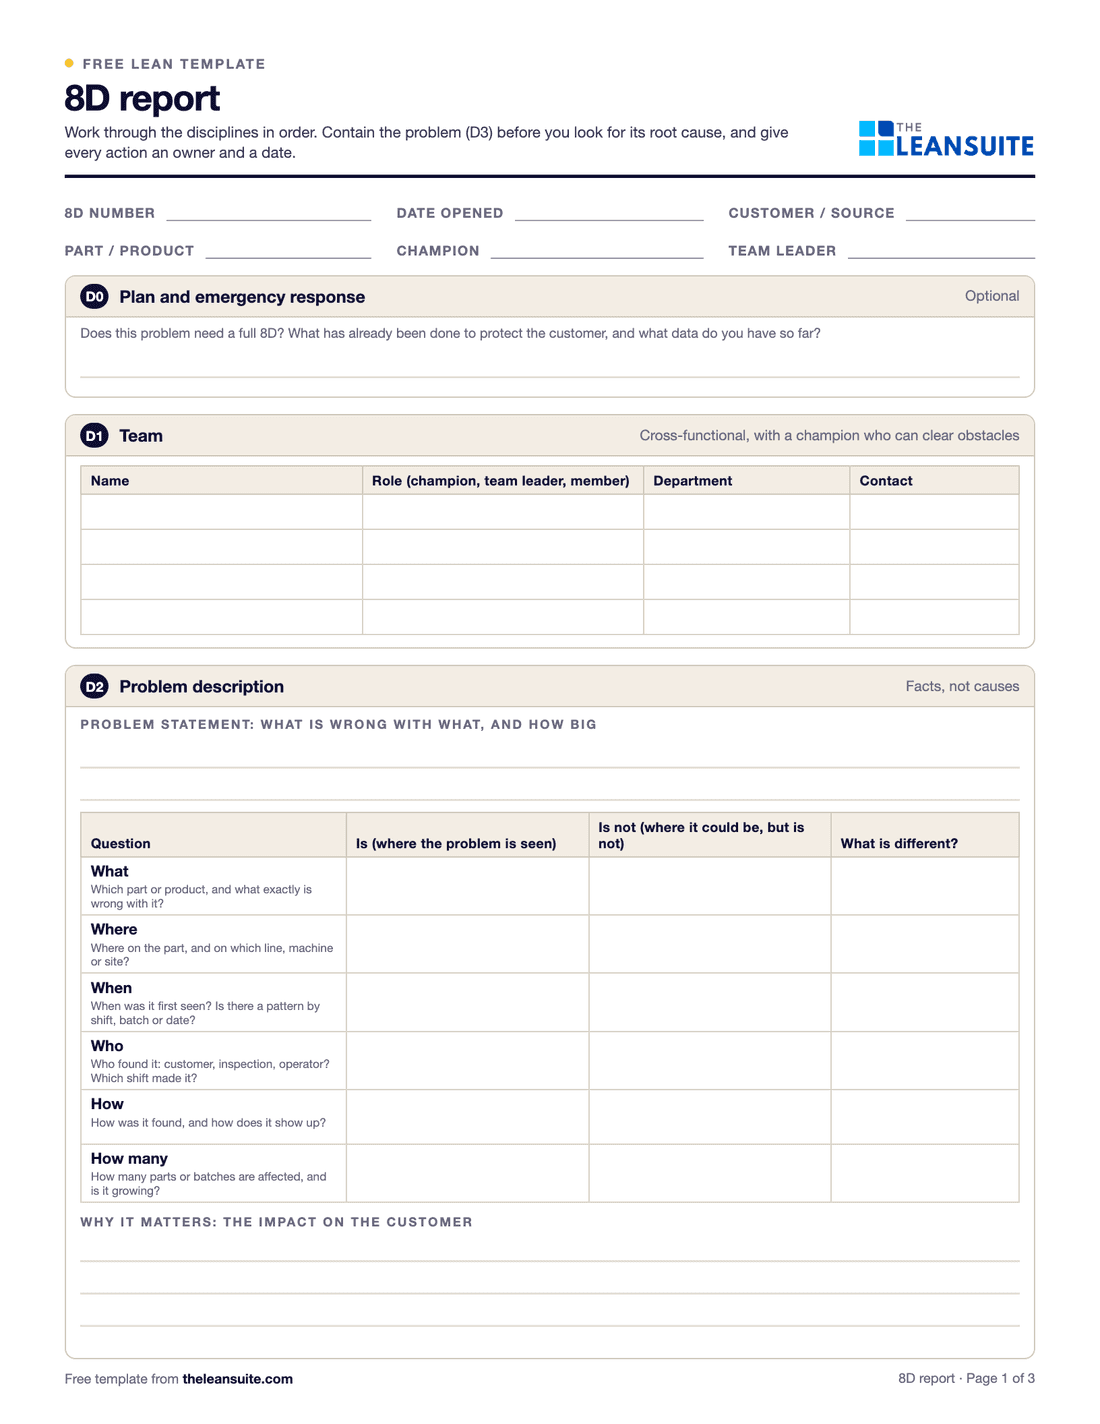
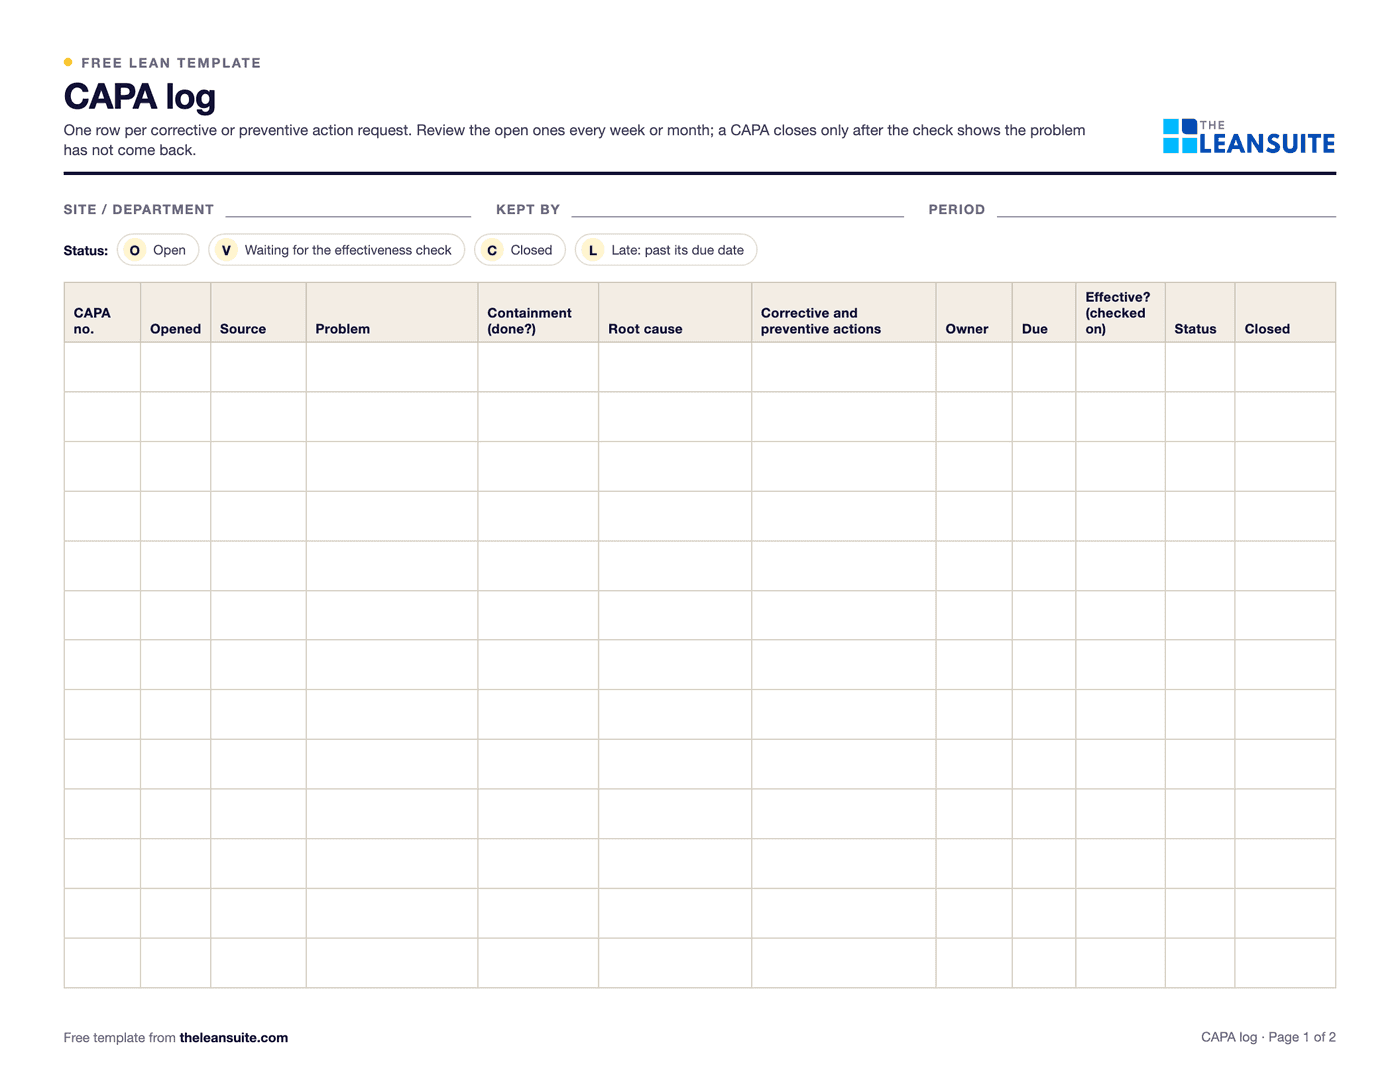
    3. Run an 8D for every critical escape, and close it only when the fix has held.

    Number to watch: Customer complaints per million units or per thousand tonnes.

  7. Forming skills learned over years

    Running and swabbing an IS machine, setting a float line and tuning inspection machines are learned over years from the people already doing them. When one is off, the line runs with less skill, and defects and job change times go up.

    In LeanSuite

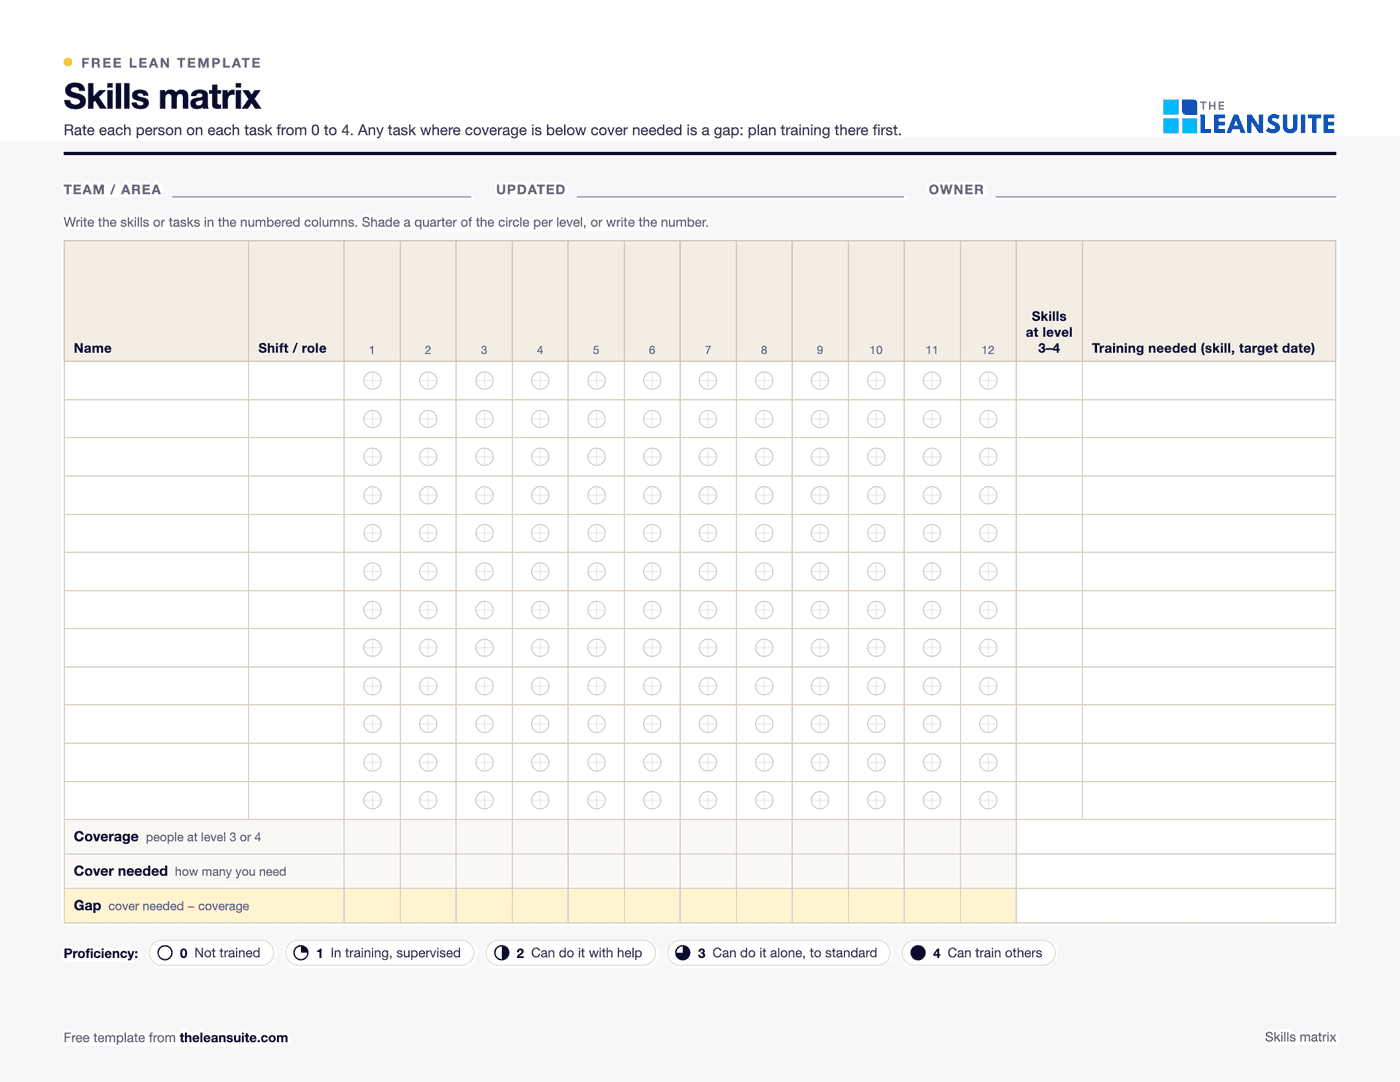
    Competency Management keeps a live skills matrix whose levels update as people complete training and on-the-job sign-offs.

    First moves

    1. Build a skills matrix by position and mark every job fewer than three people can do.
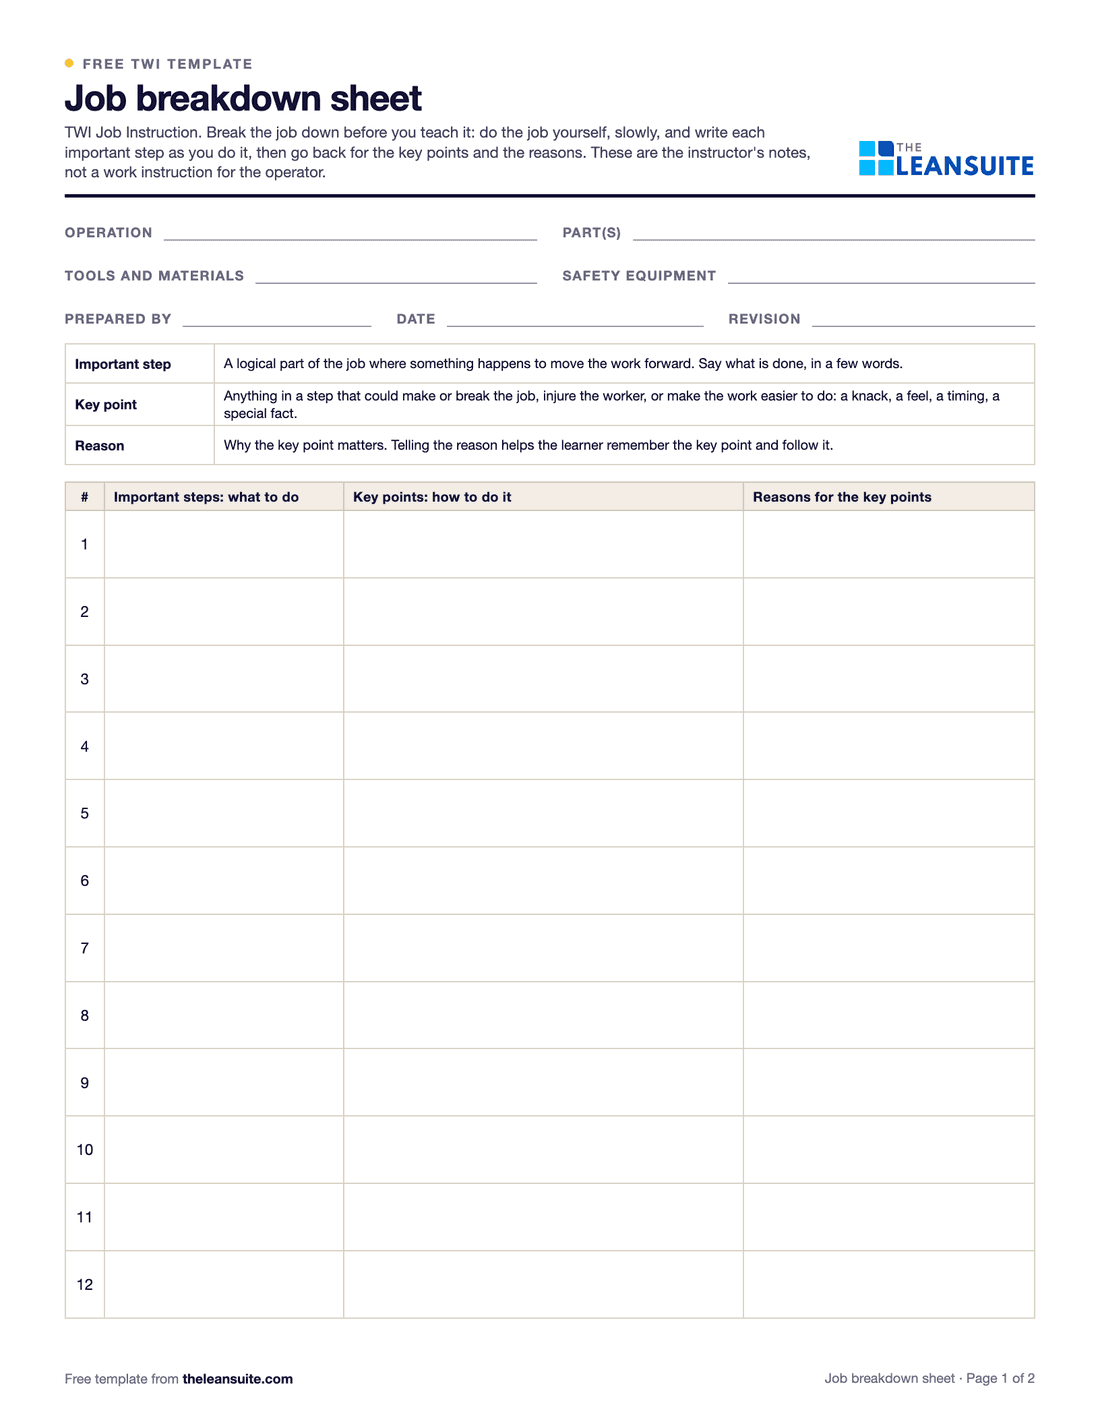
    2. Write job breakdown sheets with the best operators for swabbing, job changes and inspection machine set-up.
    3. Sign each person off on the job before they run it alone.

    Number to watch: Positions with fewer than three qualified people.

More small fixes in the production, quality and maintenance sections of the kaizen idea bank.

Questions from the floor, answered

The questions people in these plants search for most, answered in full, with the free template for each.

Glass defects: types, where they start and the first thing to check

Glass defects are named by what they look like, but they are fixed where they start: in the batch, the furnace, forming, the lehr or handling. Record each reject with the defect type and, for containers, the section and cavity it came from, so the tally points at the area that makes it.

The table covers the defects most plants count. Customer specifications and your own defect catalogue decide which are critical and what is acceptable.

Common glass defects with where they usually start and the first check to make
DefectWhat it looks likeWhere it usually startsFirst check
StonesSolid particles of unmelted batch or refractory in the glassBatch contamination, refractory wear, unmelted raw materialCullet and raw material cleanliness, furnace refractory
Seeds and blistersSmall or large gas bubblesPoor refining in the furnace, batch chemistry, temperatureFurnace temperature profile and refining
Cords and knotsStreaks or lumps of glass with a different compositionPoor mixing in the batch or meltBatch weighing and mixing
ChecksSmall surface cracks, often in the finish or shoulder of a containerUneven mold temperature, swabbing, handling hot wareMold temperatures and swabbing practice
Thin or uneven wallsGlass not spread evenly through the containerGob weight, gob temperature and forming settingsGob weight and timing on that section
Finish defectsUnfilled, split or out-of-round finish on a containerMolds, plungers and forming settingsNeck ring and plunger condition
StressBreakage later, or high readings on a polariscopeWrong annealing profile in the lehrLehr temperature profile and load
Distortion and tin defects (flat glass)Optical distortion, bloom or specks on the tin sideFloat bath conditions and ribbon handlingBath atmosphere and temperatures

The glass manufacturing process, step by step

Most glass, from bottles to windows, is made from sand, soda ash and limestone, with cullet (recycled glass) that melts at a lower temperature and saves energy. The batch is melted in a furnace that runs day and night for years between rebuilds. Container glass is then cut into gobs and formed in IS machines, while flat glass floats on molten tin into a ribbon.

Because the furnace cannot stop, everything after it has to keep up or the glass goes back as cullet. That is why the losses that matter most in a glass plant are measured in tonnes: job changes, stops and rejects.

Step by step

  1. Batch house: raw materials and cullet are weighed and mixed.
  2. Furnace: the batch is melted and refined.
  3. Forming: gobs are formed into containers on IS machines, or the melt floats on tin into a ribbon of flat glass.
  4. Annealing lehr: the glass is reheated and cooled slowly to remove stress.
  5. Cold end: containers are coated, inspected and palletized; flat glass is cut, and may be tempered or laminated.

A 90-day starting plan

One line or product family, two problems, measured before and after. The point of the first 90 days is a result the plant believes and a method it can repeat, not a plant-wide program.

The 90 days, with the gate that ends each stage

  1. Days 1 to 30Split the pack-to-melt loss on one lineDone when: The board shows pack-to-melt split by cause and two problems each have an owner.
  2. Days 31 to 60Cut the two biggest lossesDone when: Each fix has a written standard and a before-and-after number in tonnes.
  3. Days 61 to 90Hold the gains, then the next lineDone when: The gains have held for a month and the next line has its baseline.
Move to the next stage only when the gate is met, even if a stage runs past its 30 days. The cards below say what to do inside each stage.
  1. Days 1 to 30

    Split the pack-to-melt loss on one line

    Pick one line and find out where its glass goes before changing anything.

    • Choose the line with the lowest pack-to-melt or the most job changes, and name an owner and a sponsor.
    • Measure for two weeks: pack-to-melt, job change times, stops by machine and cold-end rejects by defect.
    • Start a short meeting at a board on the floor at the start of each shift.
    • Walk from the furnace to the pallet with forming, inspection and maintenance, and list what slows them down.
    • Choose the two biggest pieces of the loss to work on first.
  2. Days 31 to 60

    Cut the two biggest losses

    Fix the two largest pieces of the loss and prove the change in tonnes.

    • Run a SMED workshop on the most frequent job change, and prepare molds and parts off the machine.
    • Take the top cold-end defect to the area that makes it, and fix the cause.
    • Start the daily care routine on the machine that stops most.
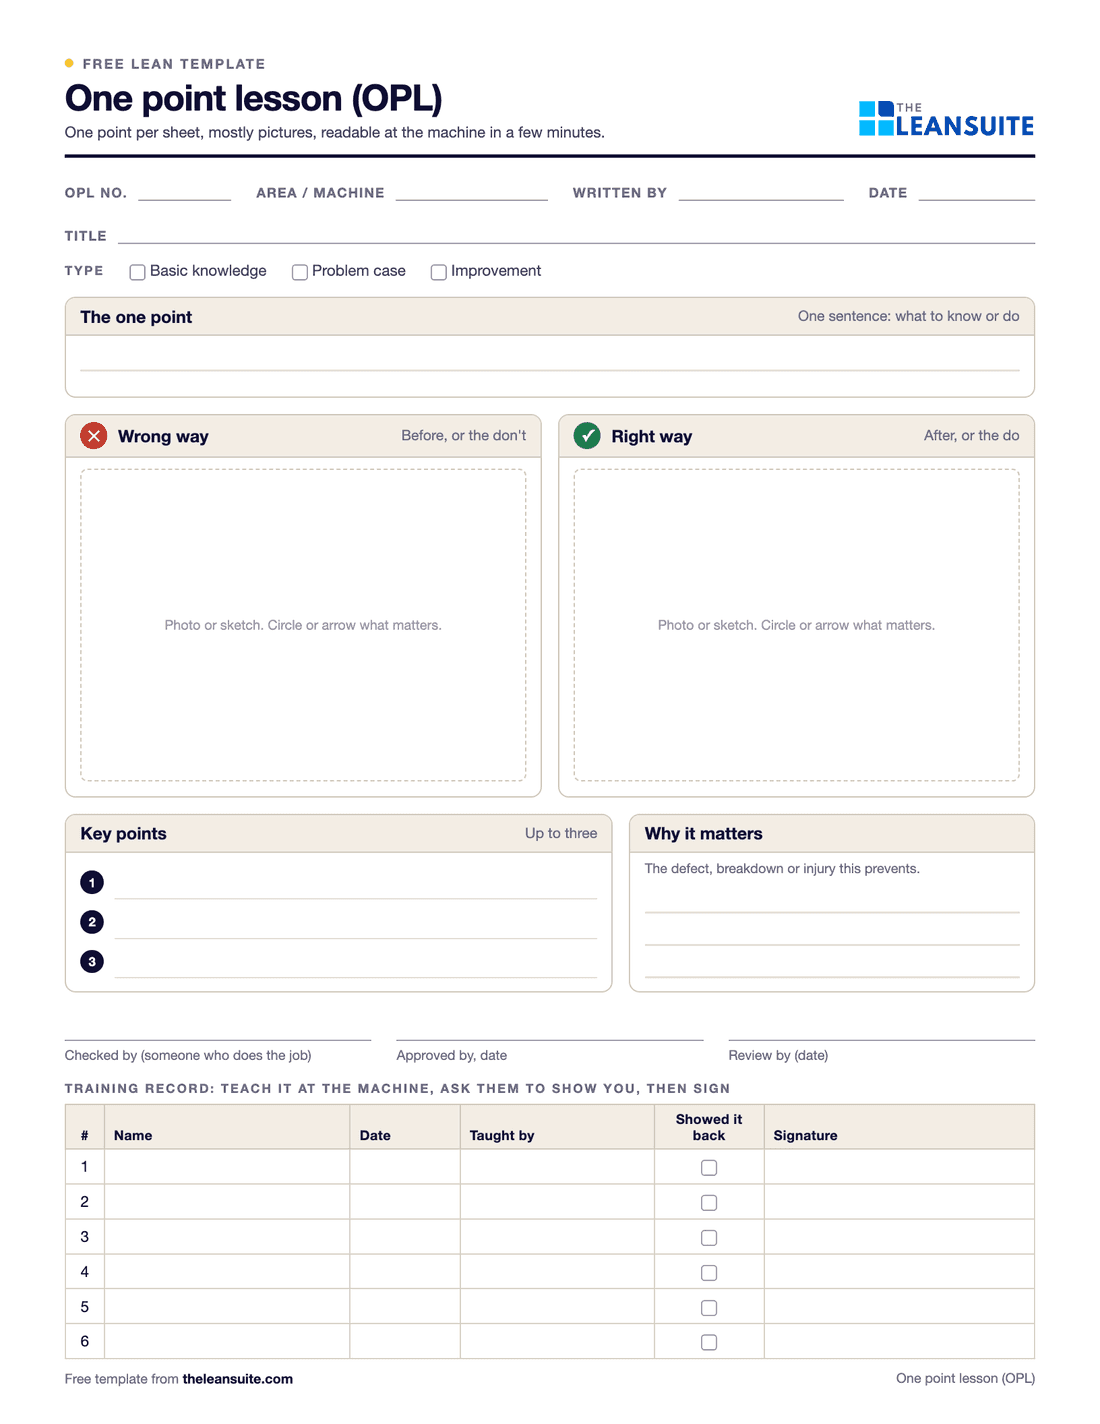
    • Write each new method down as a standard or one-point lesson as soon as it works.
  3. Days 61 to 90

    Hold the gains, then the next line

    Keep the new standards on every shift, then copy them to the next line.

    • Audit the new standards on every shift and act on every gap.
    • Build the skills matrix and plan training for the jobs only one or two people can do.
    • Compare pack-to-melt with the baseline and share the result in tonnes.
    • Pick the next line, copy what worked and start again at day one.

The KPIs to track

Track them per line and shift, on a board the team sees every day. Set targets from your own baseline, not from someone else's plant.

KPIs for glass plants: what each tells you and how to measure it
KPIWhat it tells youHow to measure itFree help
Pack-to-meltHow much of the glass melted is packed and sold, which joins every loss after the furnace in one number.Tonnes packed divided by tonnes melted (the furnace pull), per day.Loss tree worksheet
Job change timeHow long the line runs without good ware between jobs, and whether the new standard is followed.Last good ware of one job to the first ware that passes inspection at full speed on the next.SMED changeover calculatorSMED changeover worksheet
Line OEEHow much of the planned time the line made good ware at full speed, and whether stops, speed or rejects lose most.Availability times performance times quality, per shift, on the forming line.OEE calculator
Rejects by defect typeWhich defects cost the most glass, and which area makes them.Ware rejected for each defect divided by ware inspected, per shift.Pareto chart makerDefect catalogue template with boundary samples
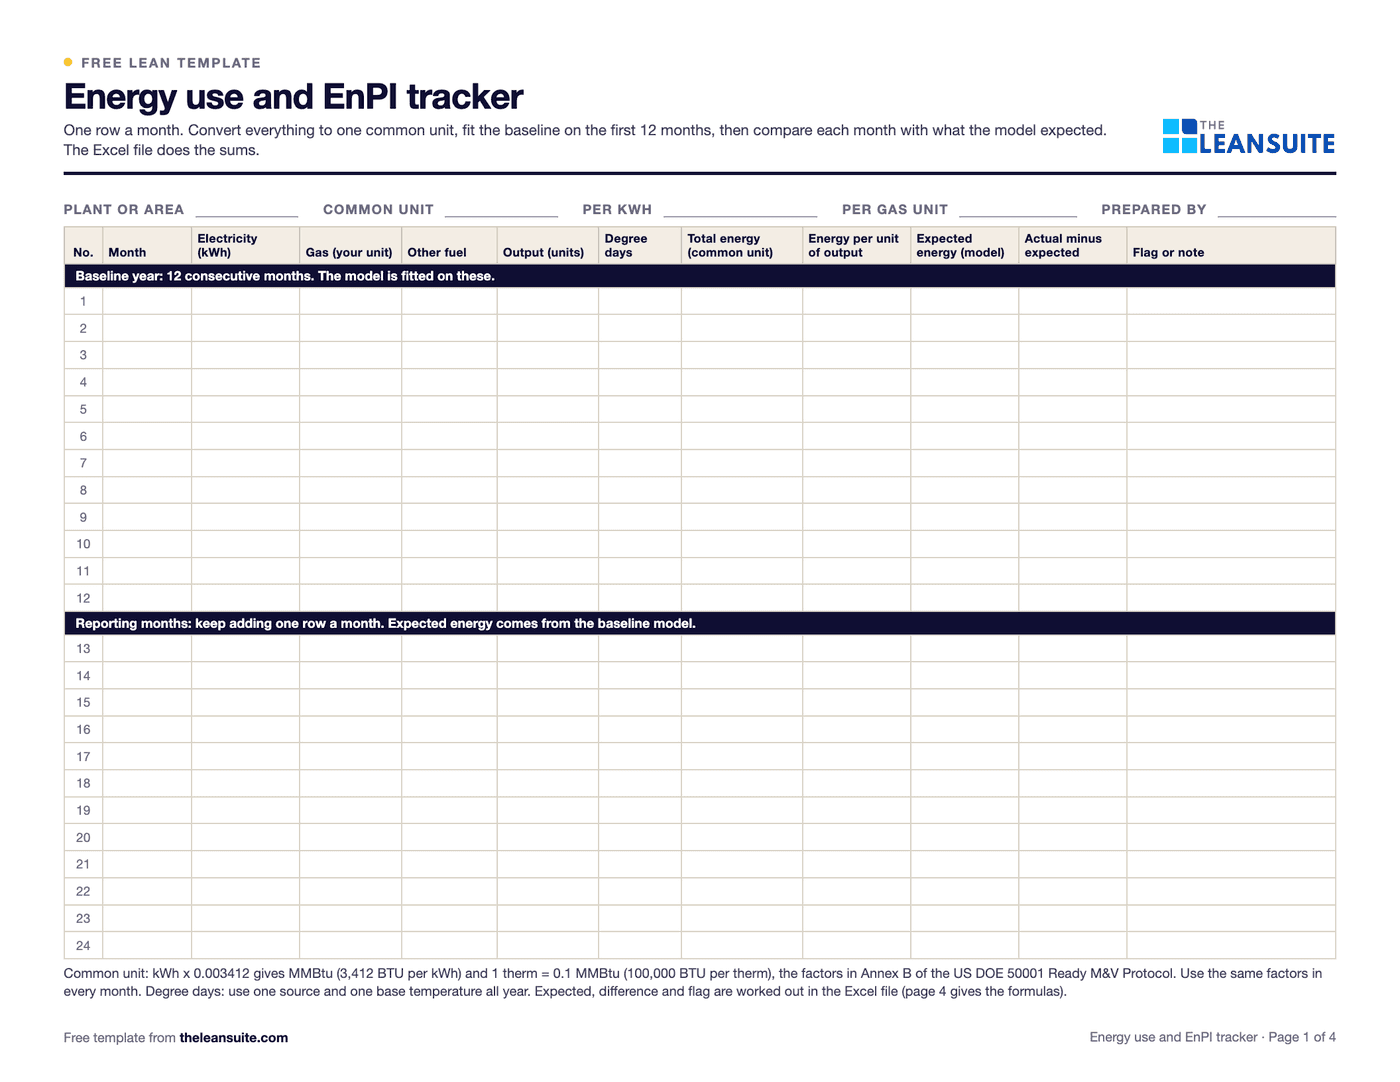
Energy per tonne packedWhat each tonne you sell costs in fuel and electricity, including glass melted twice.Furnace and forming energy divided by tonnes packed, not tonnes melted.Energy use and EnPI tracker
Recordable injury rateHow often people are hurt badly enough to record, on a scale you can compare across years and plants.Recordable cases times 200,000 divided by hours worked.TRIR and DART rate calculator

Illustrative: pack-to-melt on a container line

These numbers are made up to show the method. A container furnace pulls 300 tonnes of glass a day. Job changes and hot-end rejects send 13 tonnes back as cullet, and the cold-end inspection machines reject another 24 tonnes.

The calculation, step by step

Example numbers
  1. Pack-to-melt = tonnes packed ÷ tonnes melted

    Split the loss by where it happens before choosing what to work on.

    1. Tonnes packed =300 − 13 − 24= 263 t
    2. Hot-end loss =13 ÷ 300= 4.3%
    3. Cold-end loss =24 ÷ 300= 8.0%
    Pack-to-melt87.7%
  2. What one point of pack-to-melt is worth = 1% × daily pull × days

    The glass comes back as cullet, but the furnace capacity and energy are spent.

    1. Per day =0.01 × 300= 3 t
    2. Per year =3 × 365= 1,095 t
    One point, per year1,095 t
The cold end loses nearly twice as much as the hot end here, so the first job is to find which defects the inspection machines reject most and where they are made. Each point recovered is about a thousand tonnes a year of glass packed instead of melted again.

By the numbers

Public figures for this industry or for the wider sector it belongs to, each linked to the report or government table it comes from and checked against it on October 9, 2026. More in our lean manufacturing statistics and benchmark charts.

Injury and illness rate by industry, 2024

  1. Motor vehicles5.6
  2. Beverage and tobacco3.7
  3. Furniture3.5
  4. Food3.3
  5. Primary metals3.3
  6. Nonmetallic mineral products, incl. glass3.3This industry
  7. Fabricated metal products3.2
  8. Transportation equipment3.2
  9. Motor vehicle parts2.9
  10. Plastics and rubber products2.8
  11. HVAC and refrigeration2.4
  12. Paper2.4
  13. Machinery2.3
  14. All private industry2.3
  15. Electrical equipment and appliances2.0
  16. Printing1.6
  17. Chemicals1.6

Total recordable cases per 100 full-time workers, 2024: Motor vehicles 5.6, Beverage and tobacco 3.7, Furniture 3.5, Food 3.3, Primary metals 3.3, Nonmetallic mineral products, incl. glass 3.3, Fabricated metal products 3.2, Transportation equipment 3.2, Motor vehicle parts 2.9, Plastics and rubber products 2.8, All manufacturing 2.7, HVAC and refrigeration 2.4, Paper 2.4, Machinery 2.3, All private industry 2.3, Electrical equipment and appliances 2, Printing 1.6, Chemicals 1.6.

Total recordable cases per 100 full-time workers, U.S., 2024 data, from the BLS Survey of Occupational Injuries and Illnesses. This industry's rows are in yellow; the dark mark on each bar is all manufacturing, at 2.7.

Free templates, calculators and buyer's guides

Templates (26)

FAQ

Lean in glass plants: common questions

  1. With pack-to-melt on one line. Work it out every day for two weeks, split the loss into job changes, stops, hot-end rejects and cold-end rejects, and work on the biggest piece with the people who run the line. Write the new method down and only then move to the next line.

  2. Pack-to-melt is the share of the glass melted that is packed and sold: tonnes packed divided by tonnes melted. The rest goes back to the furnace as cullet, so the glass is not lost, but the energy and furnace capacity used to melt it are.

  3. SMED for job changes on forming lines, autonomous maintenance and breakdown analysis for stops at the hot and cold end, a QA matrix and Pareto charts for defects, and job instruction for forming skills. Flow tools matter less because the furnace sets a continuous pace.

  4. Pack-to-melt every day, job change time, line OEE, rejects by defect type, energy per tonne packed and the recordable injury rate. Track them per line and shift, on a board the team sees every day.

See LeanSuite on your job changes and cold-end losses

Bring the routine you want to fix first. We will show you how LeanSuite handles it and what a 90-day pilot would cover.