

Lean and CI poster
Updated · Free to print and share
Benefit-cost ratio and payback poster
Two numbers decide whether an improvement is worth doing and which to do first. The benefit-cost ratio is the saving per year divided by the one-time cost of the fix; above one, the fix pays for itself within a year. Payback in months is twelve divided by that ratio. This poster works one example from start to finish: scrap on a line cut from 100 to 30 parts a day, a fix costing 8,400 and a payback of three months, in any currency.
Download the poster
The PNG is free to download now. The print-ready vector PDFs open after a short form, once.
Free to print and share with your team. Enter your name and work email once to download.
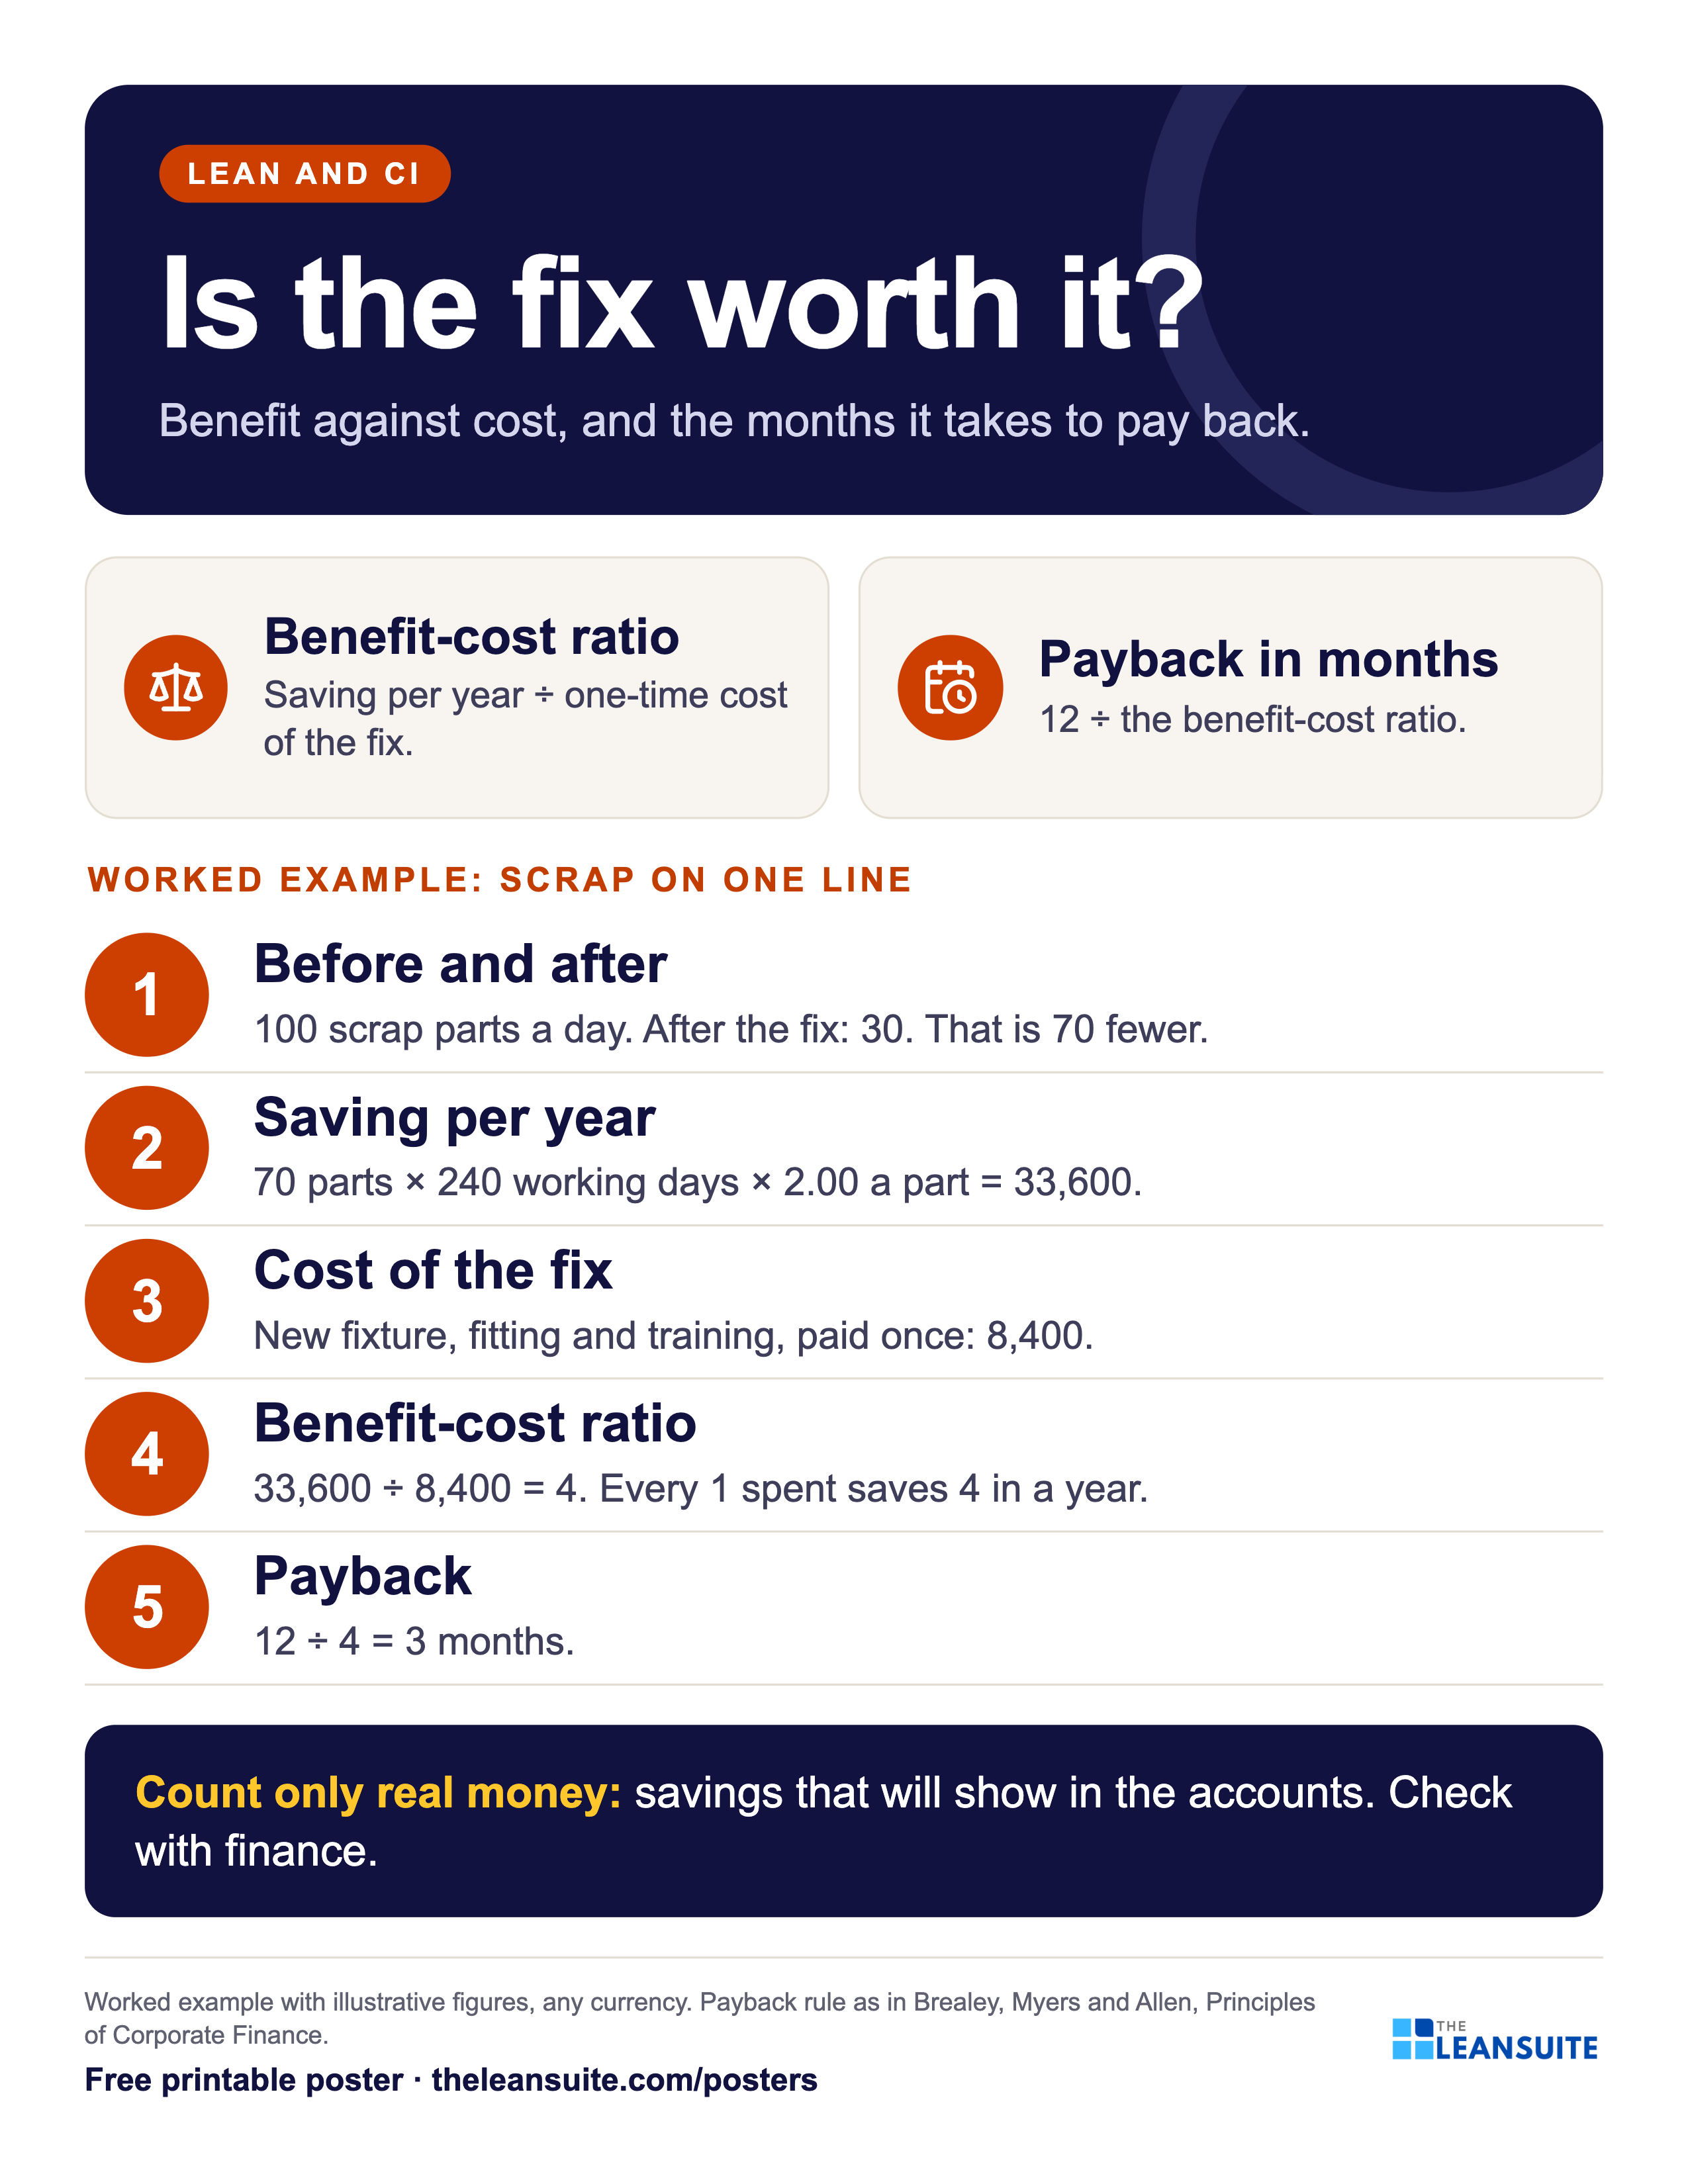
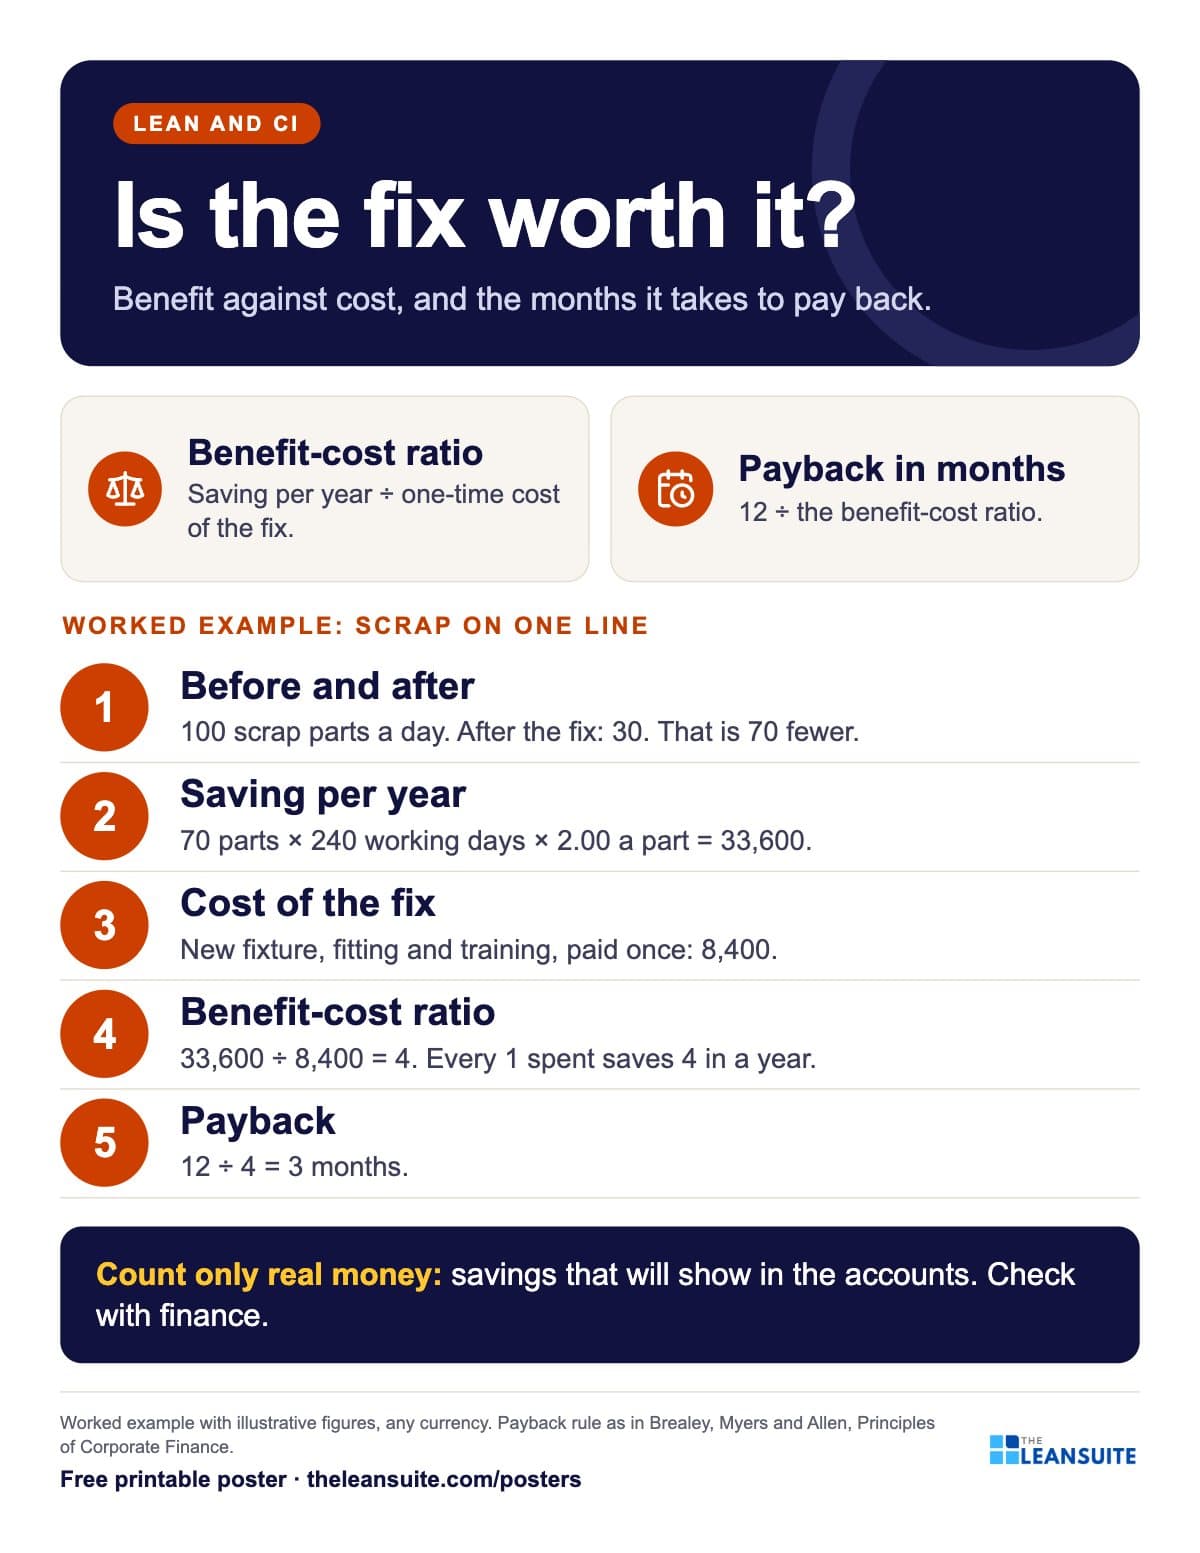 The two formulas, then five steps of a worked example from scrap per day to a payback of three months.
The words on the poster
Is the fix worth it?
Benefit against cost, and the months it takes to pay back.
- Benefit-cost ratio Saving per year ÷ one-time cost of the fix.
- Payback in months 12 ÷ the benefit-cost ratio.
Worked example: scrap on one line
- Before and after 100 scrap parts a day. After the fix: 30. That is 70 fewer.
- Saving per year 70 parts × 240 working days × 2.00 a part = 33,600.
- Cost of the fix New fixture, fitting and training, paid once: 8,400.
- Benefit-cost ratio 33,600 ÷ 8,400 = 4. Every 1 spent saves 4 in a year.
- Payback 12 ÷ 4 = 3 months.
- Count only real money: savings that will show in the accounts. Check with finance.
Worked example with illustrative figures, any currency. Payback rule as in Brealey, Myers and Allen, Principles of Corporate Finance.
On the floor
How to use it
Putting the Benefit-cost ratio and payback poster to work
- 1
Pin it where projects are approved, so every proposal shows its ratio and payback the same way.
- 2
Use the worked example to teach team leaders to cost their own kaizen before asking for money.
- 3
Rank open projects by the ratio, then check the biggest with finance.
- 4
Pair it with the free cost-benefit analysis template and cost savings tracker.
Which size to print
- 24 x 36 in or A2: a main wall or team board, read from a few metres away.
- 18 x 24 in or A3: a station or notice board. The A3 file also fits 11 x 17 in paper.
- Letter or A4: a clipboard, binder or handout, on any office printer.
Every PDF is vector, so it stays sharp at full size. Nothing runs to the edge of the page, so no bleed is needed.
Sources and notes
Payback ignores what happens after the cost is recovered and the time value of money. It is a quick screen for small fixes; for large investments use net present value. Count only savings that will show in the accounts.
- Richard A. Brealey, Stewart C. Myers and Franklin Allen, Principles of Corporate Finance (McGraw-Hill): the payback rule and its limits.
- Benefit-cost ratio as used to rank improvement projects: the saving over the first year divided by the one-time cost. The example figures are illustrative, in any currency.
Templates, decks and guides to go with it
- Cost-benefit analysis templateUp to three options side by side with costs, hard and soft benefits, payback, NPV and the benefit-cost ratio.
- Cost savings trackerA savings log with hard and soft savings, payback and Finance's sign-off, plus a glide path against the year's target.
- Project savings validation checklistThe gate between a project's claim and a reported saving: 20 checks, a claims register and a six-month sustainment check.
- Life cycle cost analysis templateCompare up to three machines over ten years: price, energy, upkeep, failures and down time, discounted to present value.
- Topic: Kaizen and continuous improvementEvery guide we have on the subject, sorted.
More lean and ci posters
All posters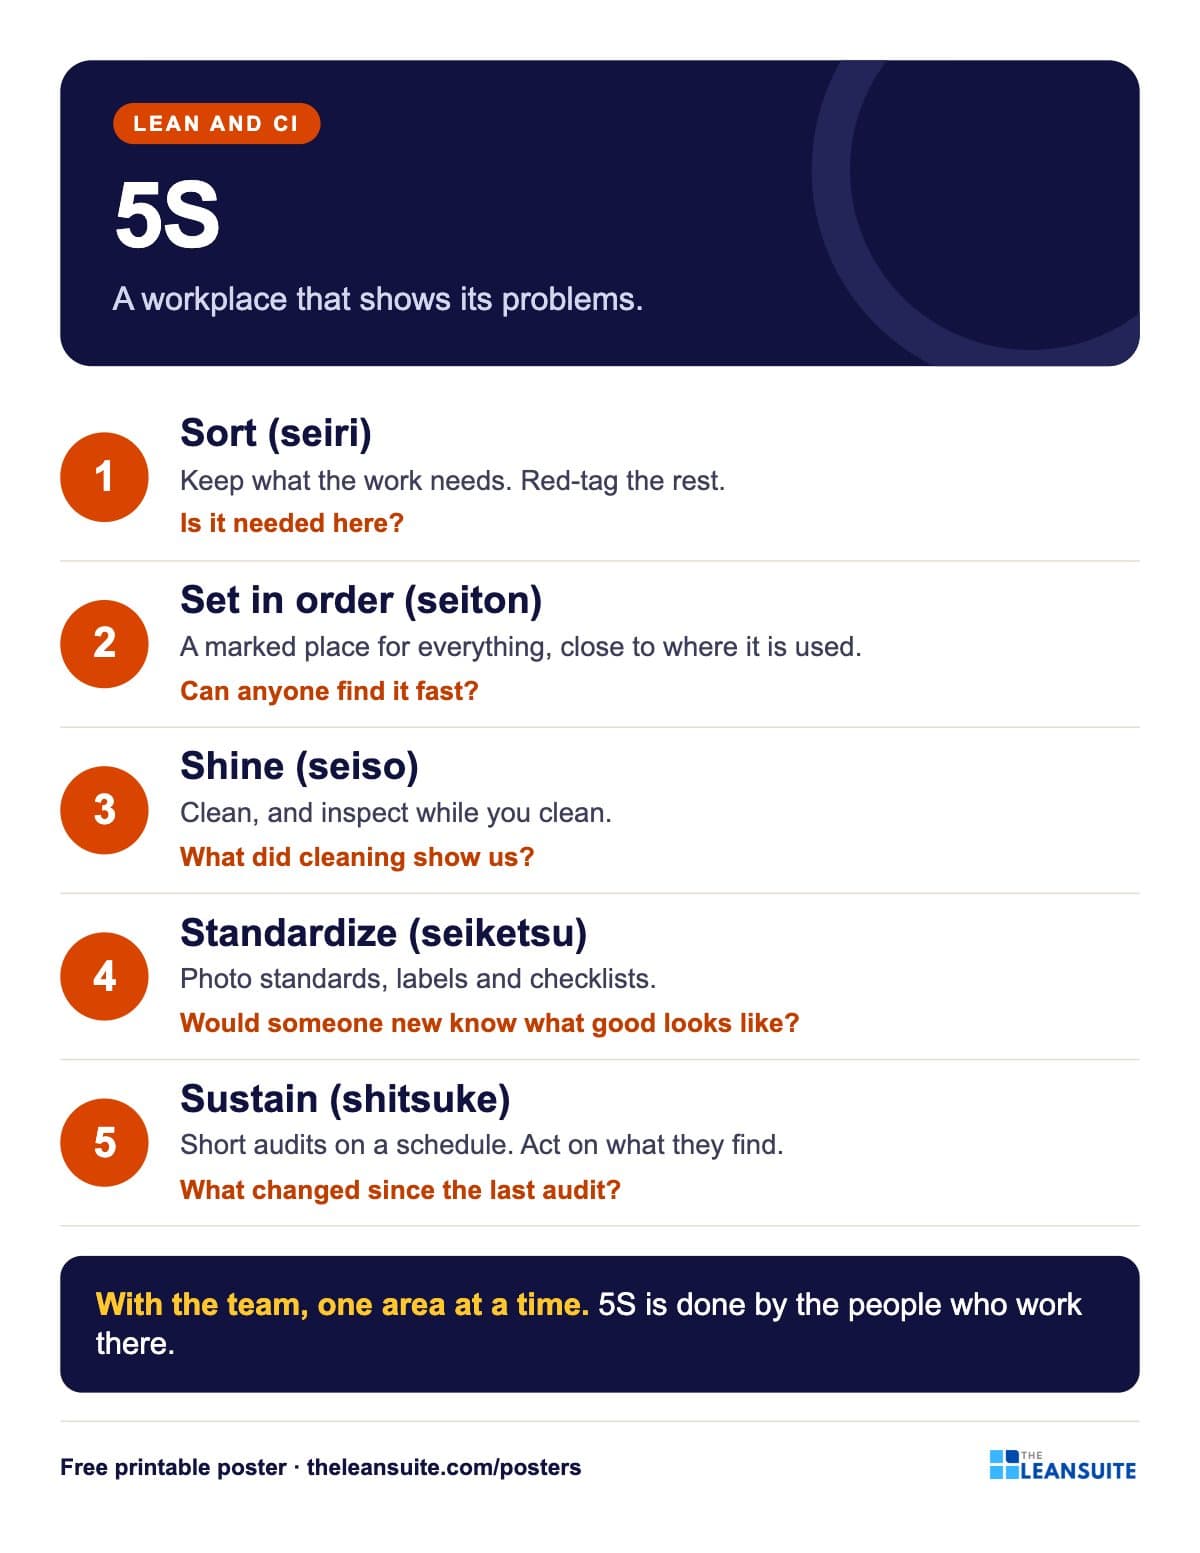 5S poster
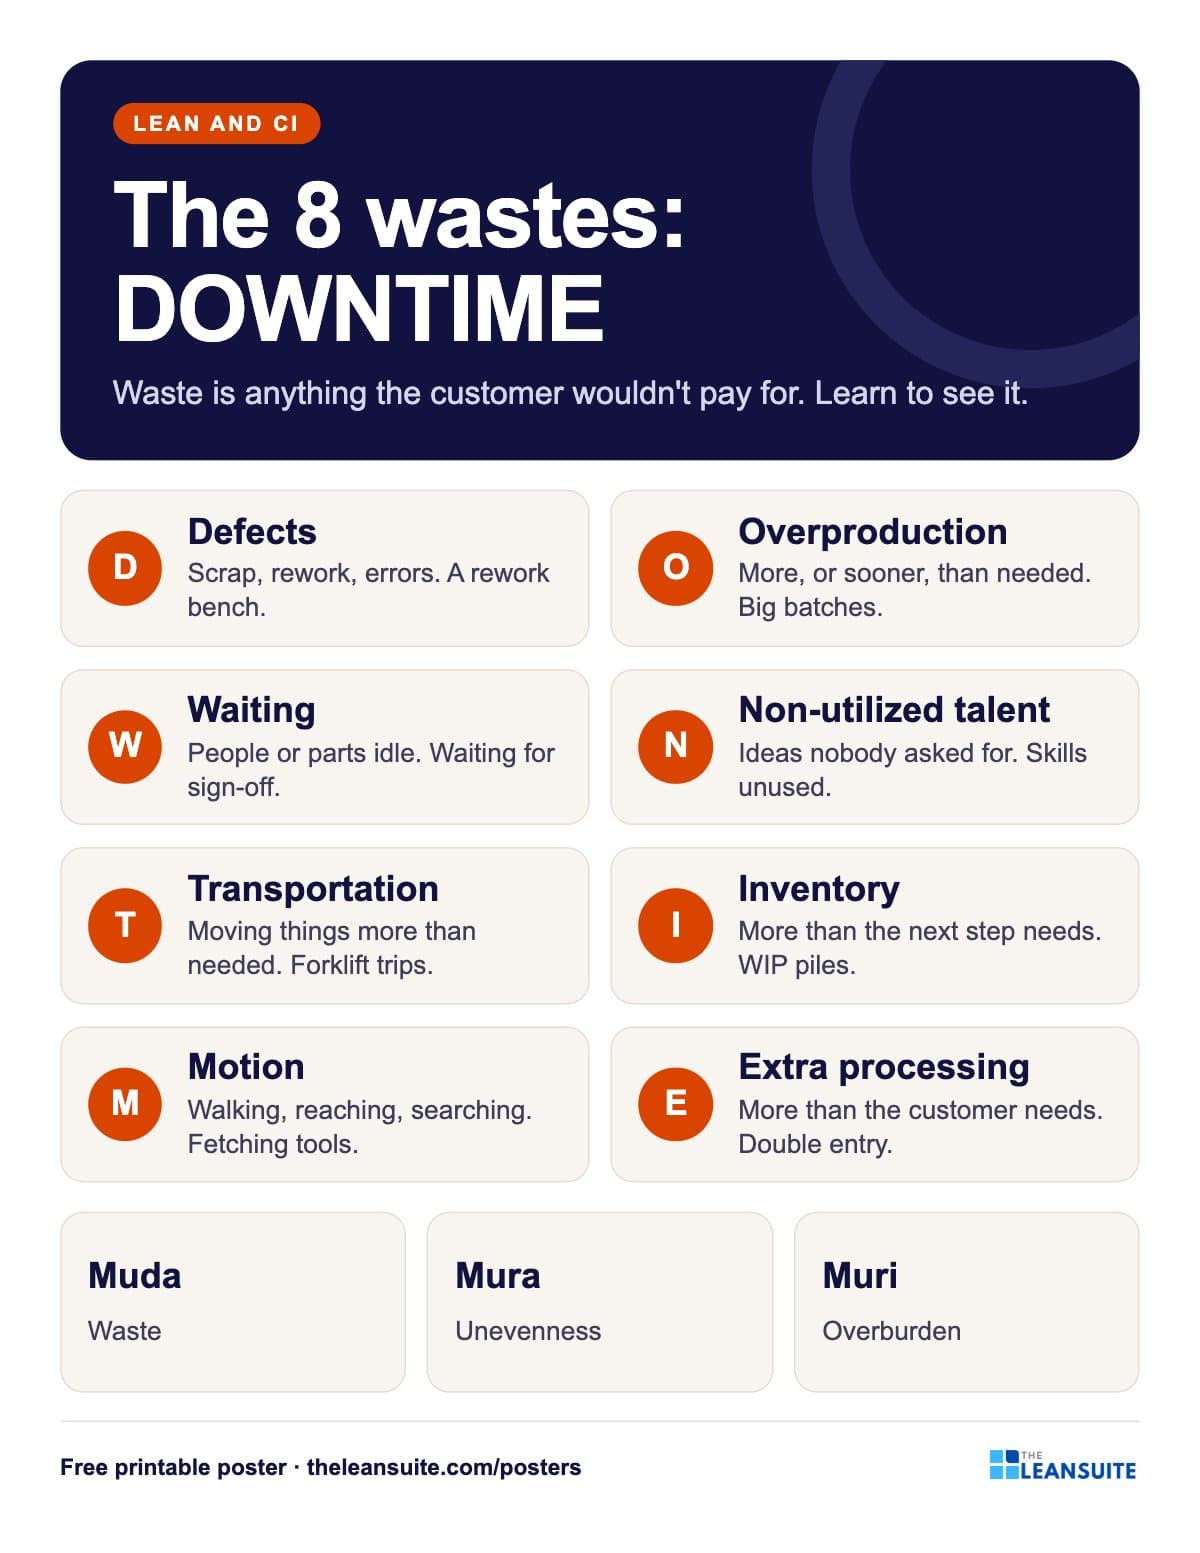 8 wastes of lean poster (DOWNTIME)
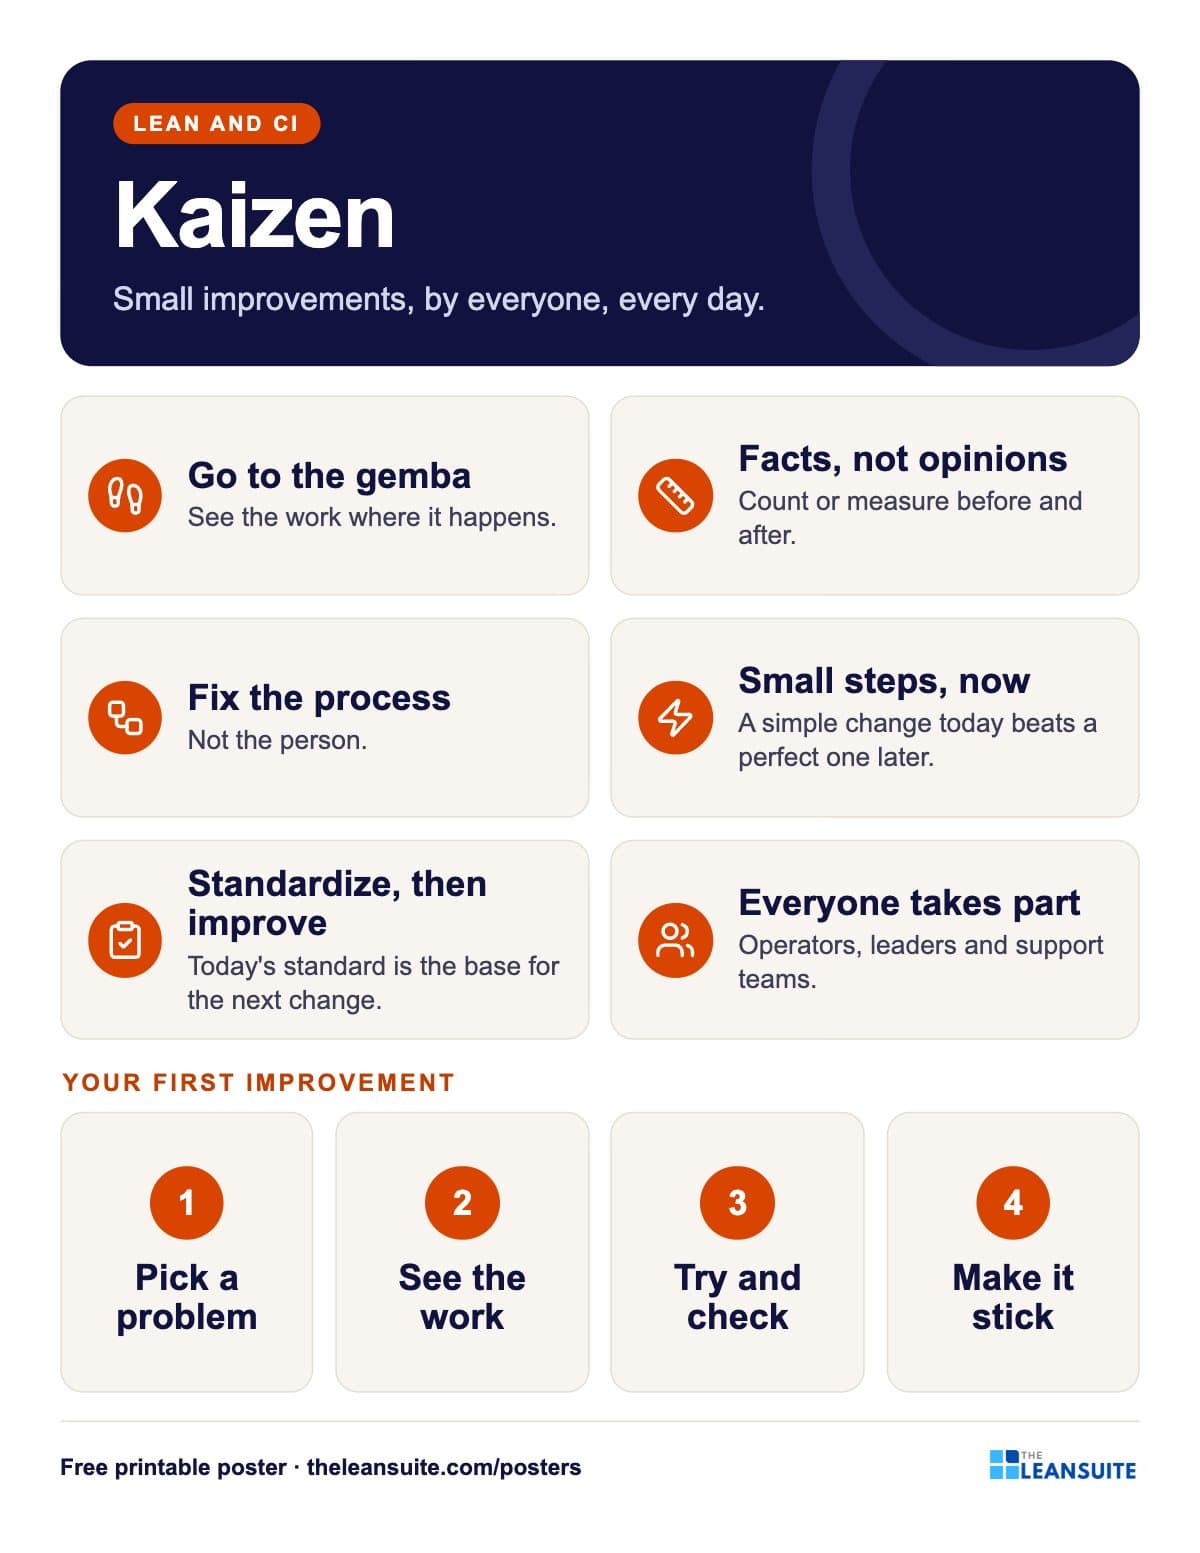 Kaizen principles poster
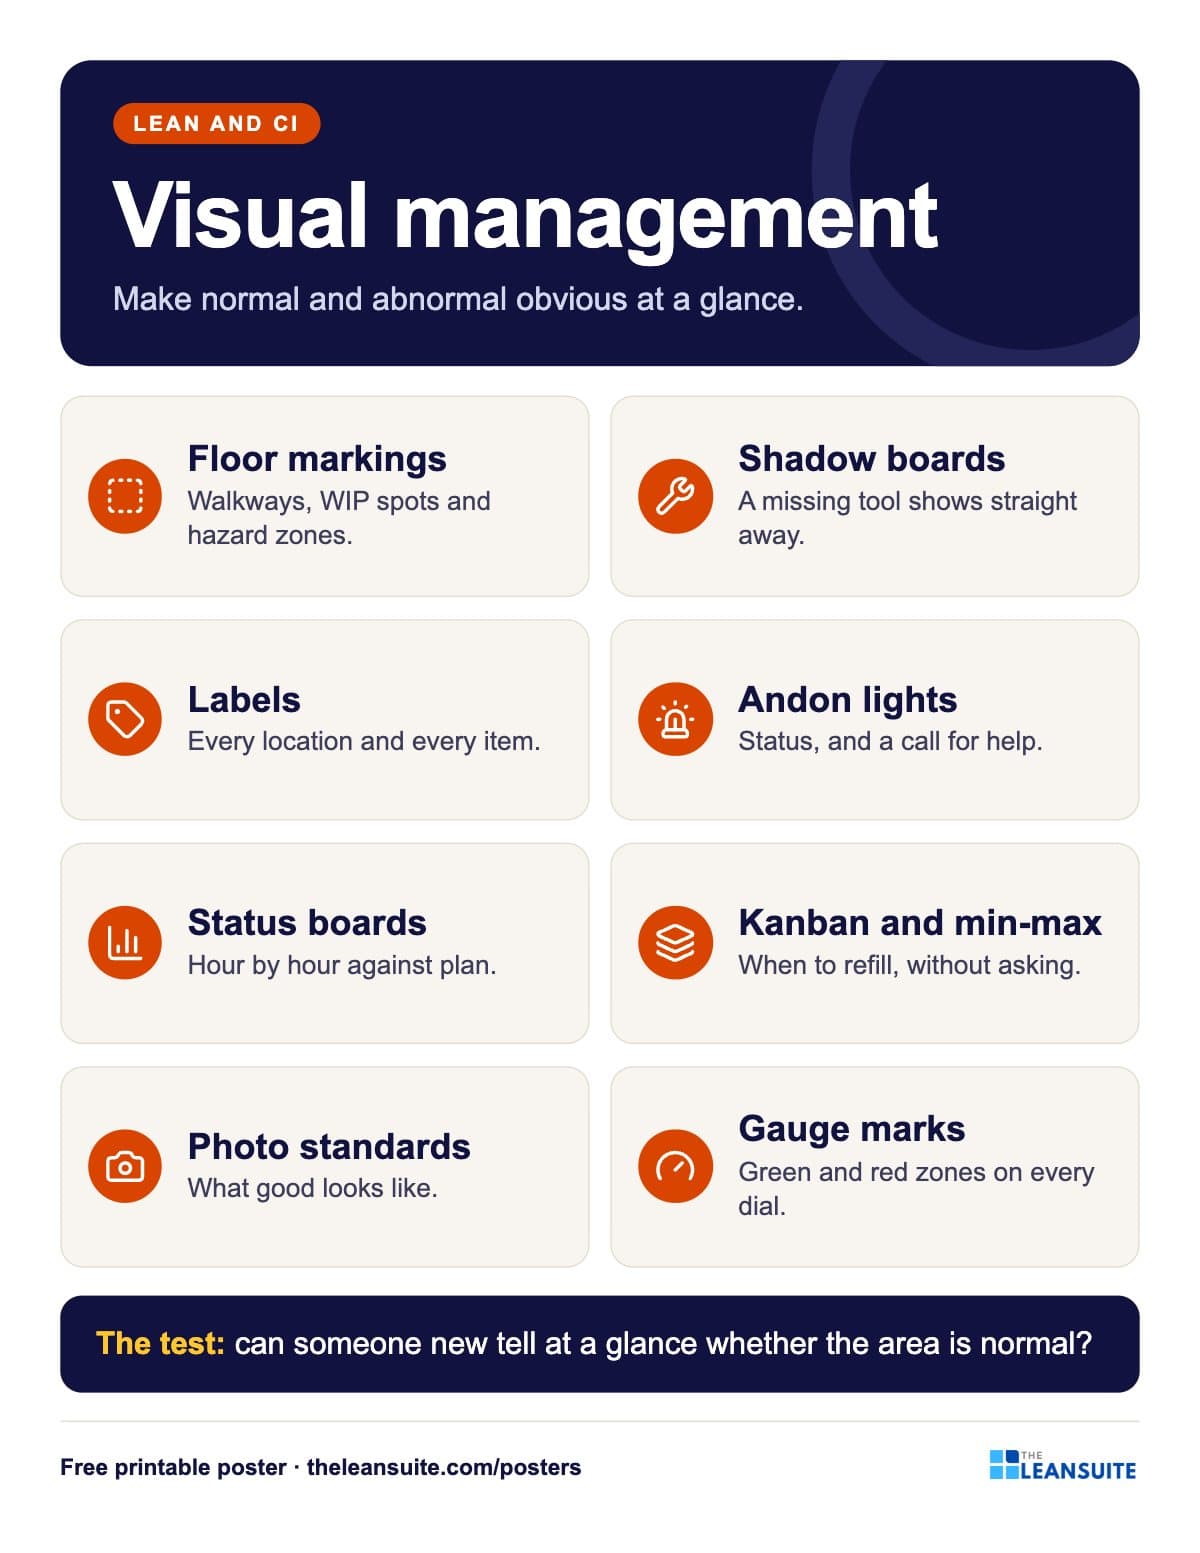 Visual management poster
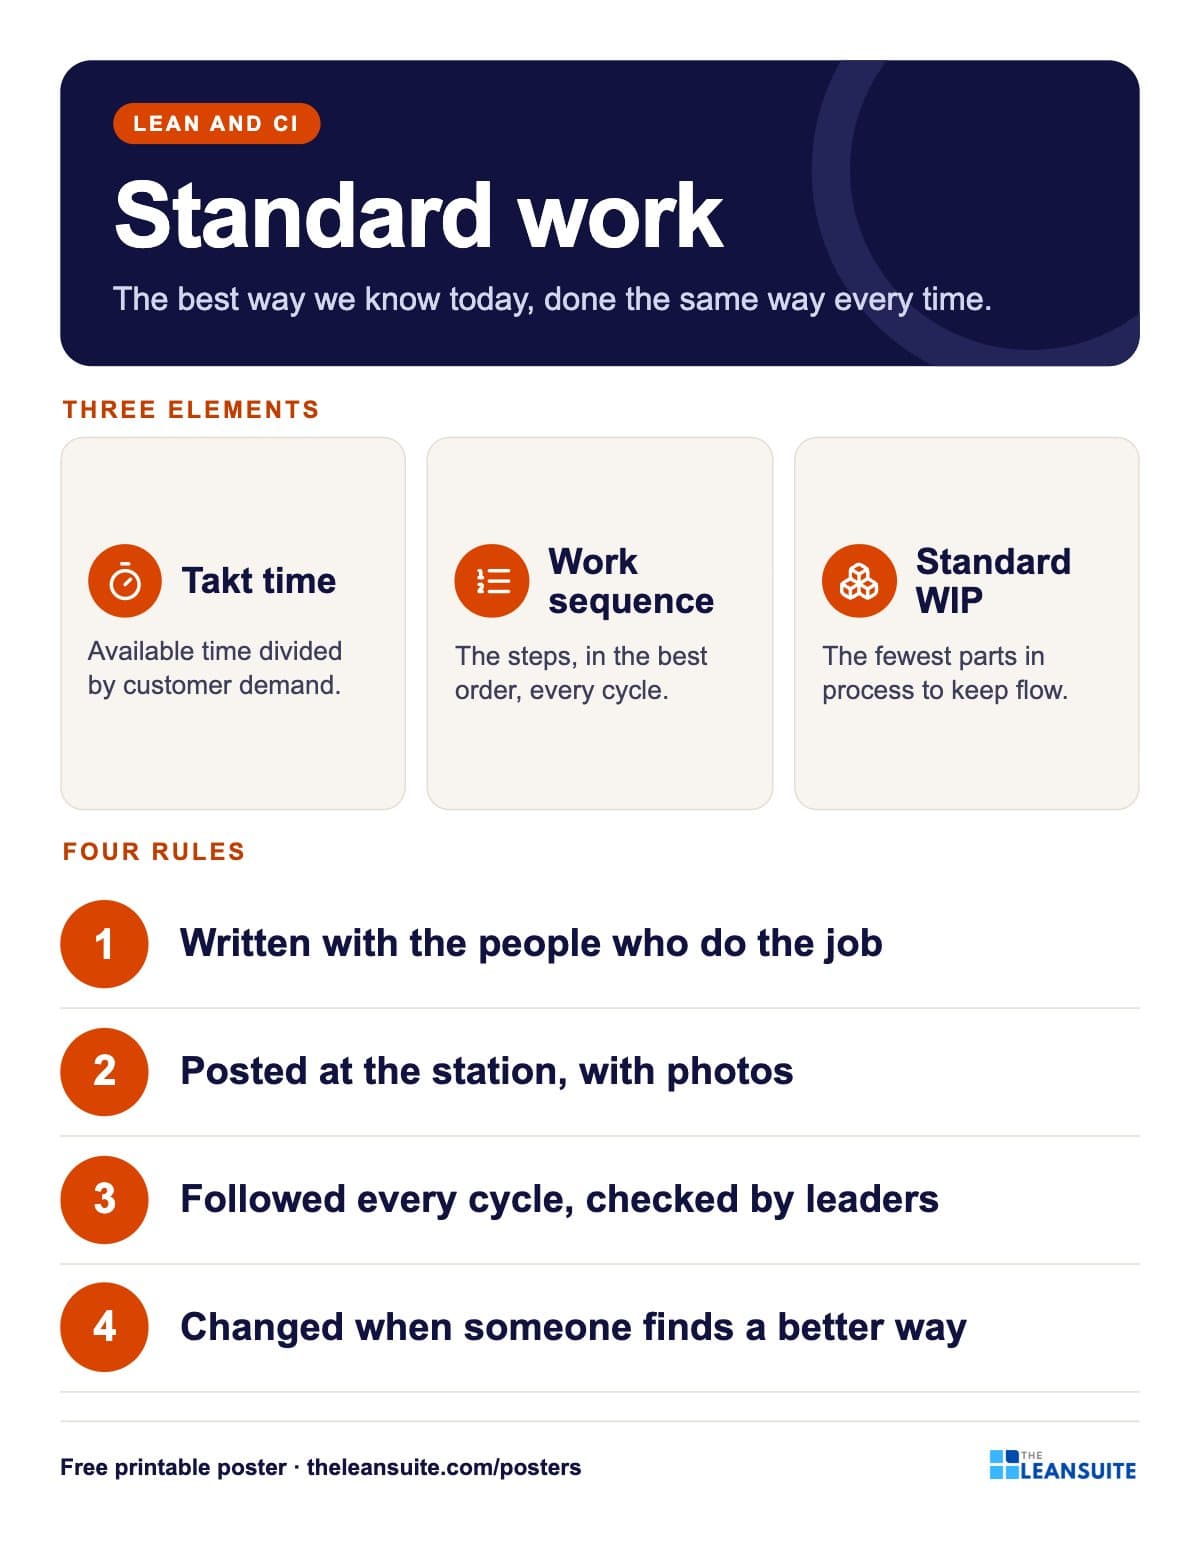 Standard work poster
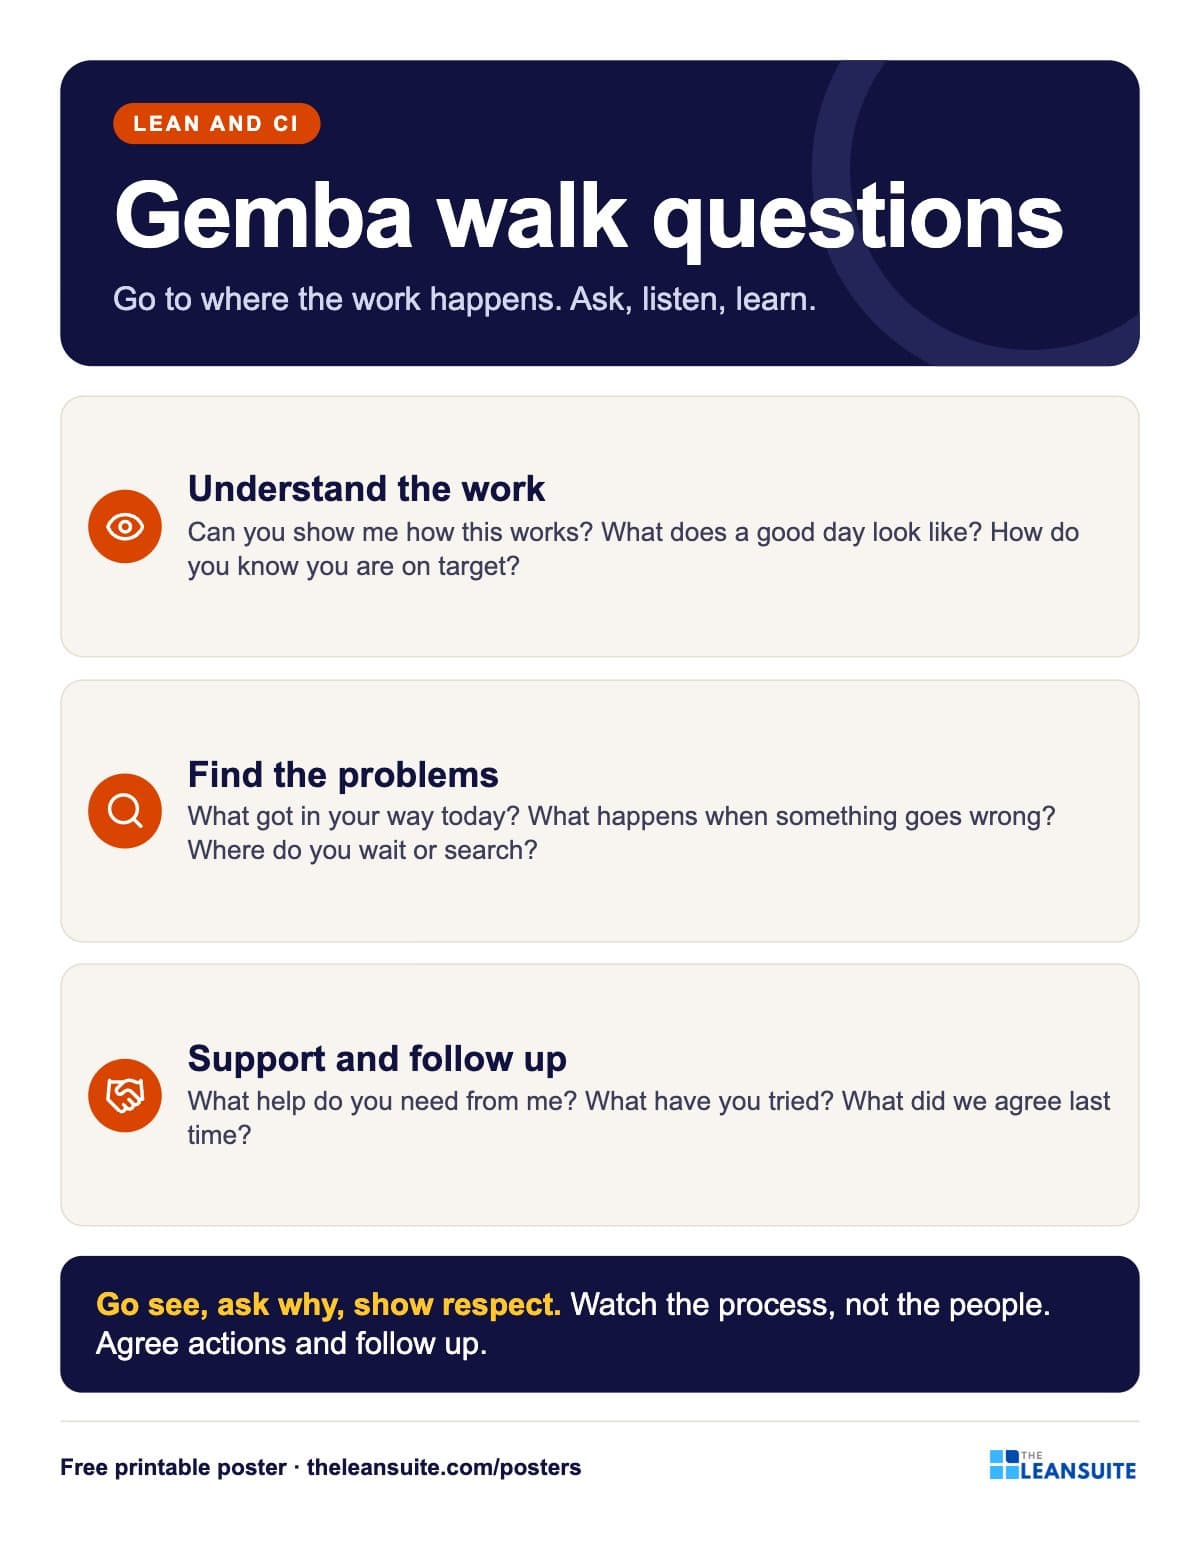 Gemba walk questions poster
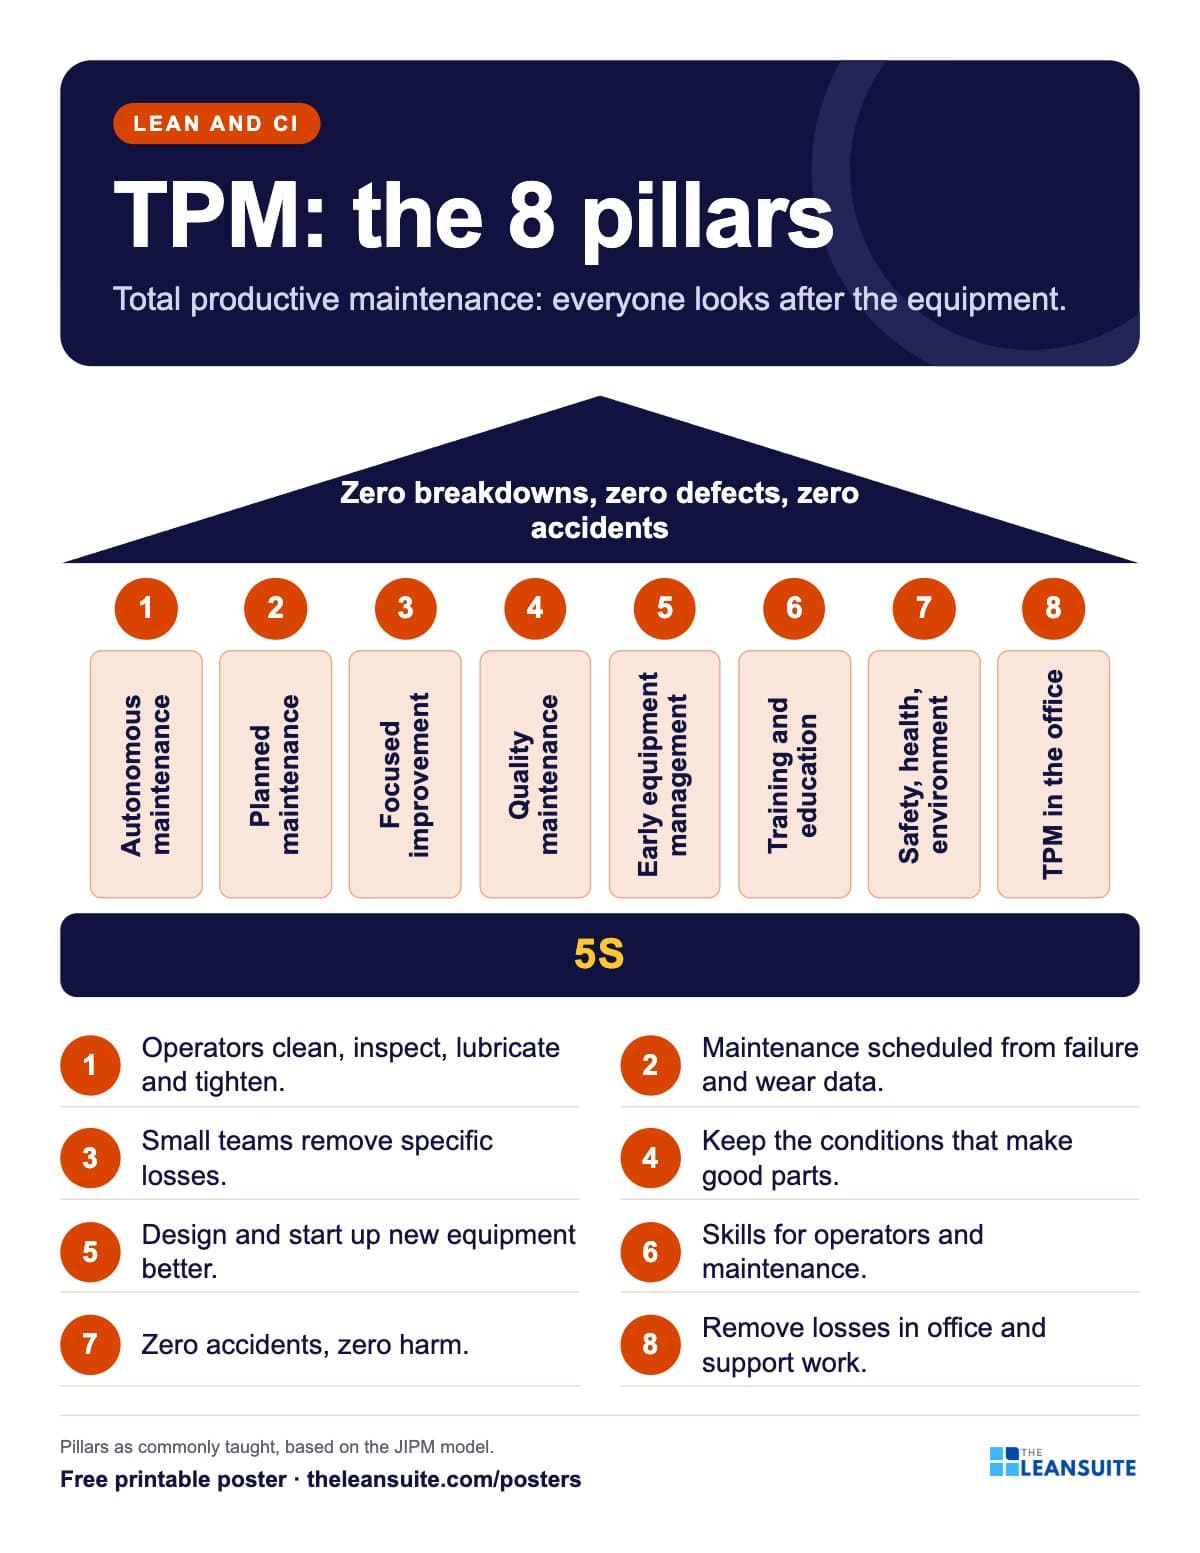 TPM 8 pillars poster
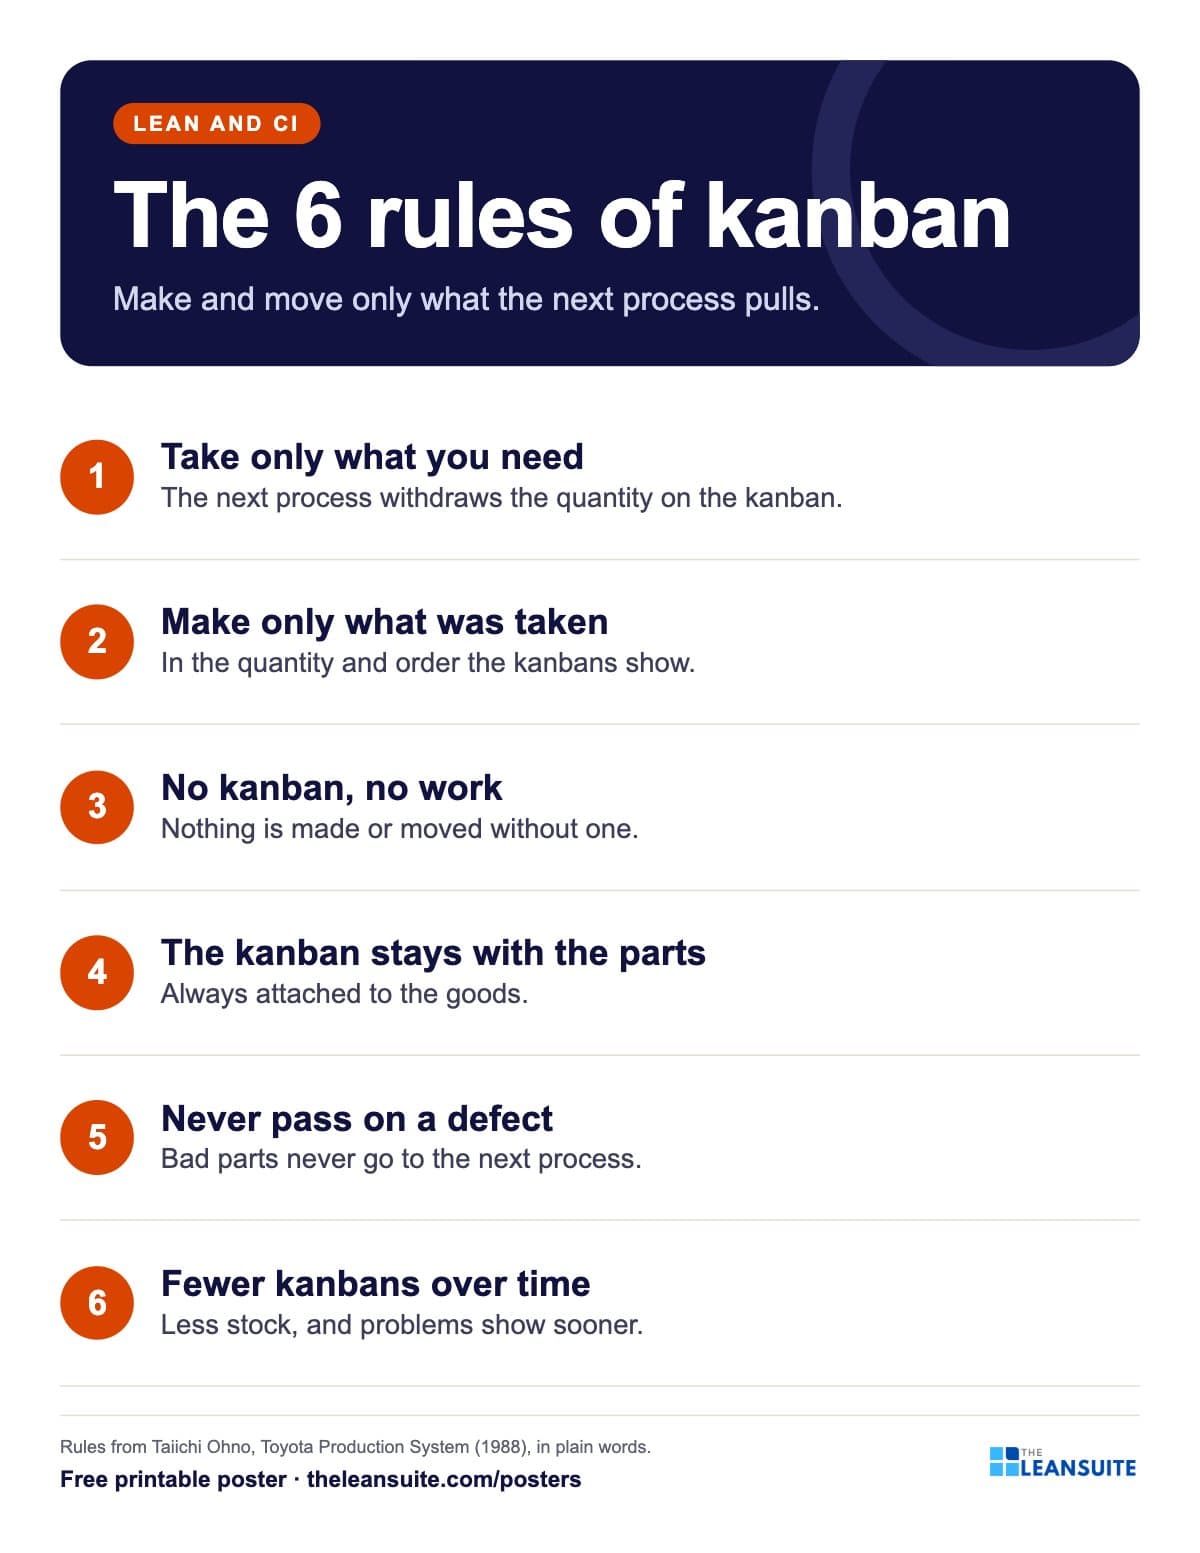 Kanban rules poster
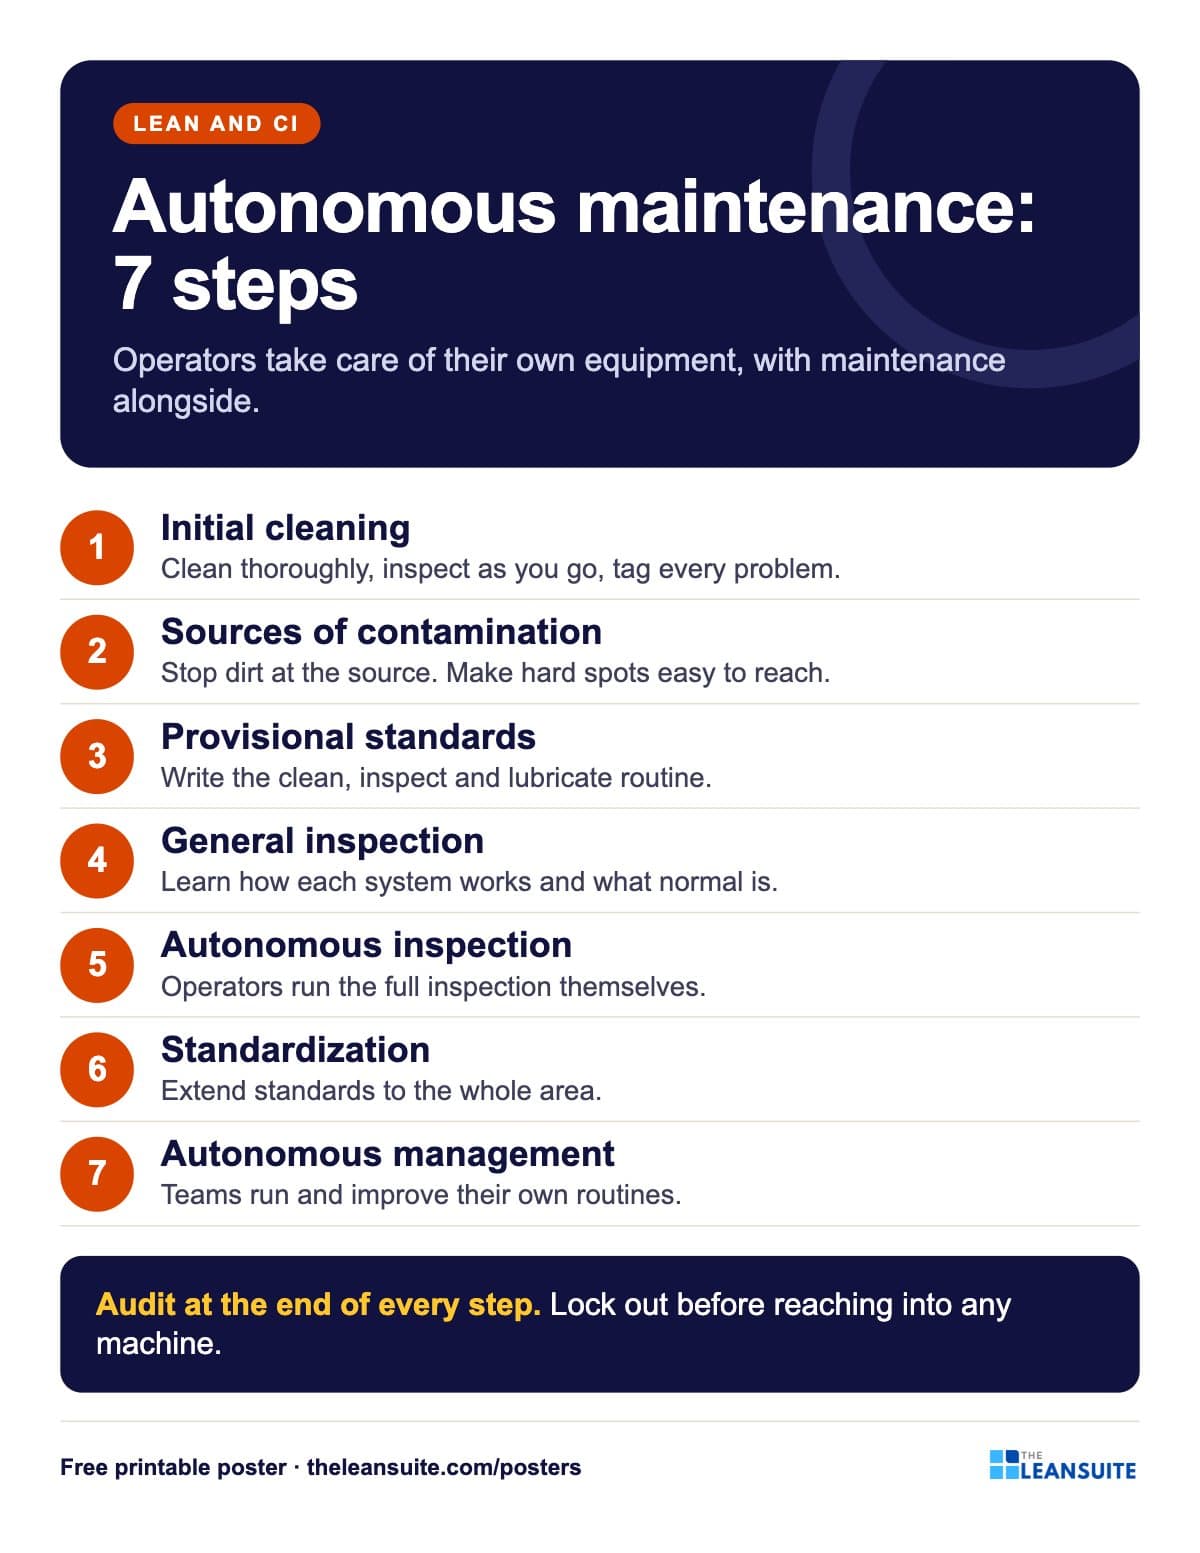 Autonomous maintenance 7 steps poster
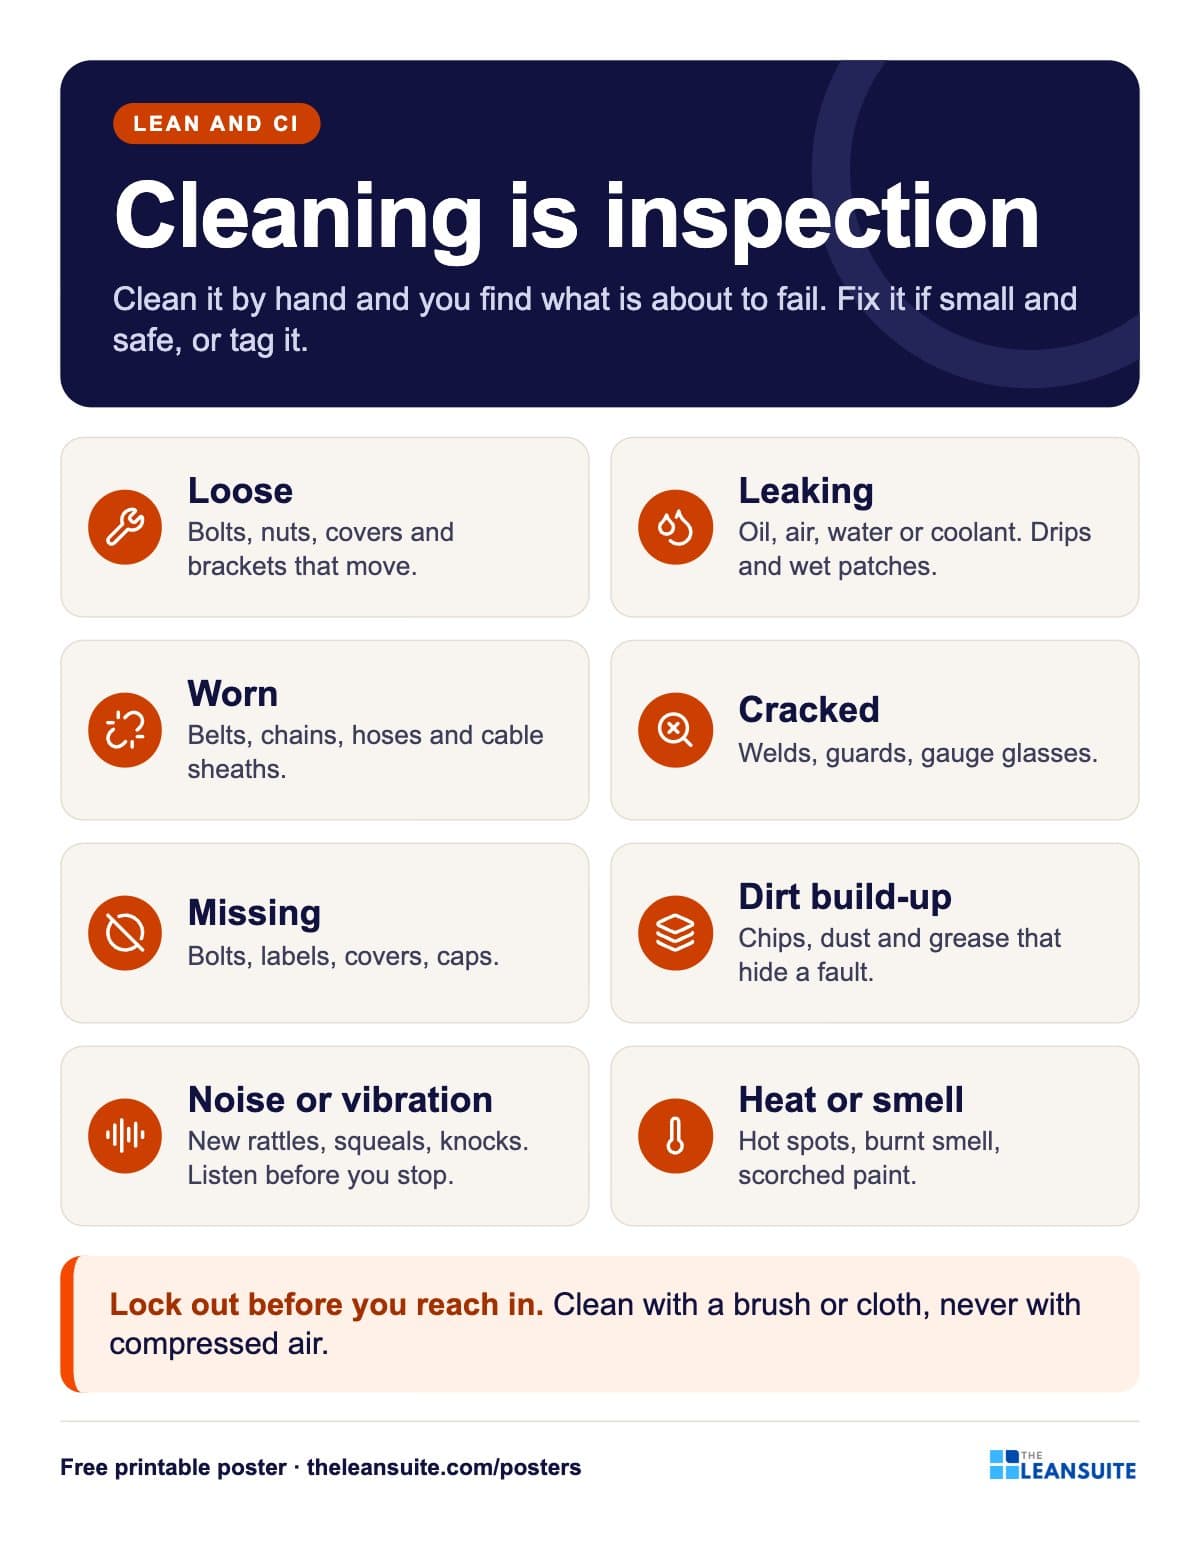 Cleaning is inspection poster
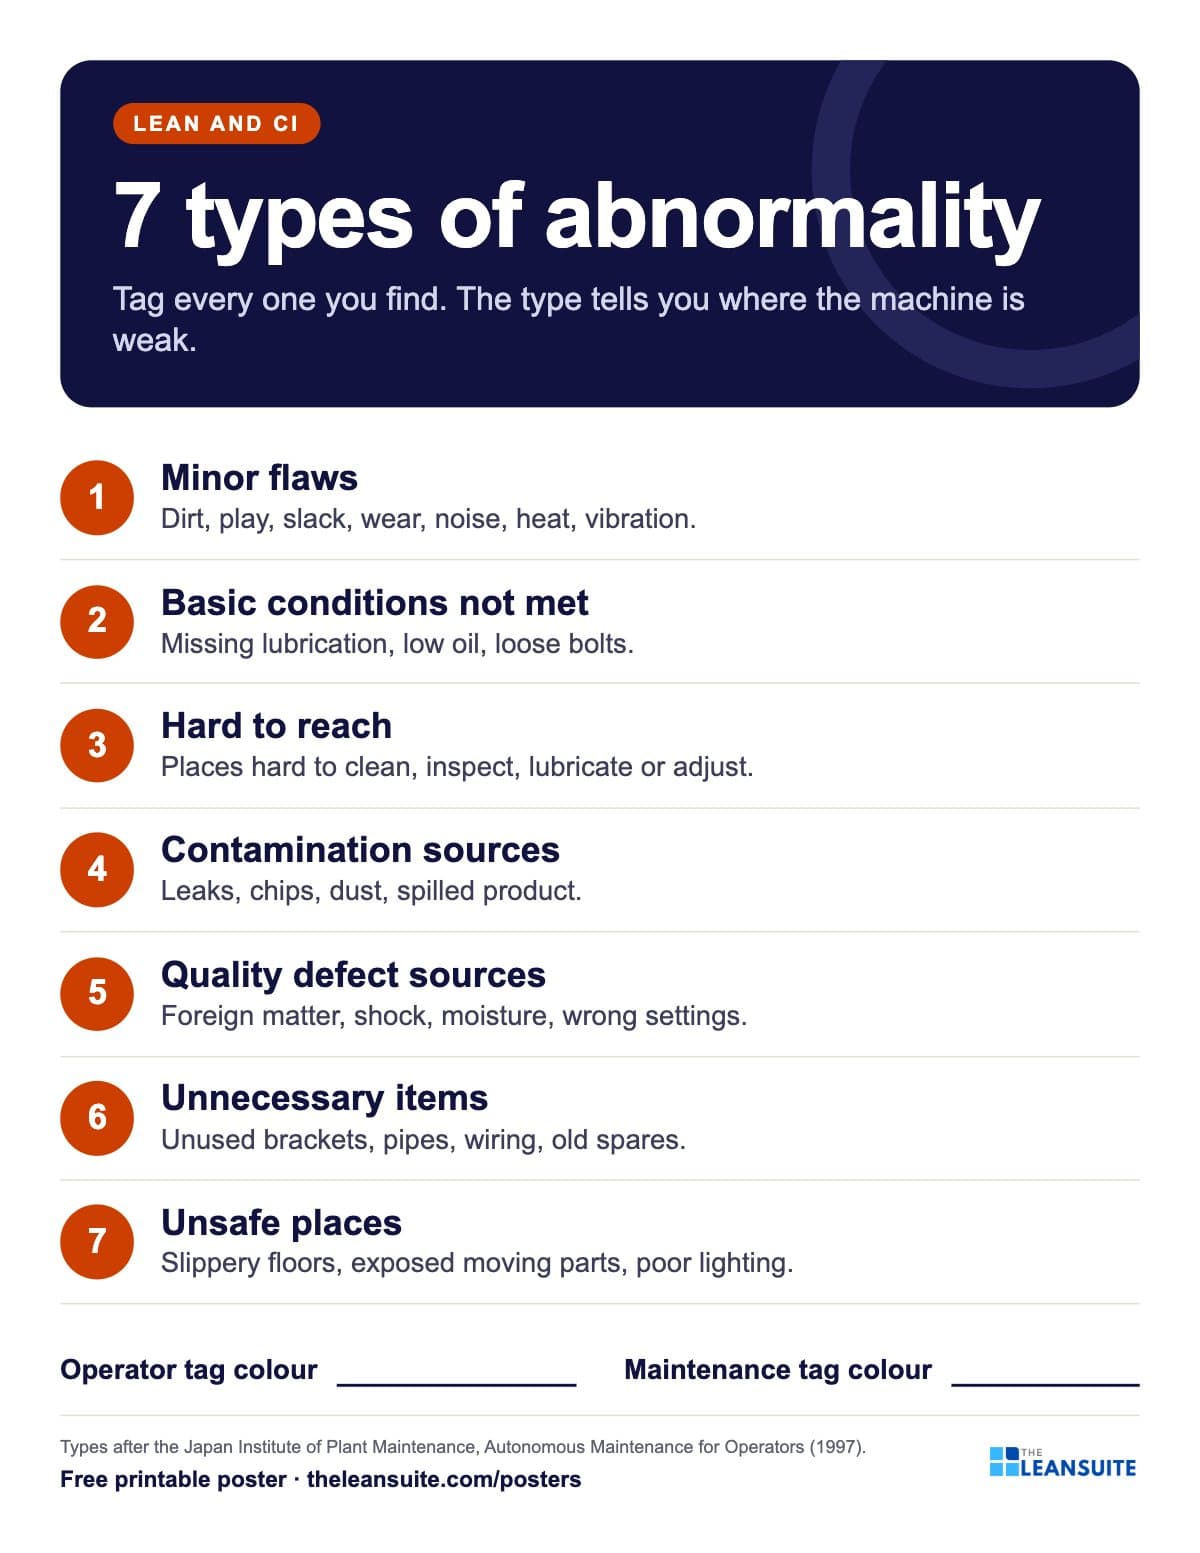 7 types of abnormality poster (TPM tags)
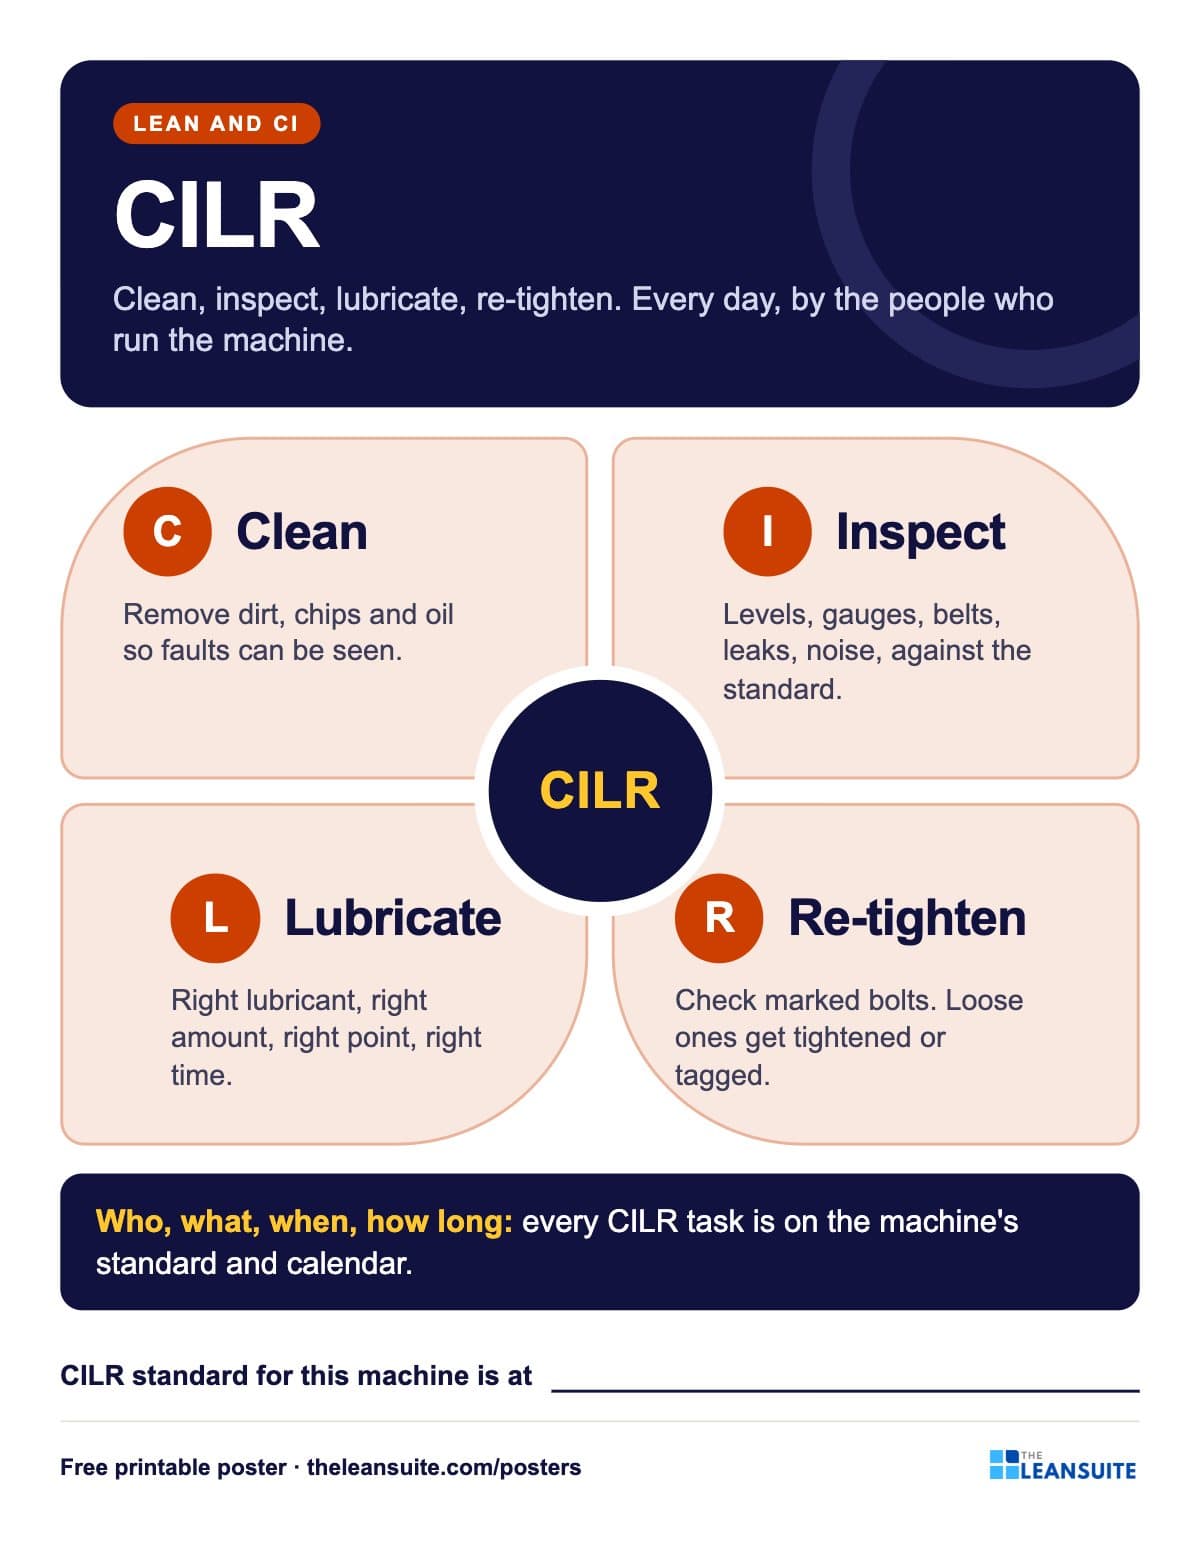 CILR poster: clean, inspect, lubricate, re-tighten
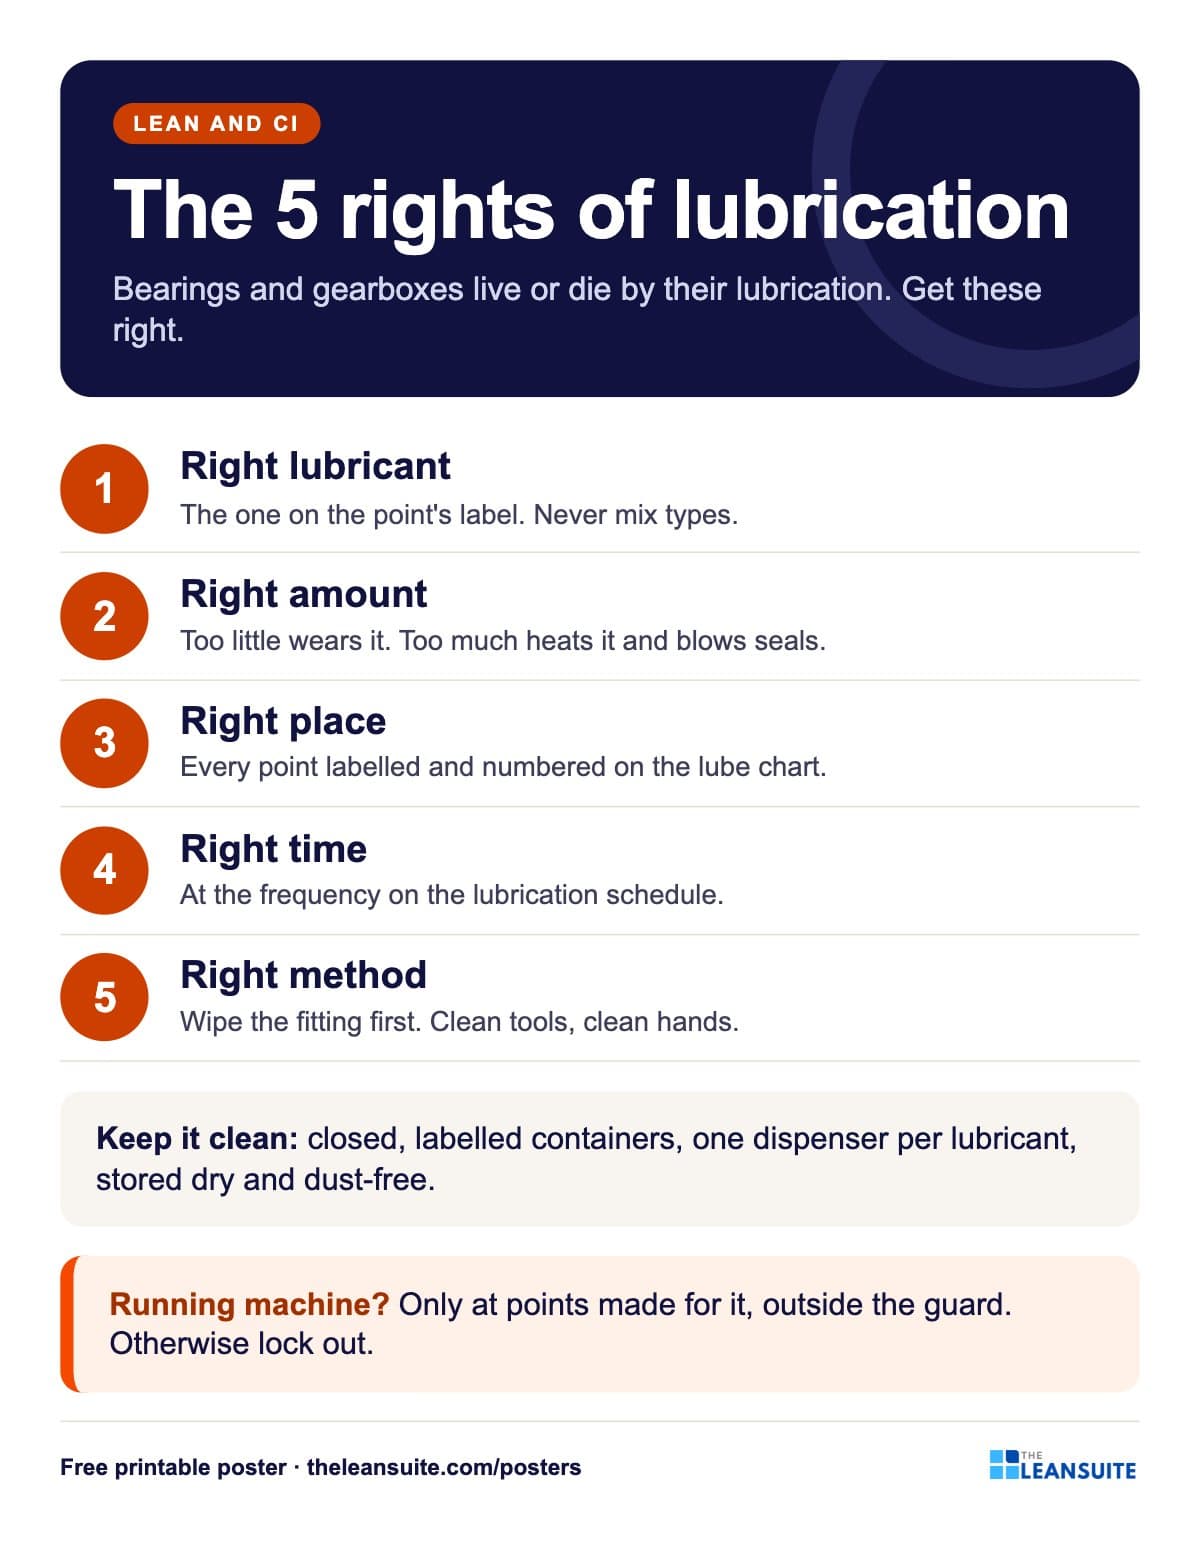 Lubrication basics poster: the five rights
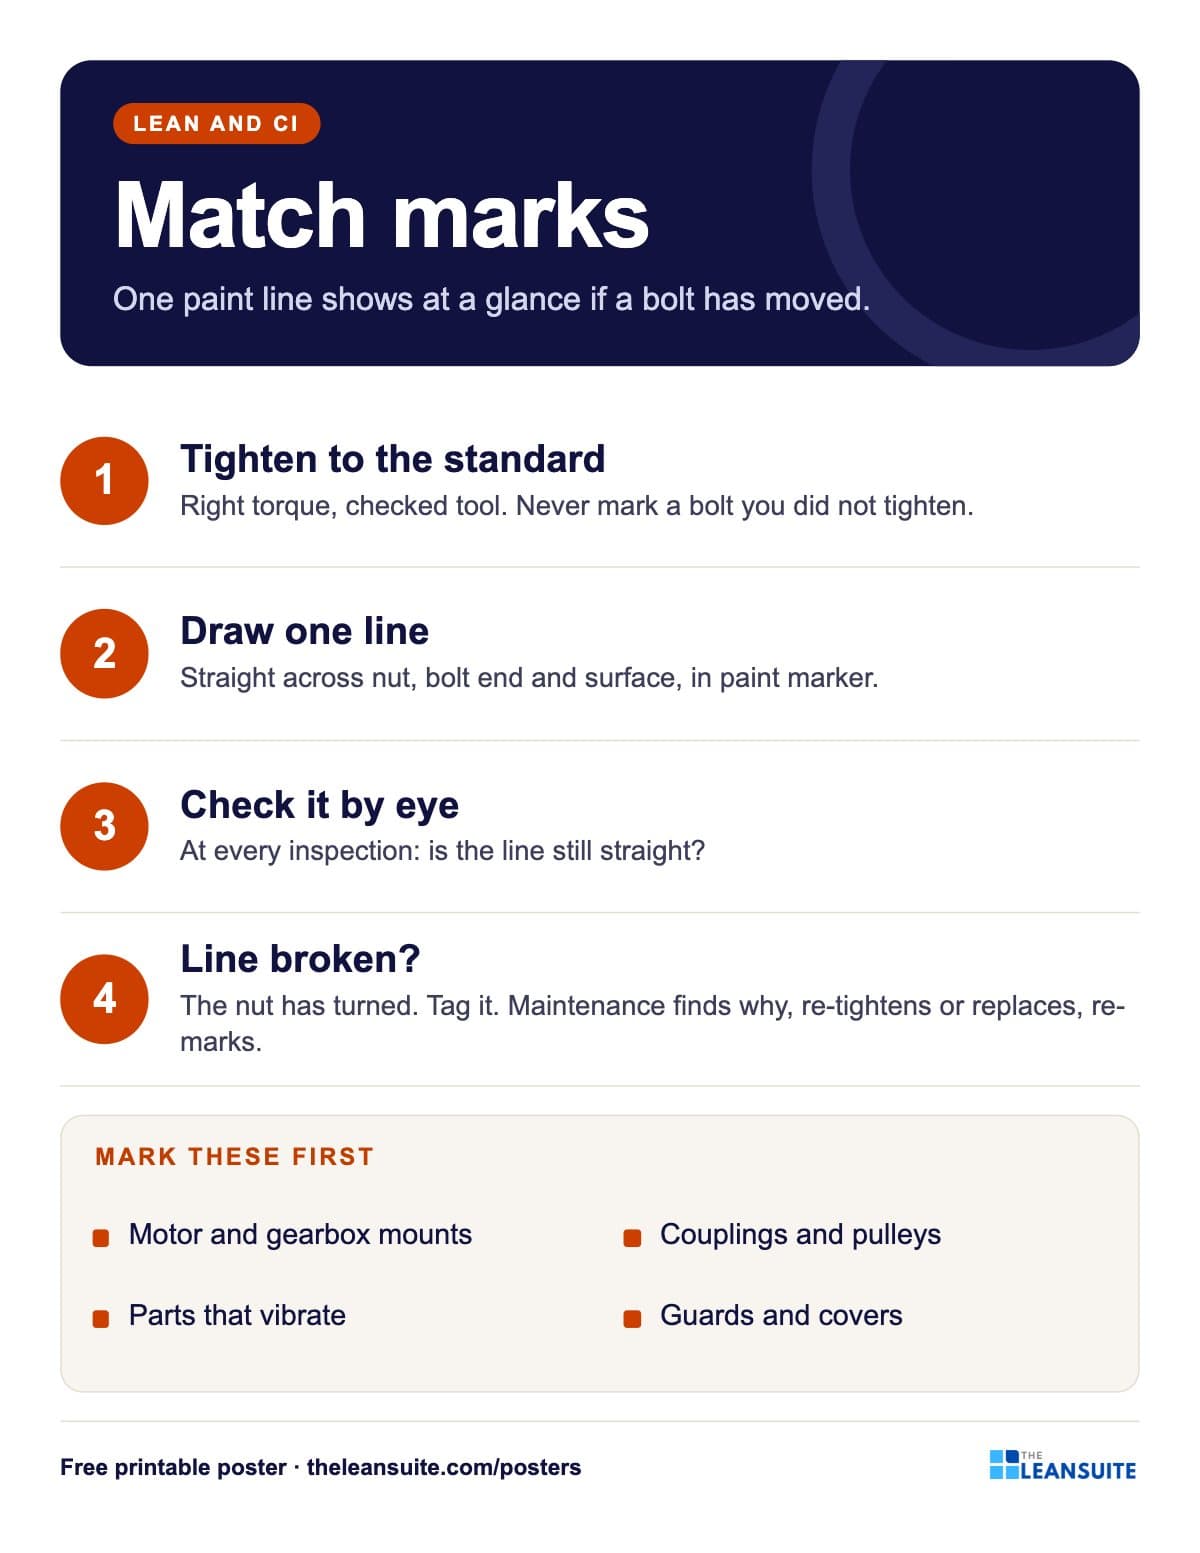 Bolt match marks poster
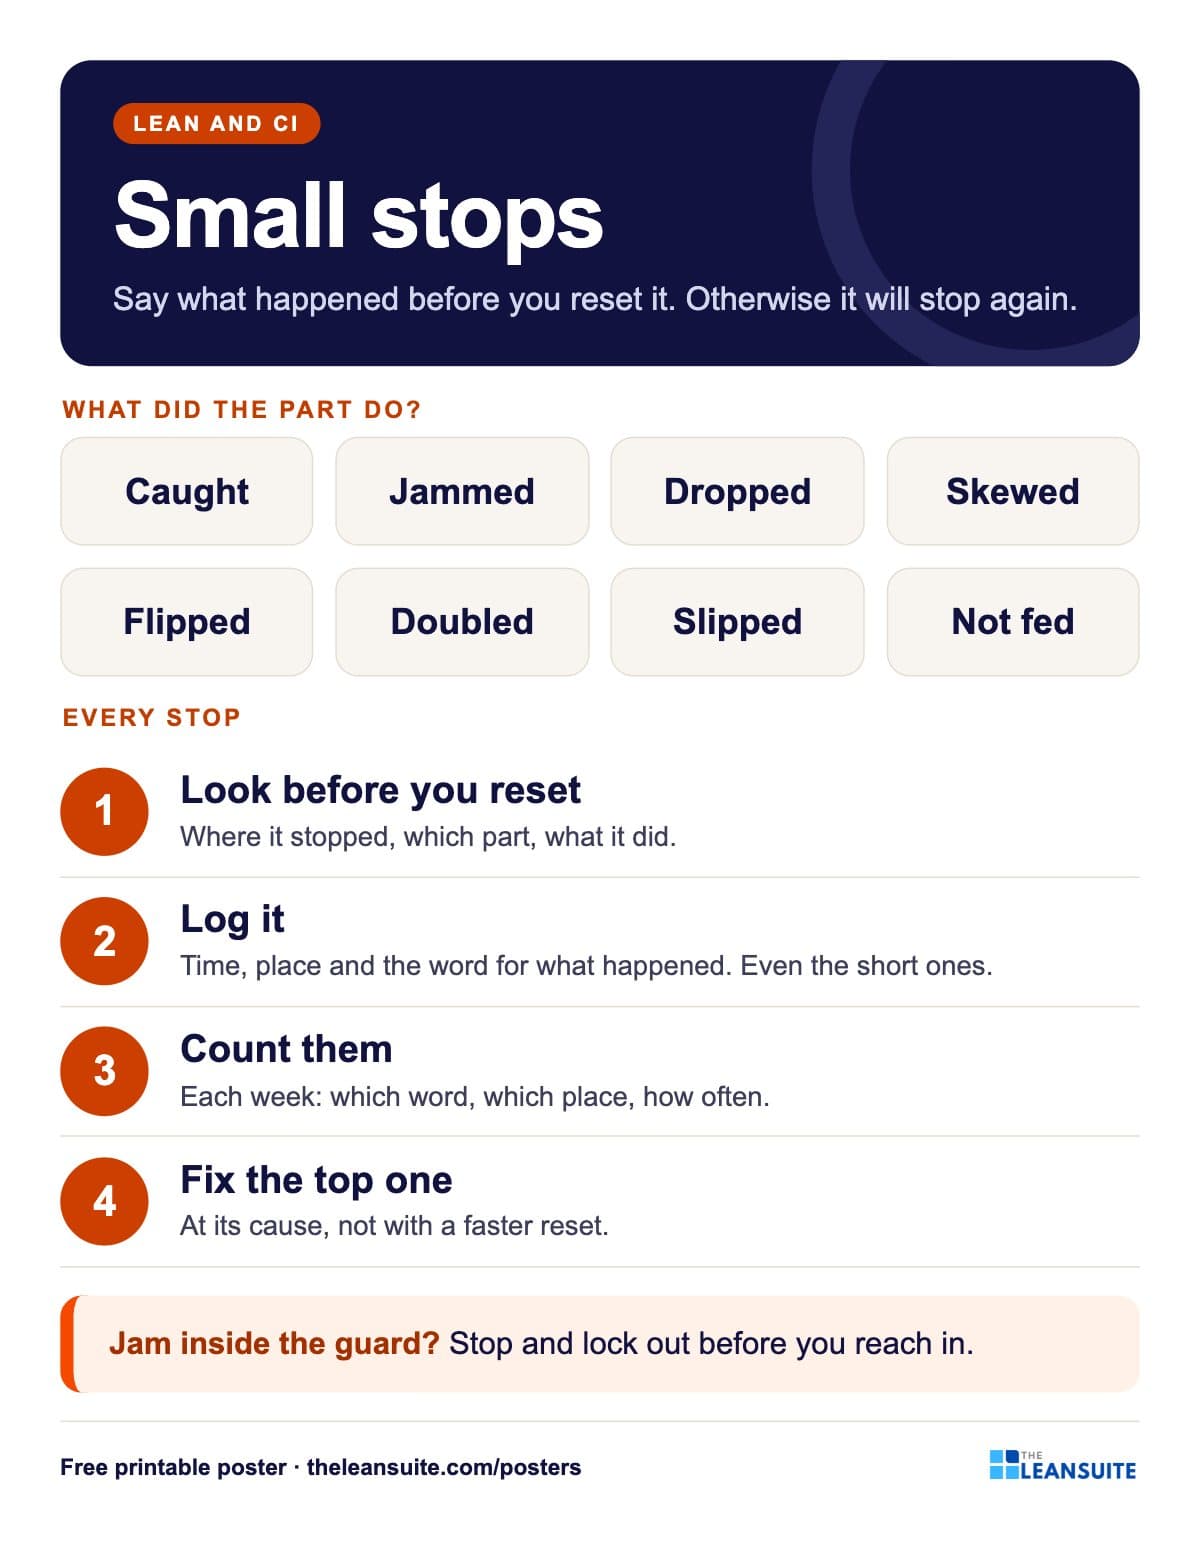 Small stops poster
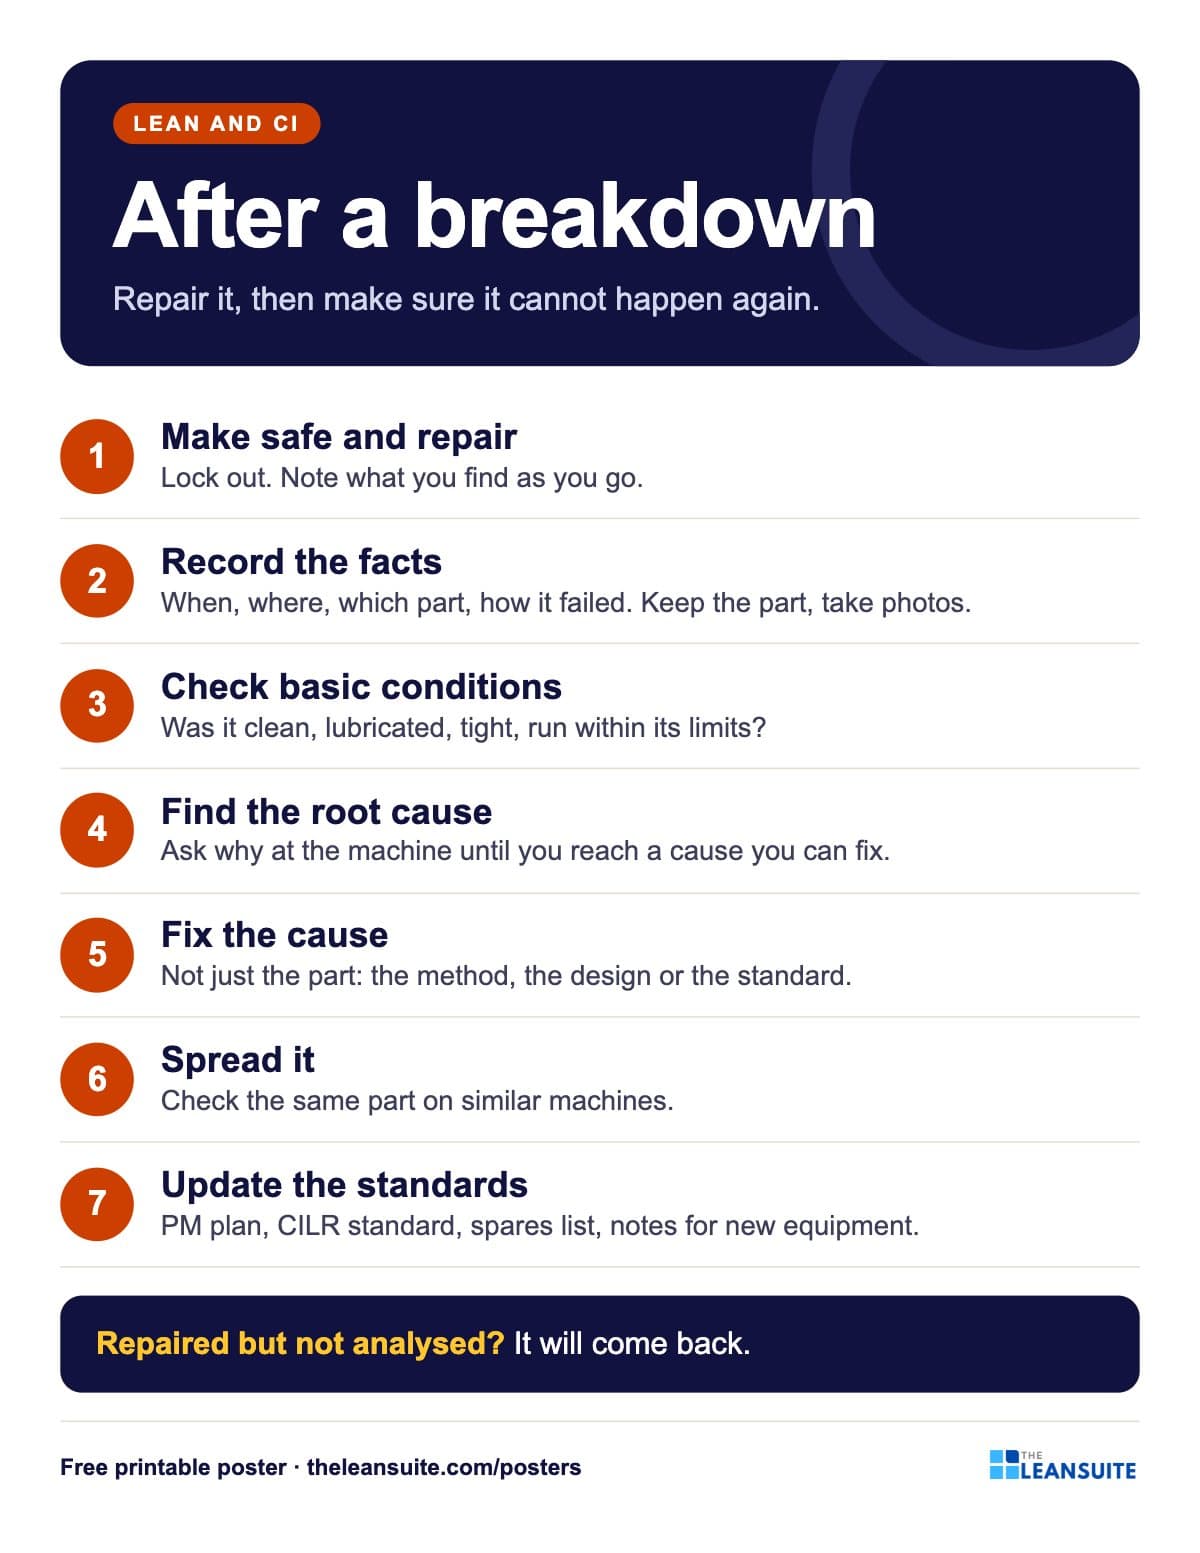 Breakdown analysis poster
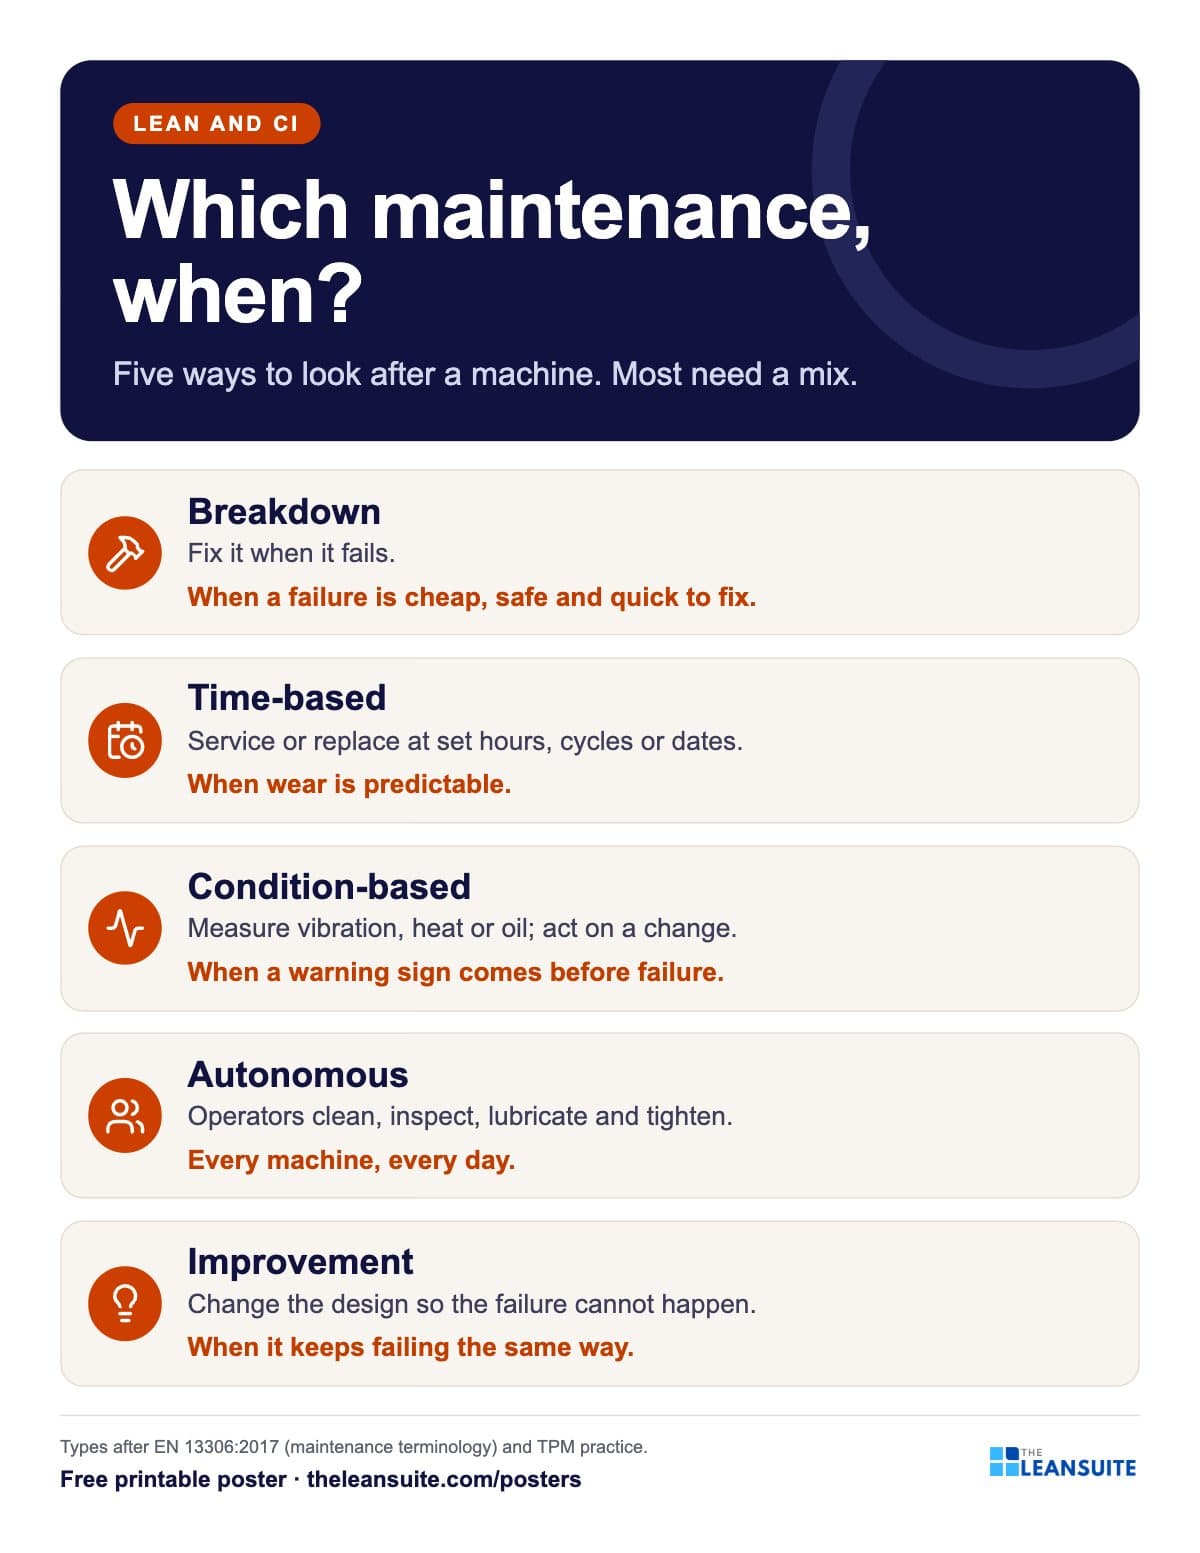 Types of maintenance poster
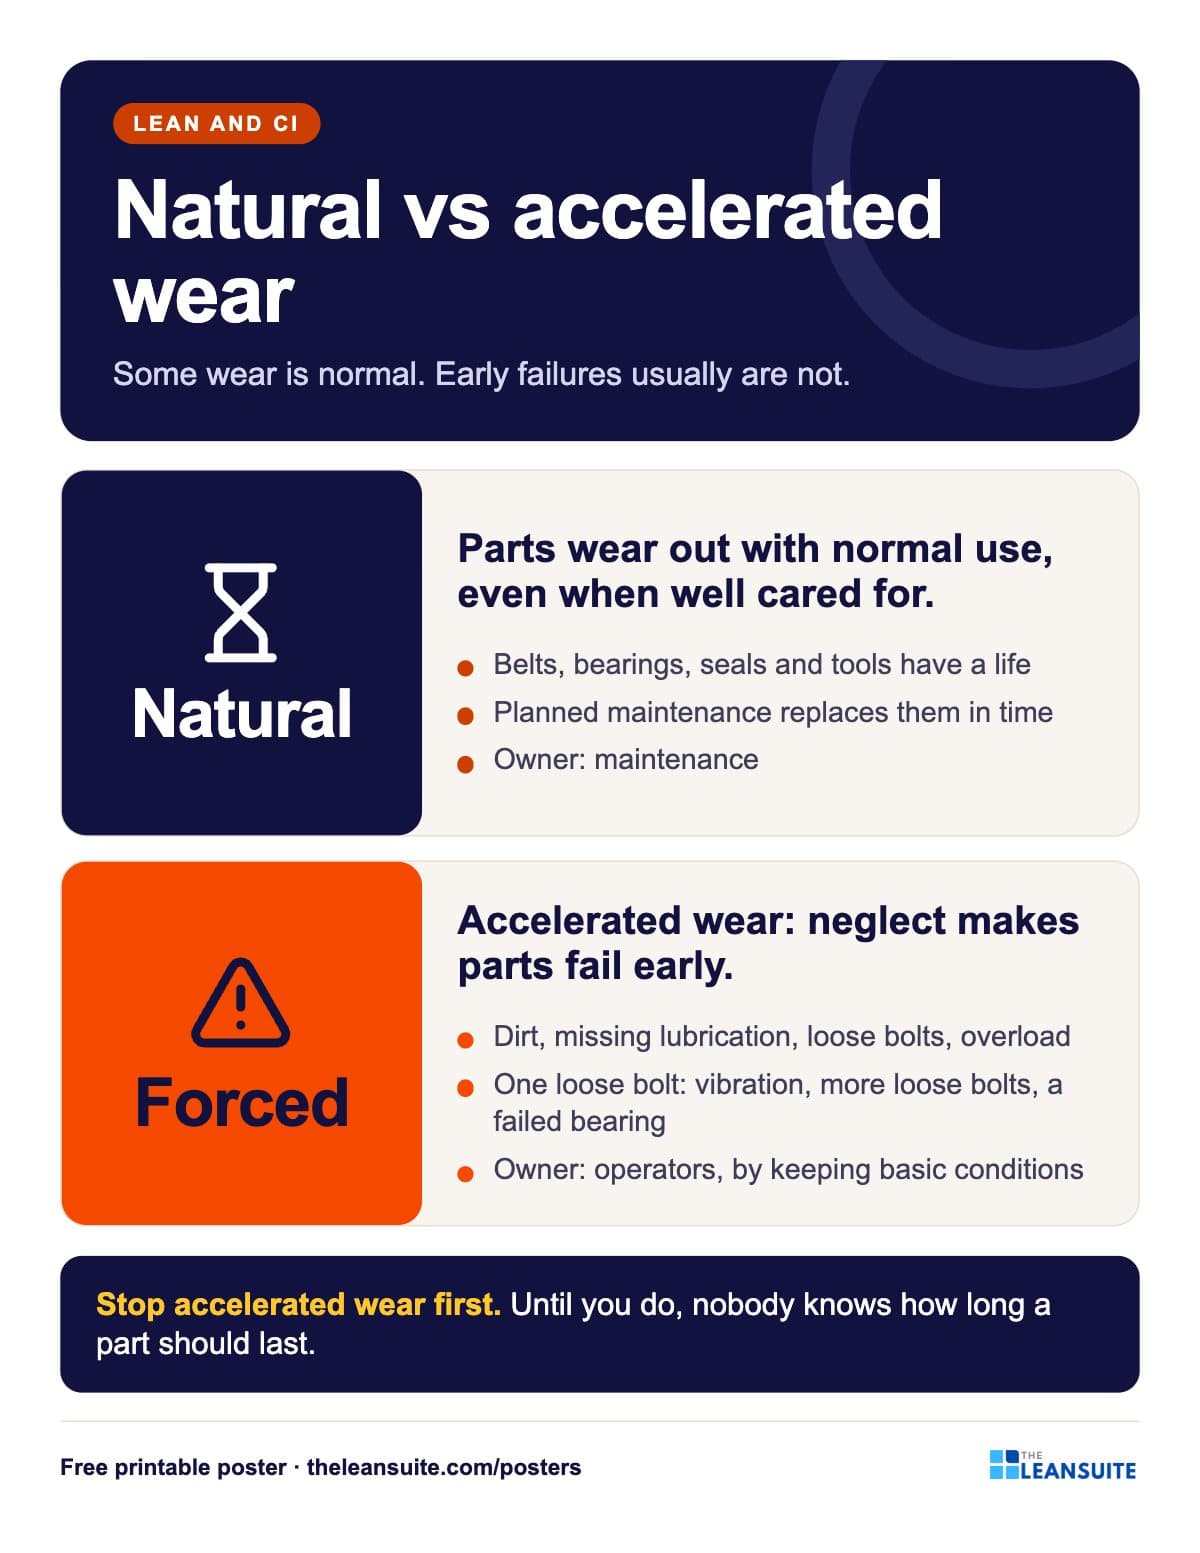 Natural vs accelerated wear poster
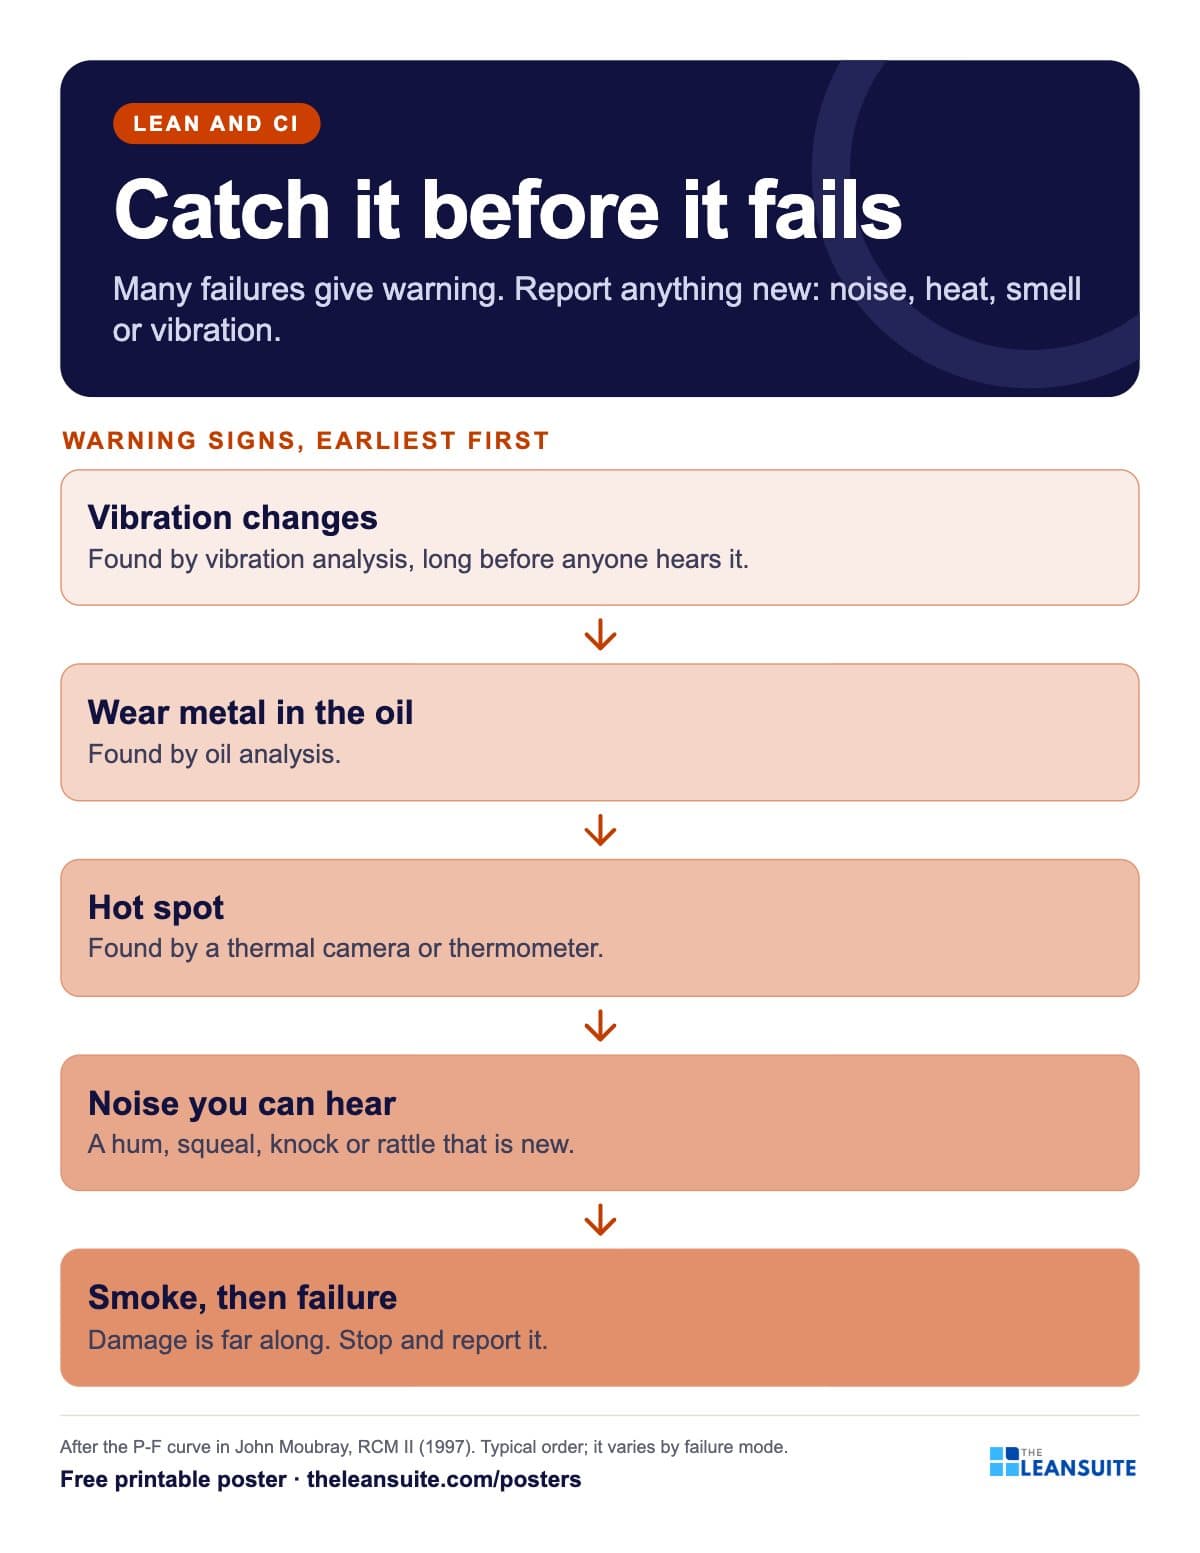 Failure warning signs poster (P-F curve)
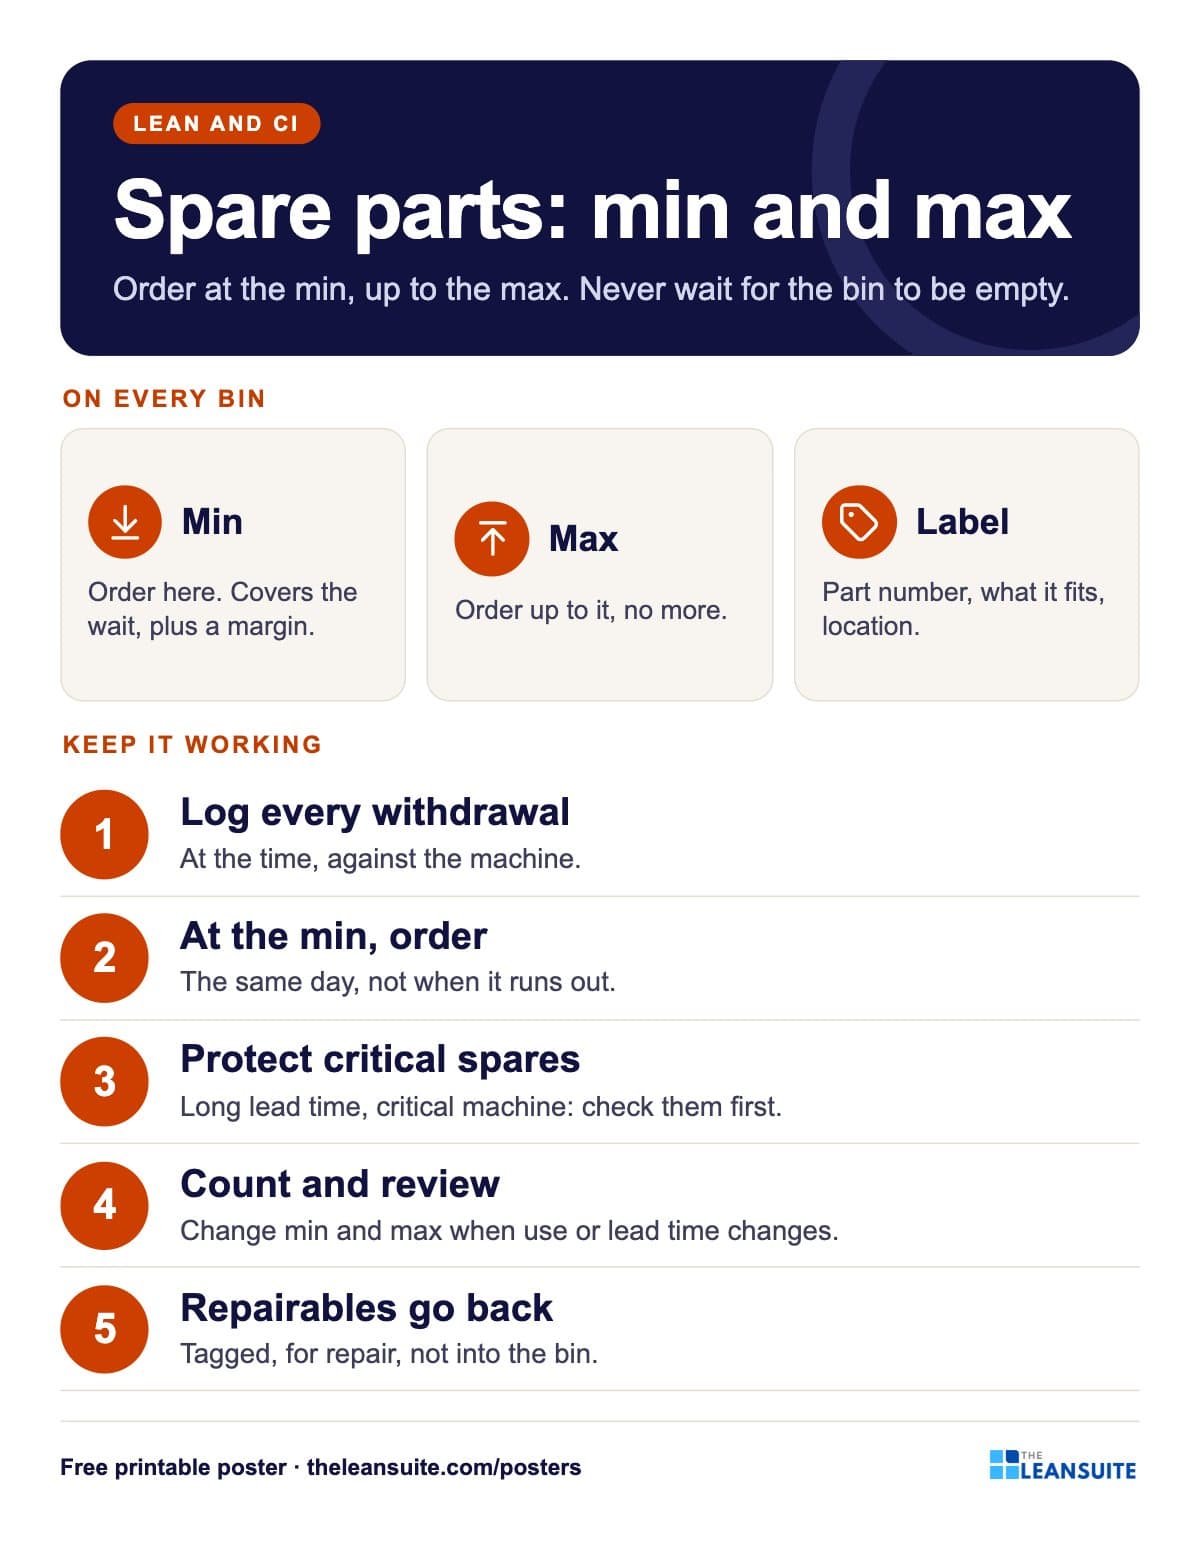 Spare parts min/max poster
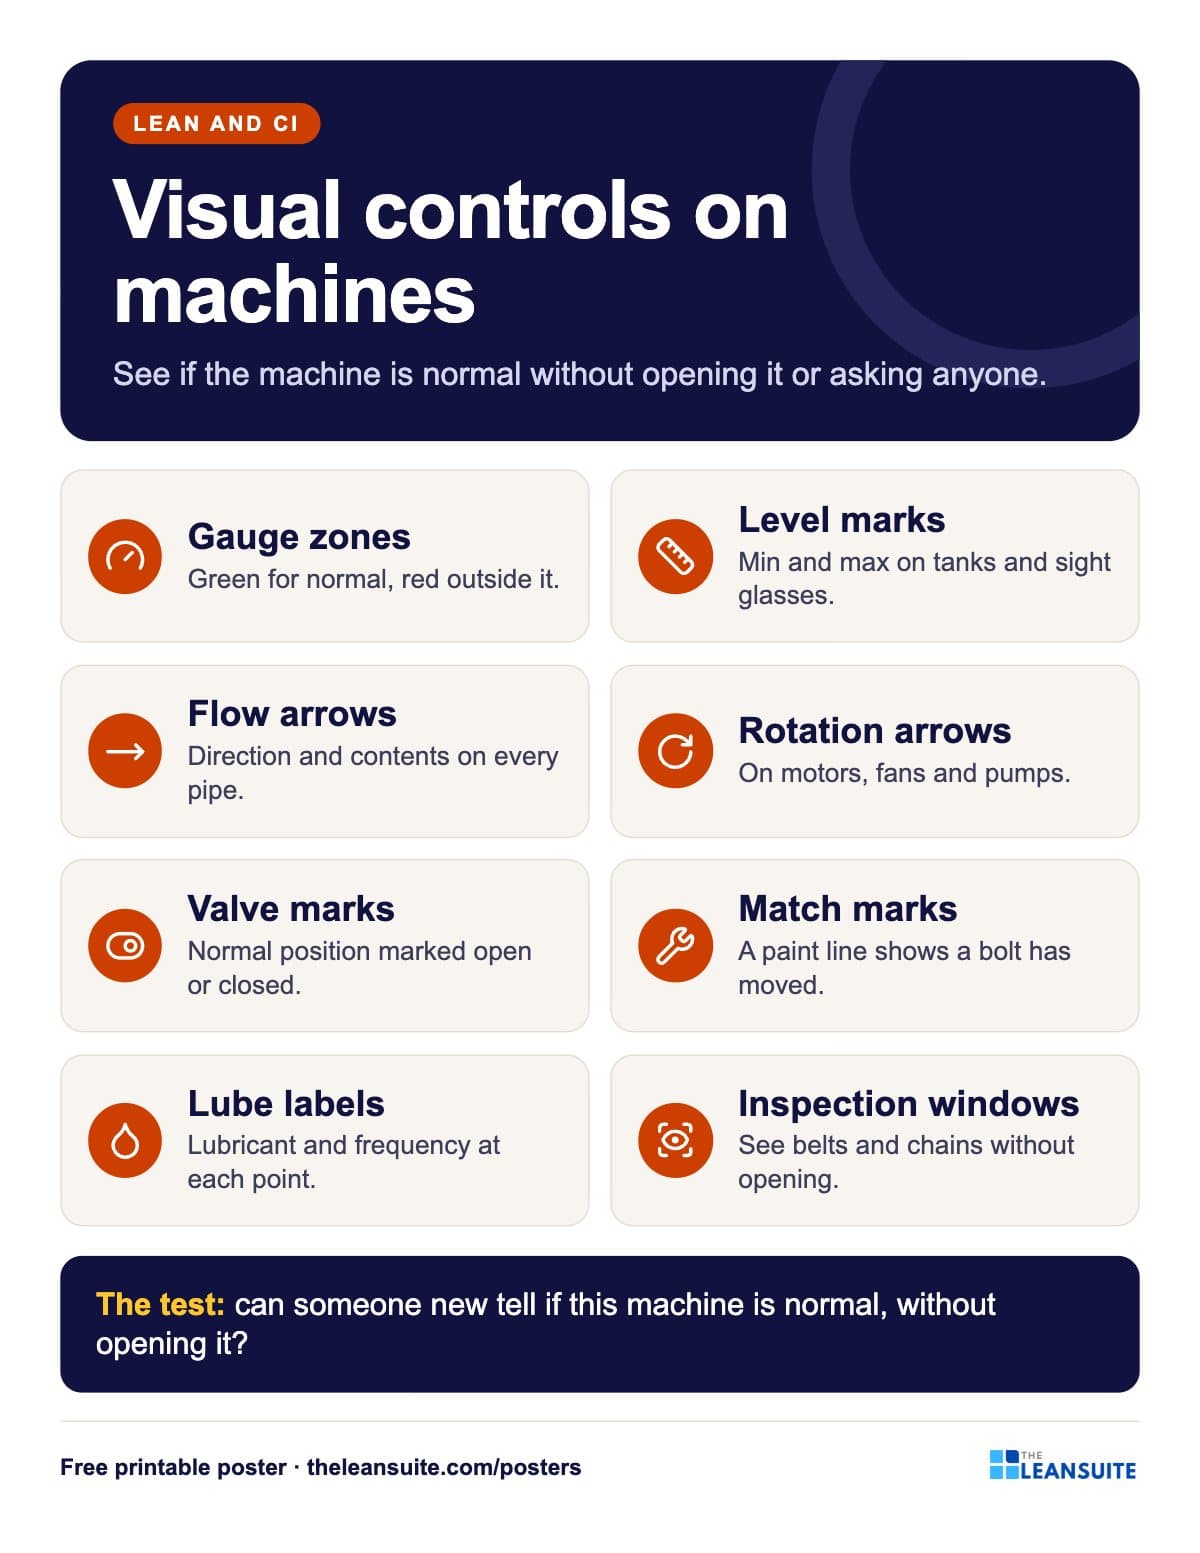 Machine visual controls poster
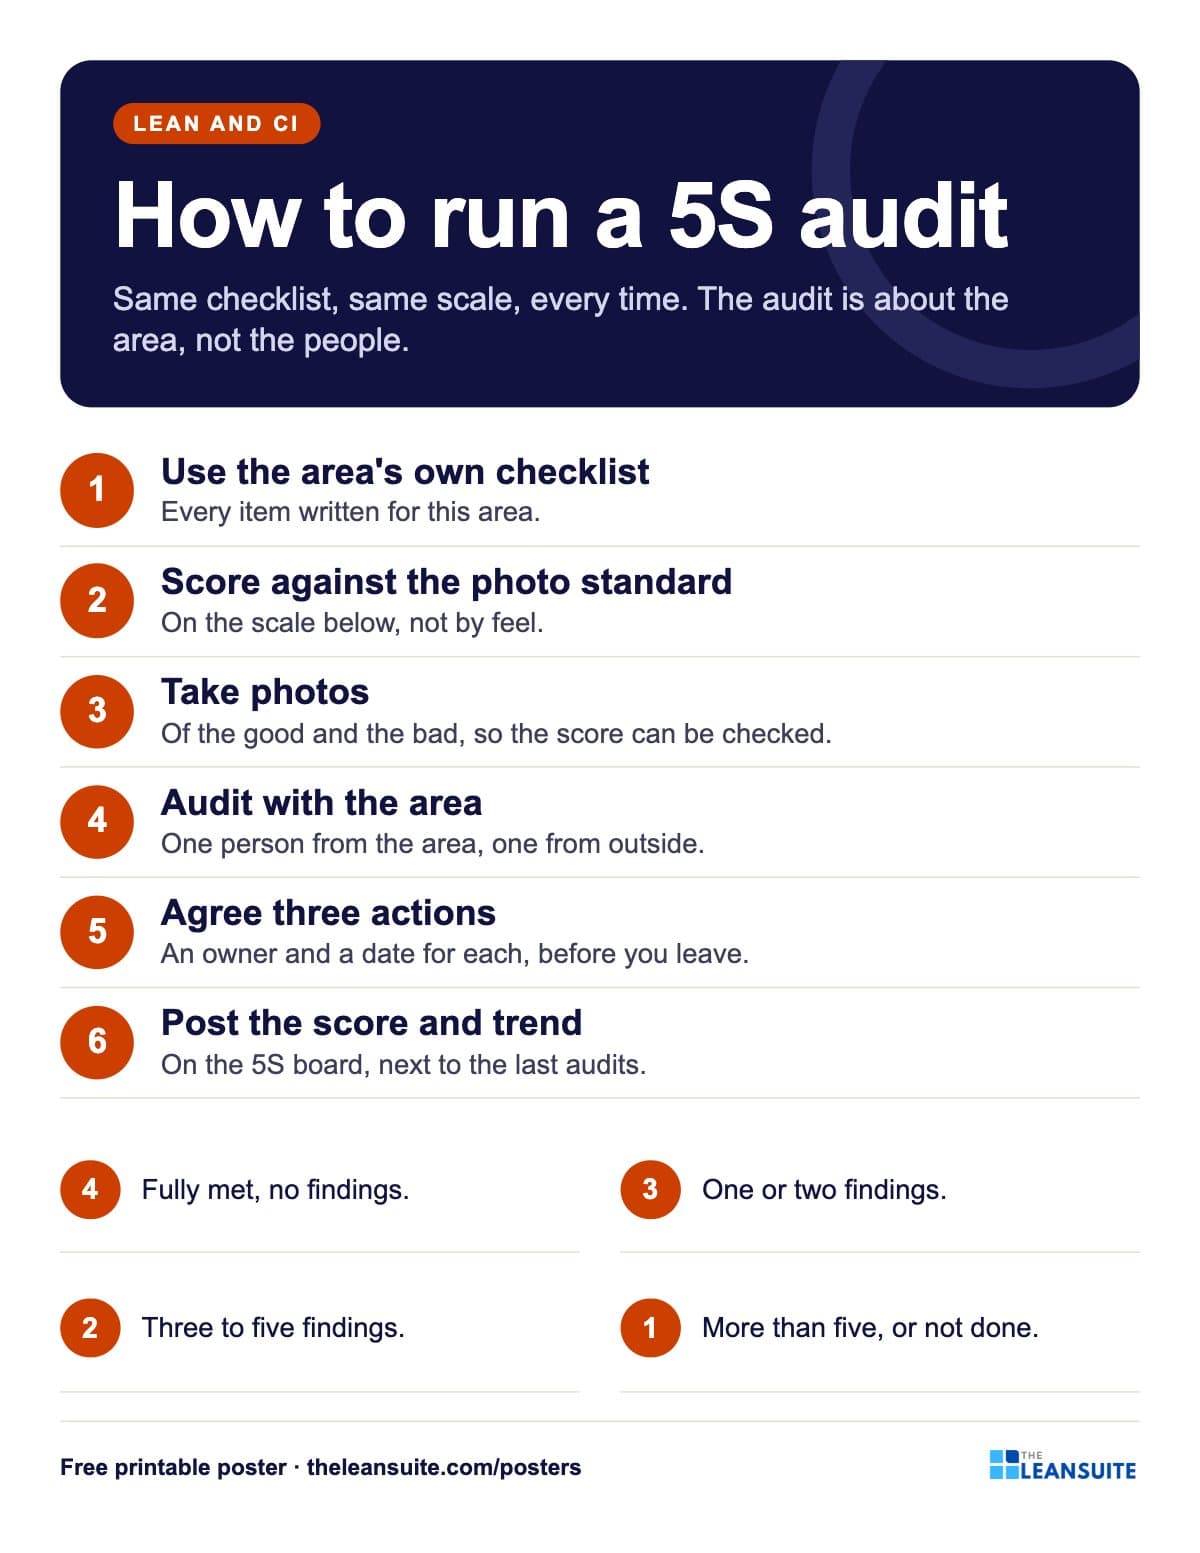 How to run a 5S audit poster
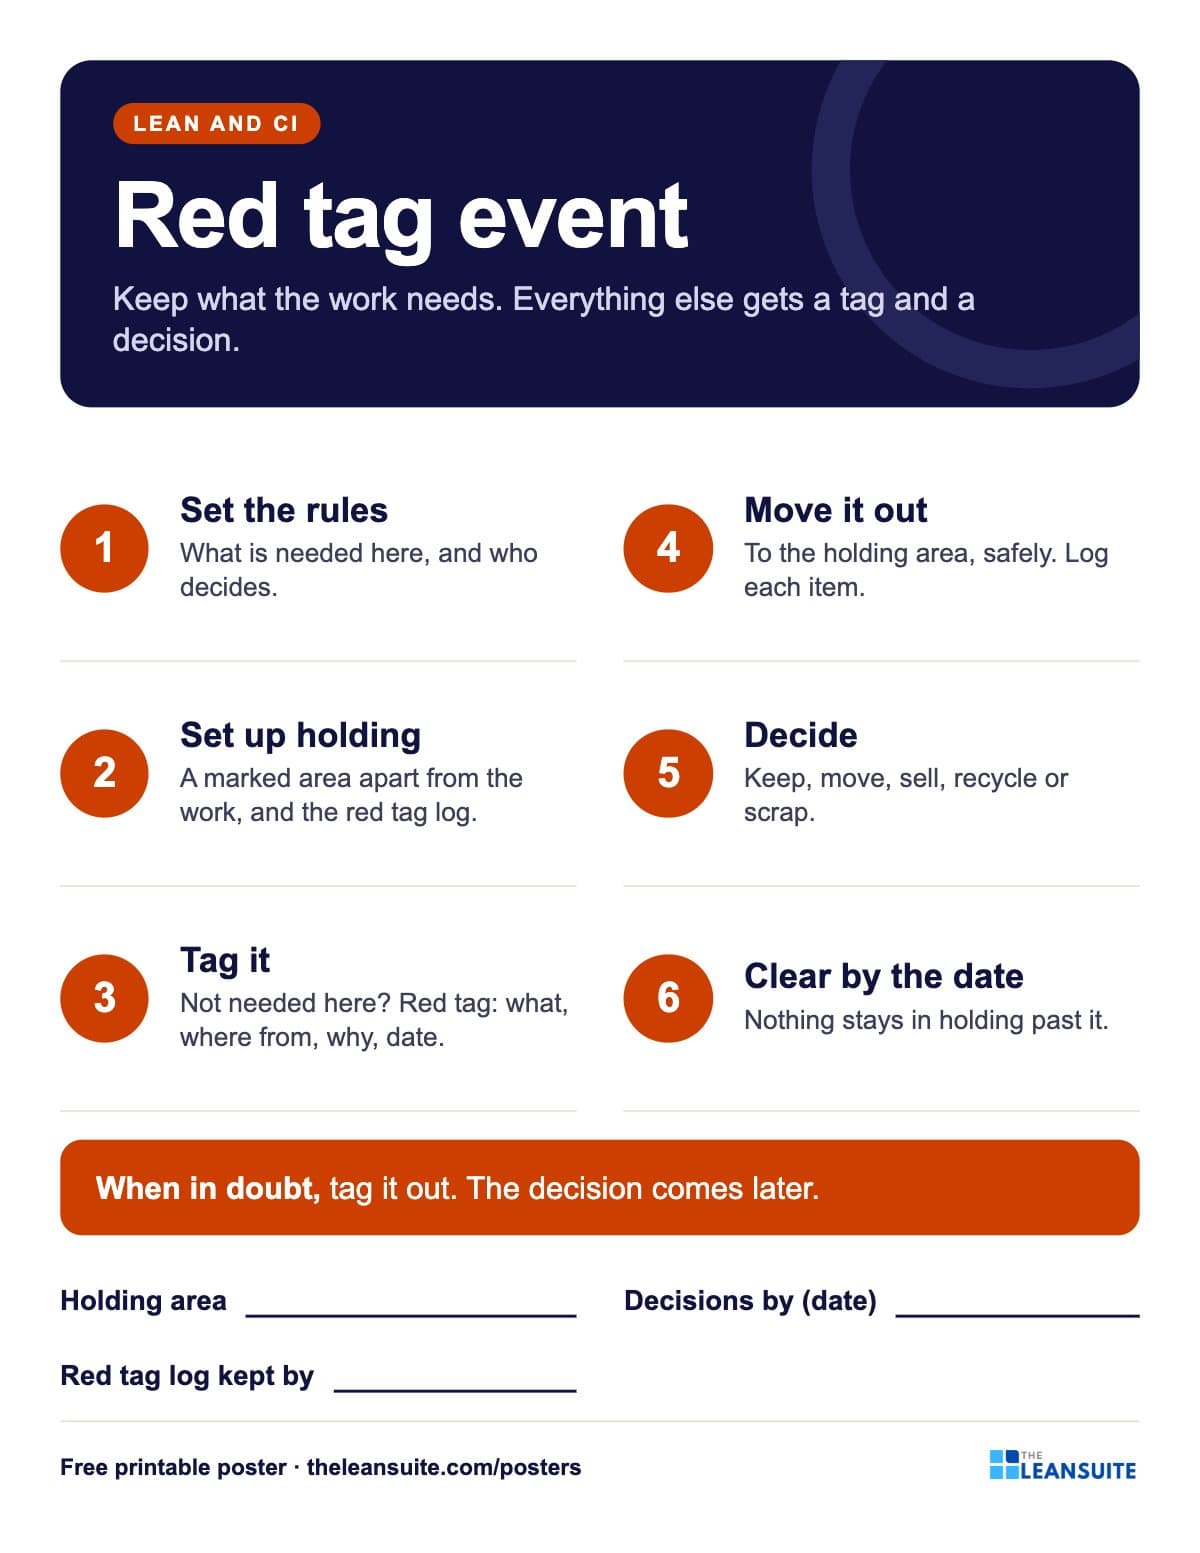 Red tag event poster
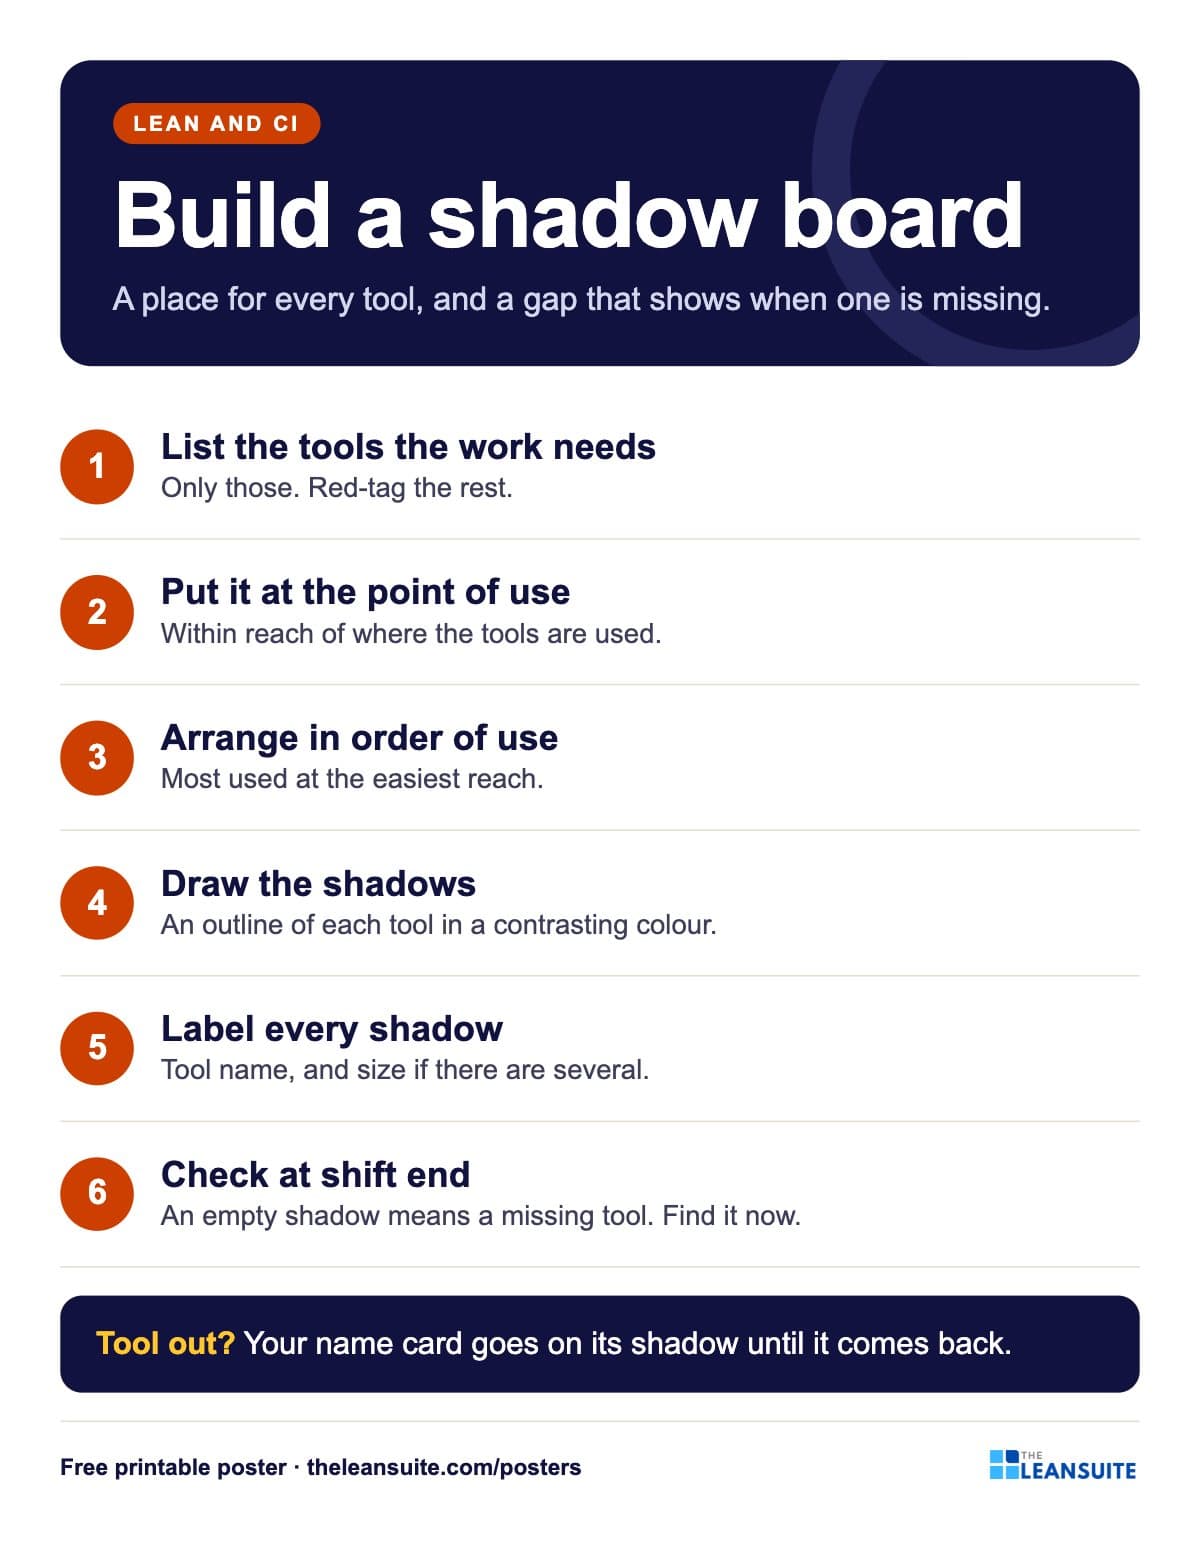 Shadow board poster
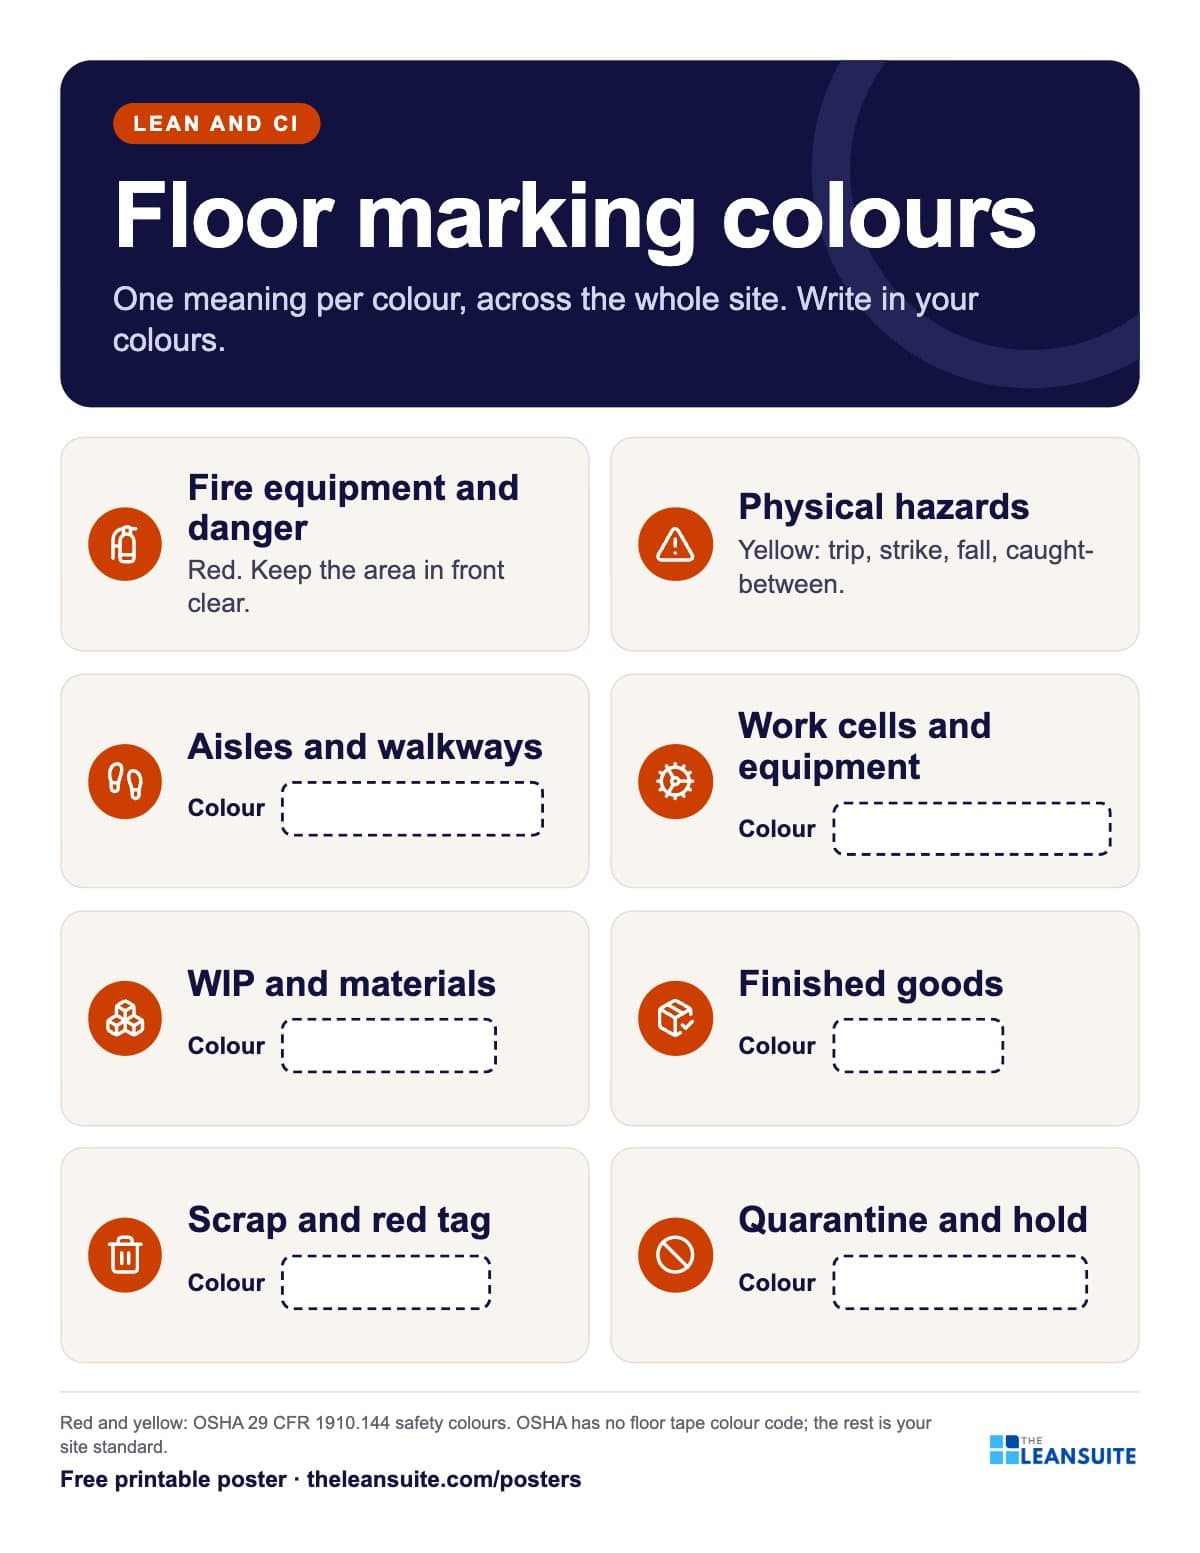 Floor marking colours poster
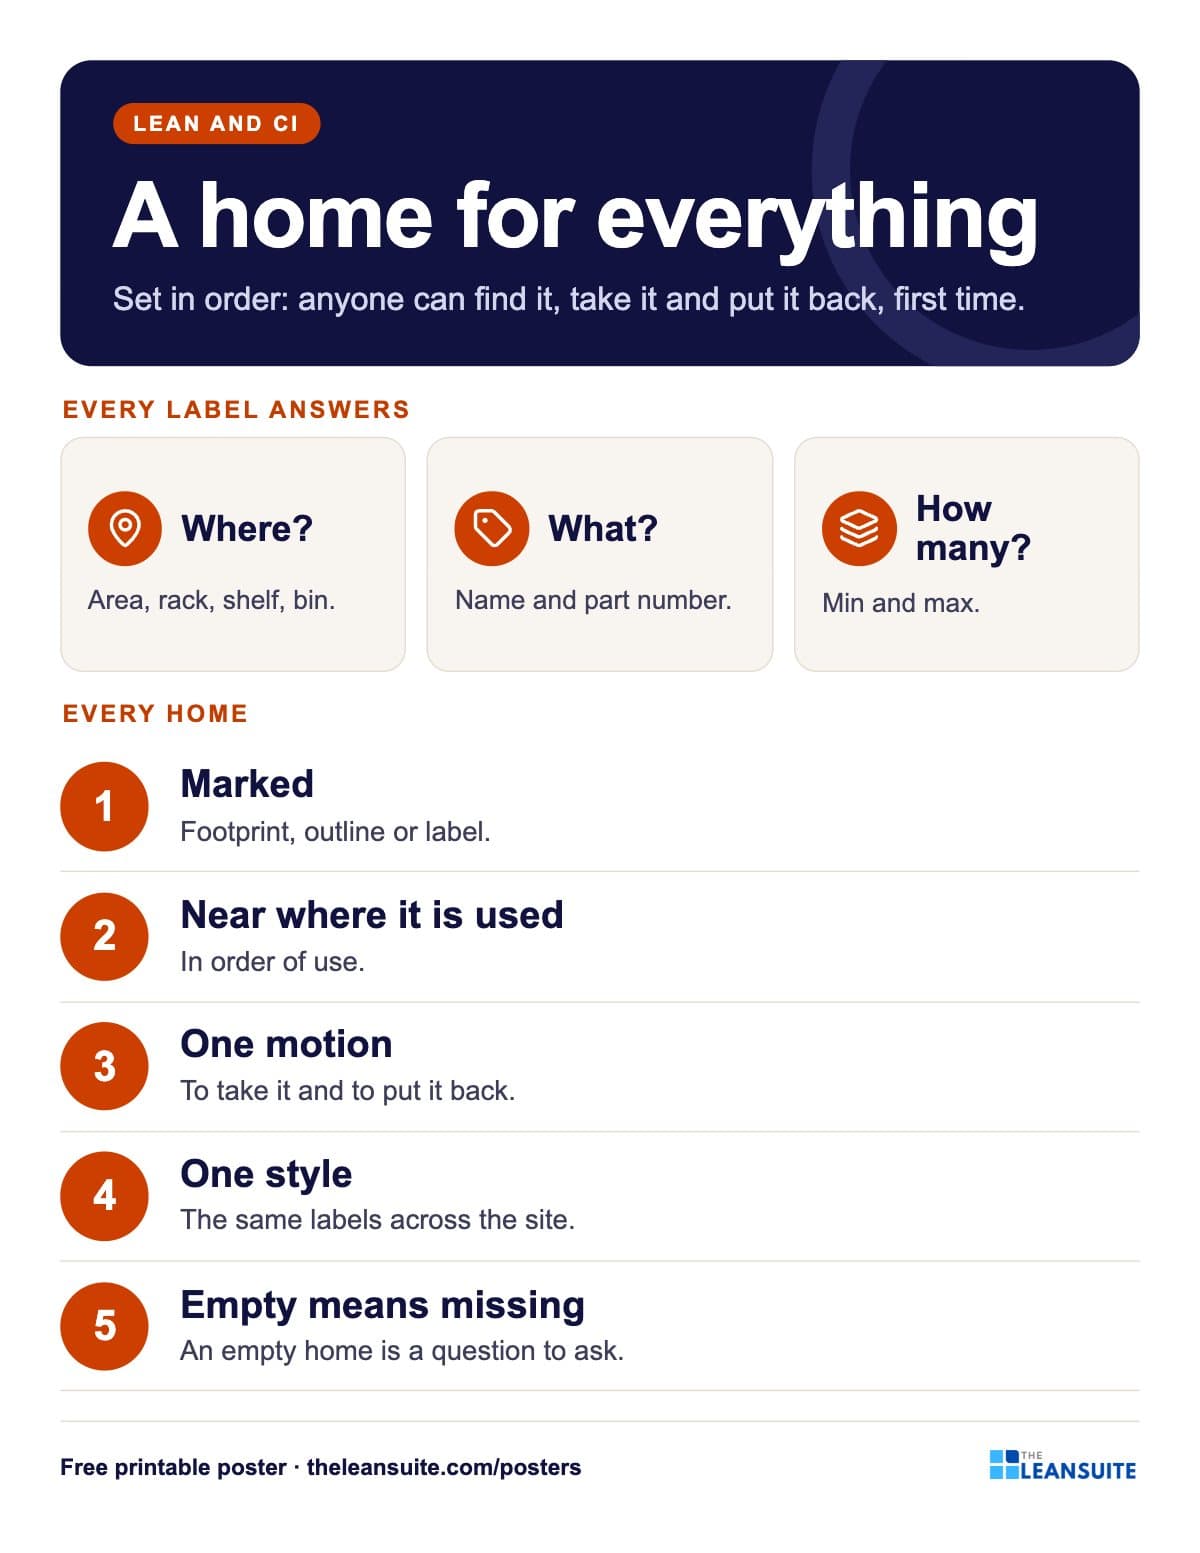 Set in order poster: where, what, how many
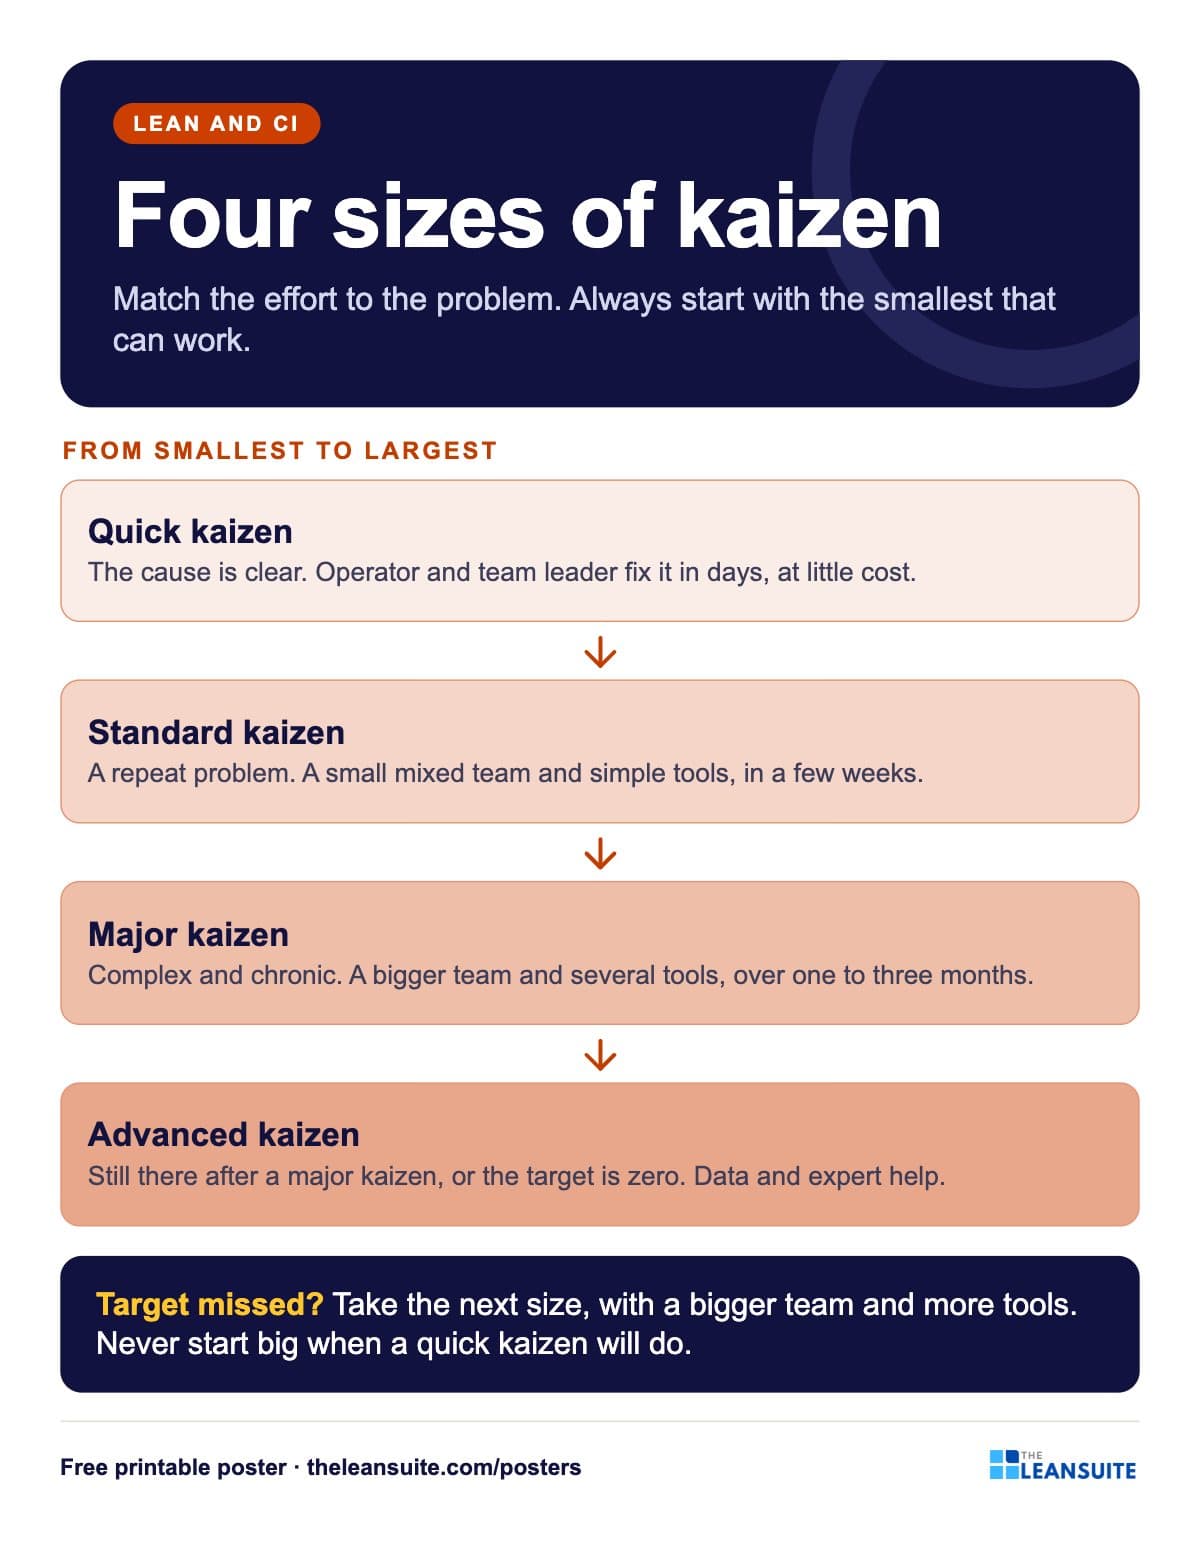 Kaizen sizes poster
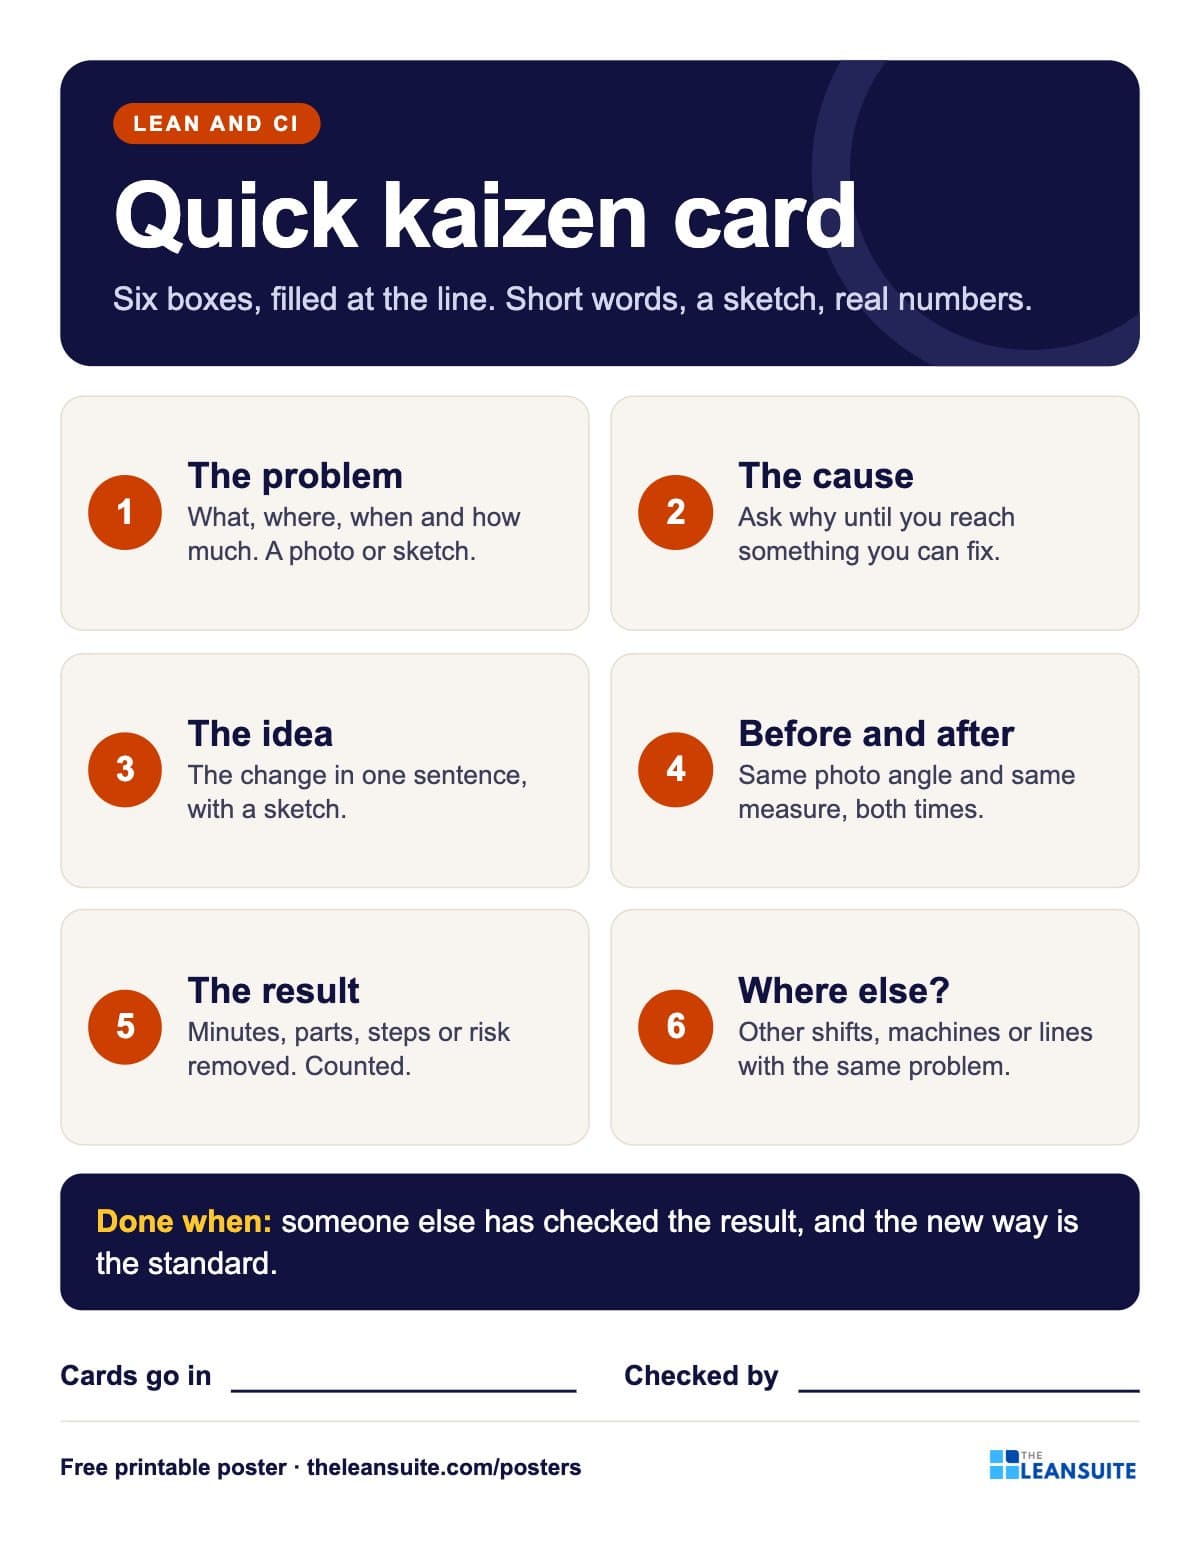 Quick kaizen card poster
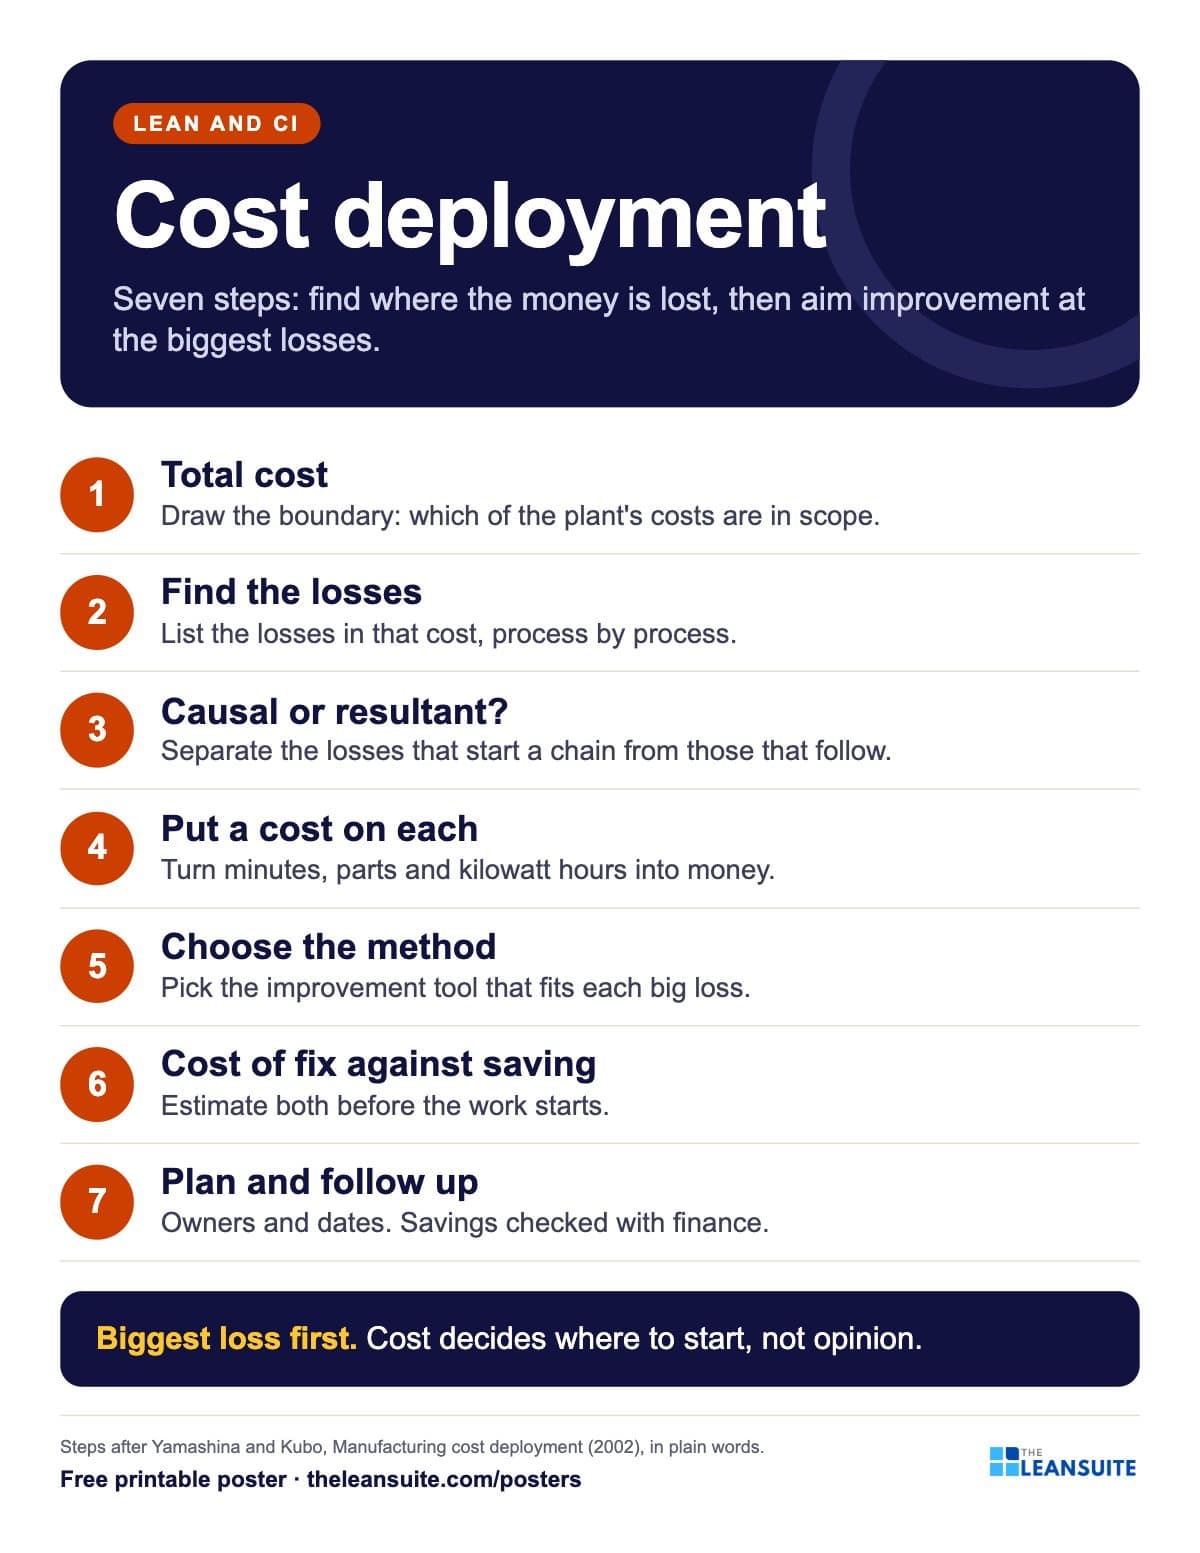 Cost deployment 7 steps poster
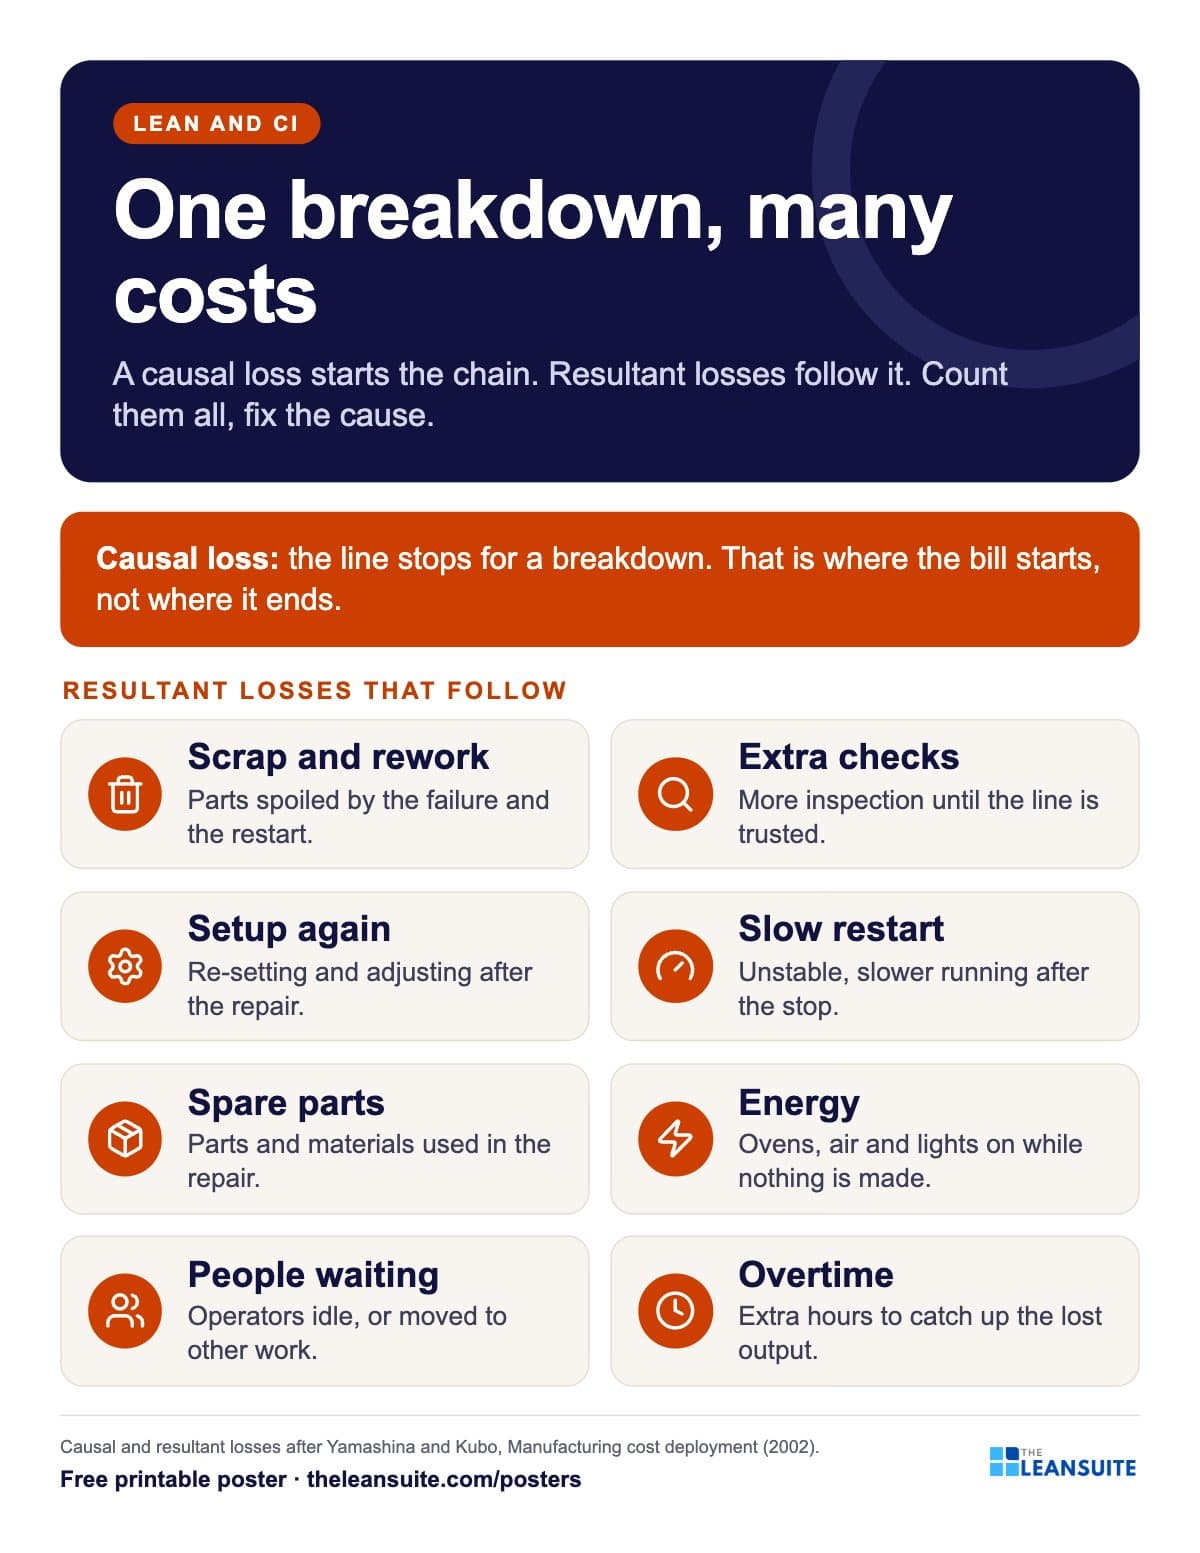 Causal and resultant losses poster
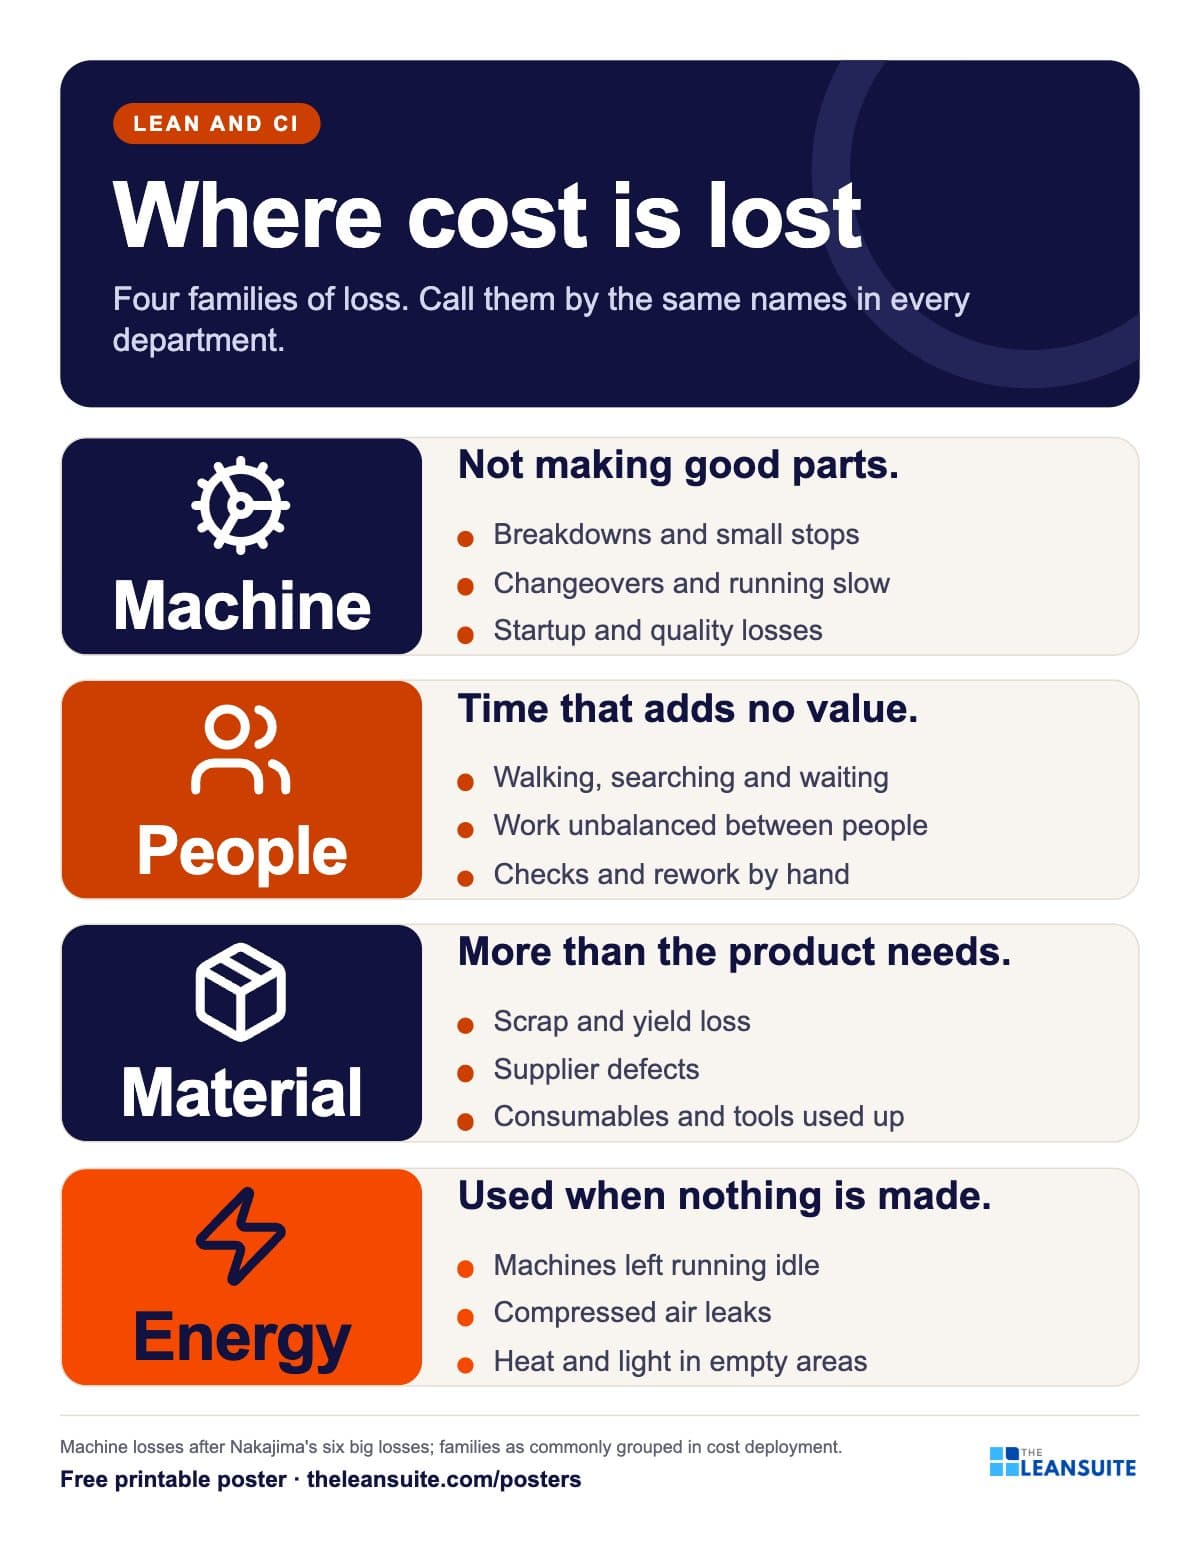 Four loss families poster
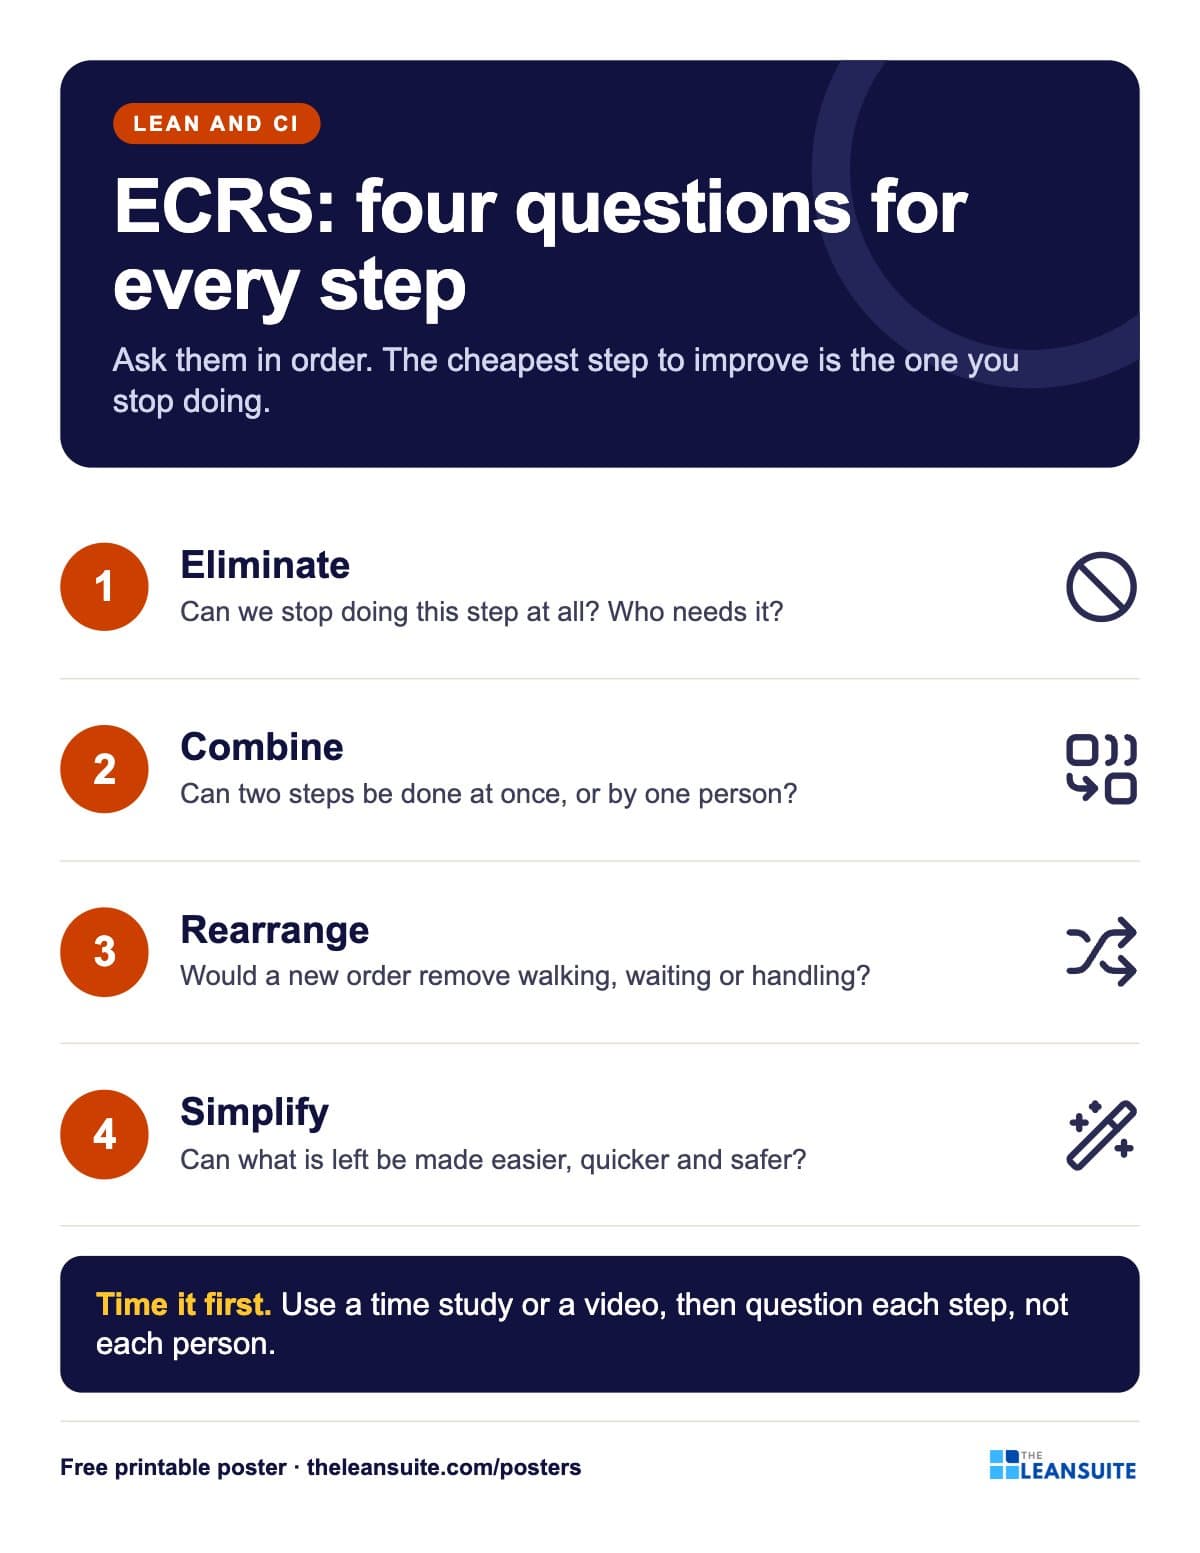 ECRS poster
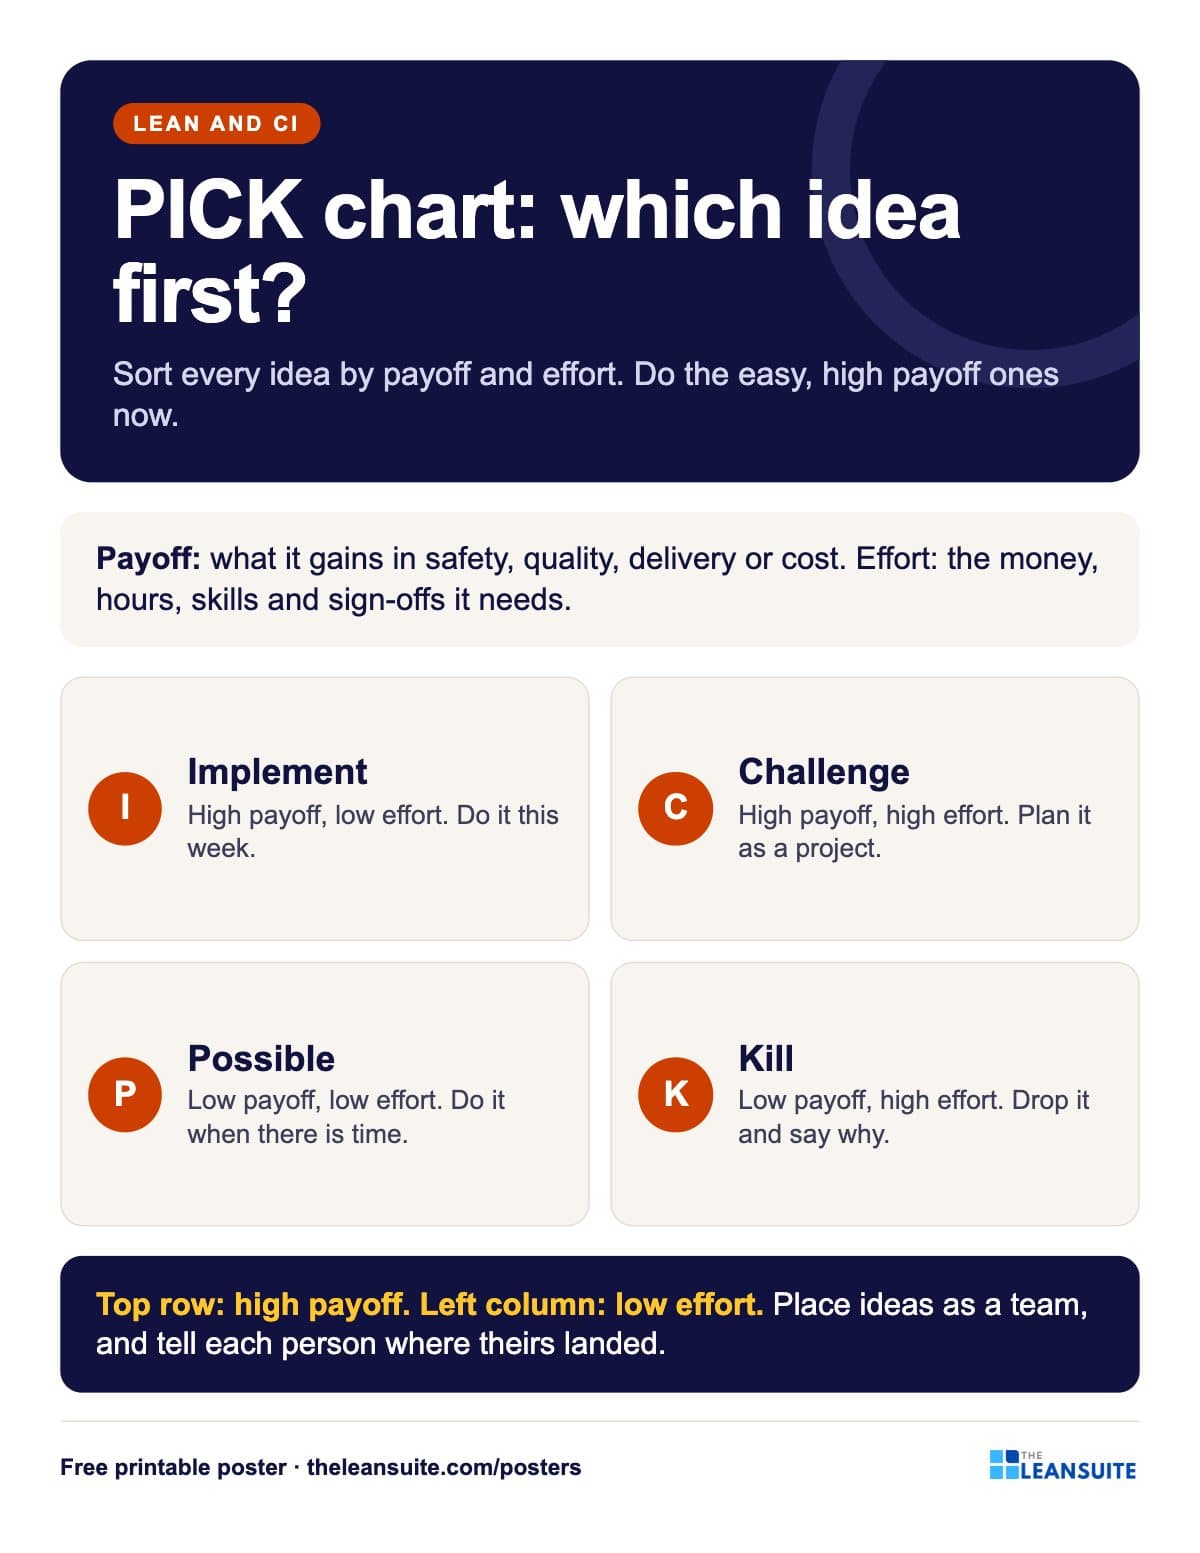 PICK chart poster
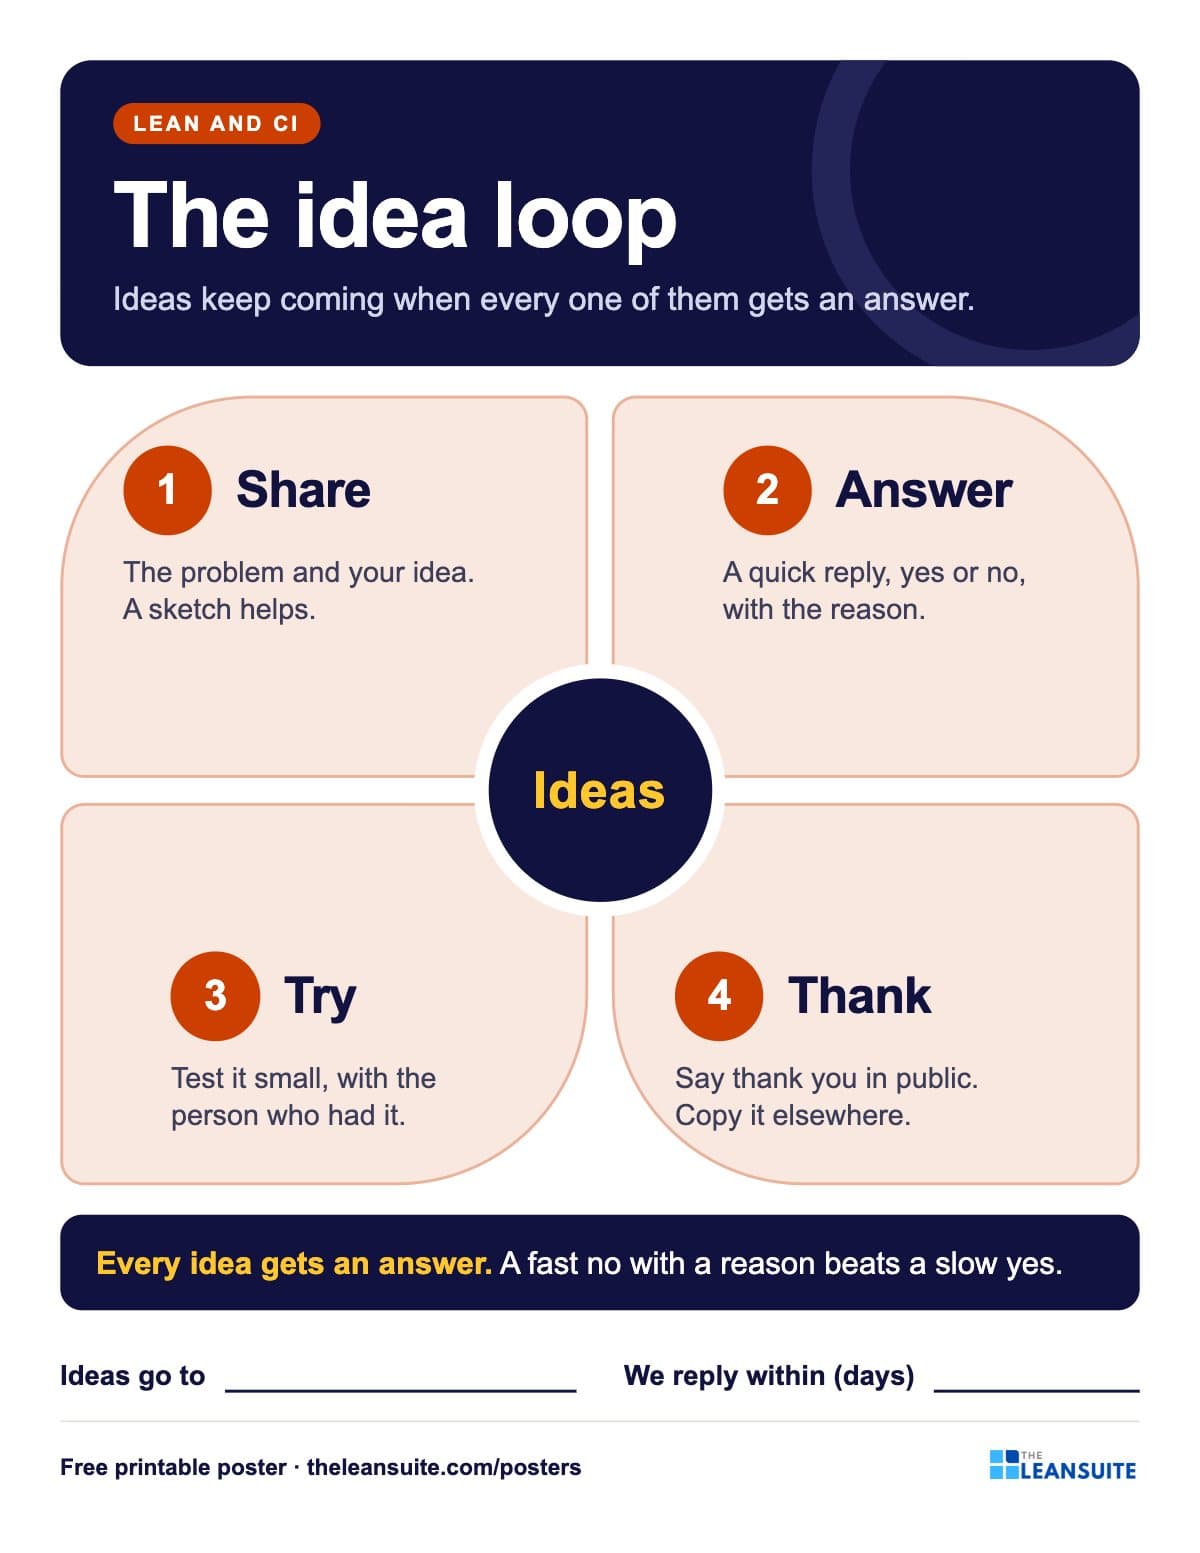 Suggestion system poster
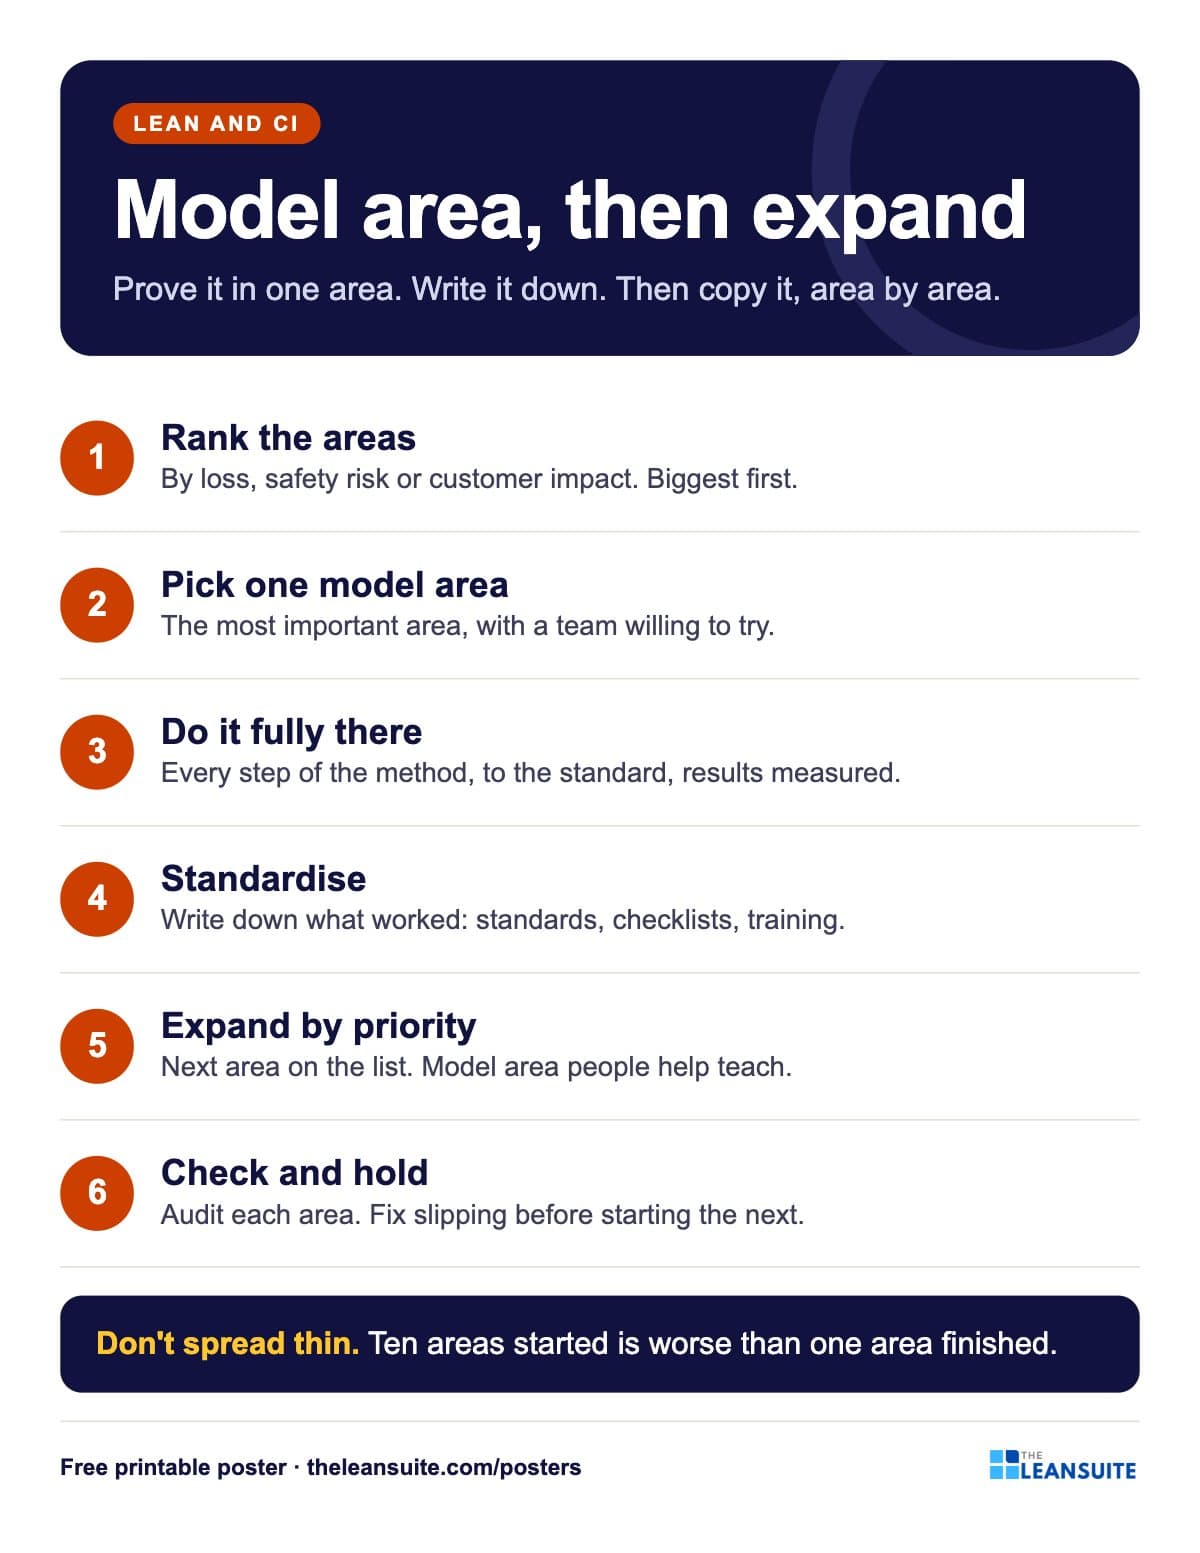 Model area and expansion poster
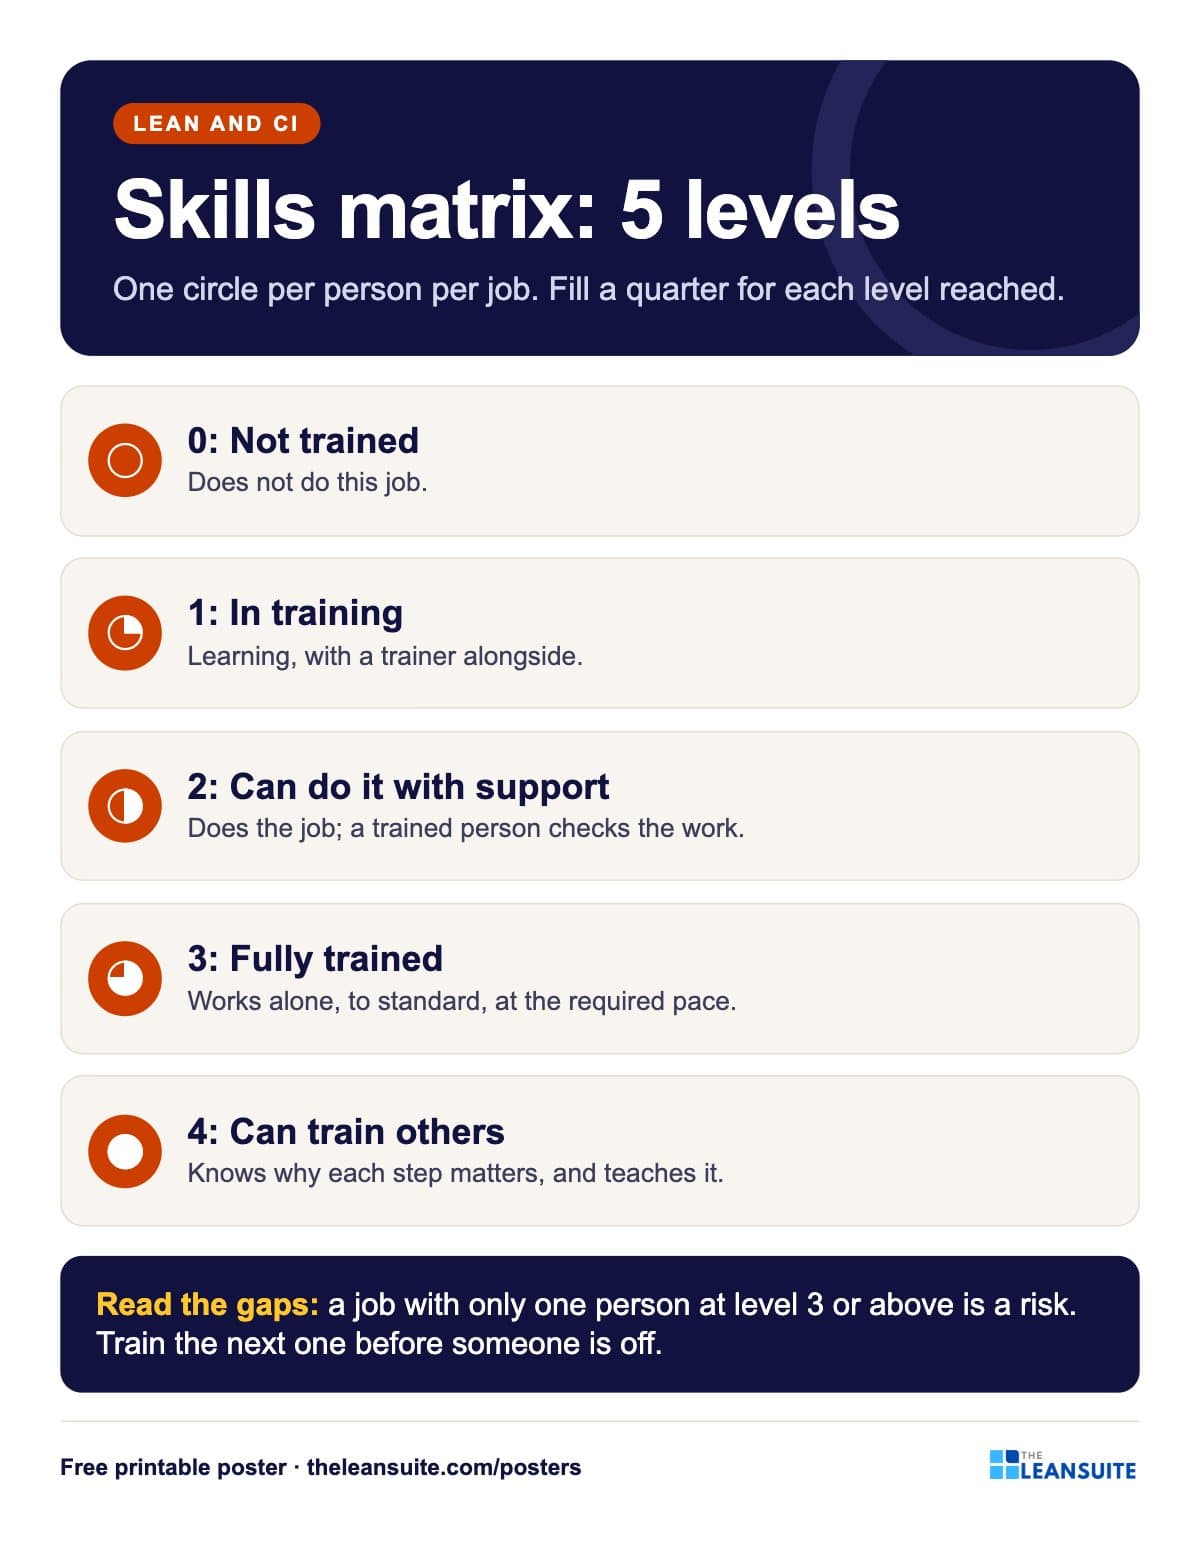 Skills matrix levels poster
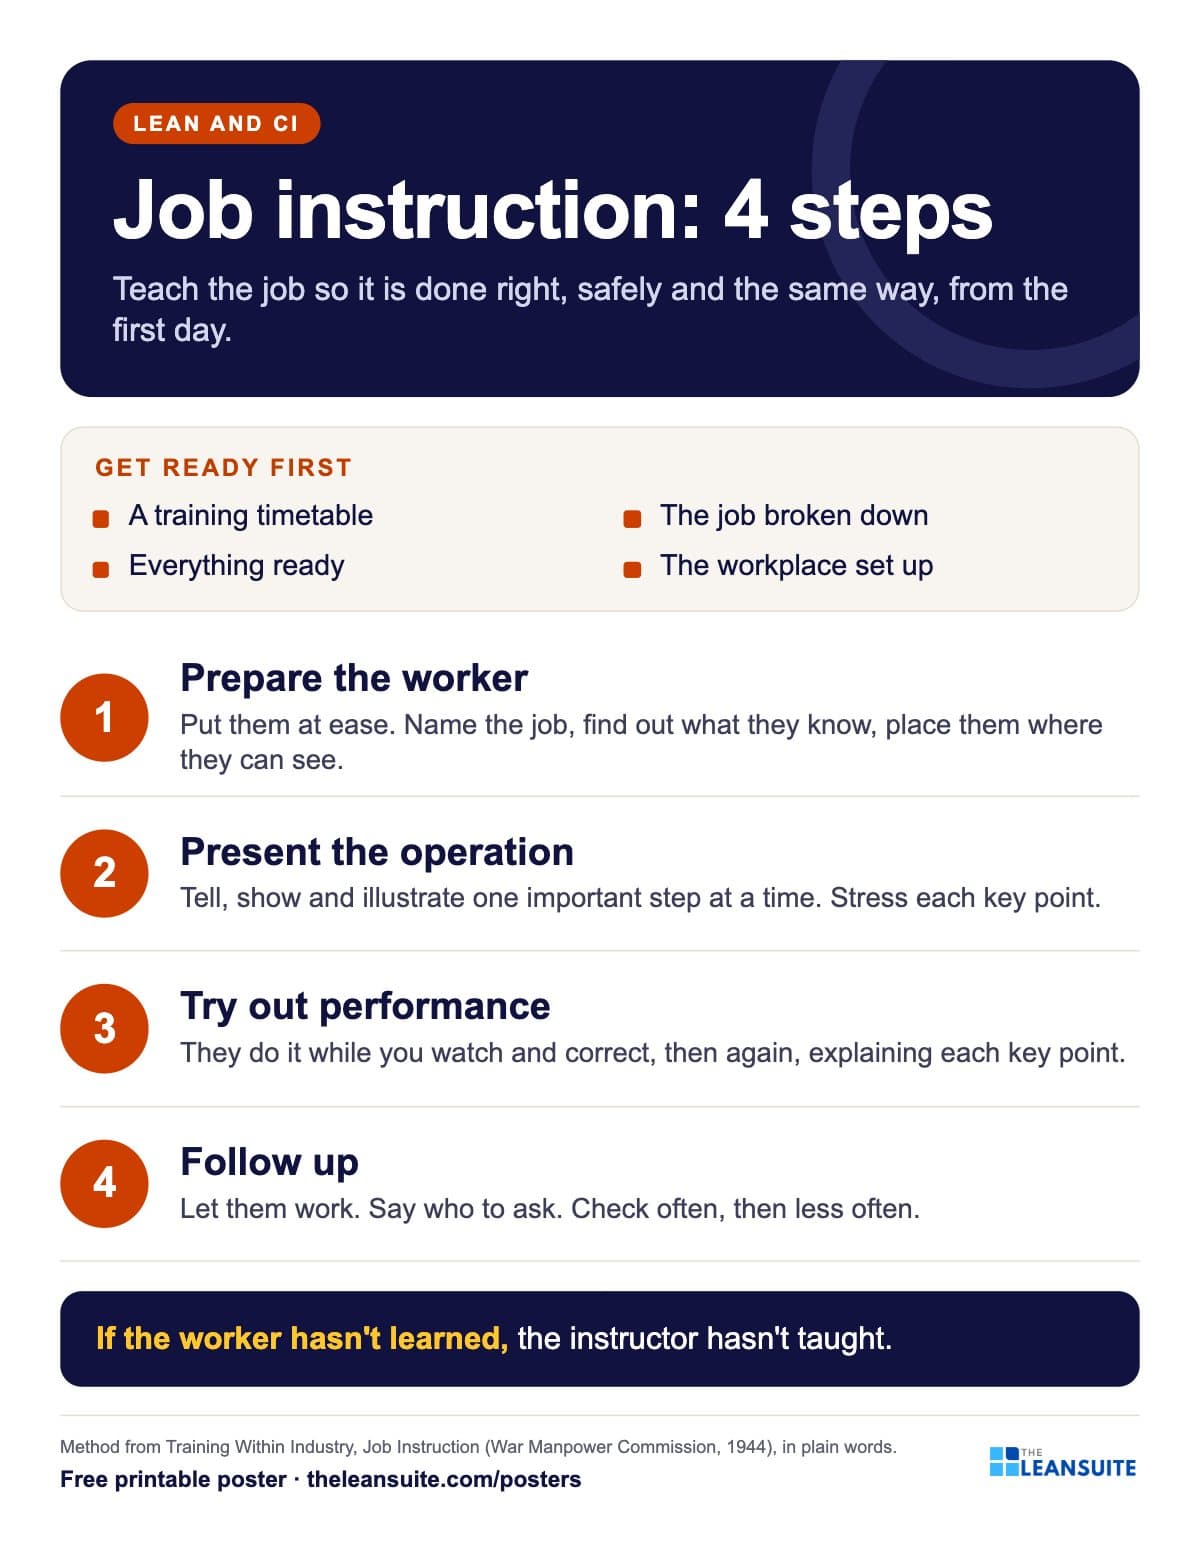 Job instruction 4 steps poster
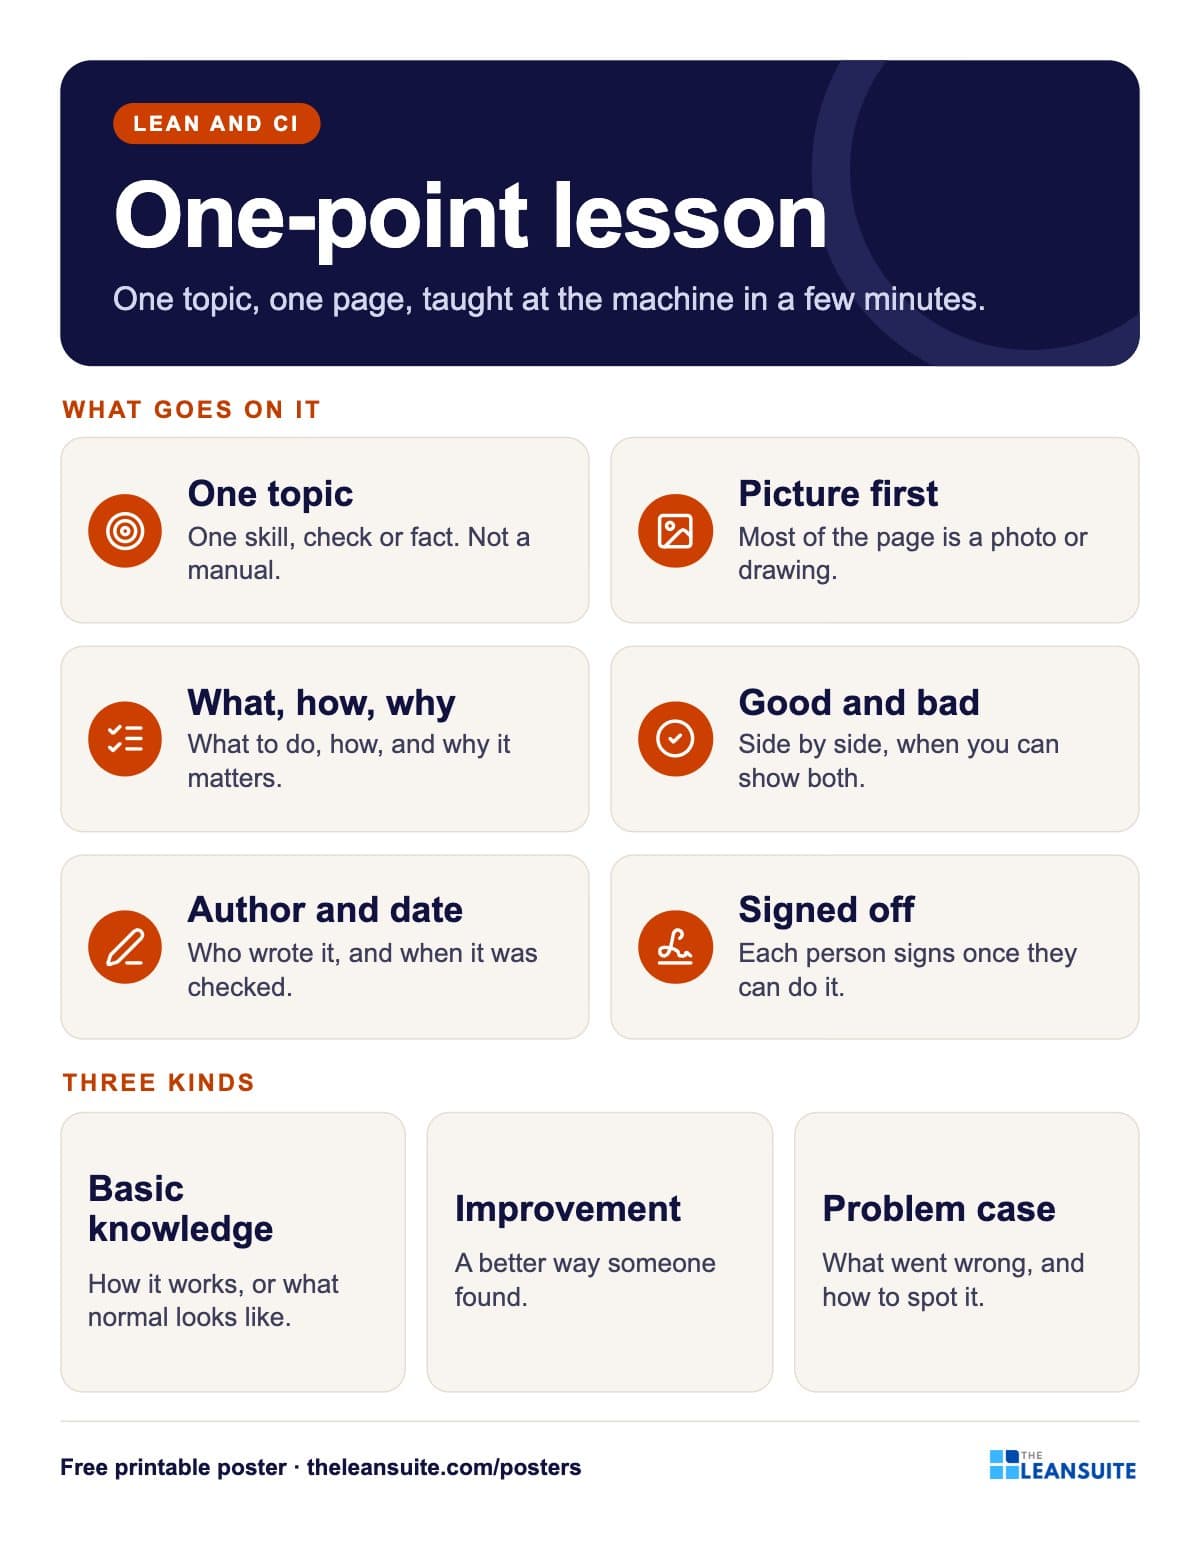 One-point lesson poster
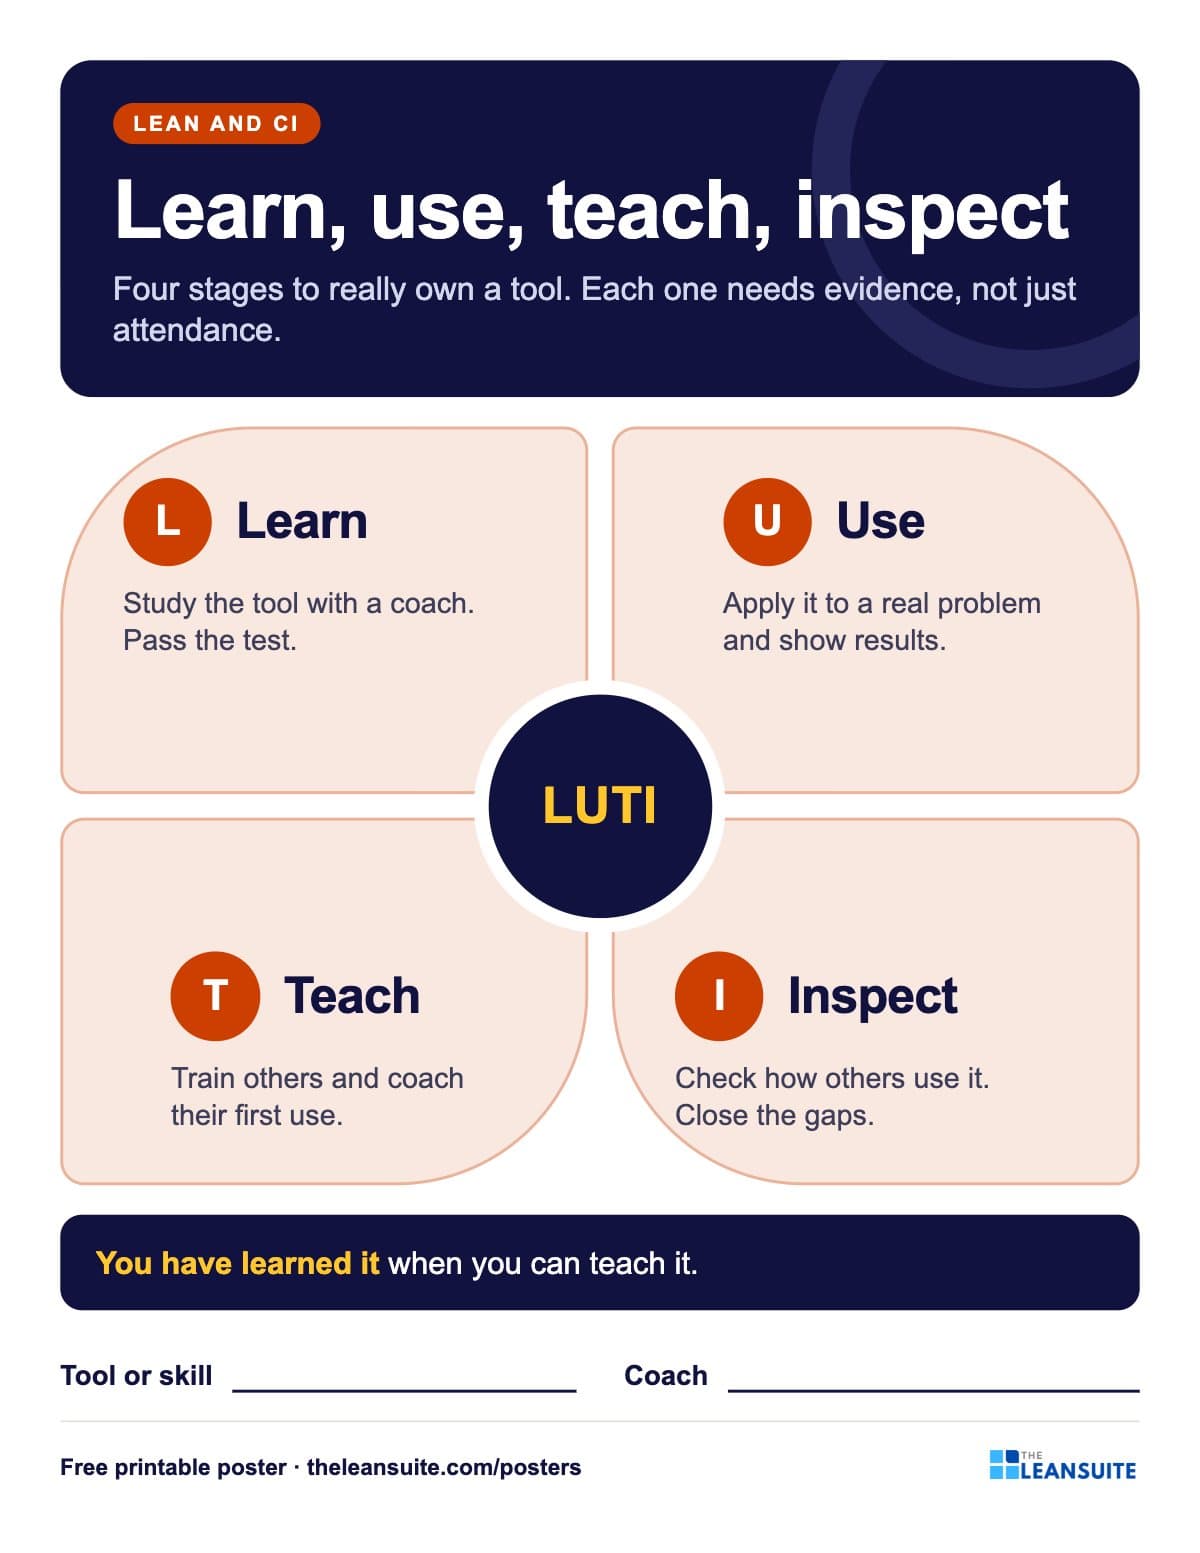 Learn, use, teach, inspect poster
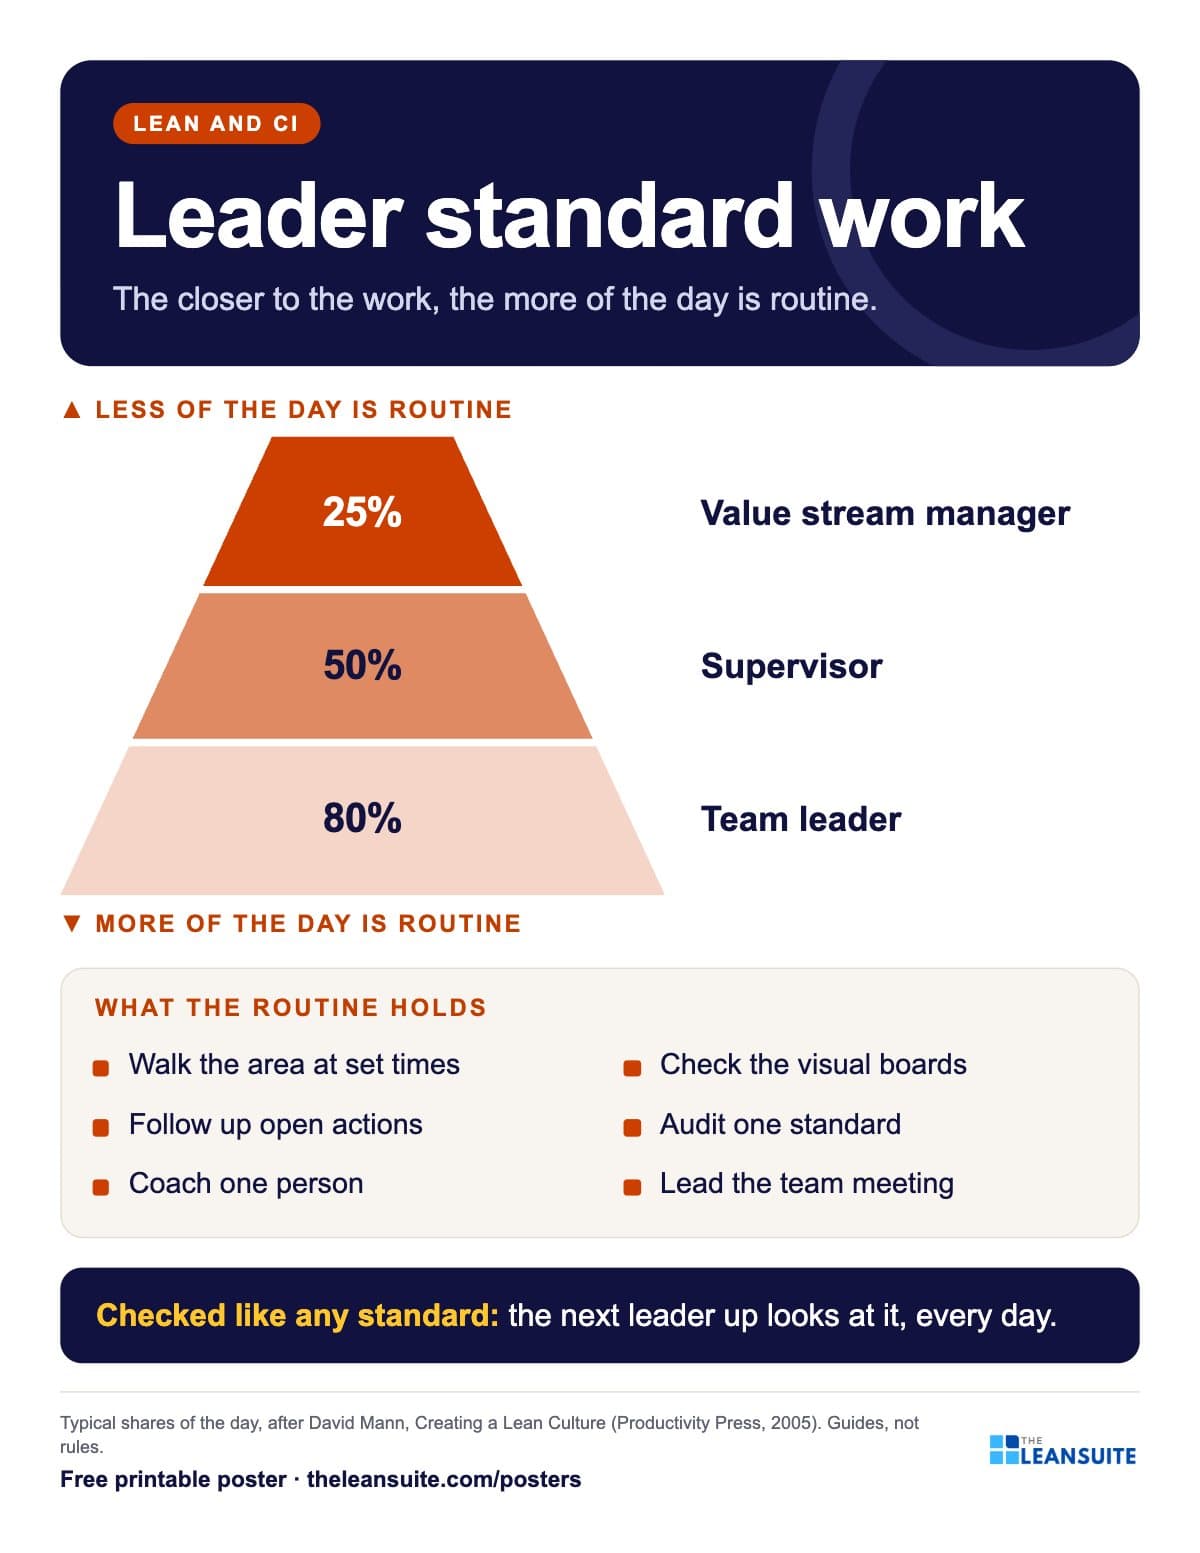 Leader standard work poster
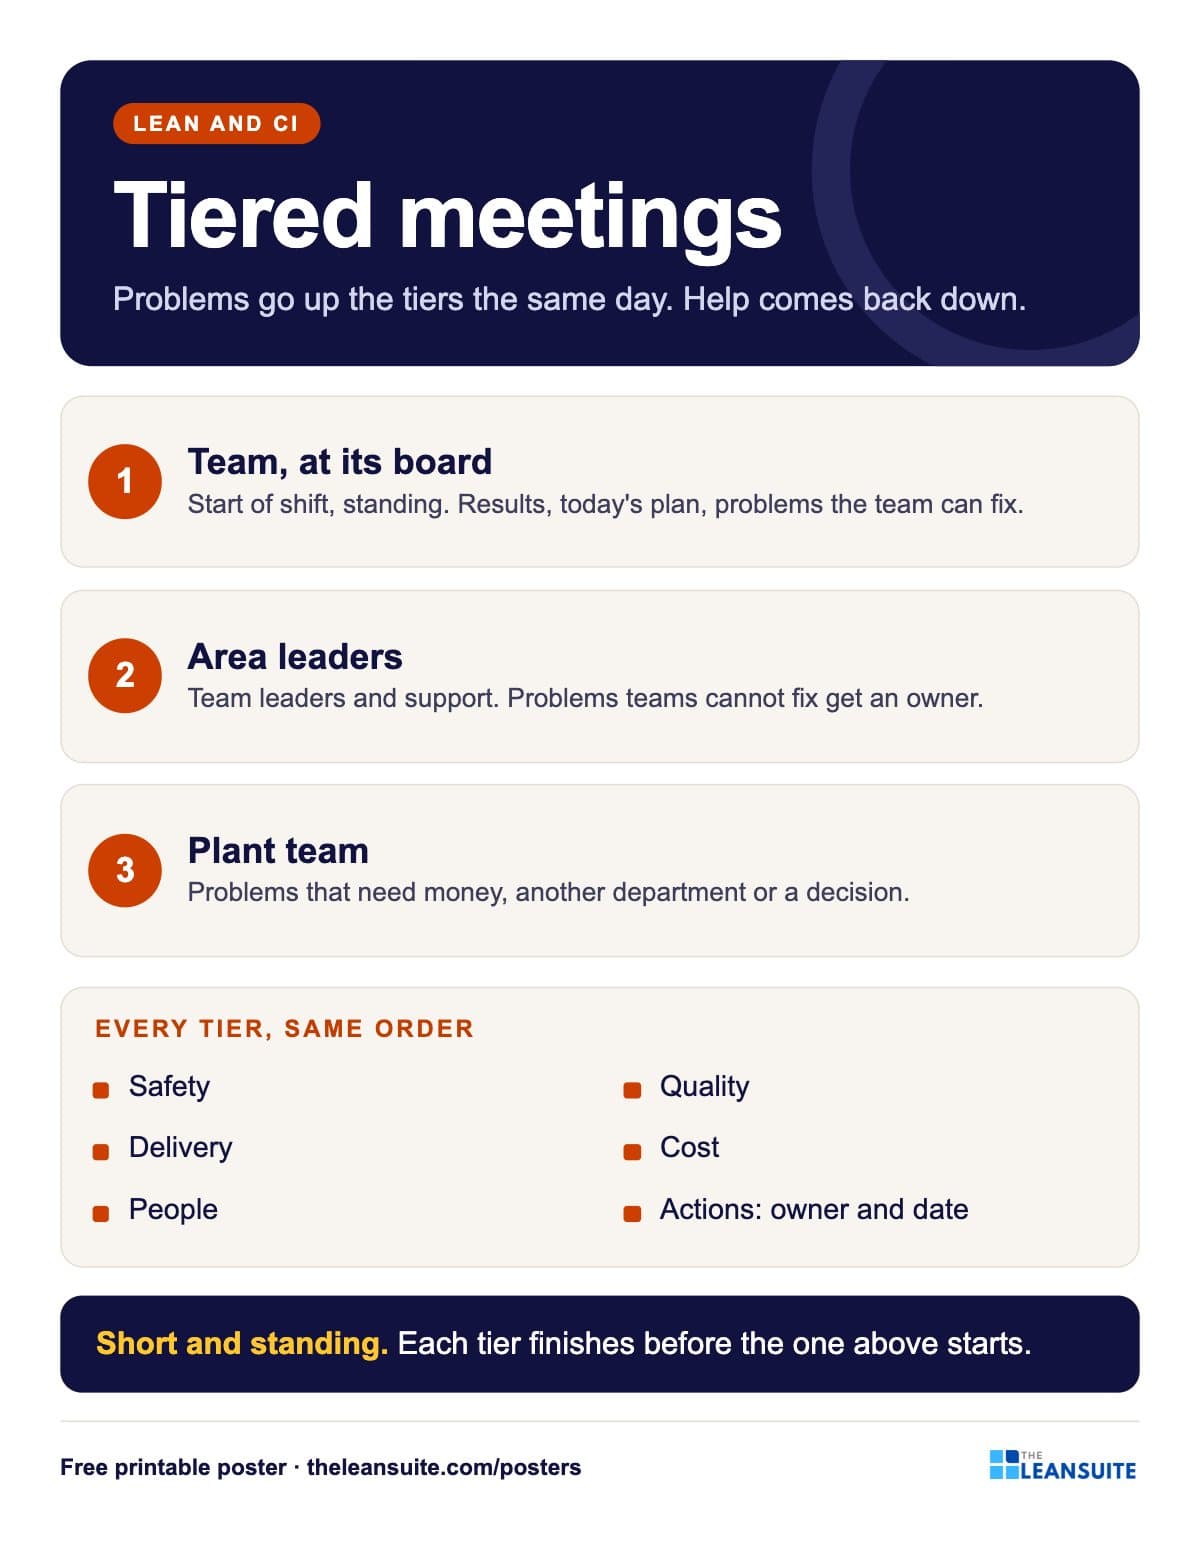 Tiered meetings poster
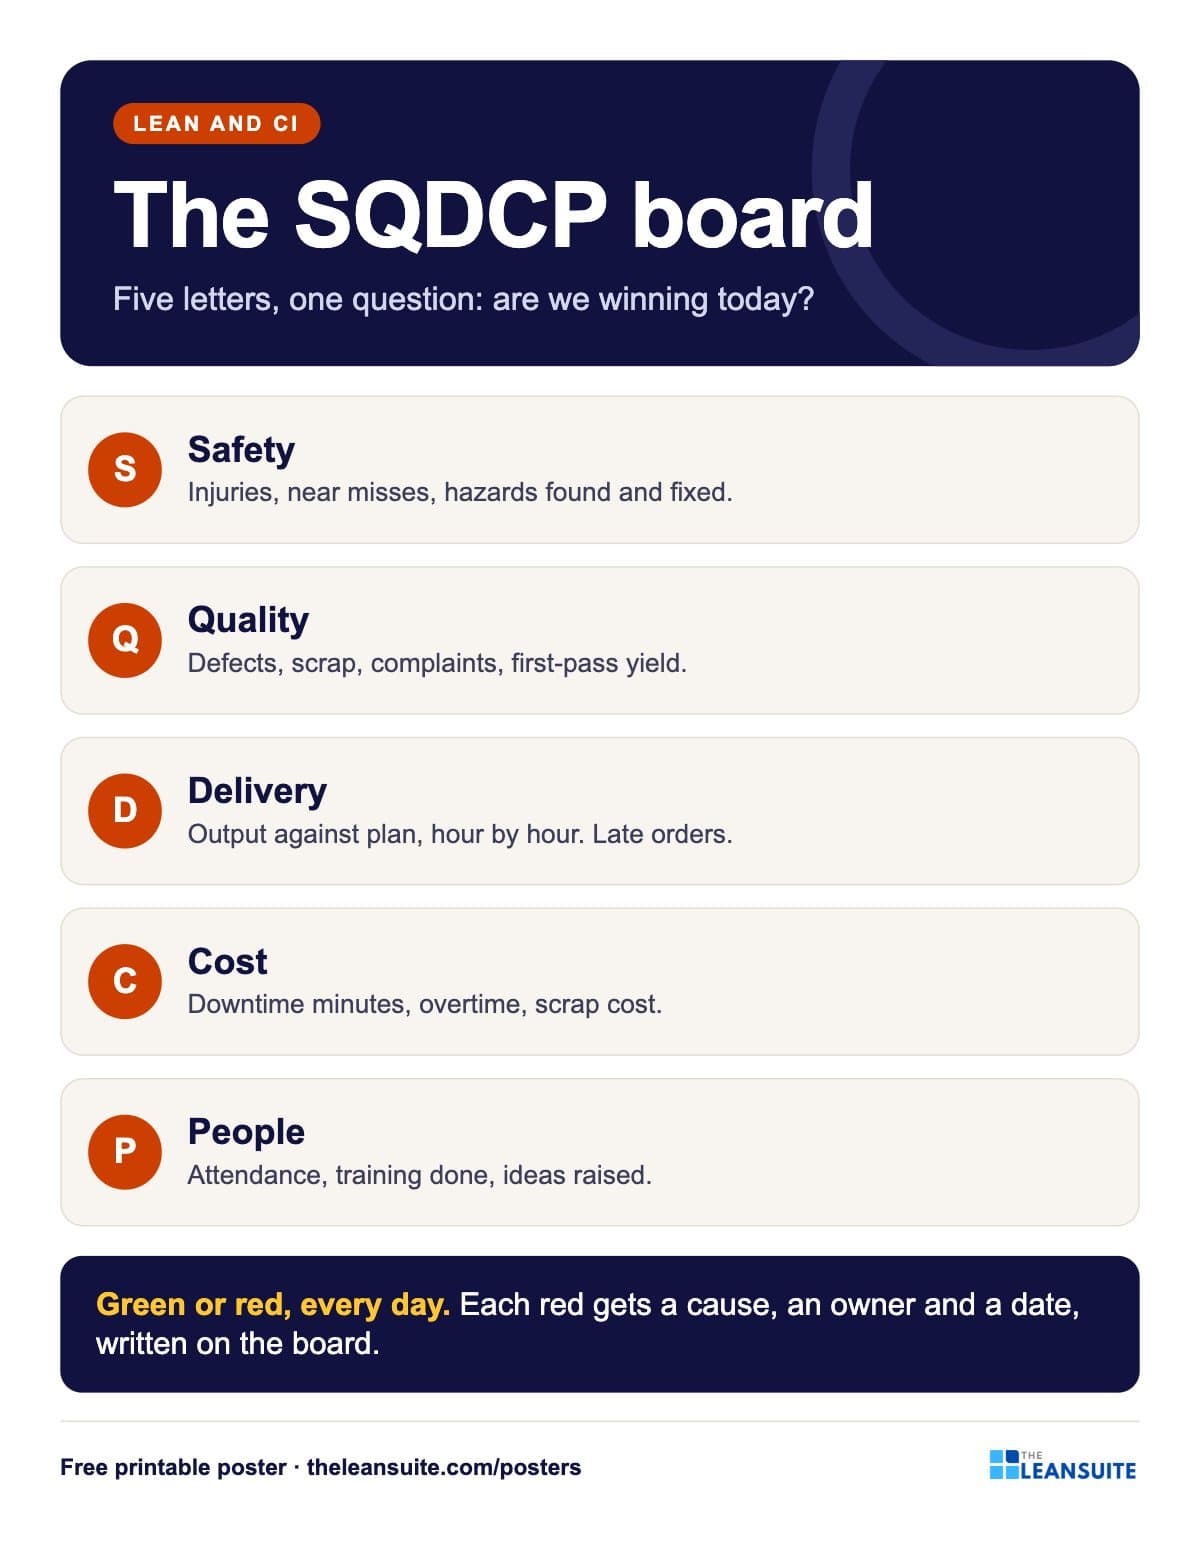 SQDCP board poster
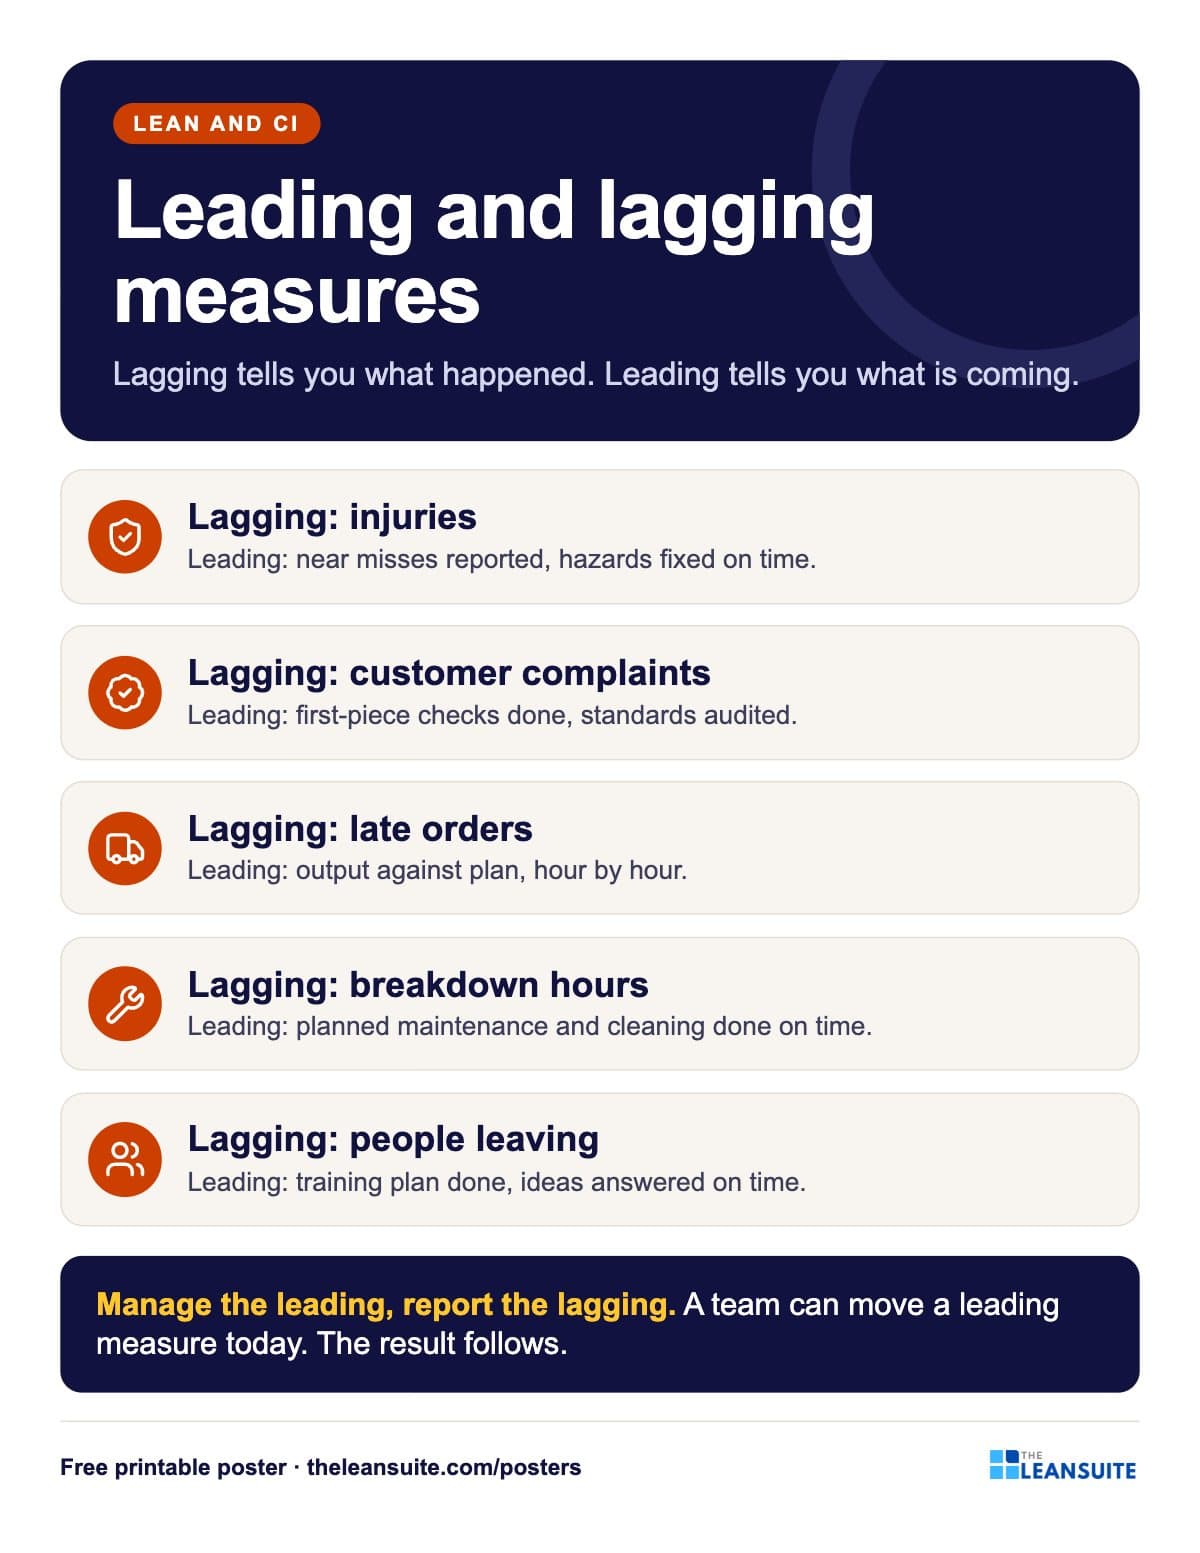 Leading and lagging indicators poster
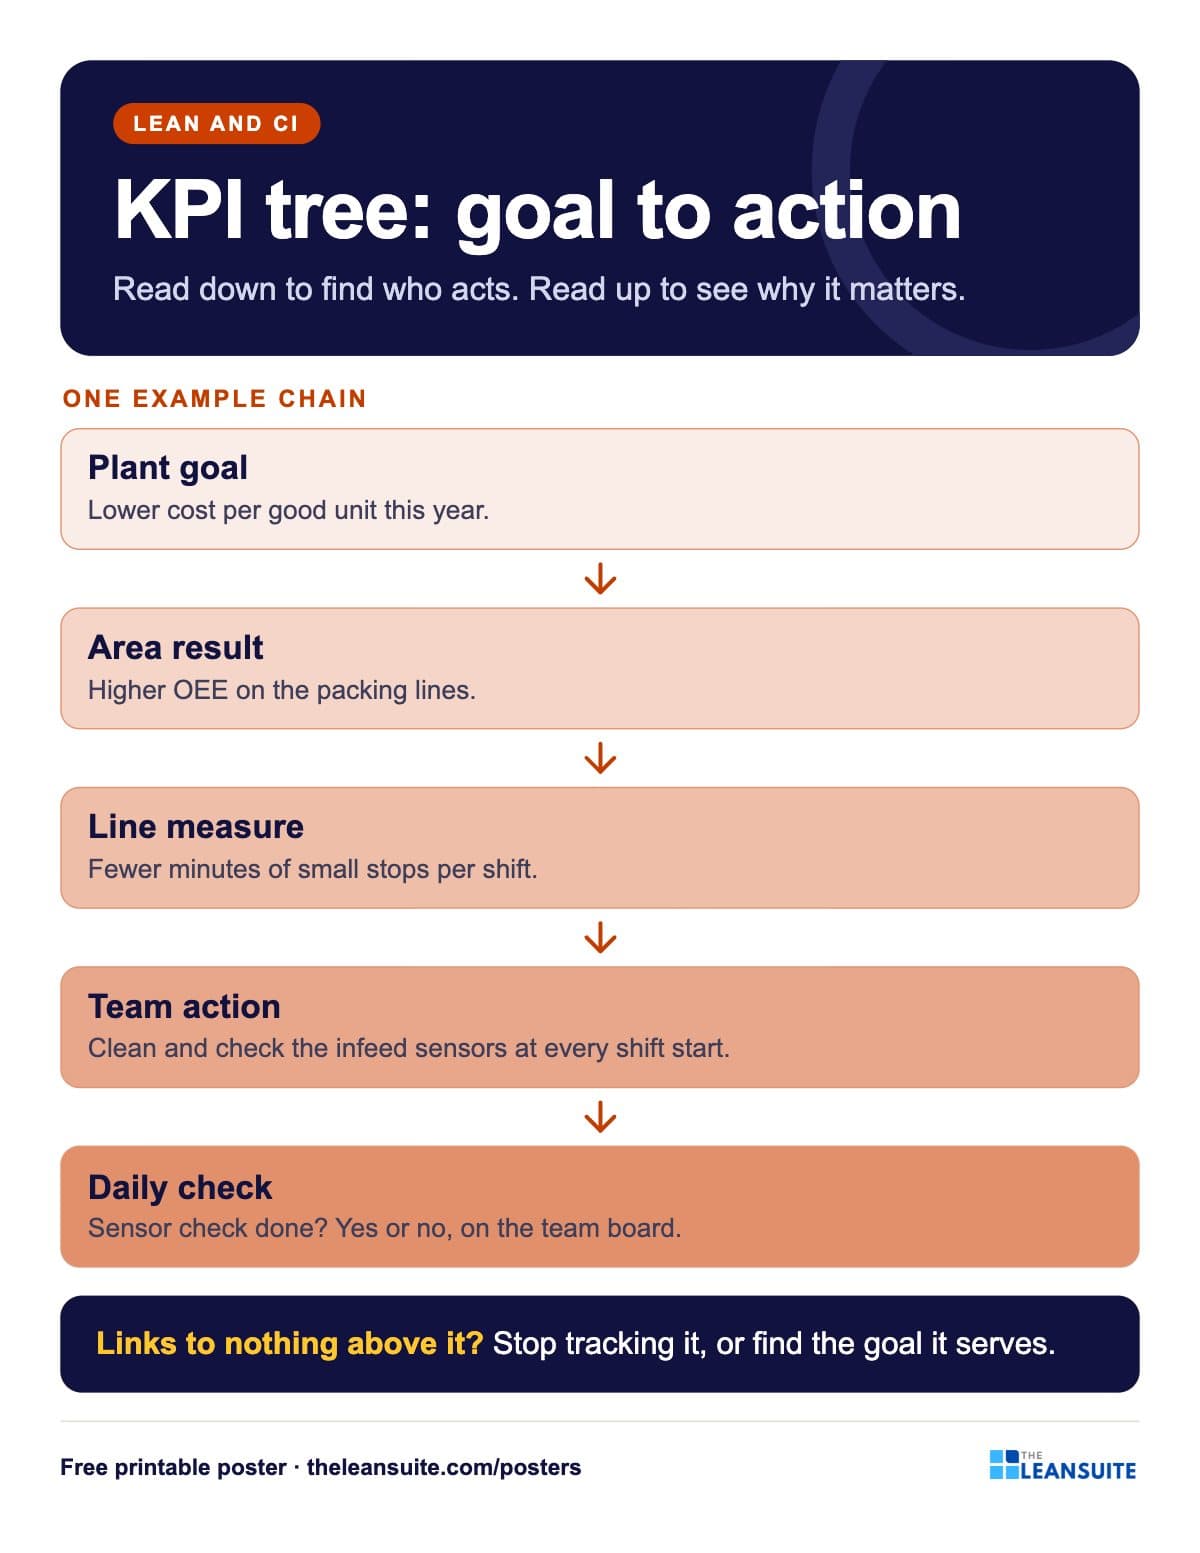 KPI tree poster
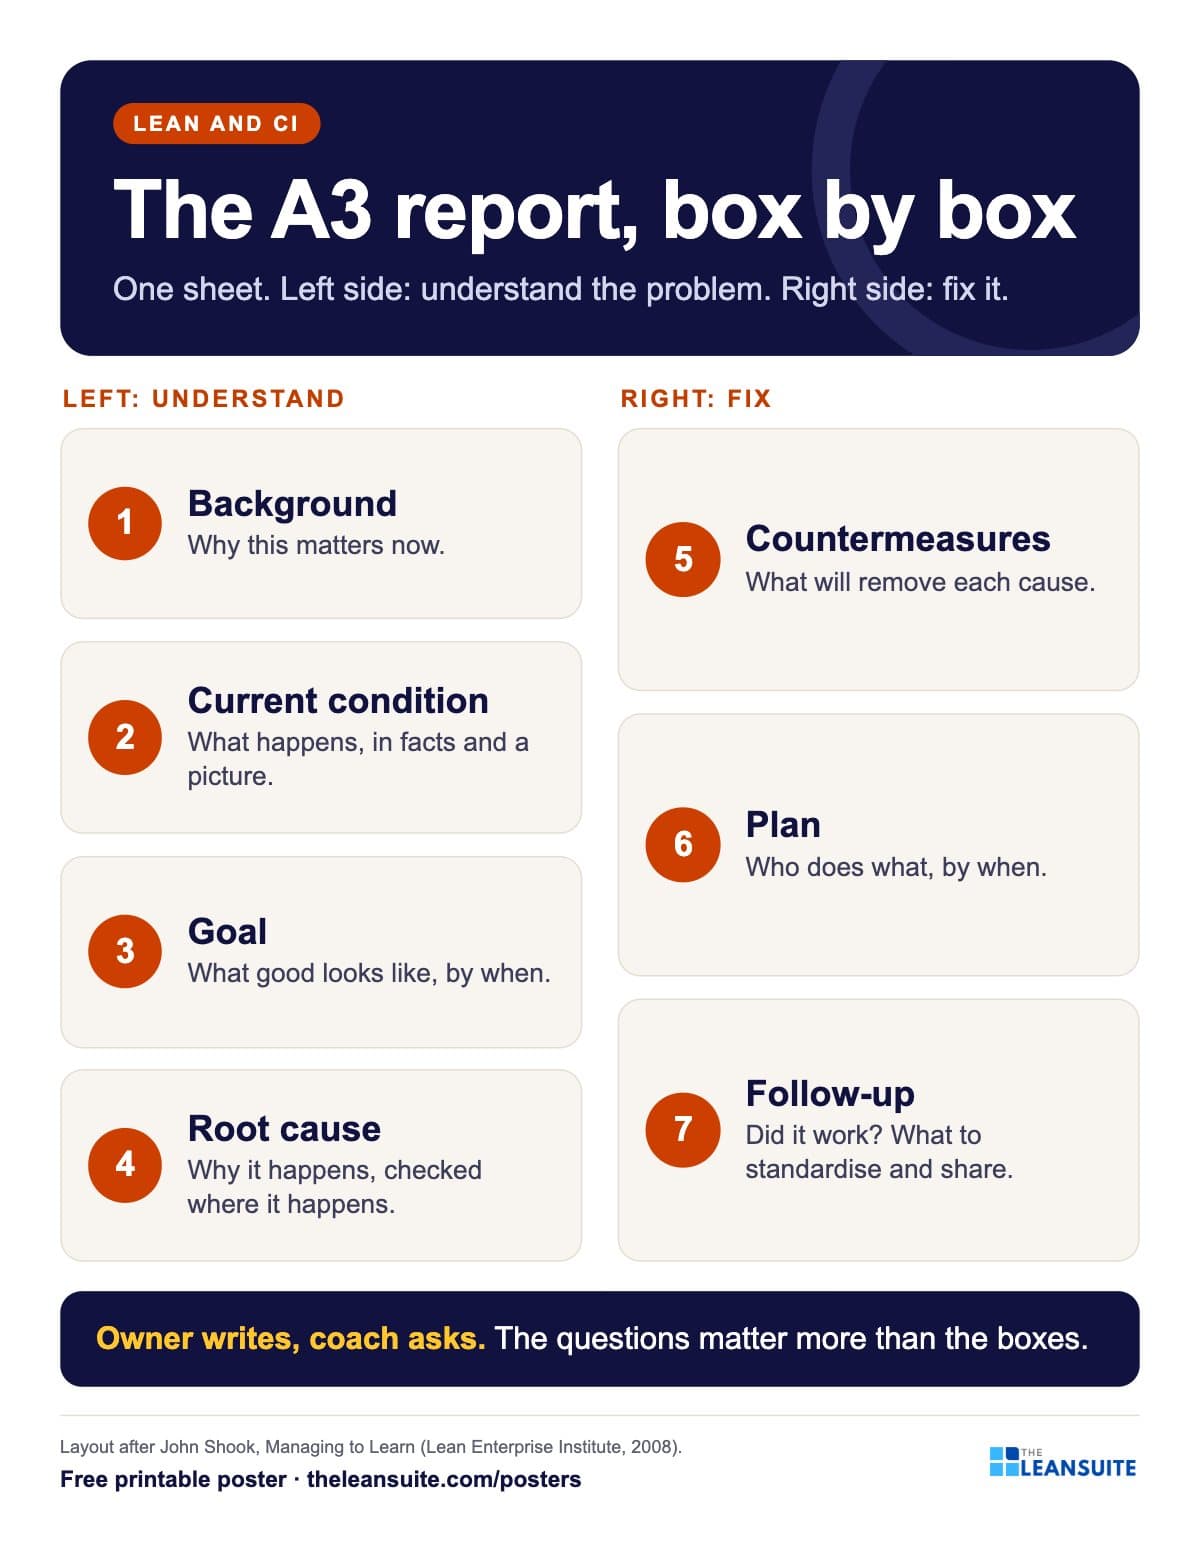 A3 report layout poster
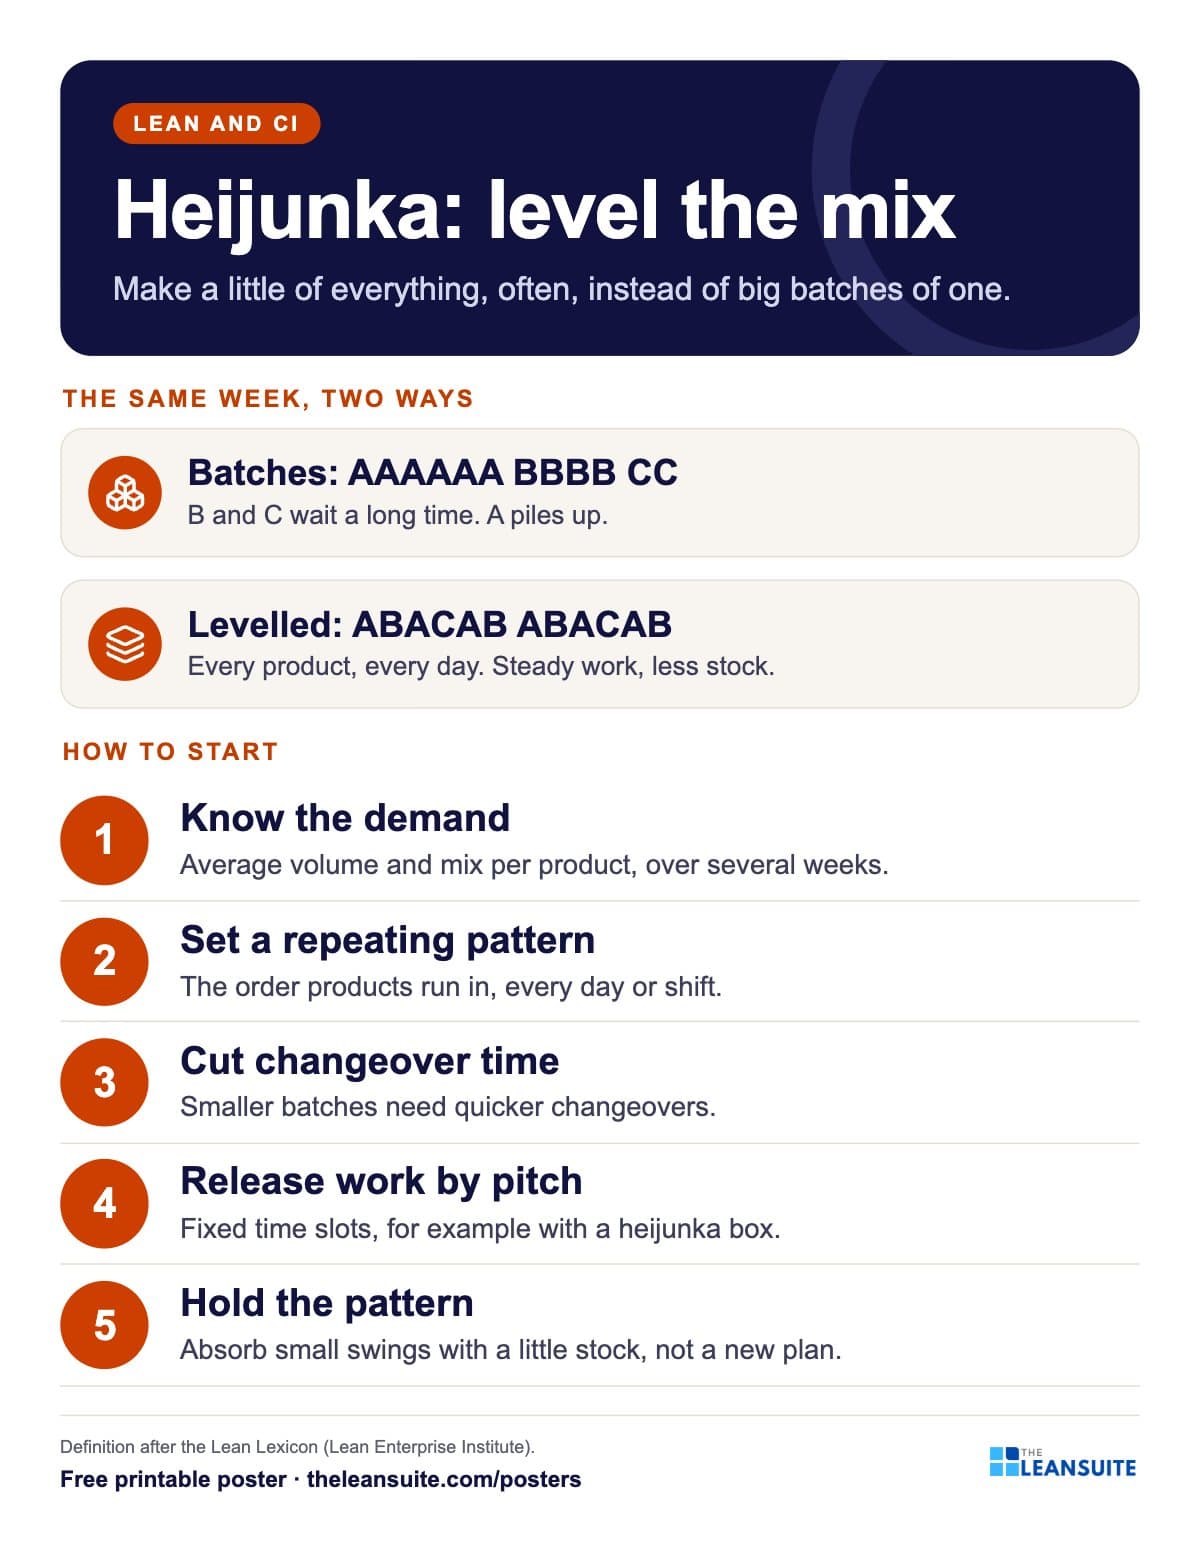 Heijunka production levelling poster
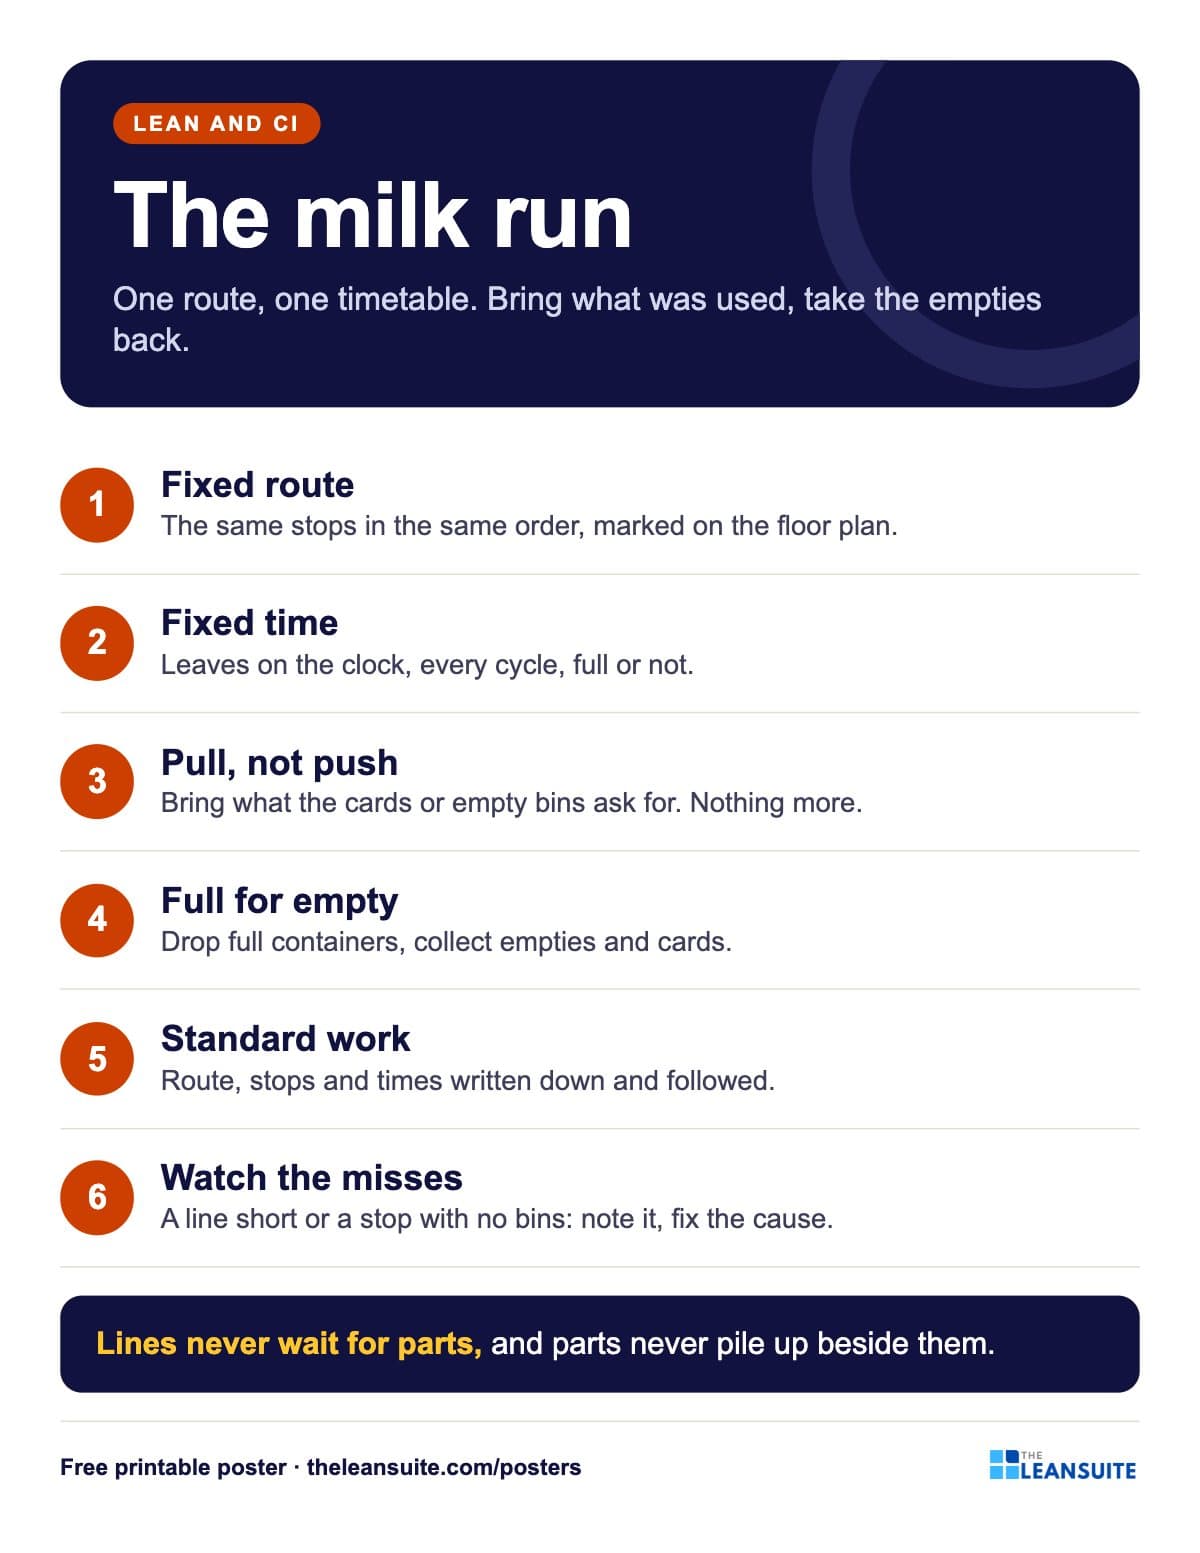 Milk run poster
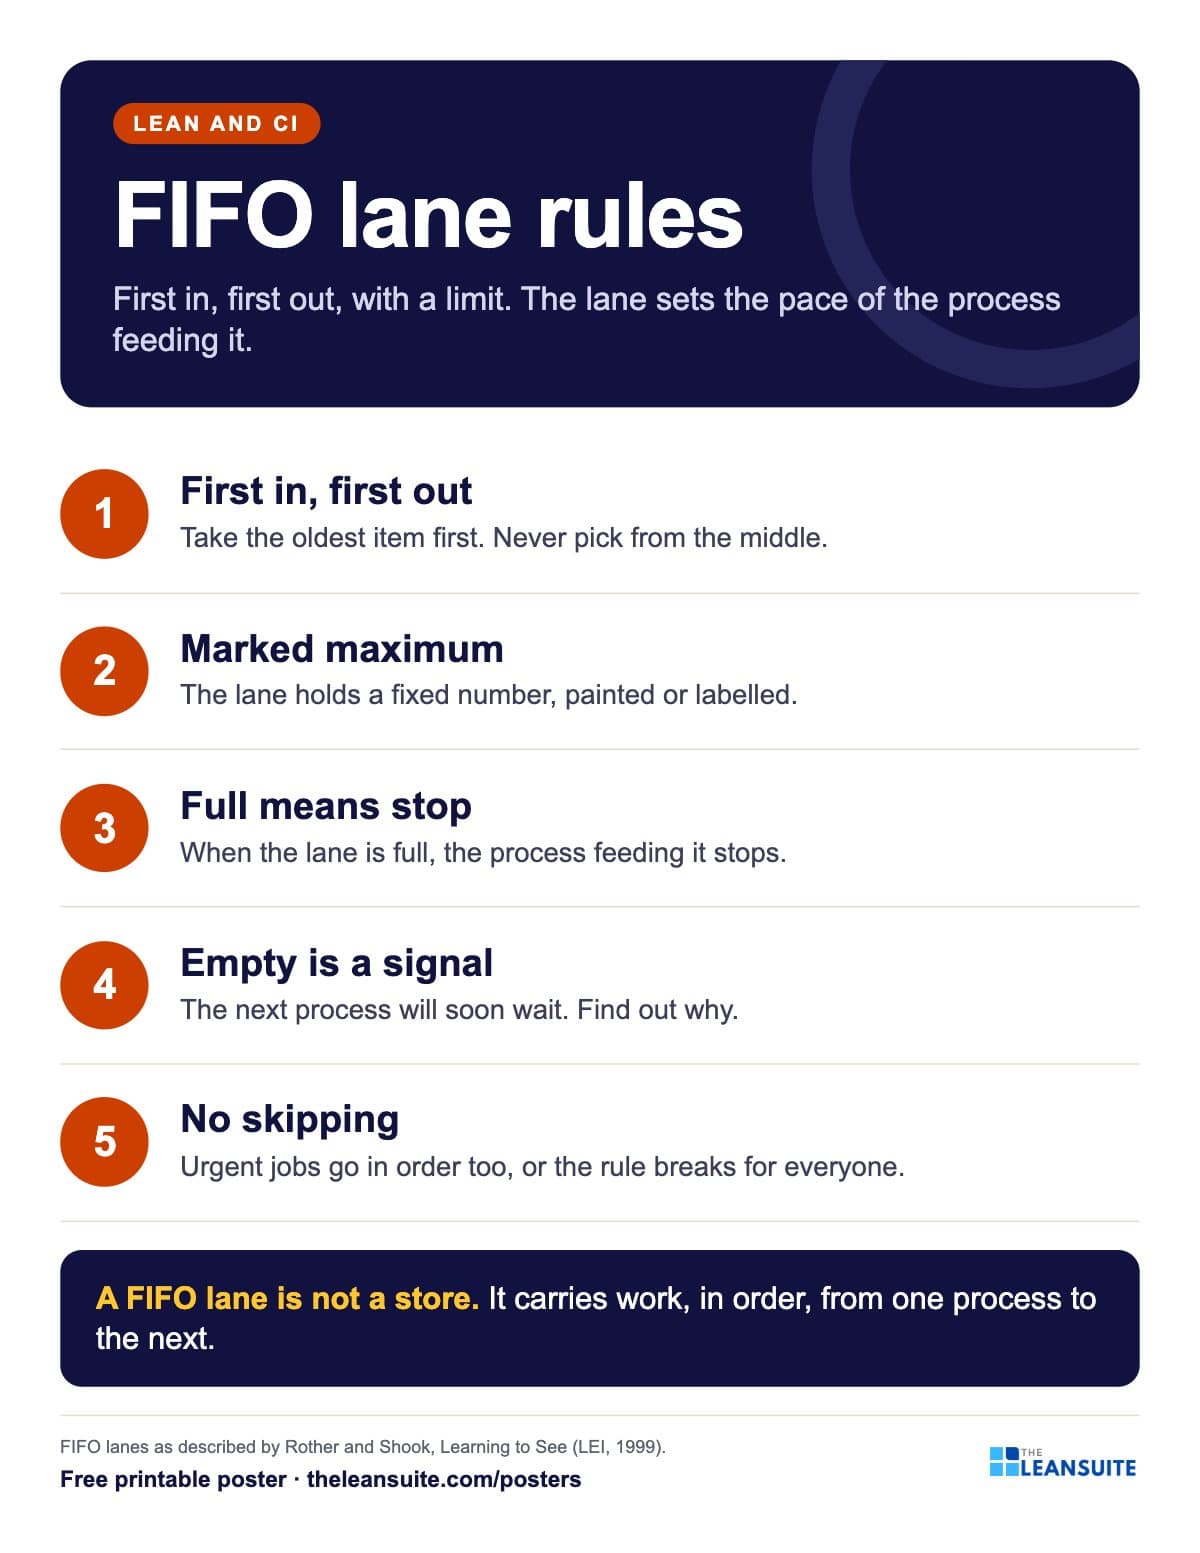 FIFO lane rules poster
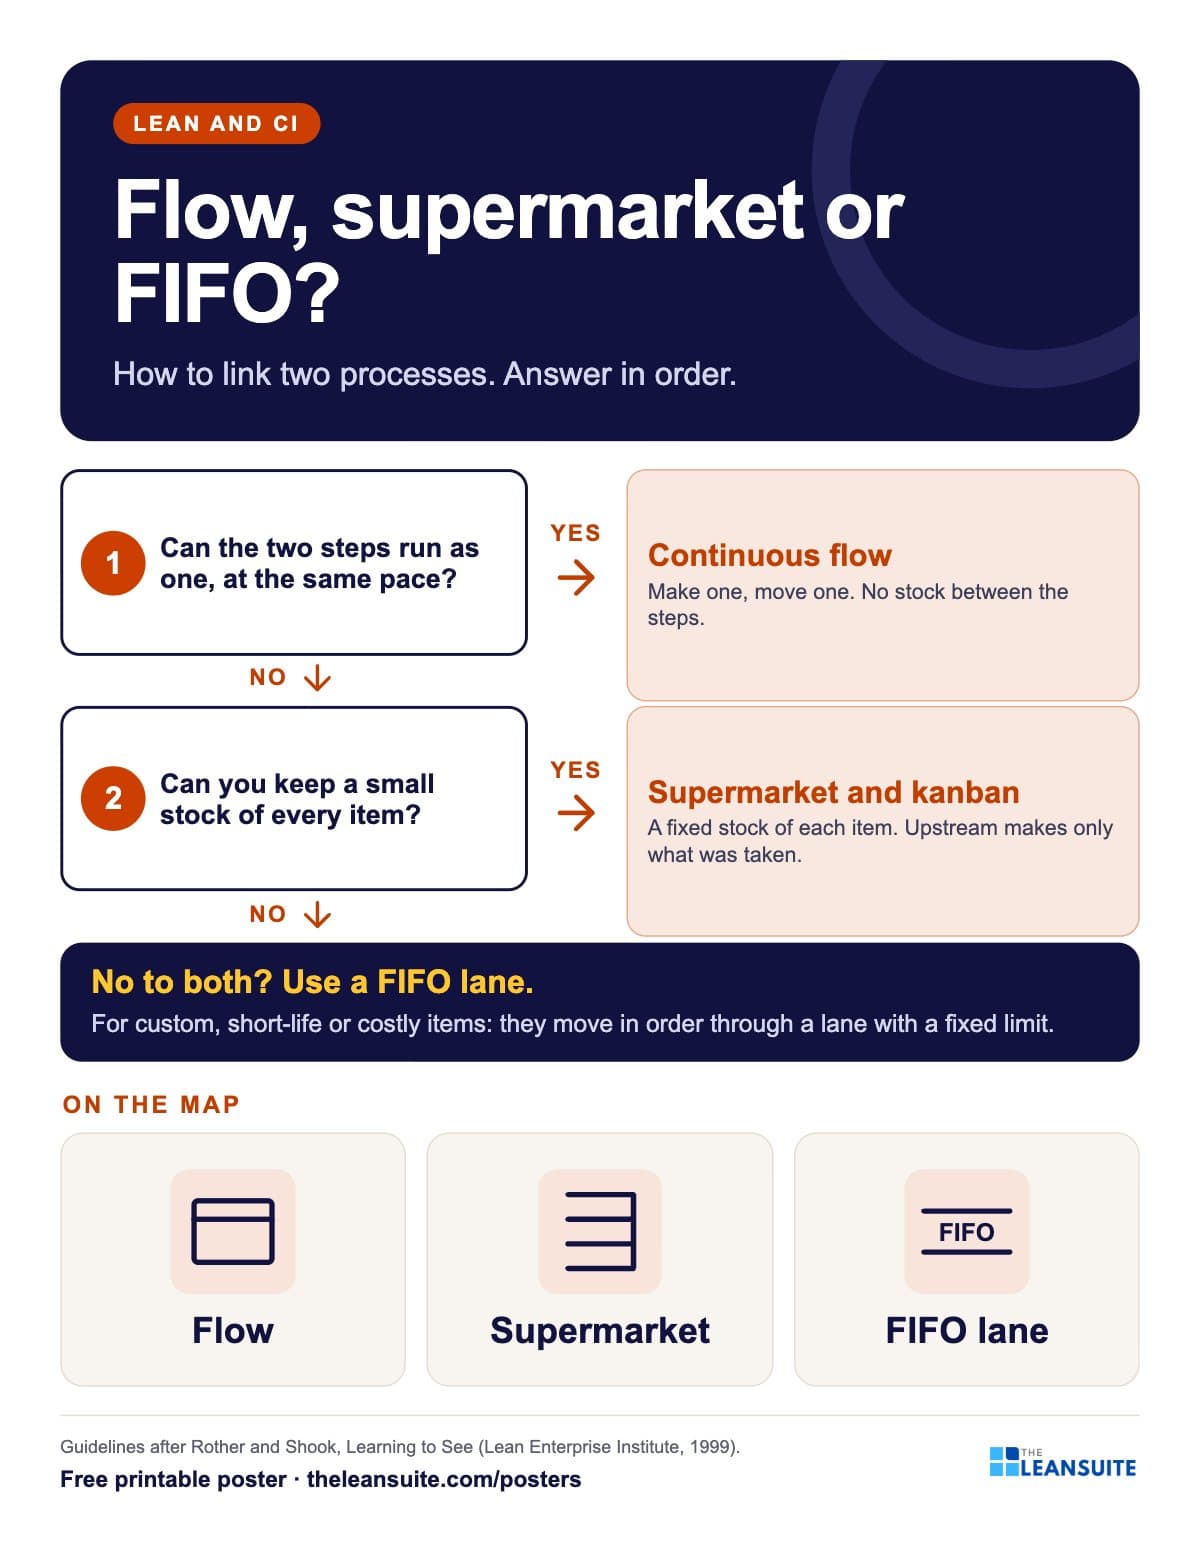 Flow, supermarket or FIFO lane poster
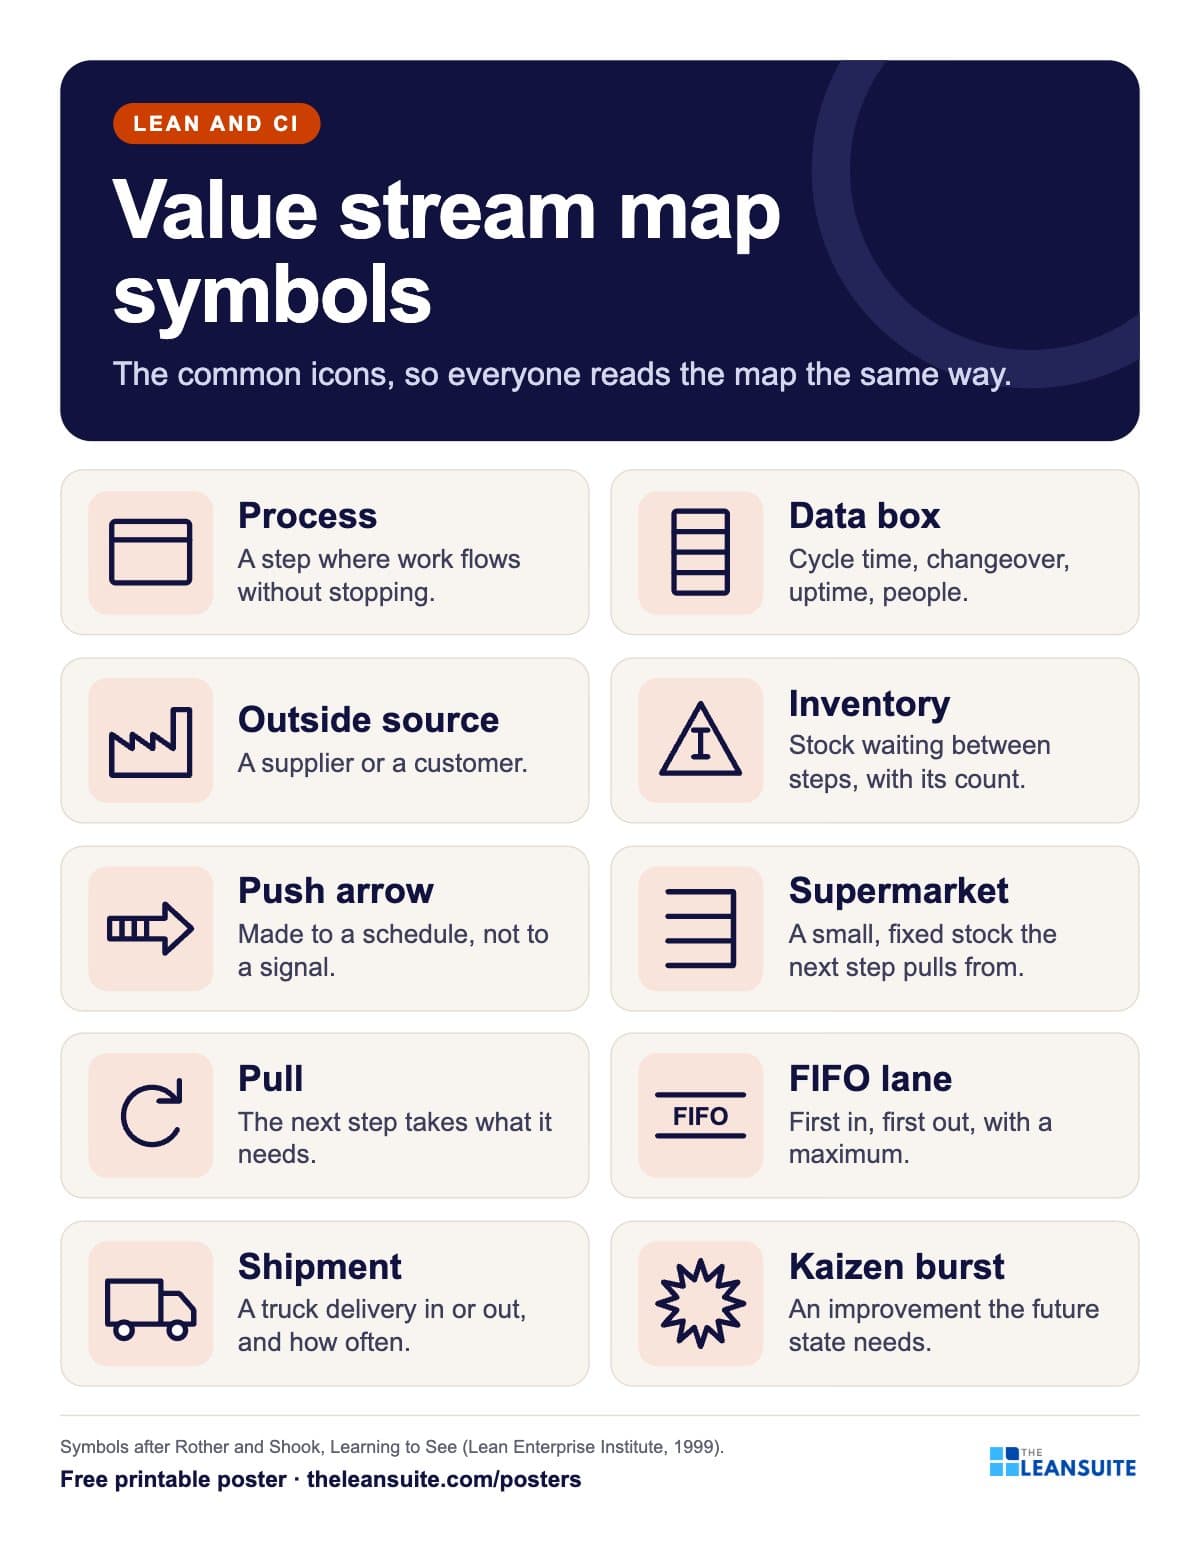 Value stream map symbols poster
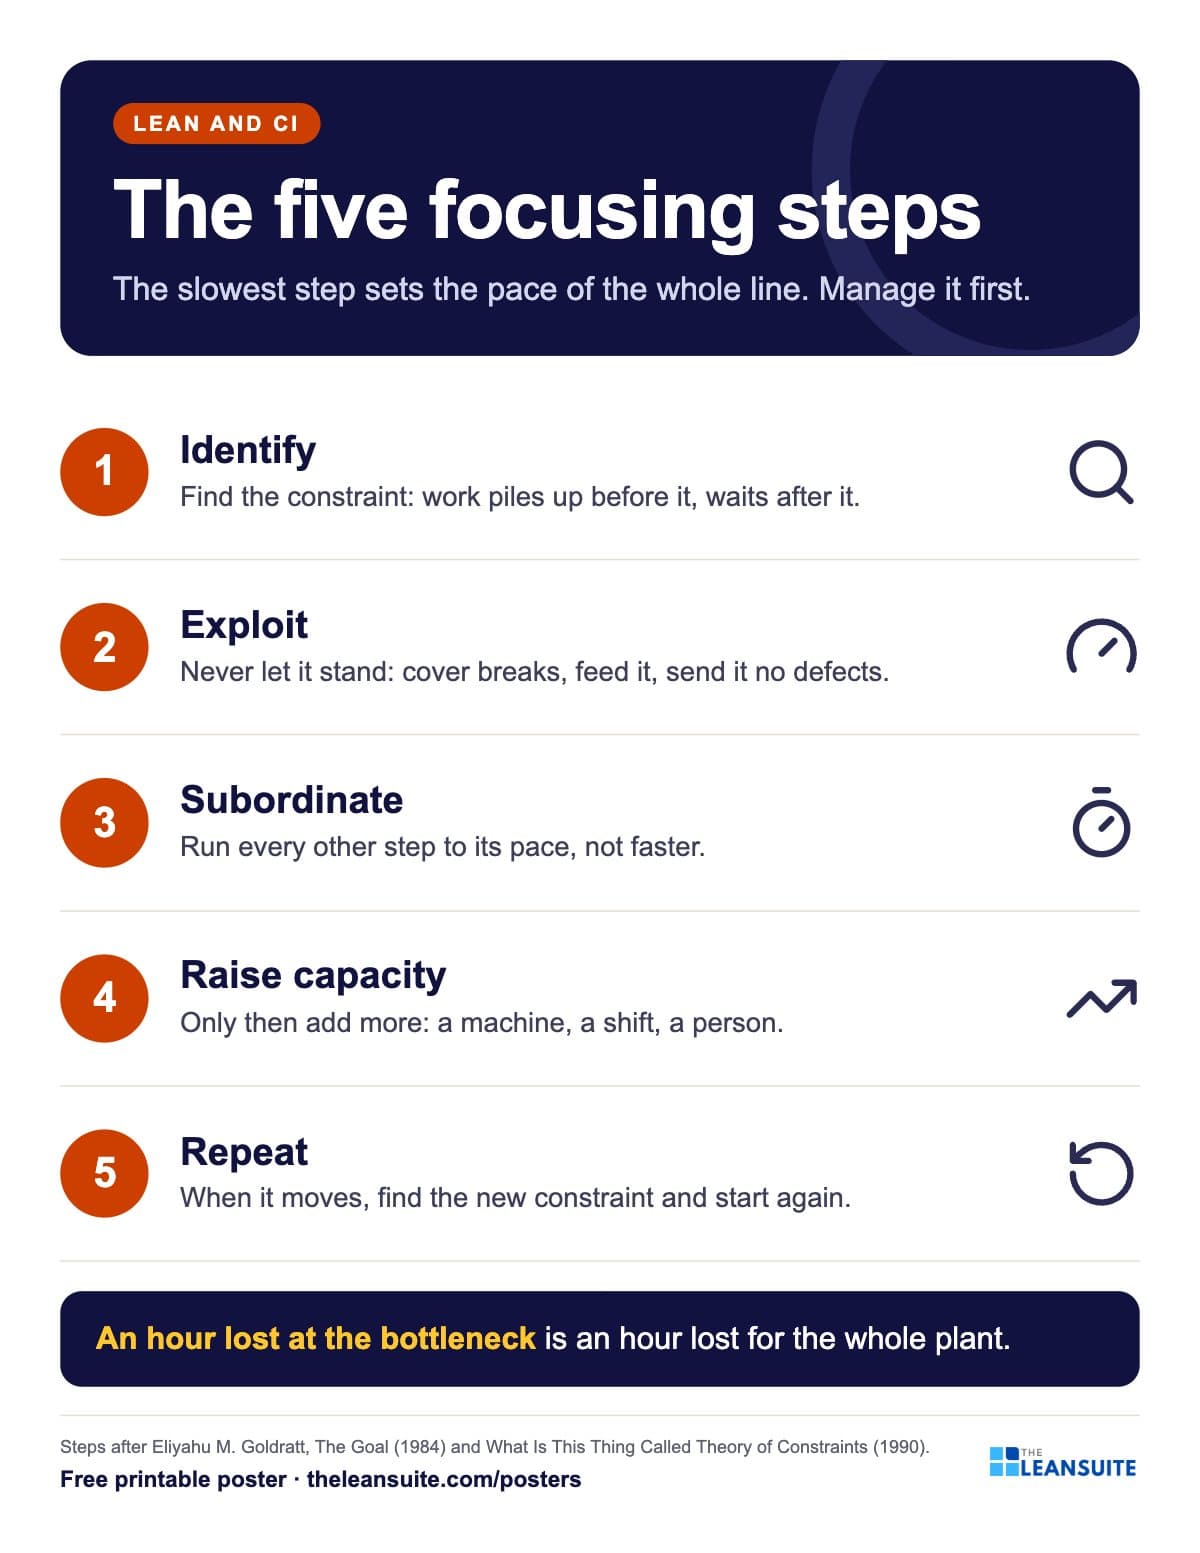 Bottleneck five focusing steps poster
A poster reminds. A routine makes it stick.
See how plants run their audits, improvements and follow-ups in LeanSuite, on a call built around your own problem.
Book a 45-minute demo