

Lean and CI poster
Updated · Free to print and share
Failure warning signs poster (P-F curve)
Many failures give warning. The P-F curve, from reliability-centred maintenance, shows the time between the point a failure can first be detected (P) and the point it fails (F). Instruments catch the earliest signs, such as a change in vibration or wear metal in the oil; people notice the later ones, such as noise, heat and smoke. This poster lists the signs in their typical order, so the team knows that the earlier a sign is caught, the more time there is to plan the repair.
Download the poster
The PNG is free to download now. The print-ready vector PDFs open after a short form, once.
Free to print and share with your team. Enter your name and work email once to download.
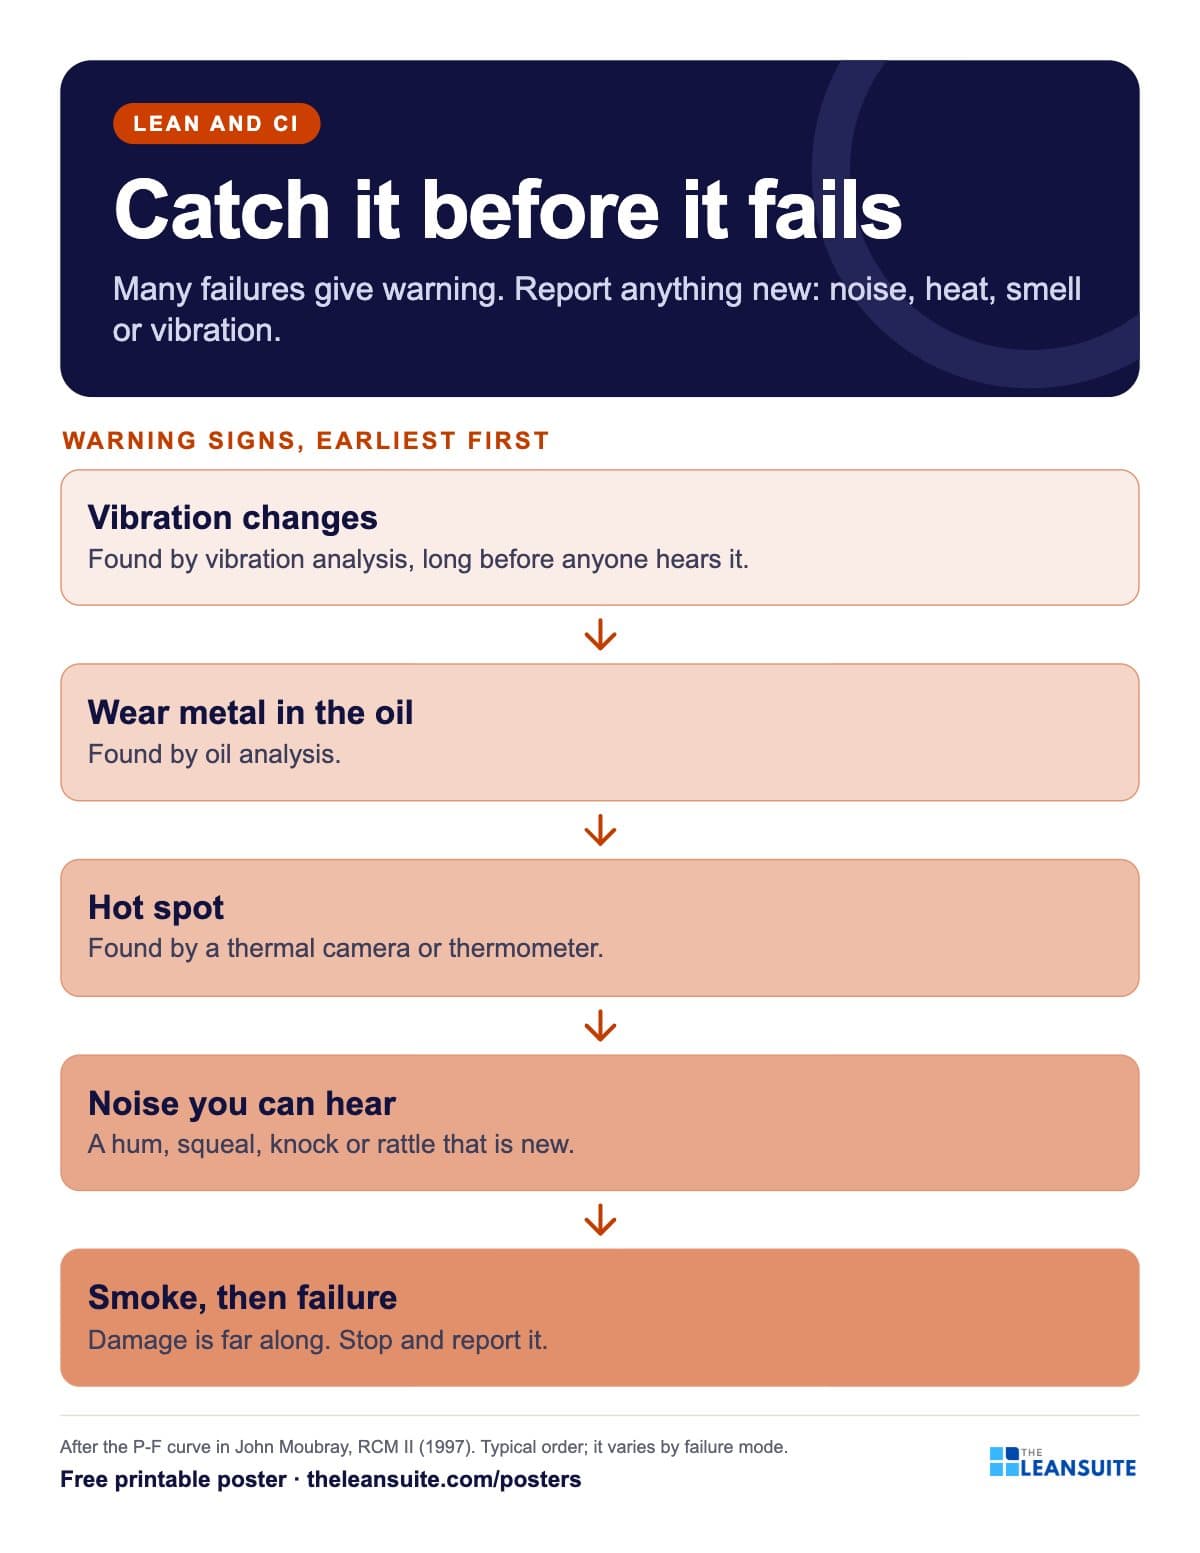 A ladder of five warning signs from vibration change to smoke and failure, earliest first, the earliest found by instruments.
The words on the poster
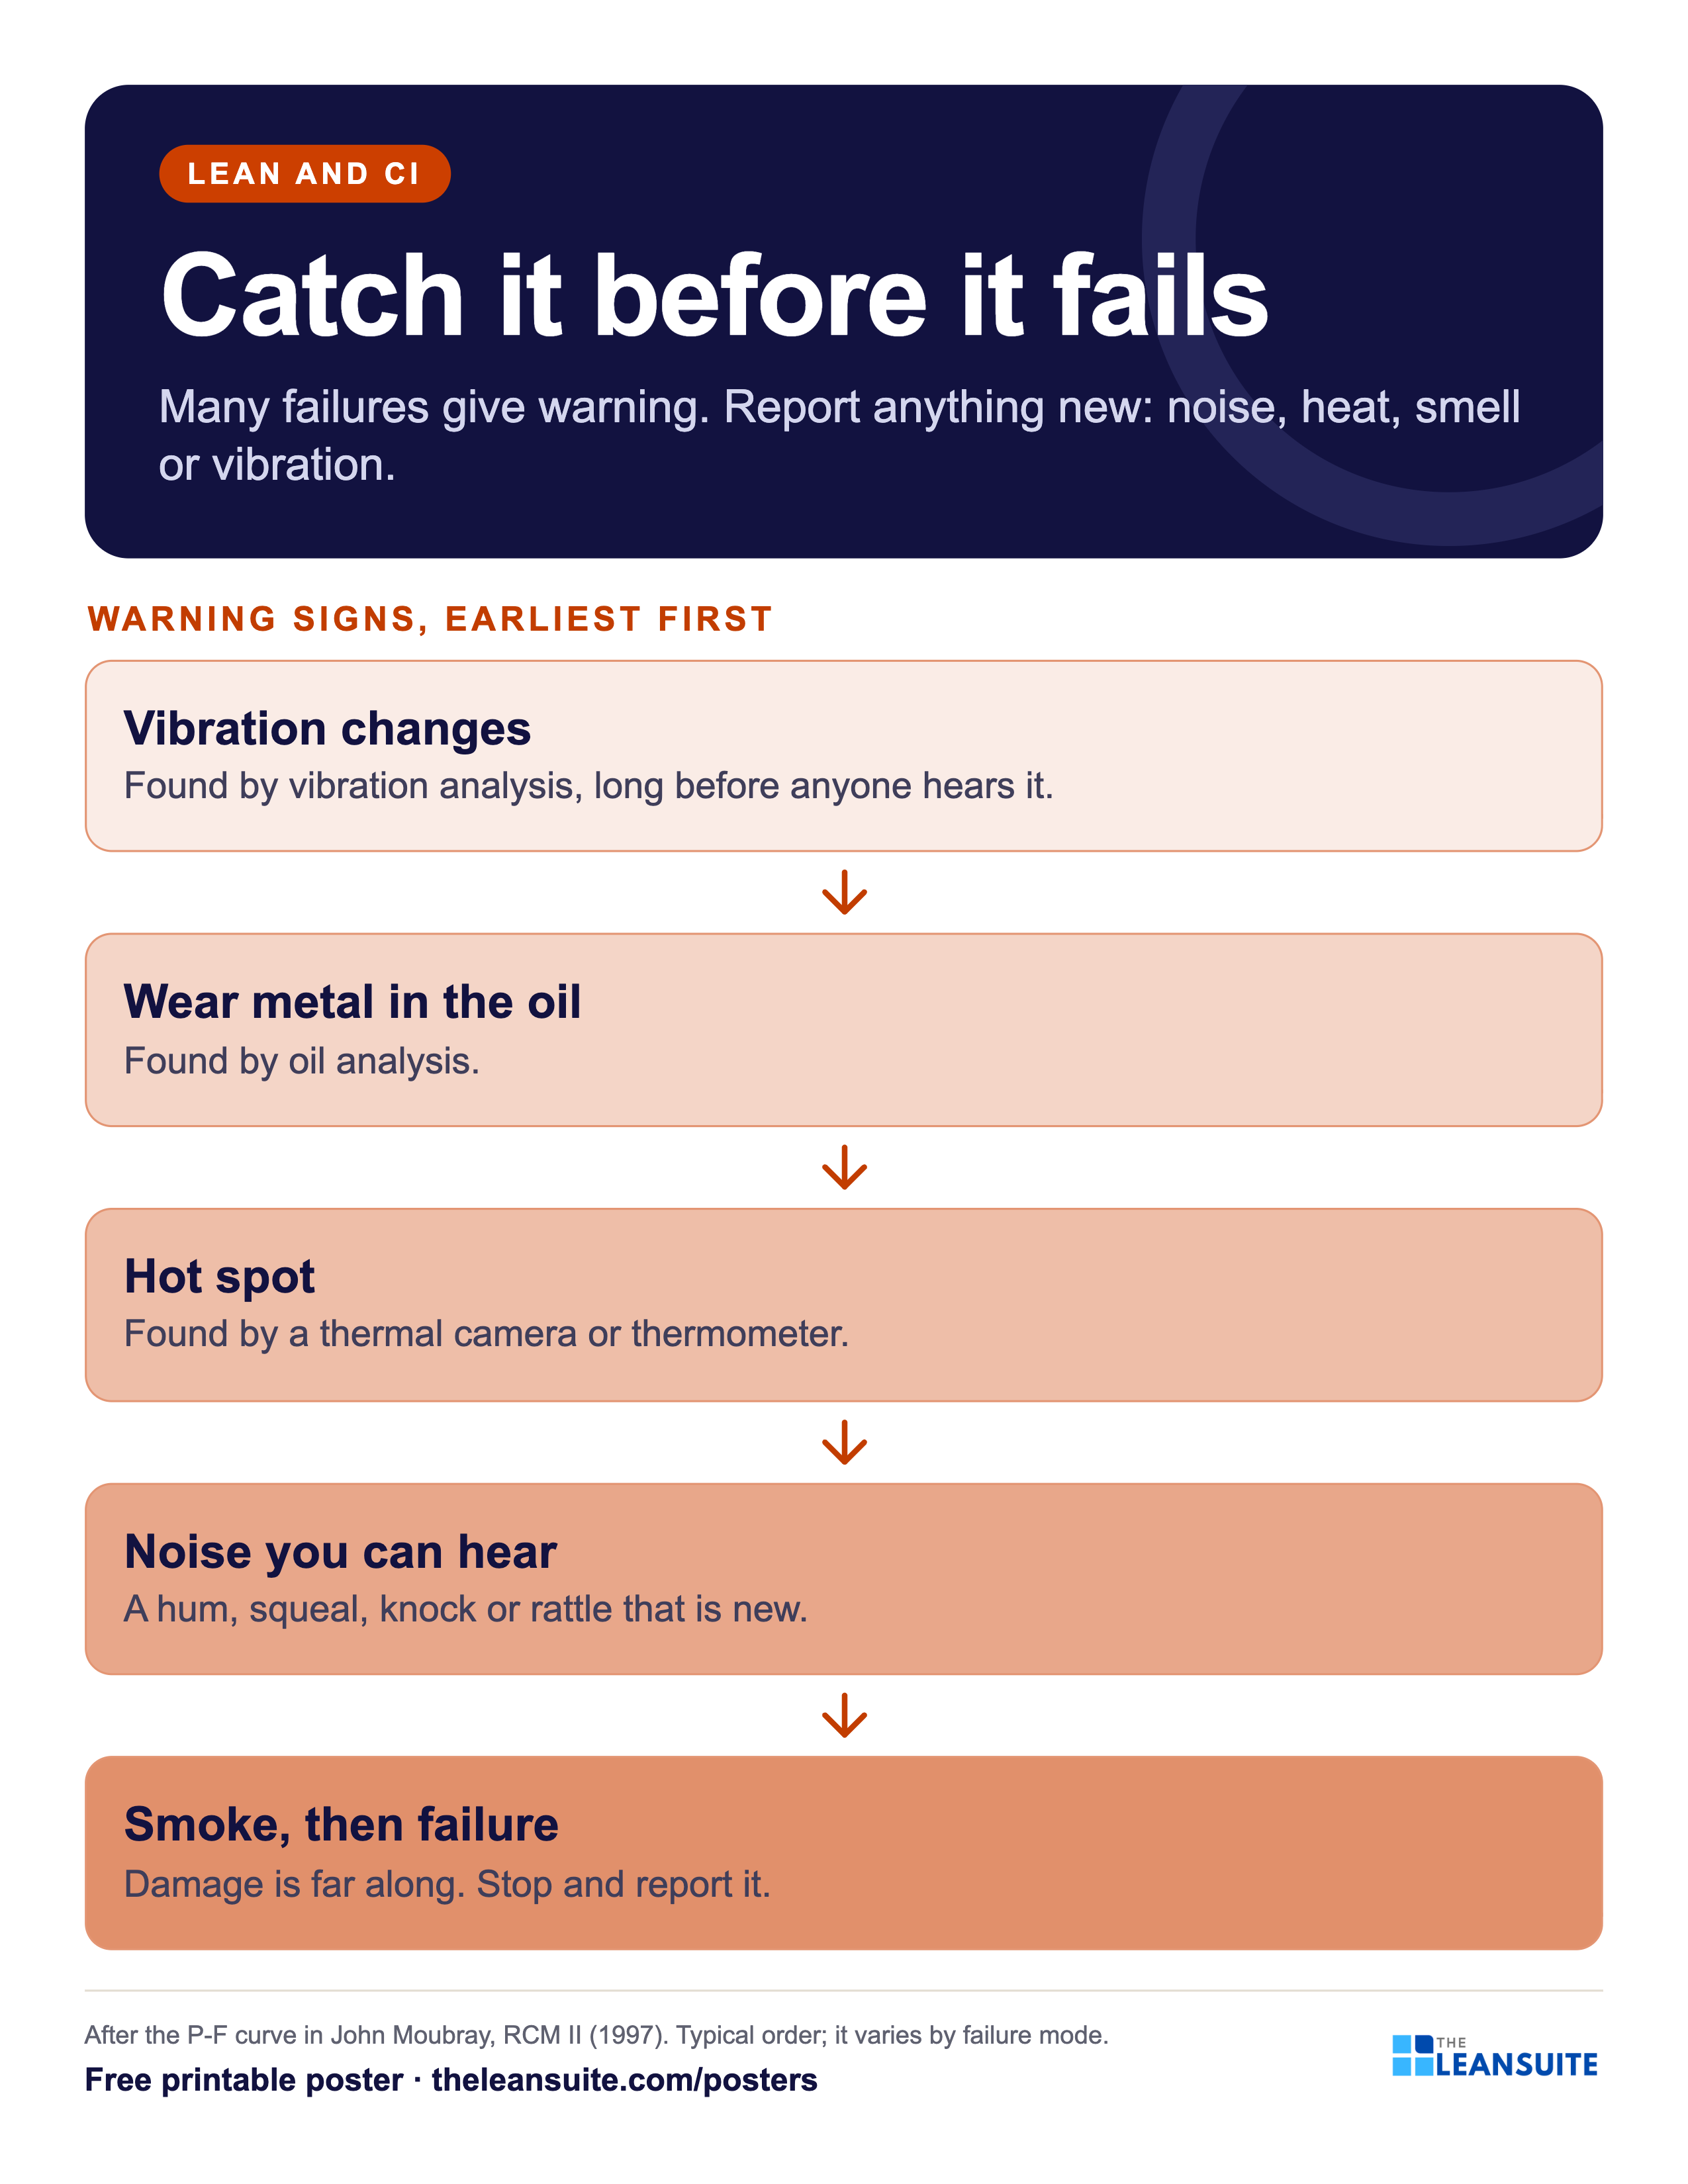
Catch it before it fails
Many failures give warning. Report anything new: noise, heat, smell or vibration.
Warning signs, earliest first
- Vibration changes Found by vibration analysis, long before anyone hears it.
- Wear metal in the oil Found by oil analysis.
- Hot spot Found by a thermal camera or thermometer.
- Noise you can hear A hum, squeal, knock or rattle that is new.
- Smoke, then failure Damage is far along. Stop and report it.
After the P-F curve in John Moubray, RCM II (1997). Typical order; it varies by failure mode.
On the floor
How to use it
Putting the Failure warning signs poster (P-F curve) poster to work
- 1
Hang it by the condition monitoring route and in the maintenance office.
- 2
Use it to explain why operators report a new noise or smell straight away: it is already late on the curve.
- 3
Mark which signs your plant measures today and on which machines.
- 4
Pair it with the free condition monitoring route sheet.
Which size to print
- 24 x 36 in or A2: a main wall or team board, read from a few metres away.
- 18 x 24 in or A3: a station or notice board. The A3 file also fits 11 x 17 in paper.
- Letter or A4: a clipboard, binder or handout, on any office printer.
Every PDF is vector, so it stays sharp at full size. Nothing runs to the edge of the page, so no bleed is needed.
Sources and notes
The order of the signs is the one usually drawn on a P-F curve for rotating equipment. It varies by failure mode: some failures give no warning a person can see, and some skip a stage.
- John Moubray, Reliability-centred Maintenance (RCM II, 2nd edition, 1997): the P-F interval and P-F curve.
Templates, decks and guides to go with it
- TPM training presentation: the 8 pillarsFree training deck: What TPM is, the six big losses, OEE and the 8 pillars, in 19 slides with a loss-spotting activity.
- Condition monitoring route sheetA route of measuring points with baselines, alert and alarm limits, a check interval from the P-F interval, readings with rising and overdue flags, and an exceptions list worst first.
- RCM worksheet (failure mode and task selection)Failure modes classed as hidden, safety, operational or non-operational, then a task chosen for each: condition-based, discard, failure-finding, redesign or run to failure.
- Preventive maintenance checklist templateA PM checklist per machine with readings and sign-off, and a PM schedule that works out the next due date.
- Topic: TPM and maintenanceEvery guide we have on the subject, sorted.
More lean and ci posters
All posters 5S poster
 8 wastes of lean poster (DOWNTIME)
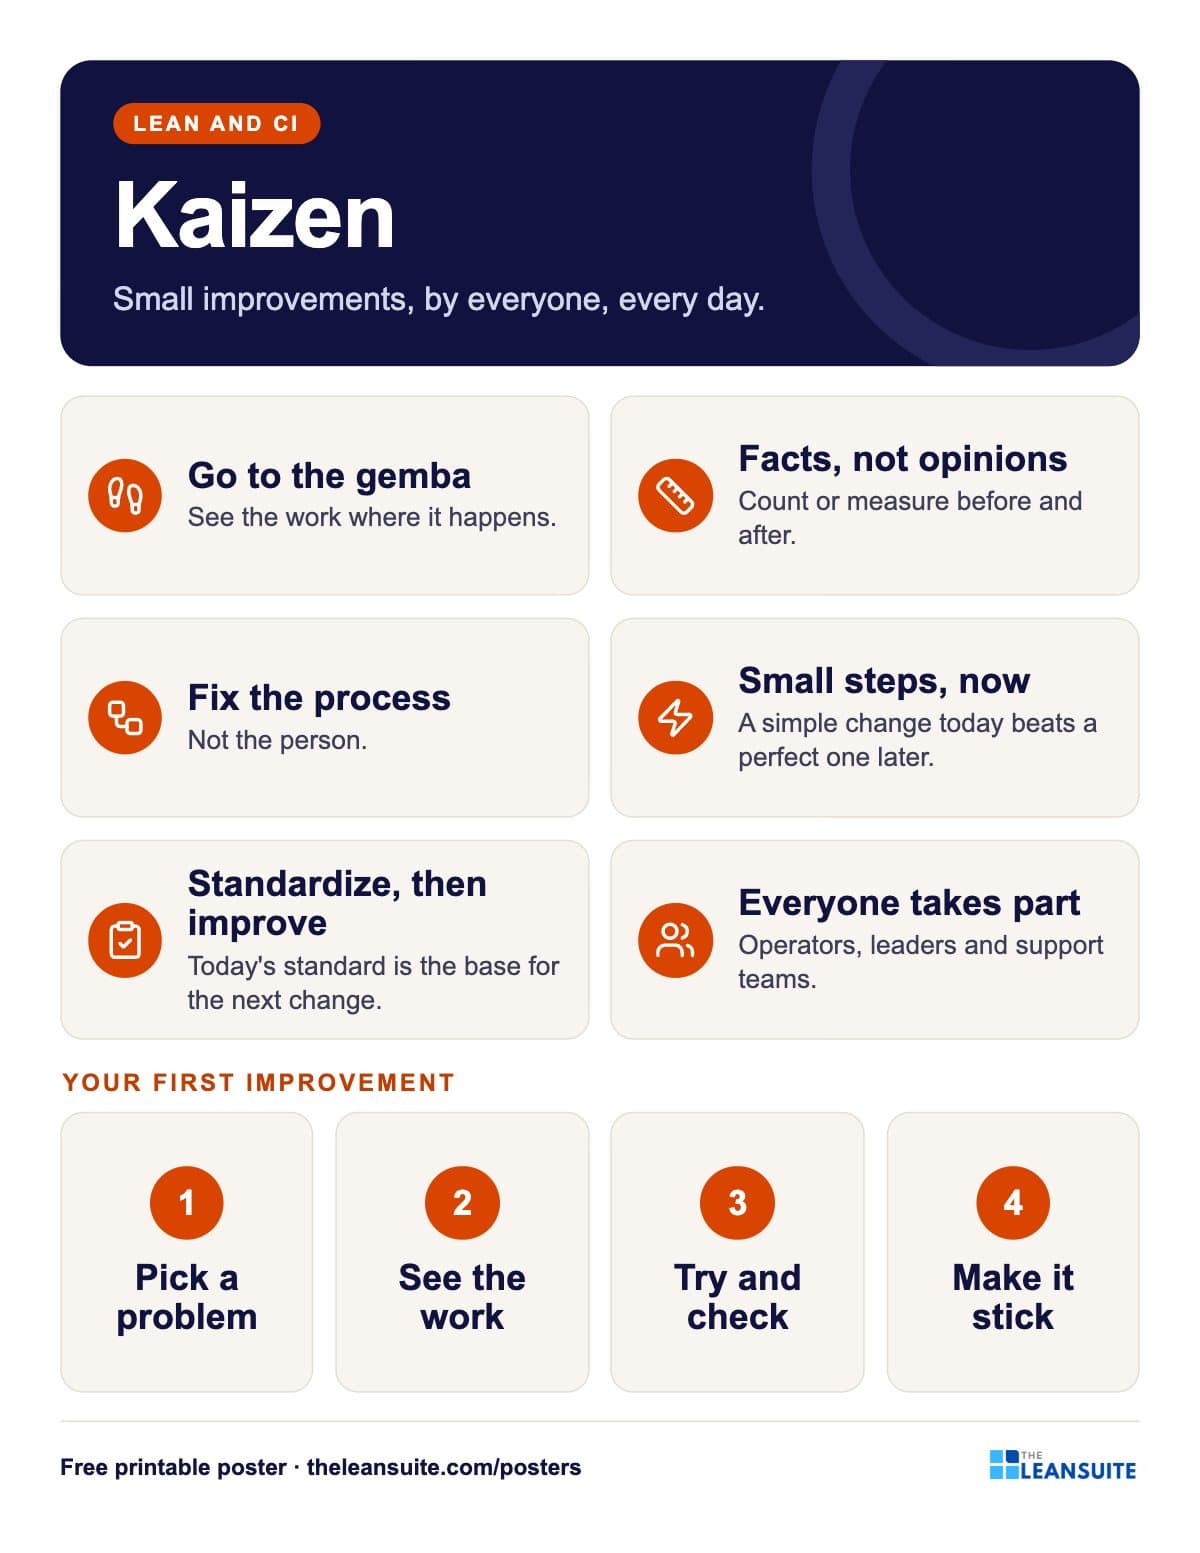 Kaizen principles poster
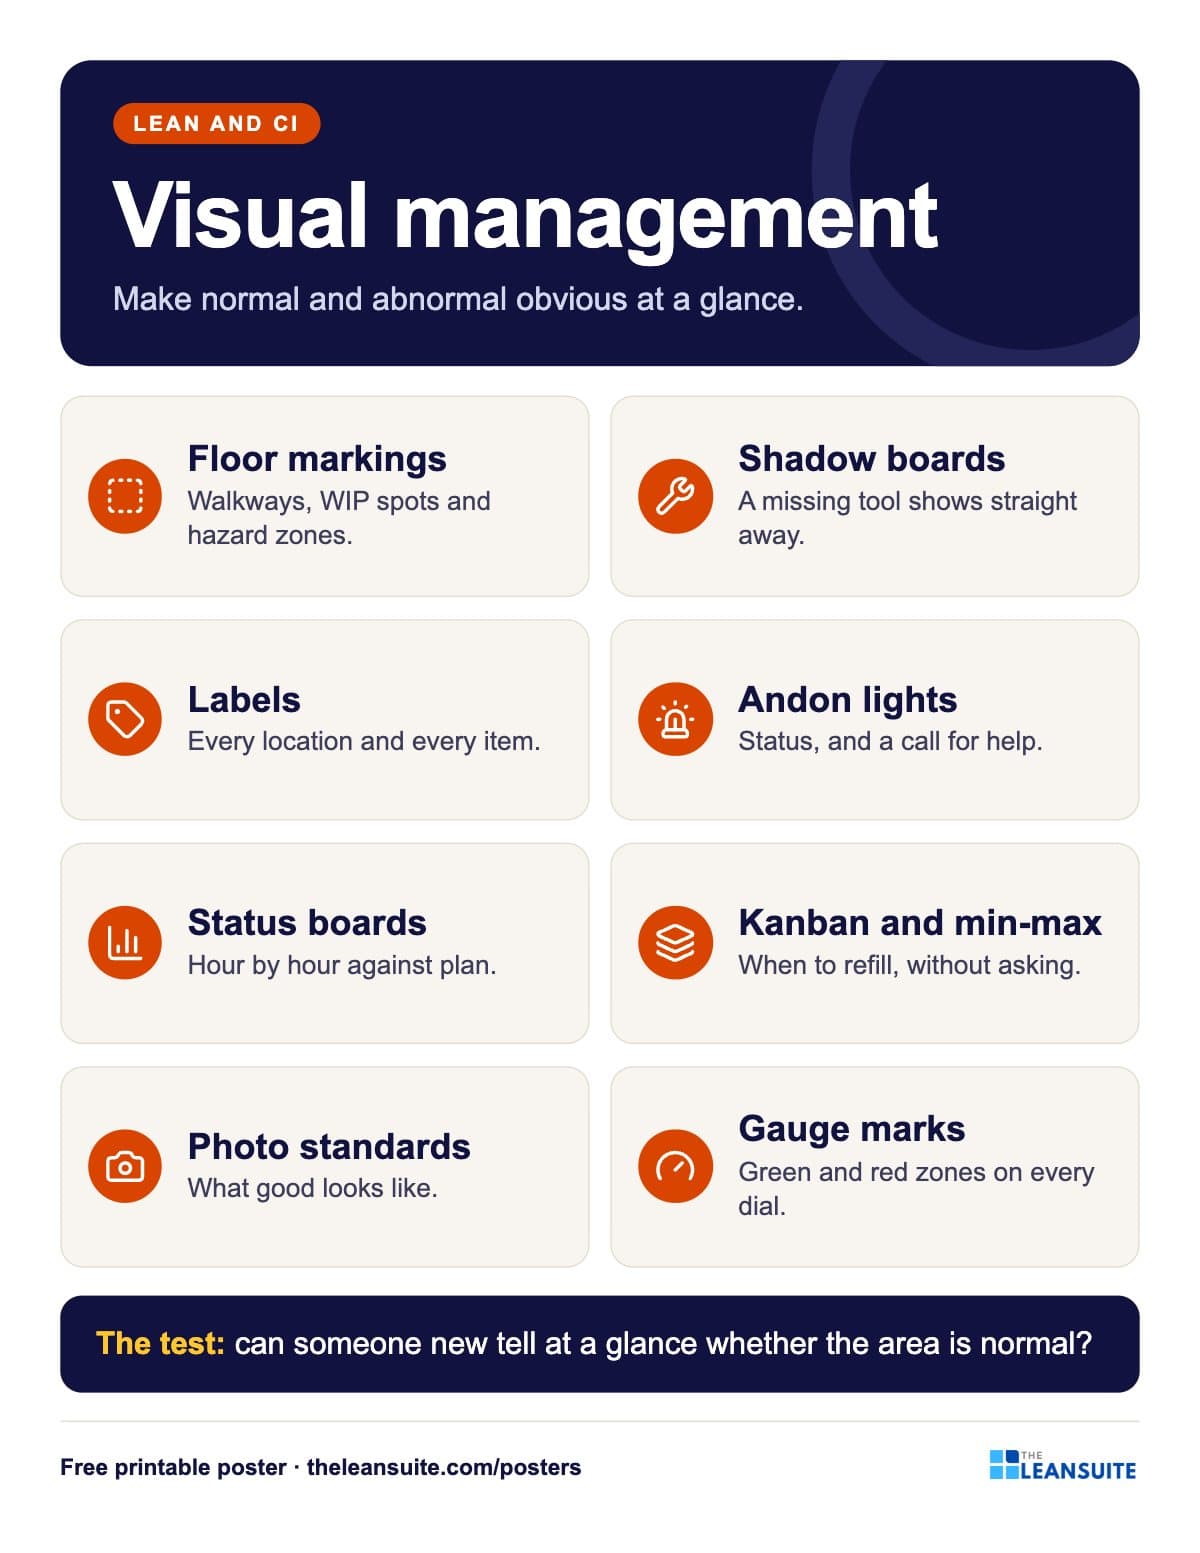 Visual management poster
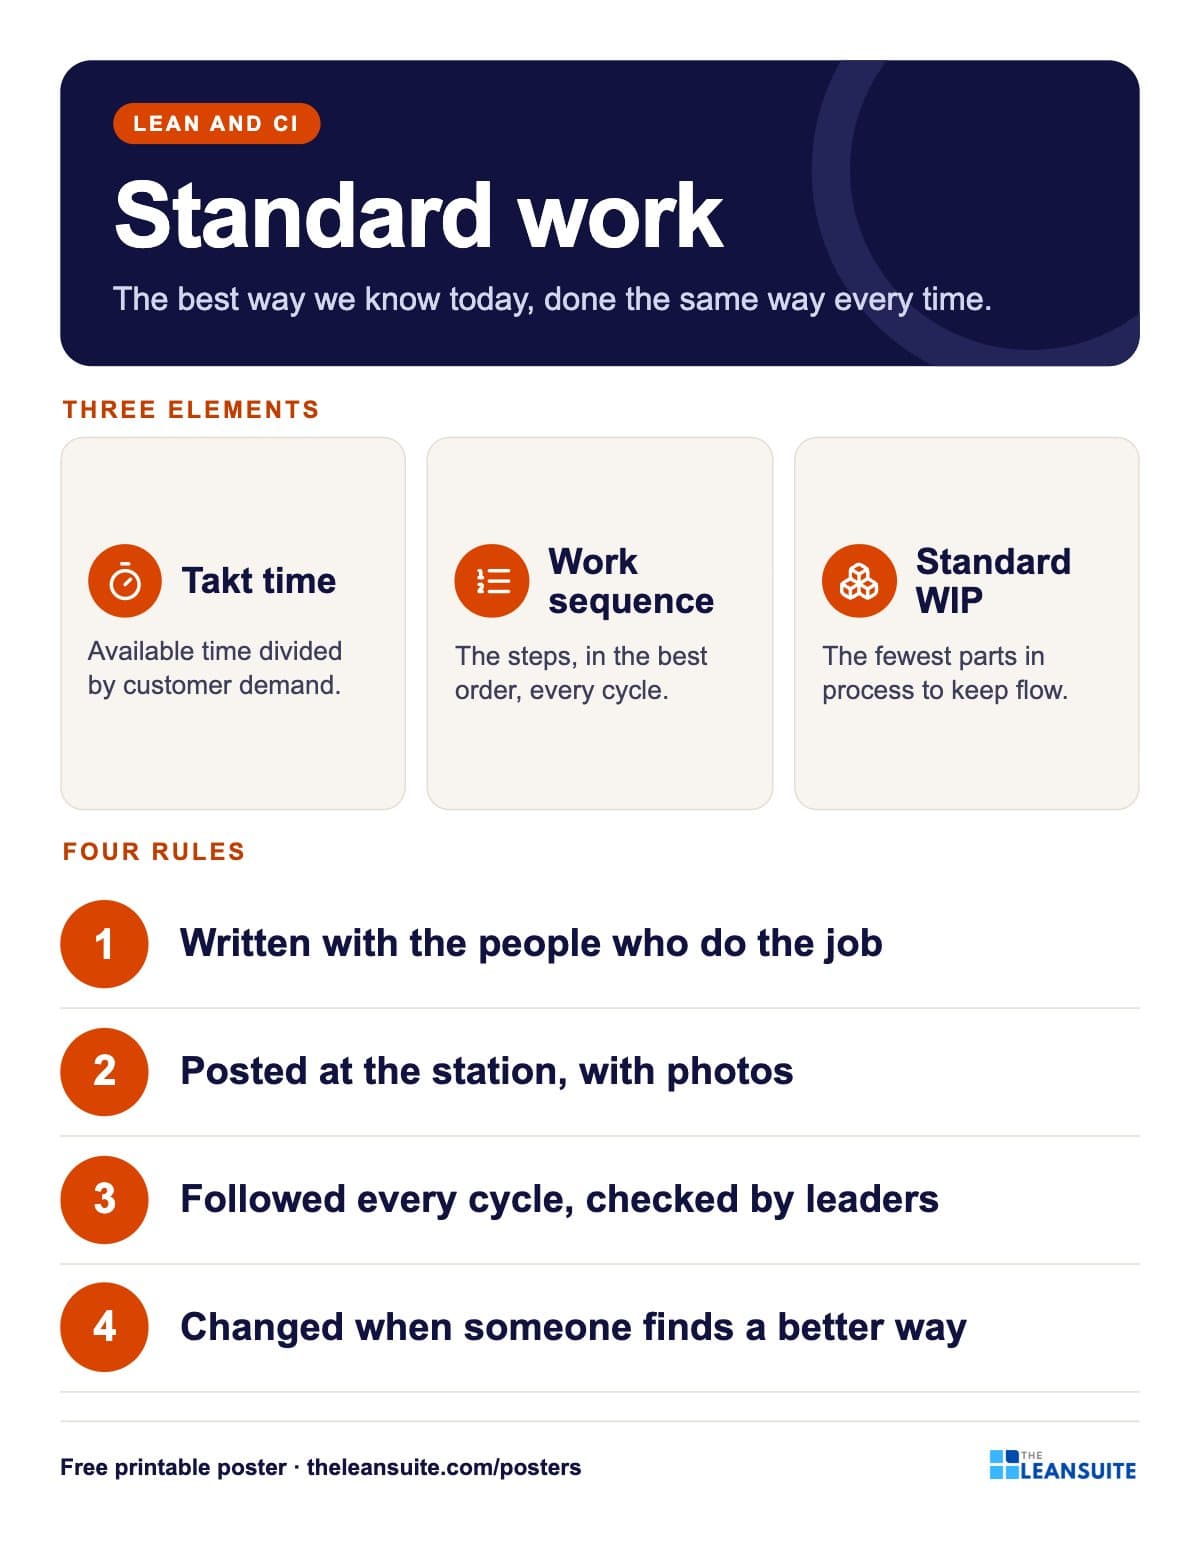 Standard work poster
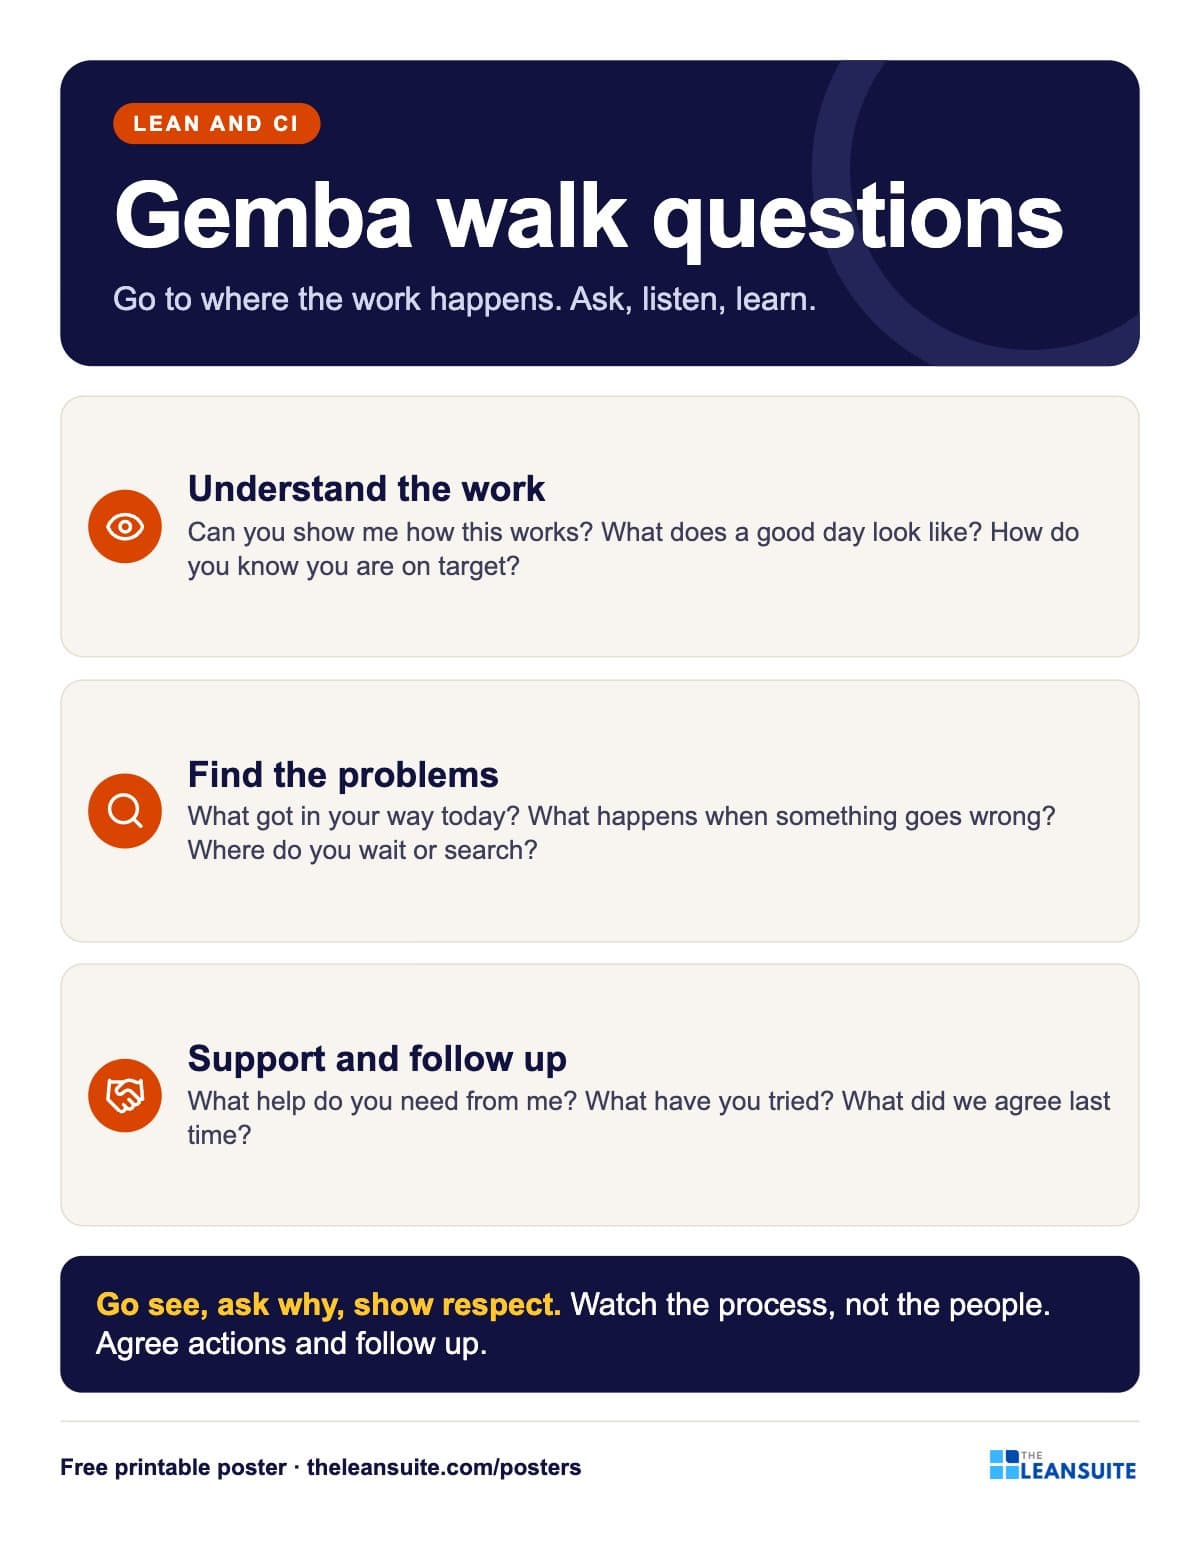 Gemba walk questions poster
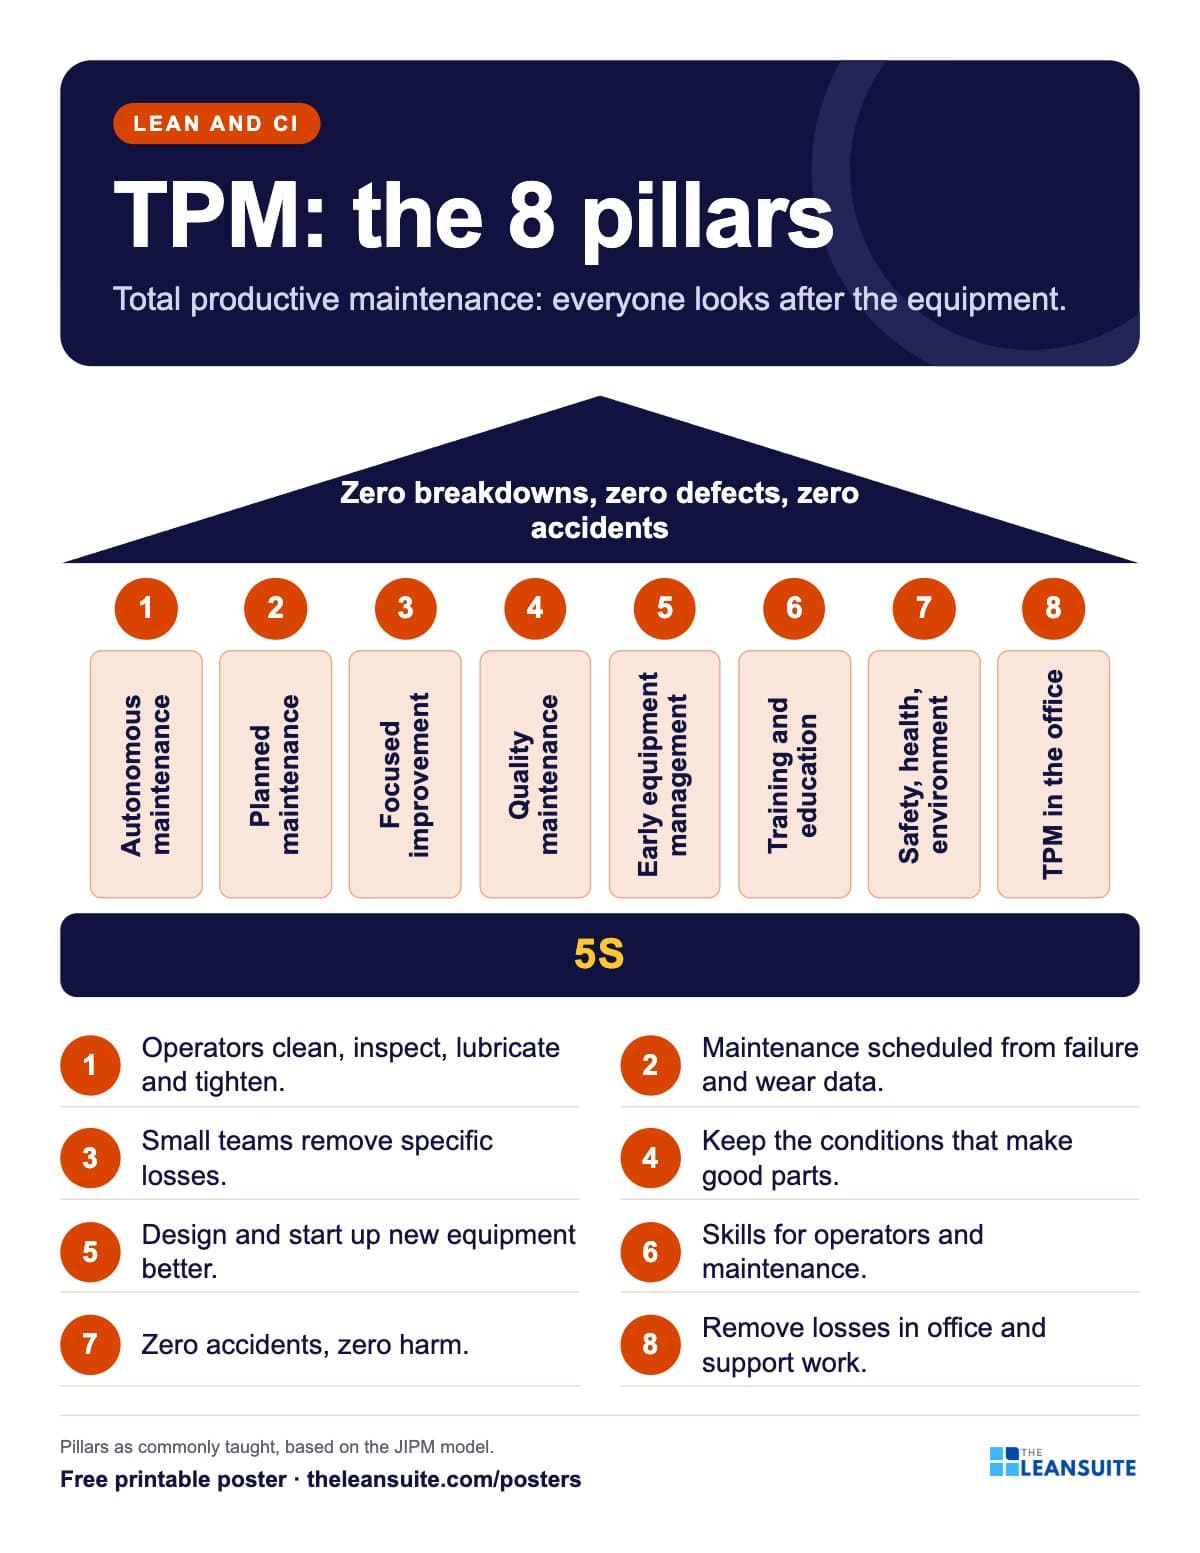 TPM 8 pillars poster
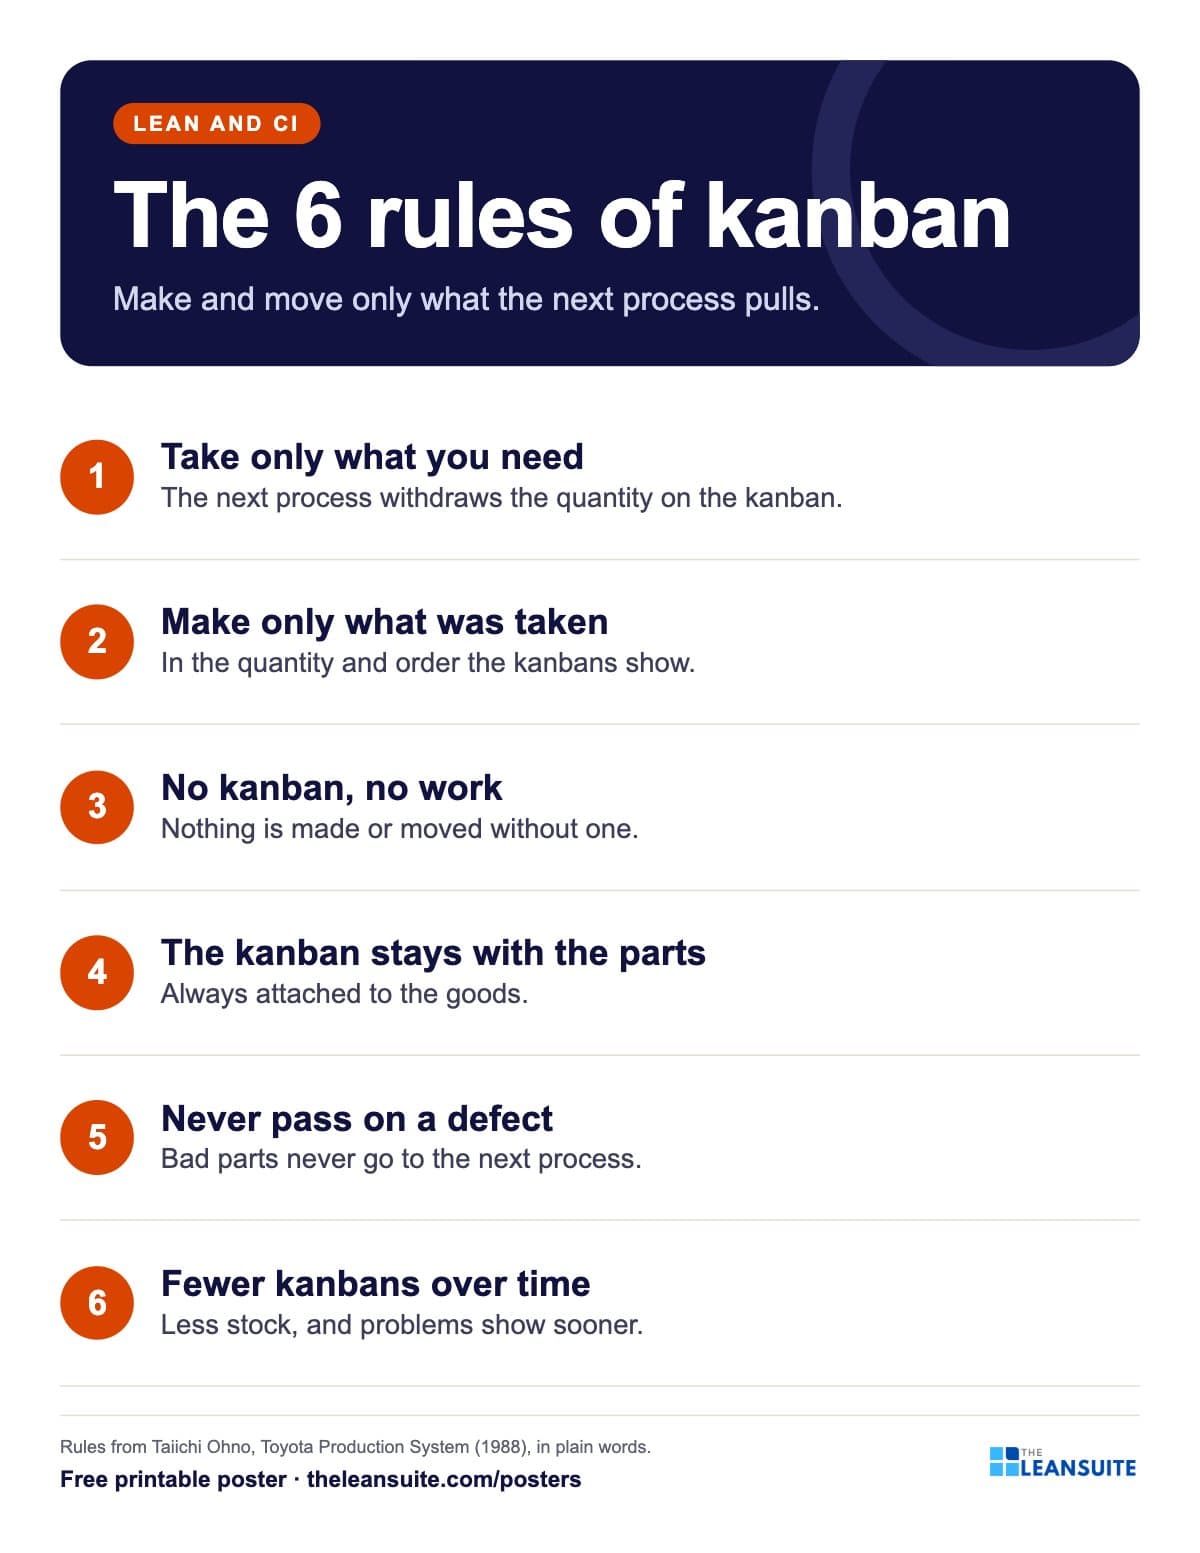 Kanban rules poster
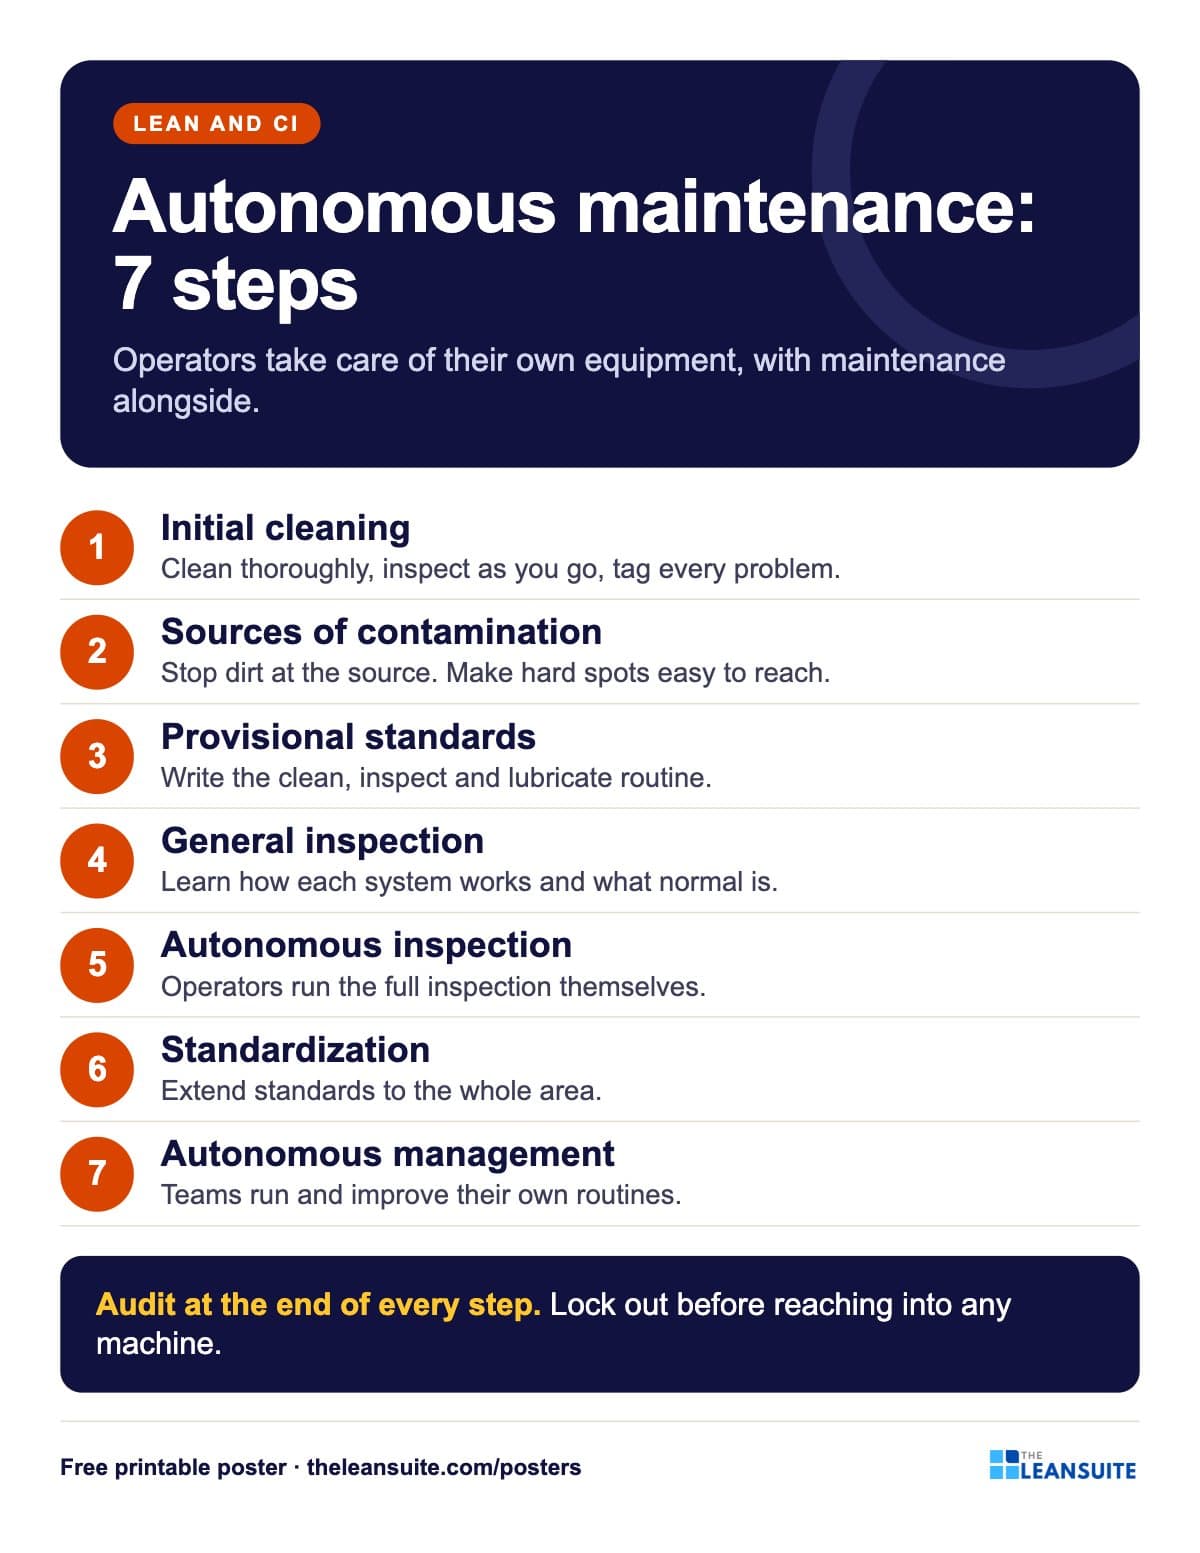 Autonomous maintenance 7 steps poster
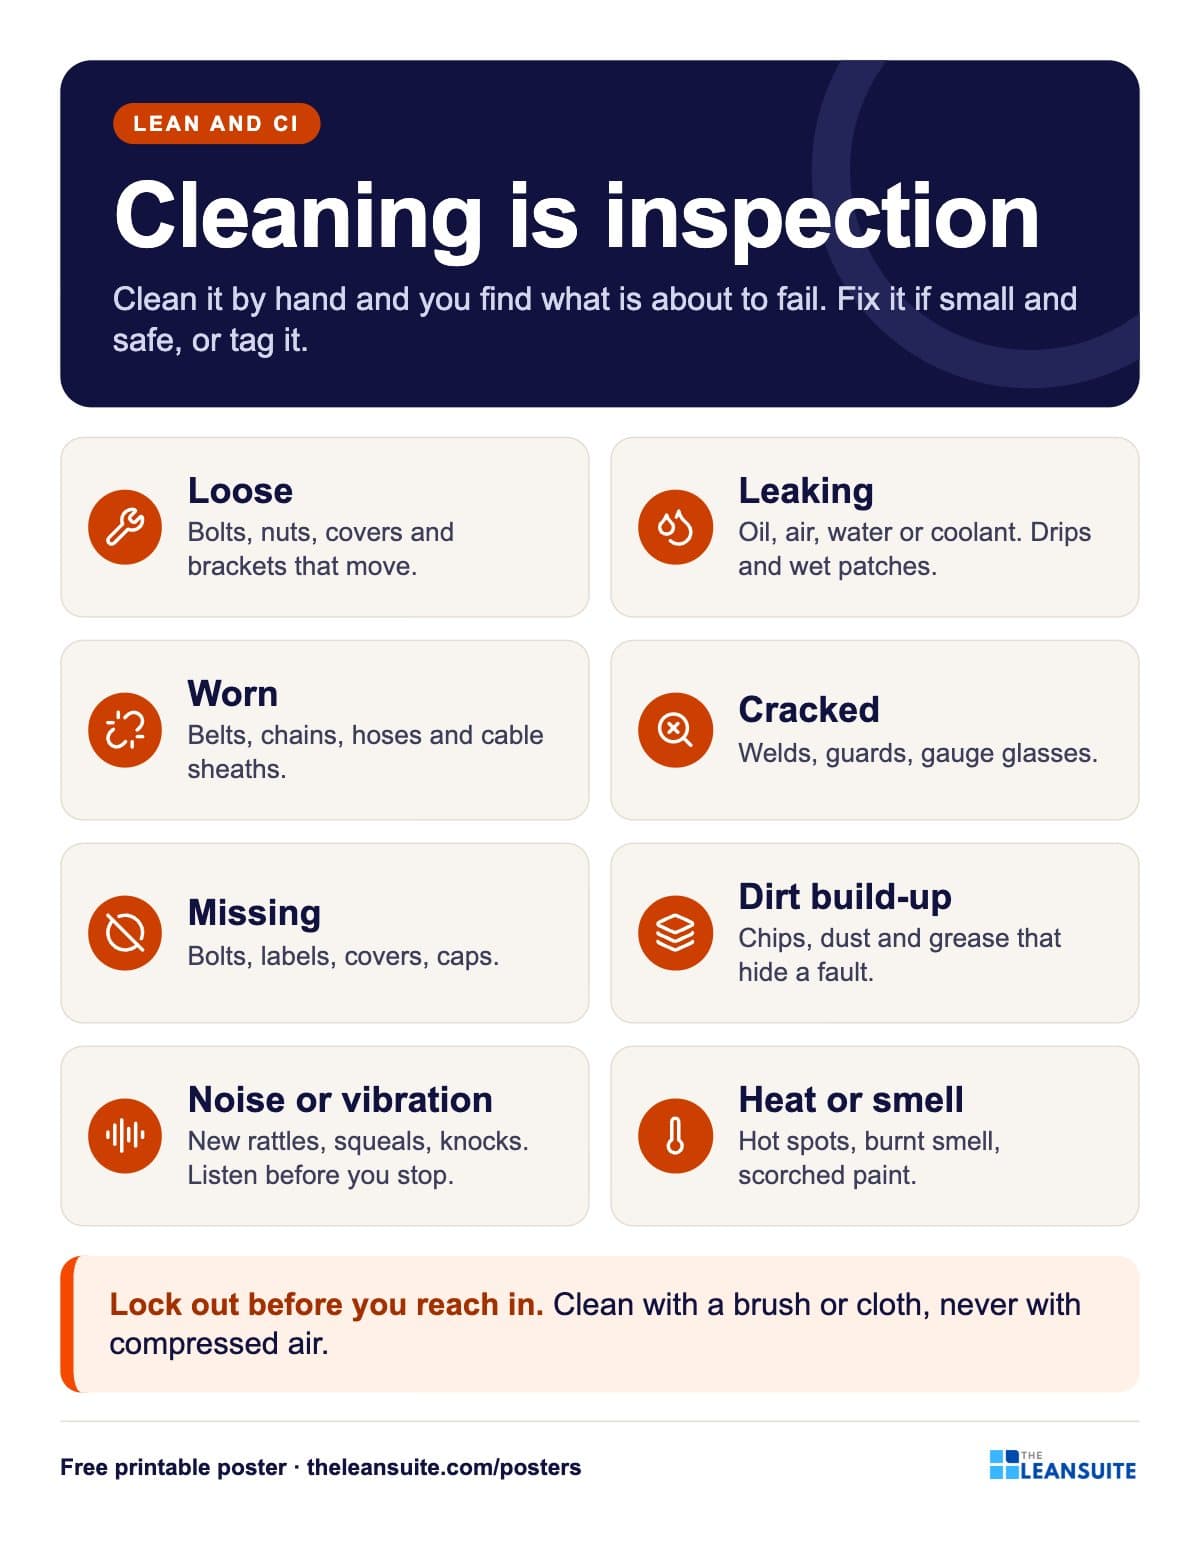 Cleaning is inspection poster
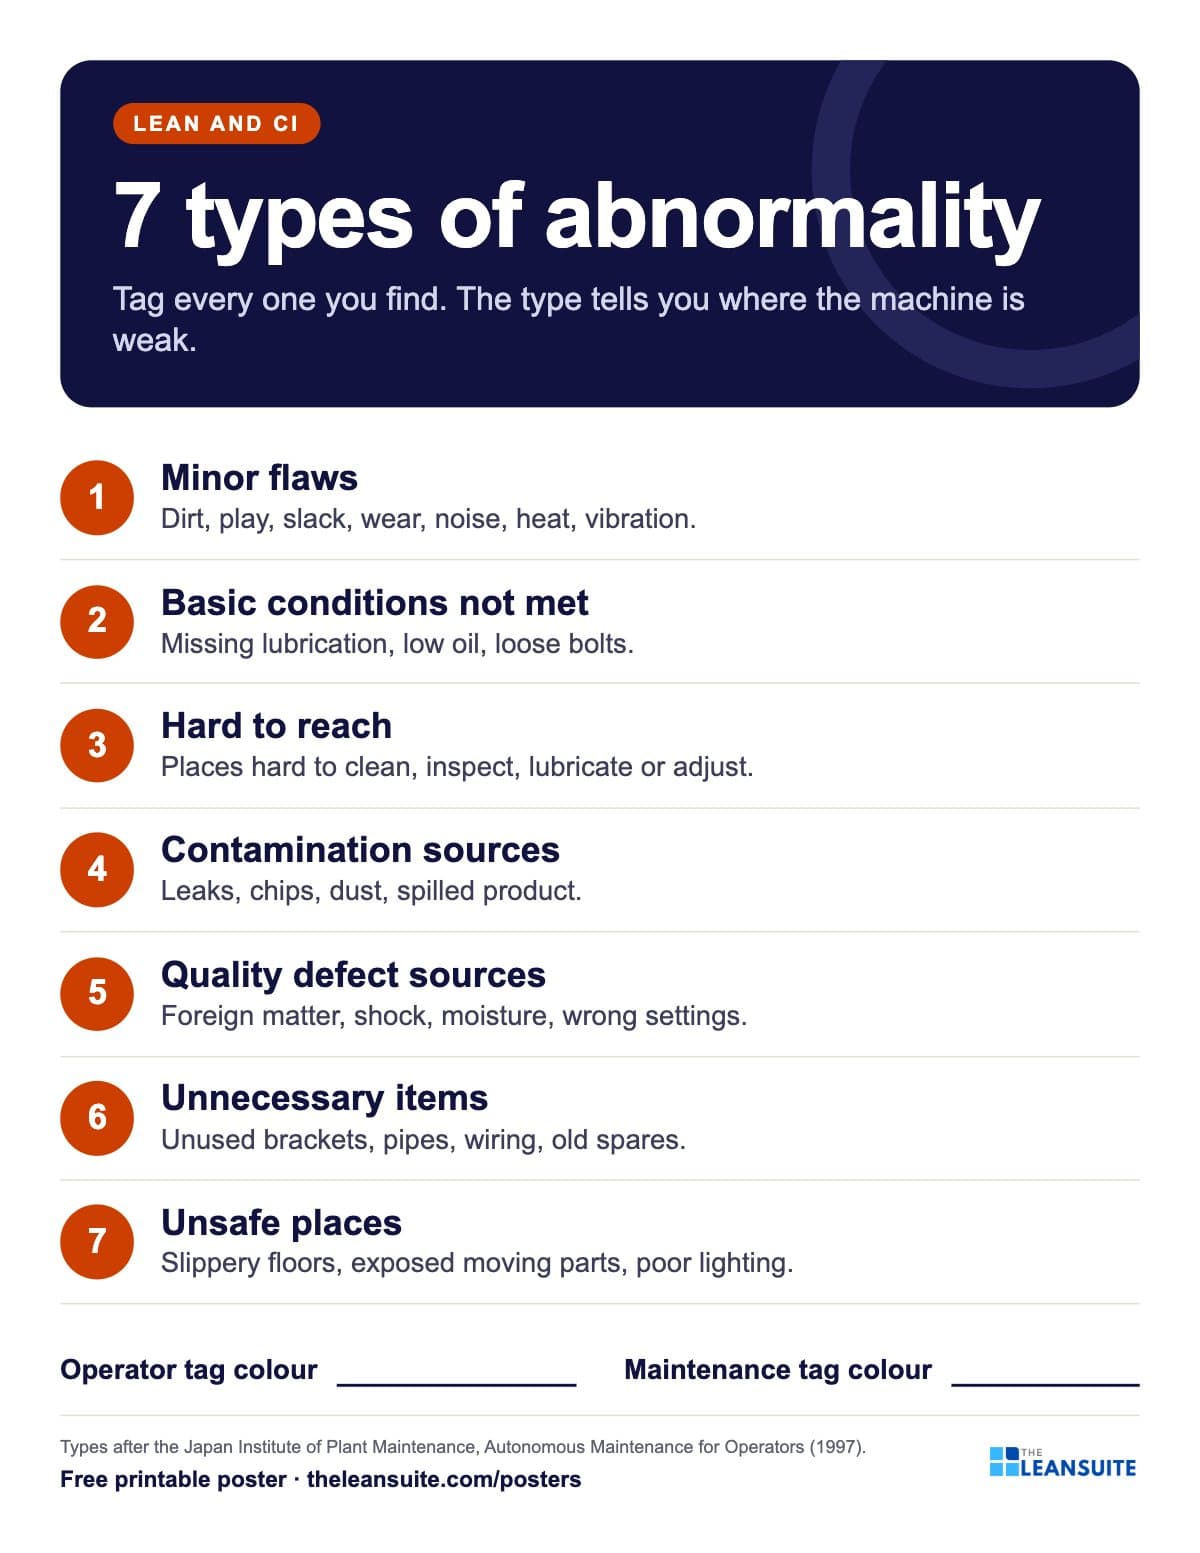 7 types of abnormality poster (TPM tags)
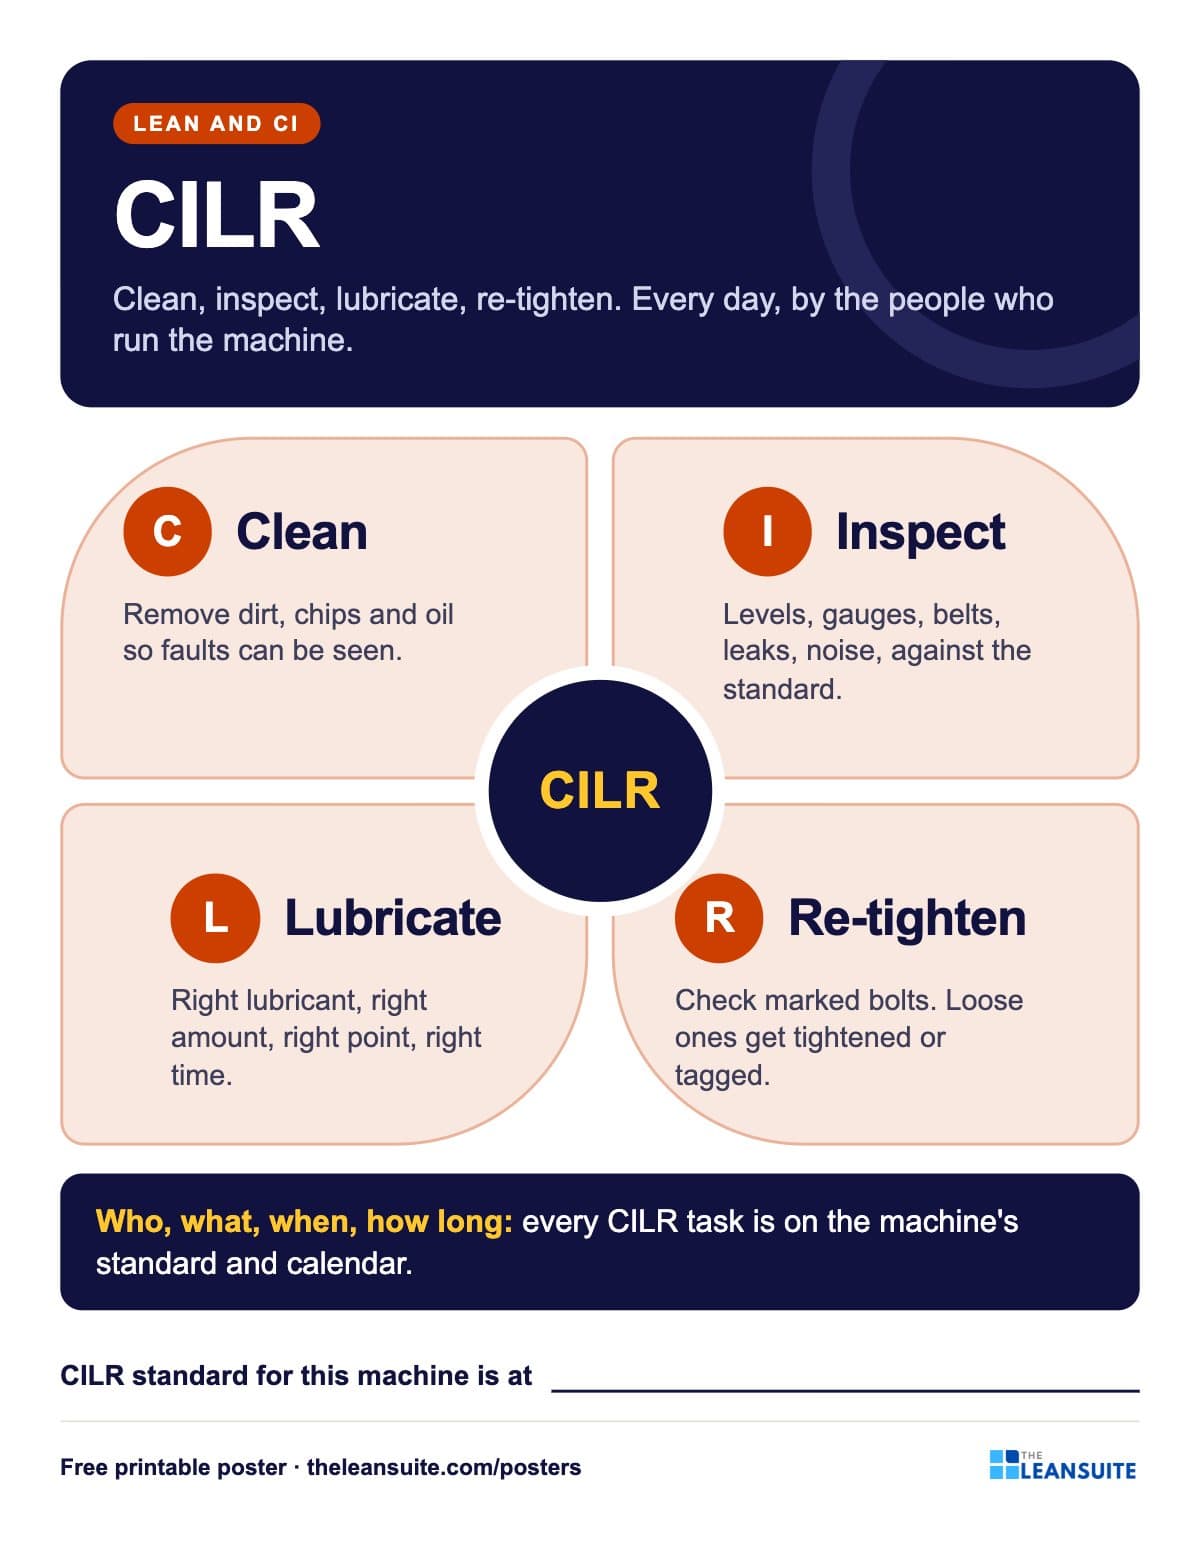 CILR poster: clean, inspect, lubricate, re-tighten
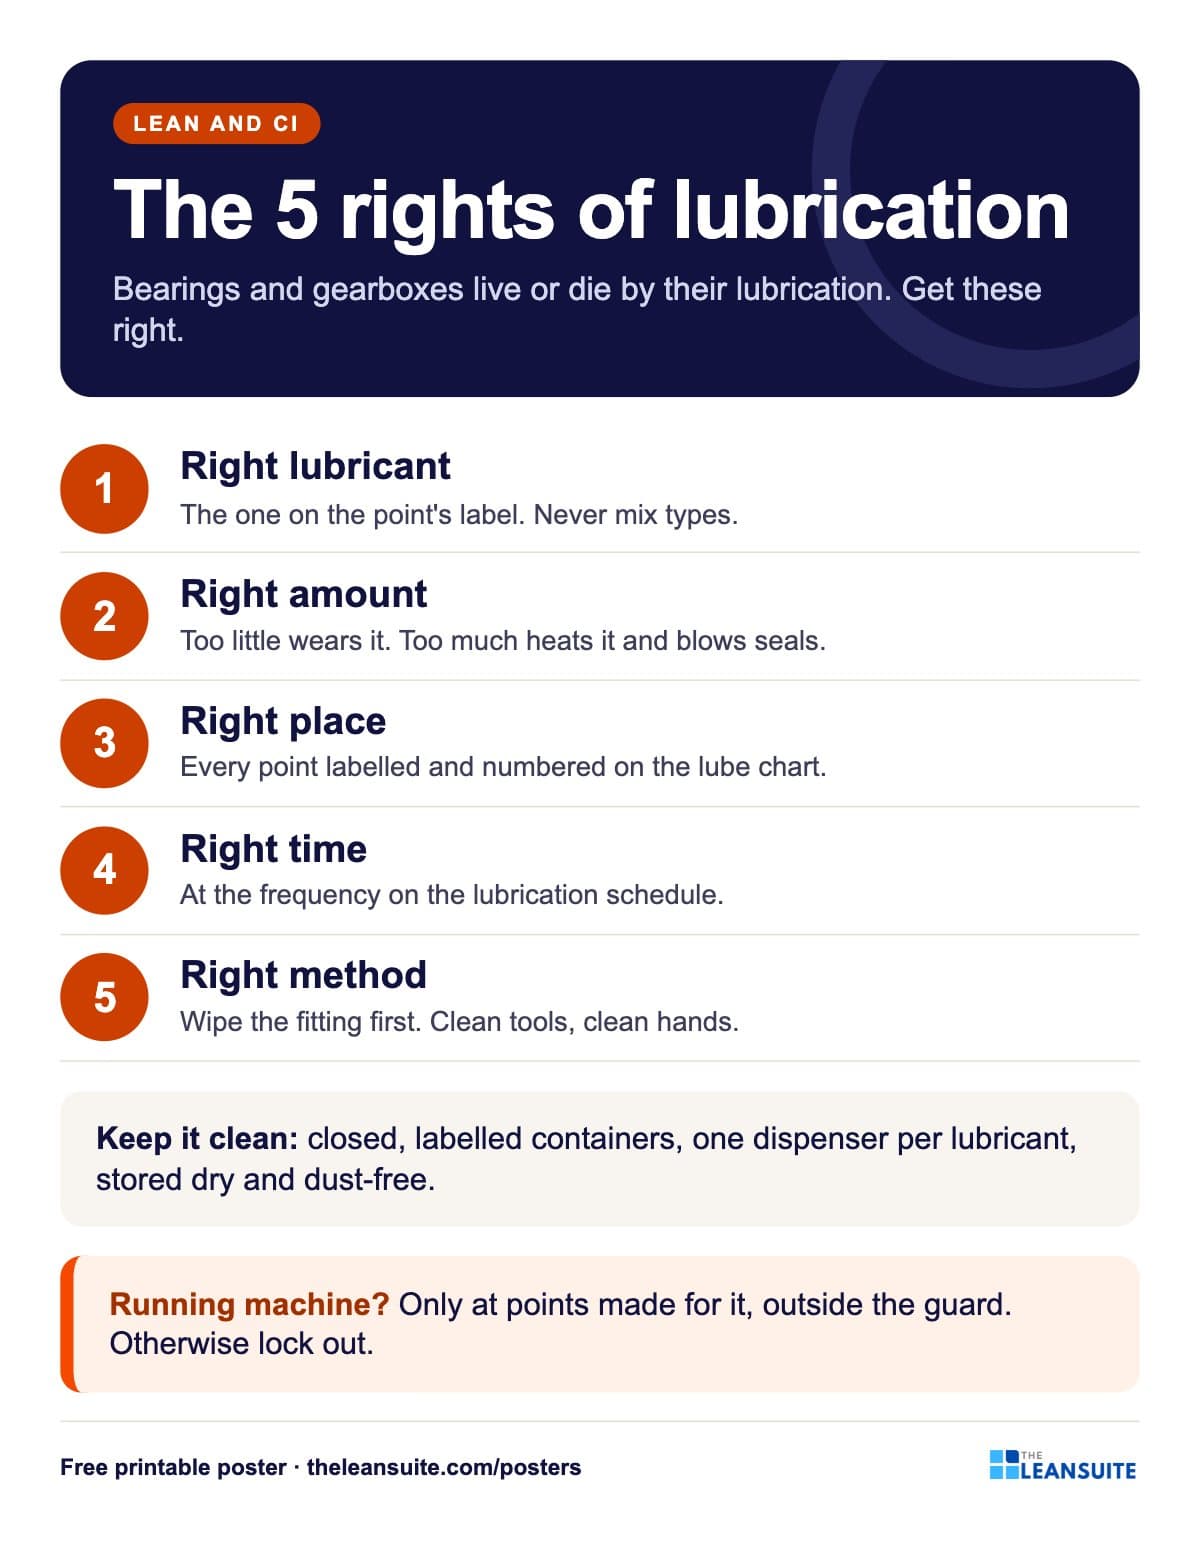 Lubrication basics poster: the five rights
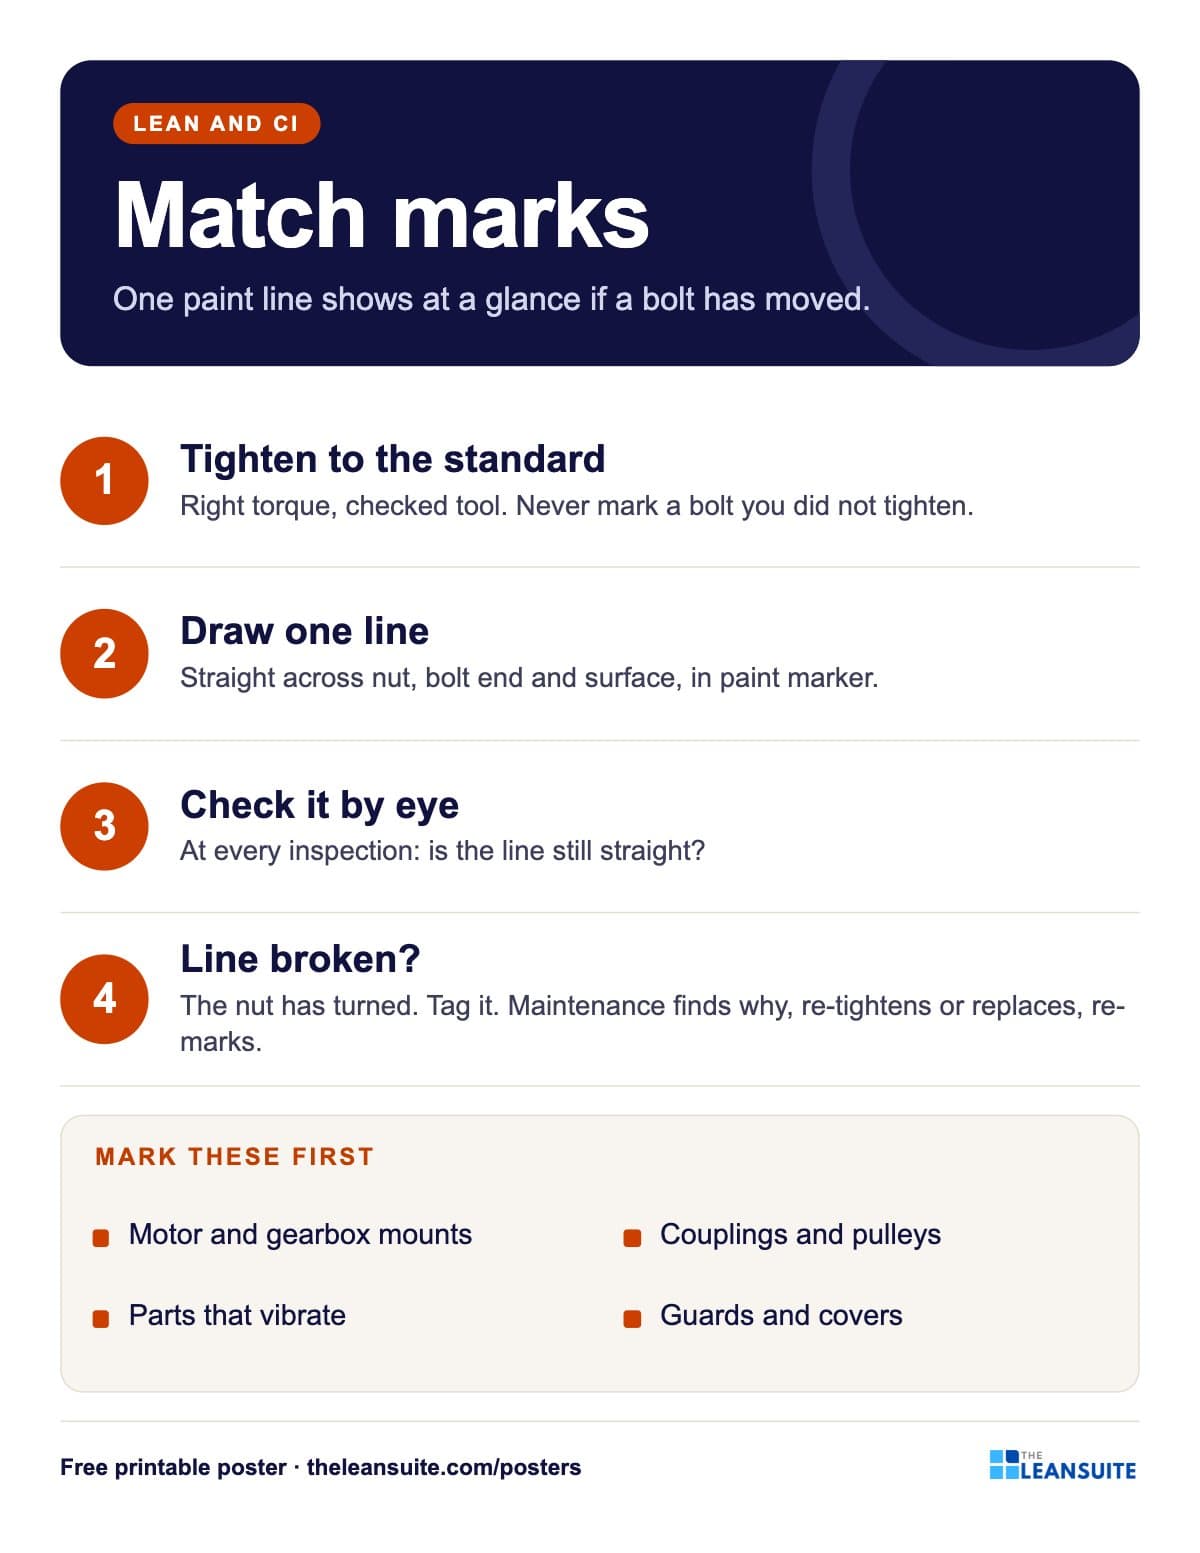 Bolt match marks poster
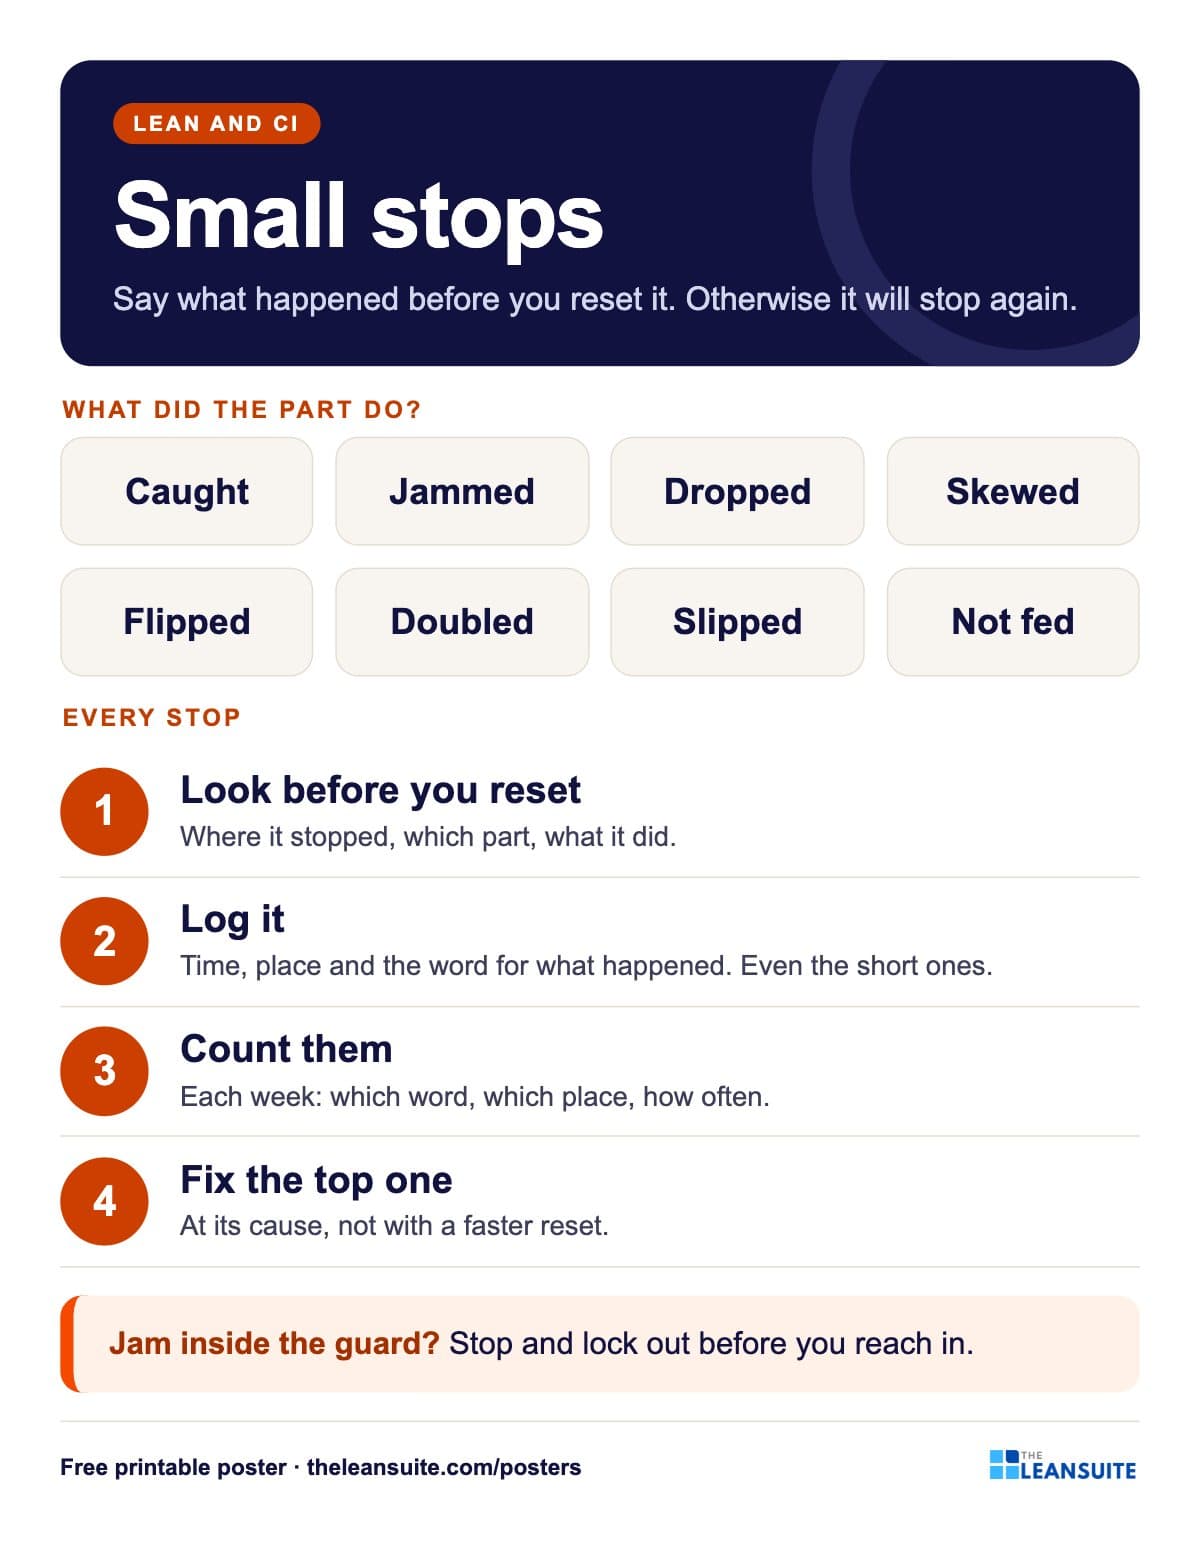 Small stops poster
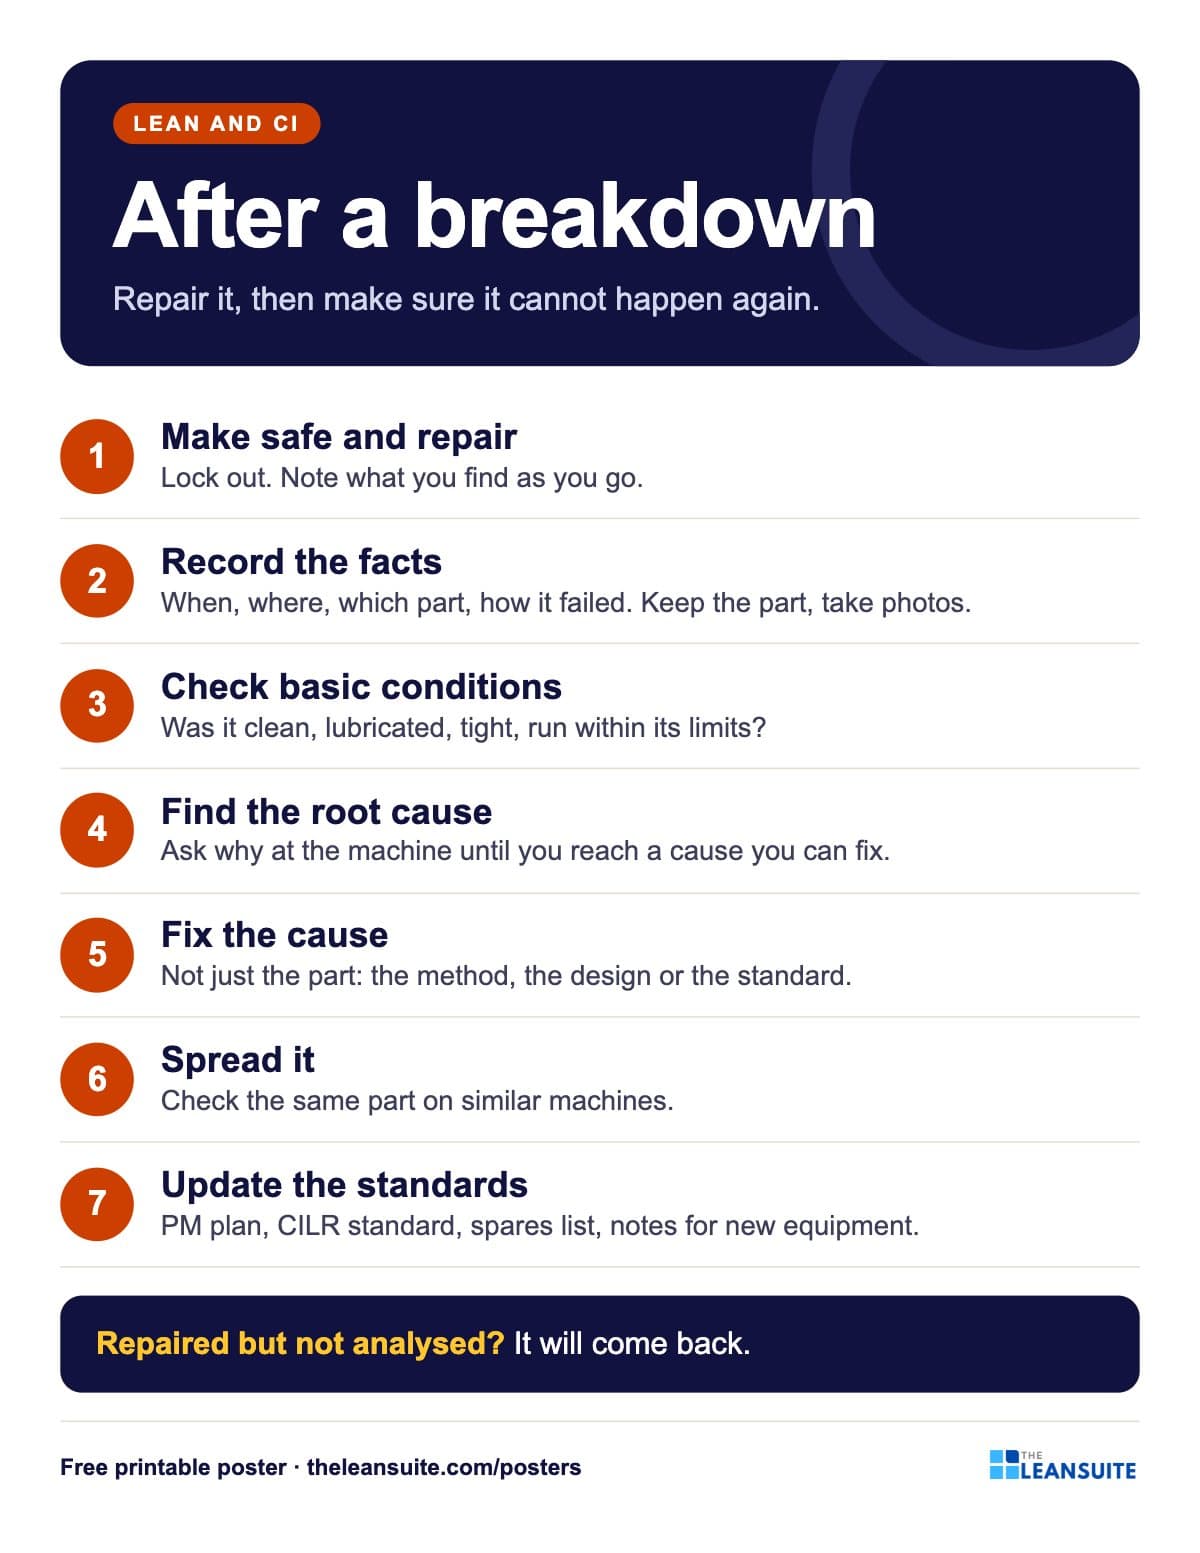 Breakdown analysis poster
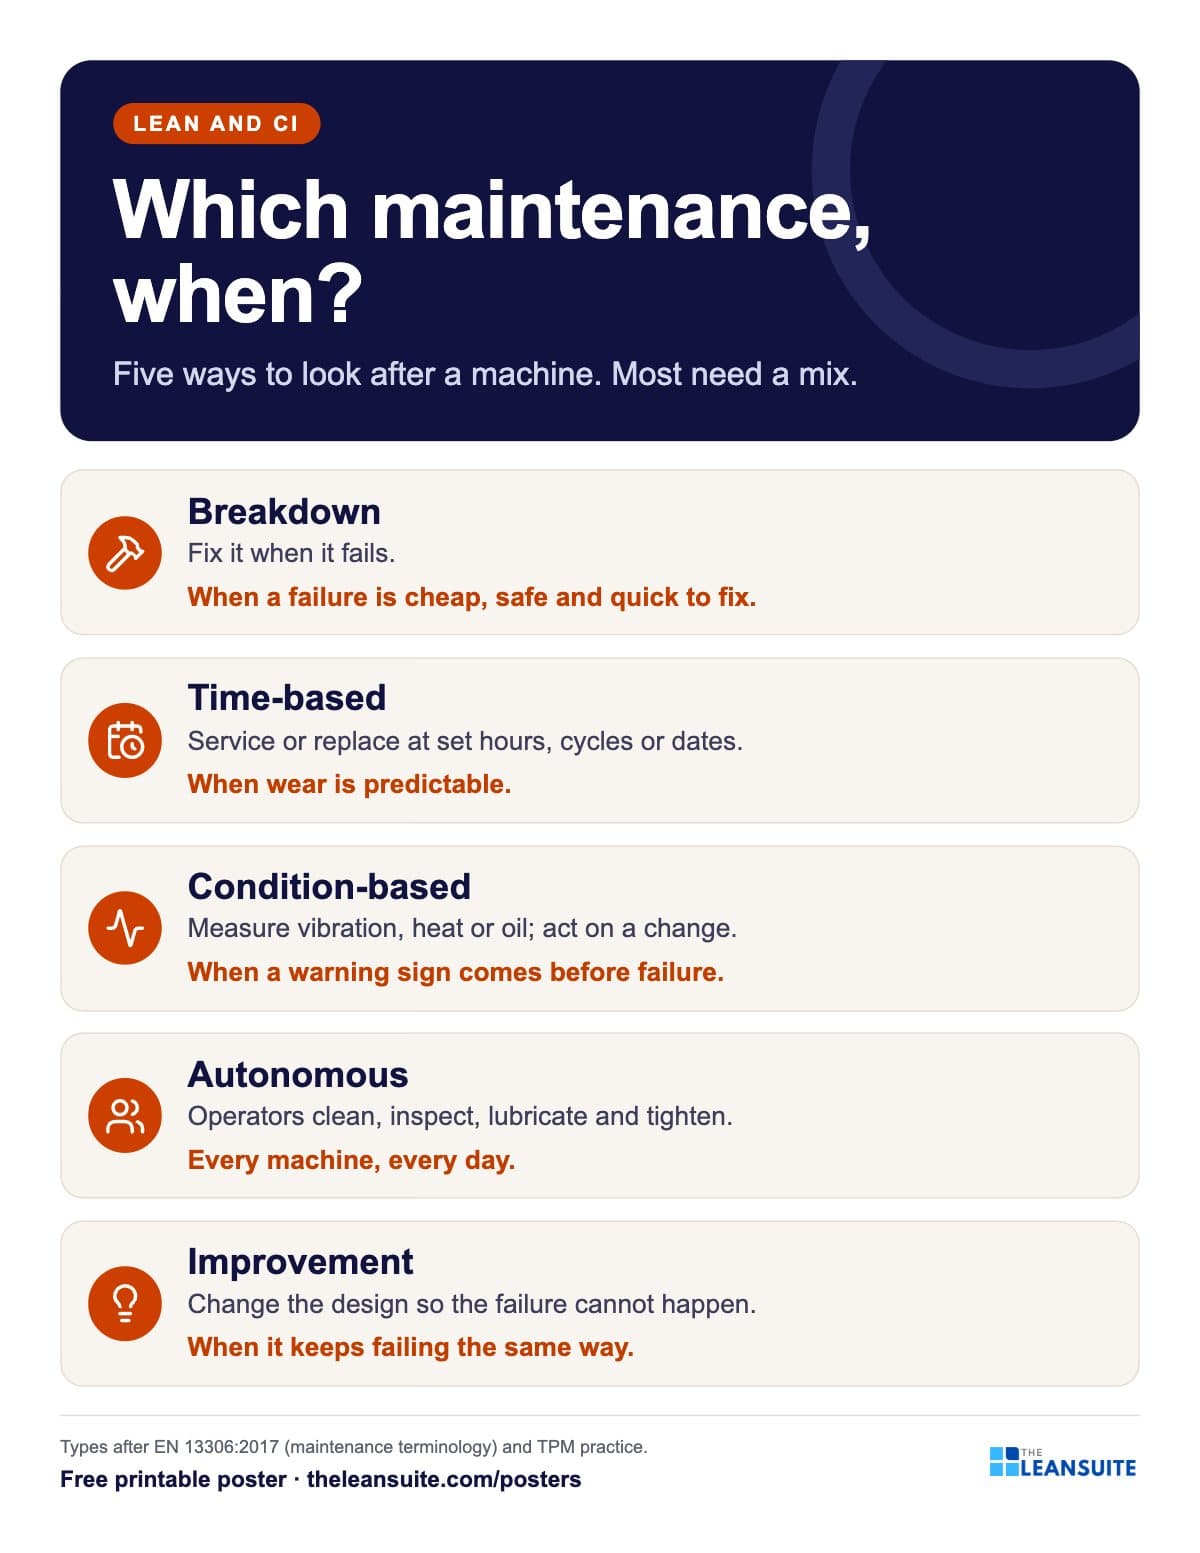 Types of maintenance poster
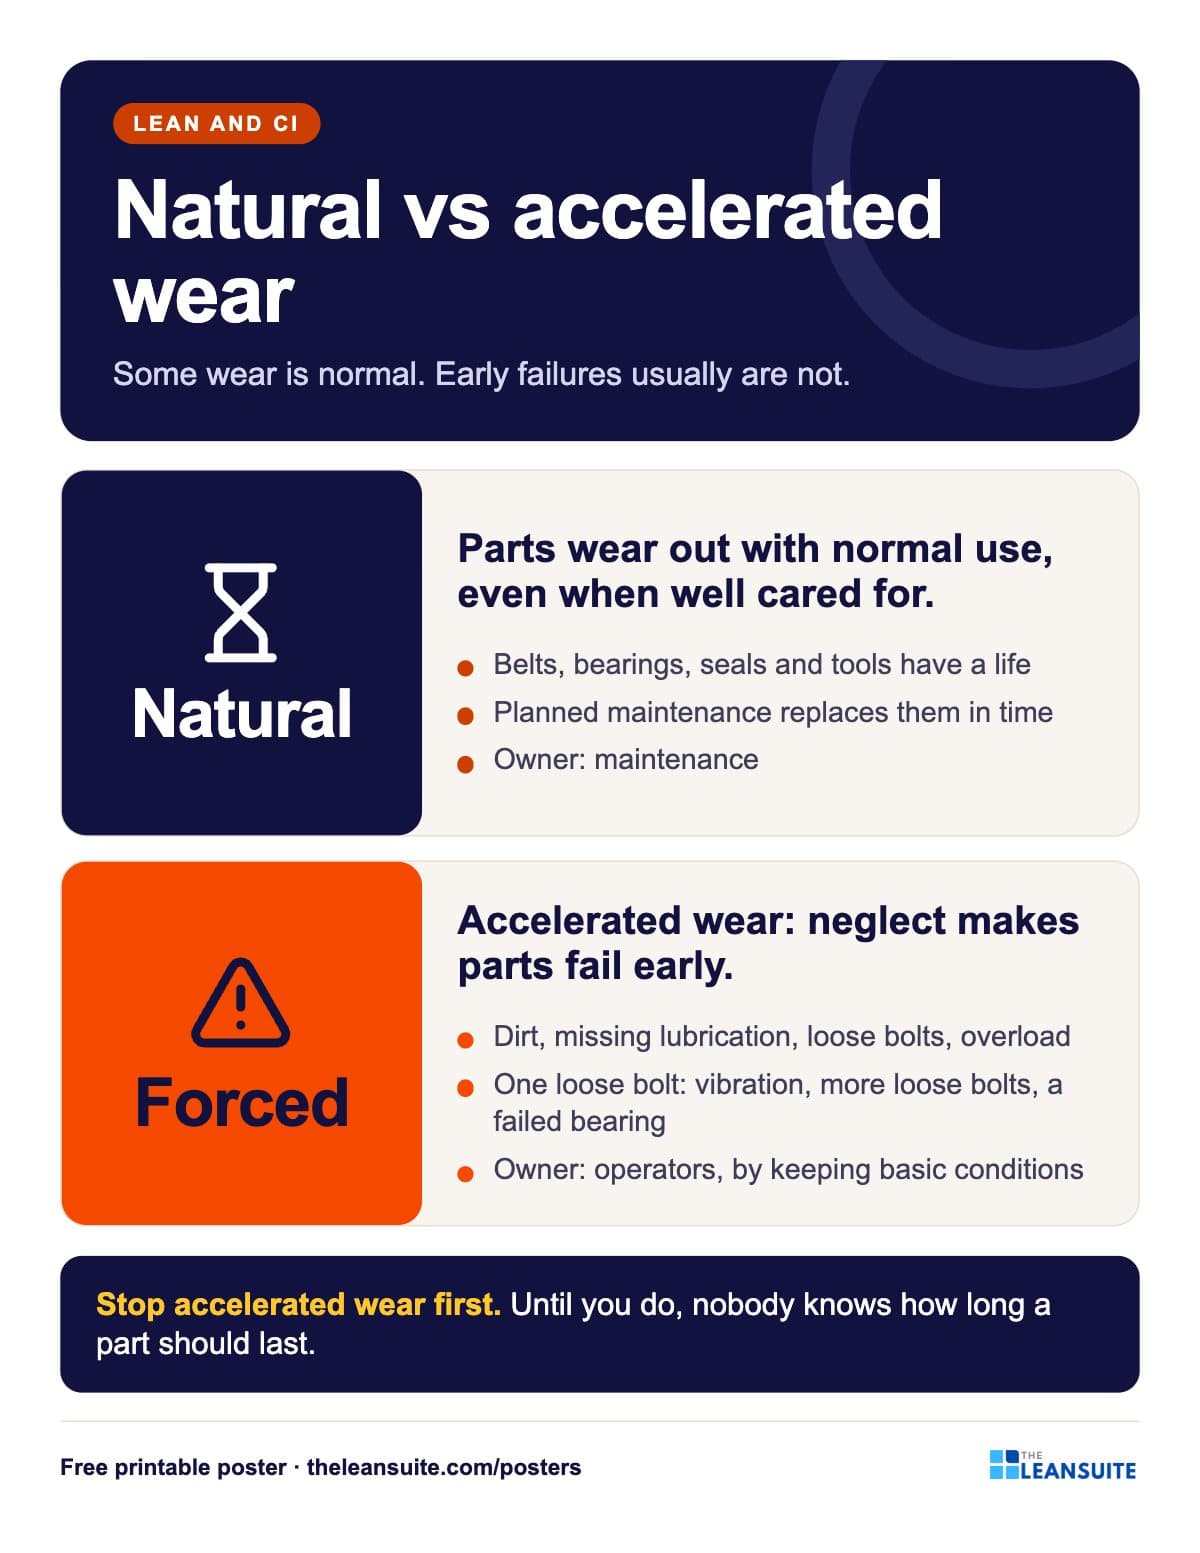 Natural vs accelerated wear poster
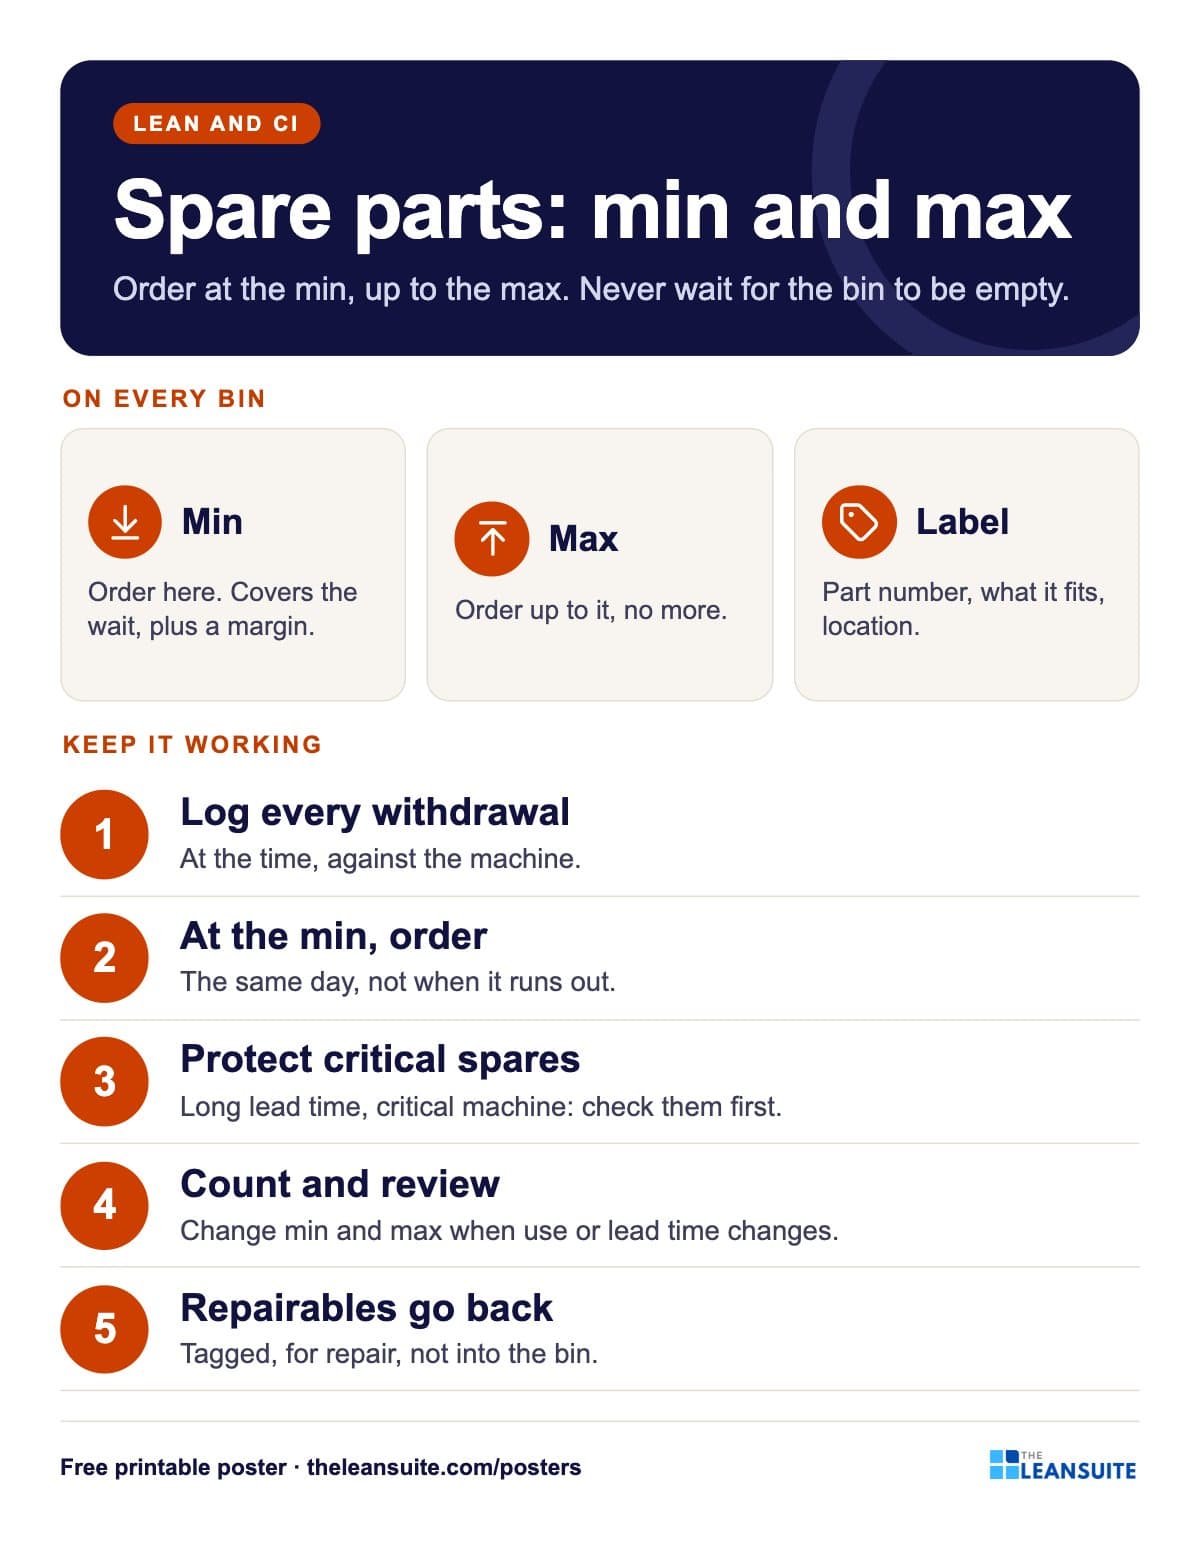 Spare parts min/max poster
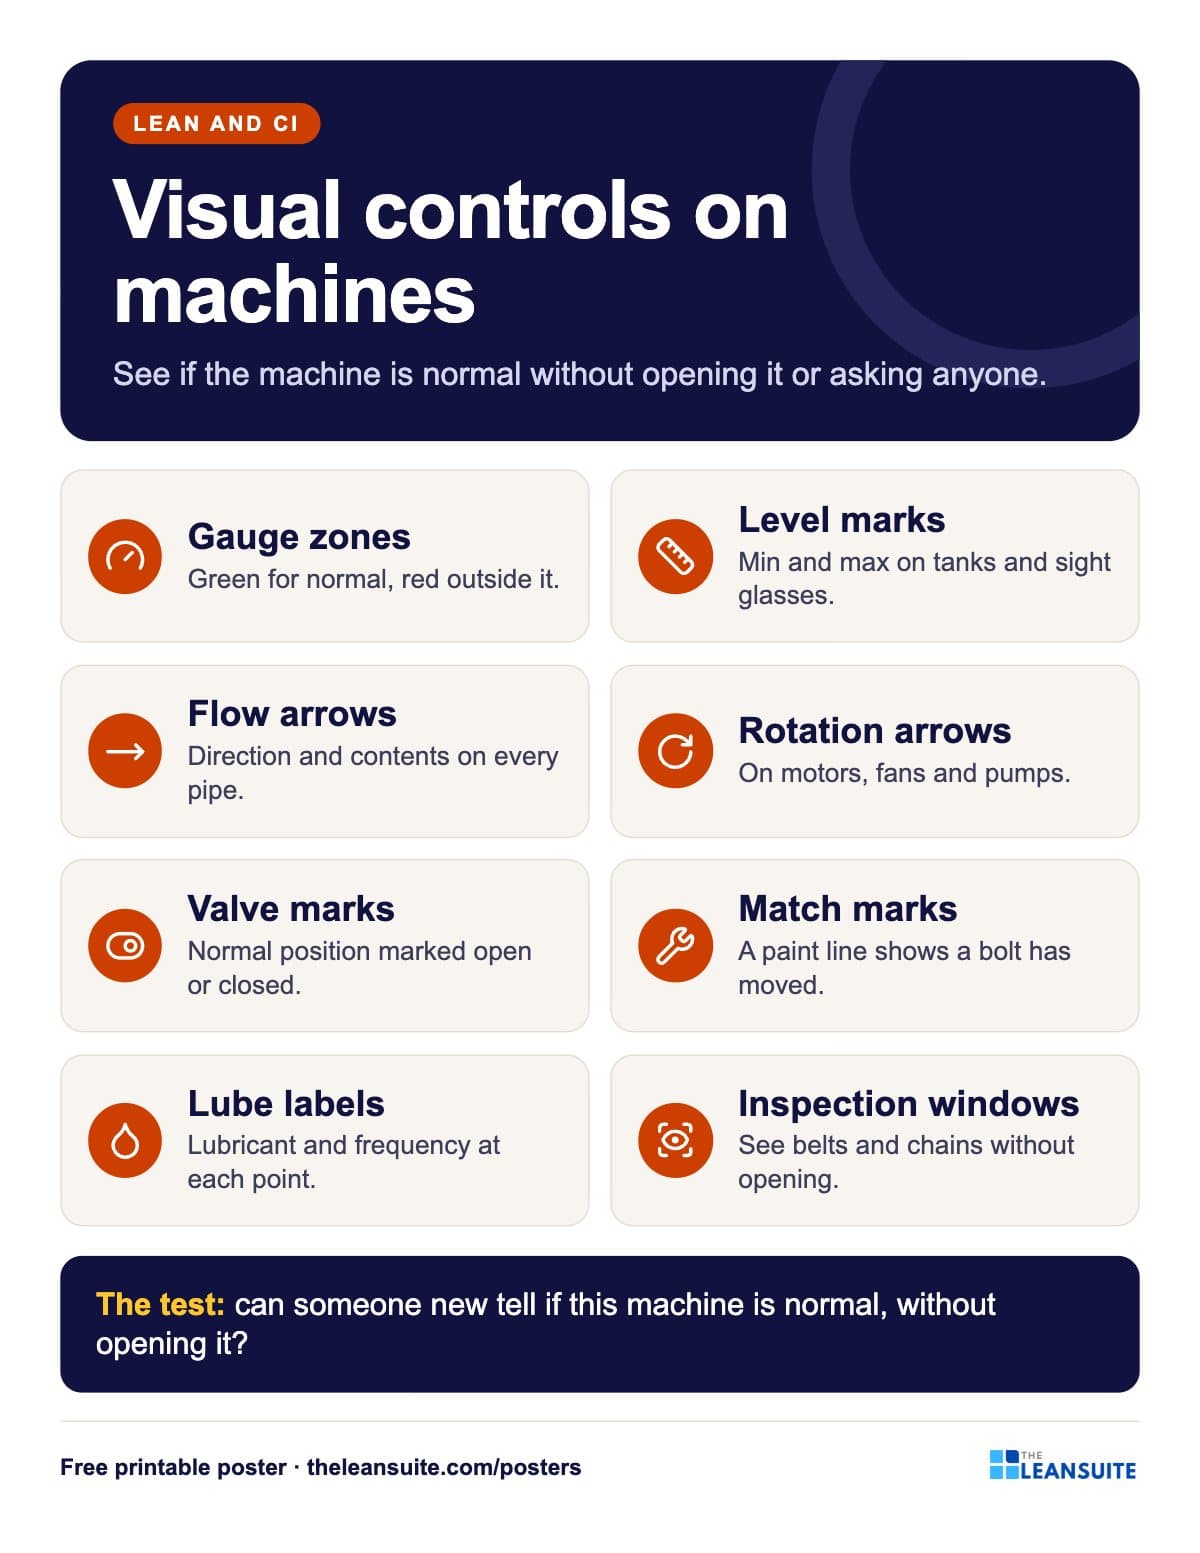 Machine visual controls poster
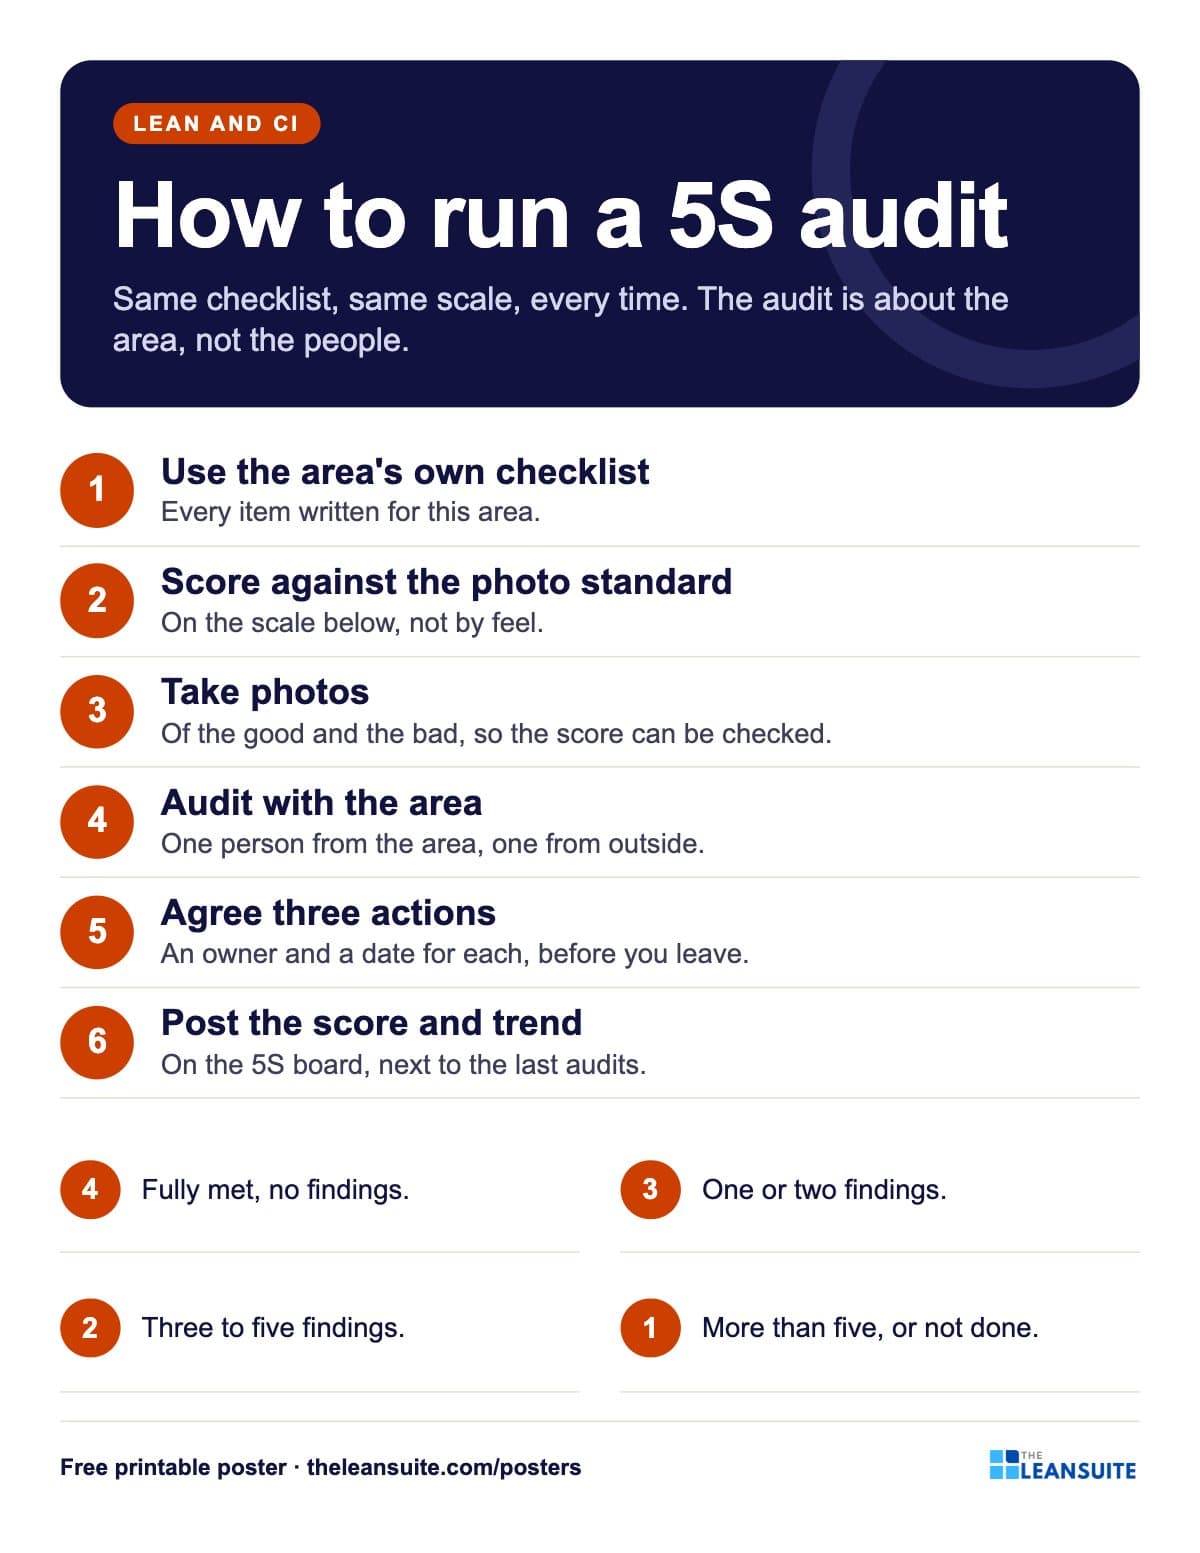 How to run a 5S audit poster
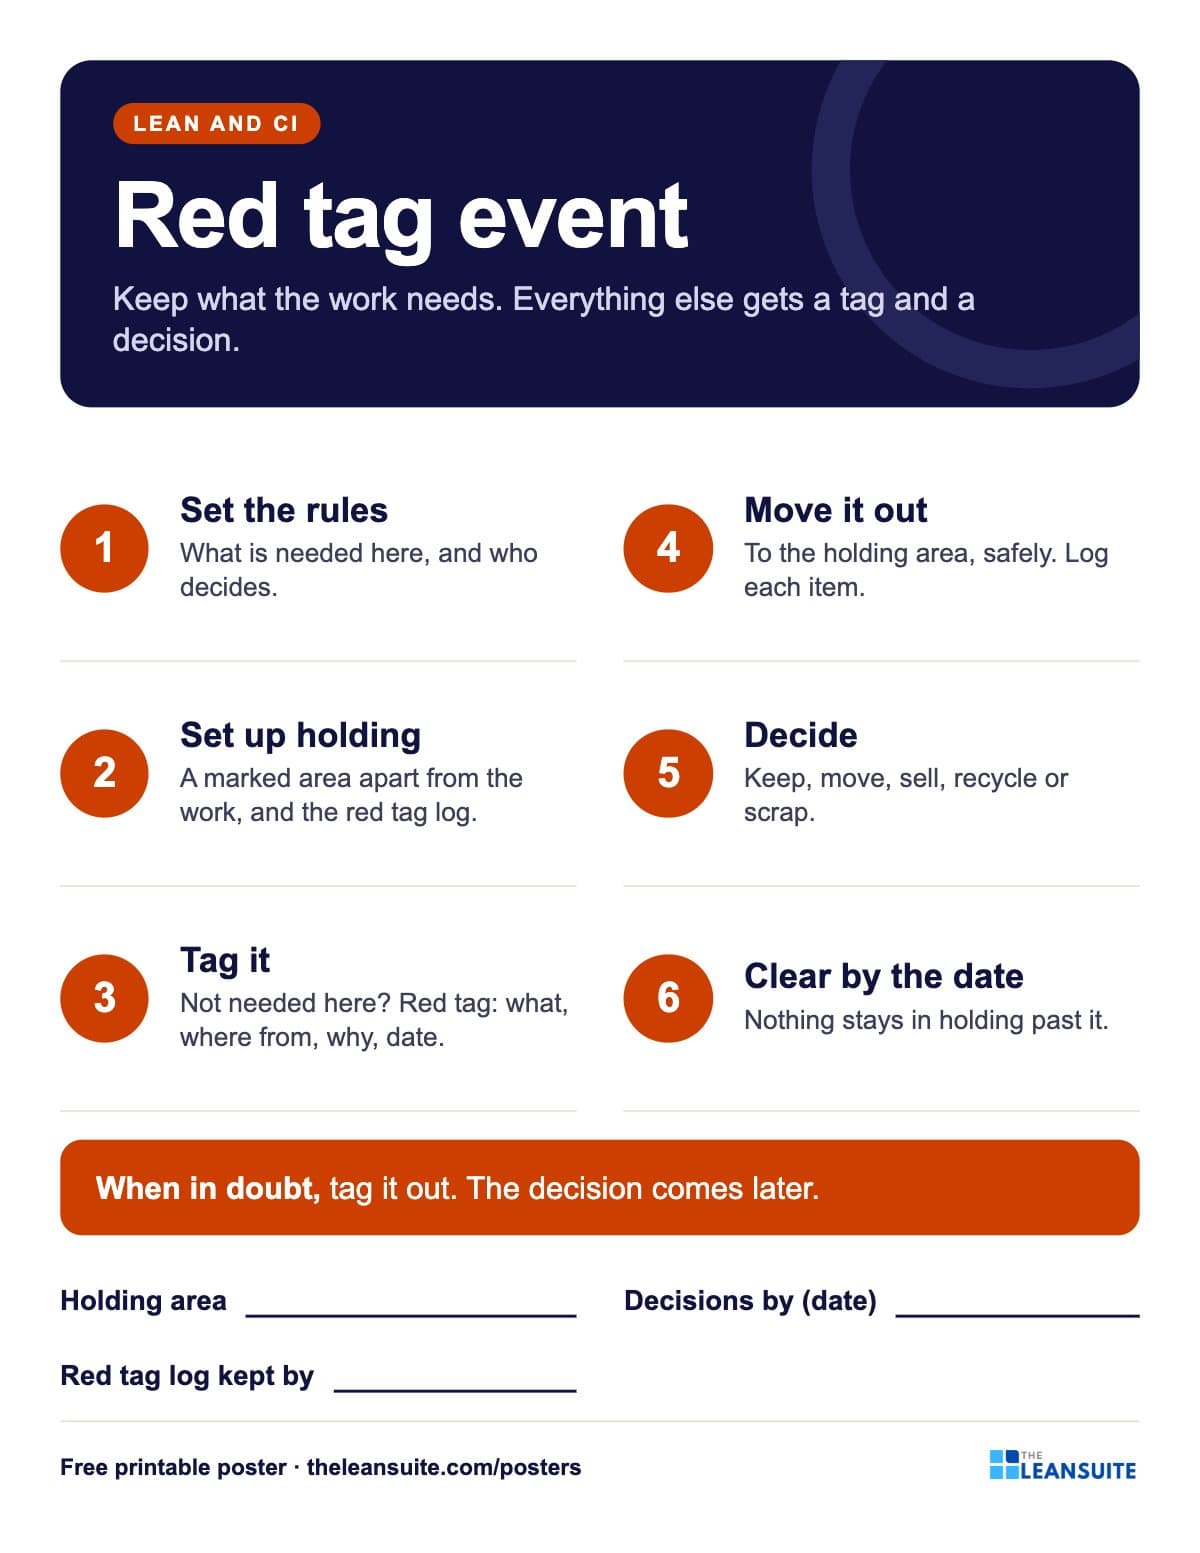 Red tag event poster
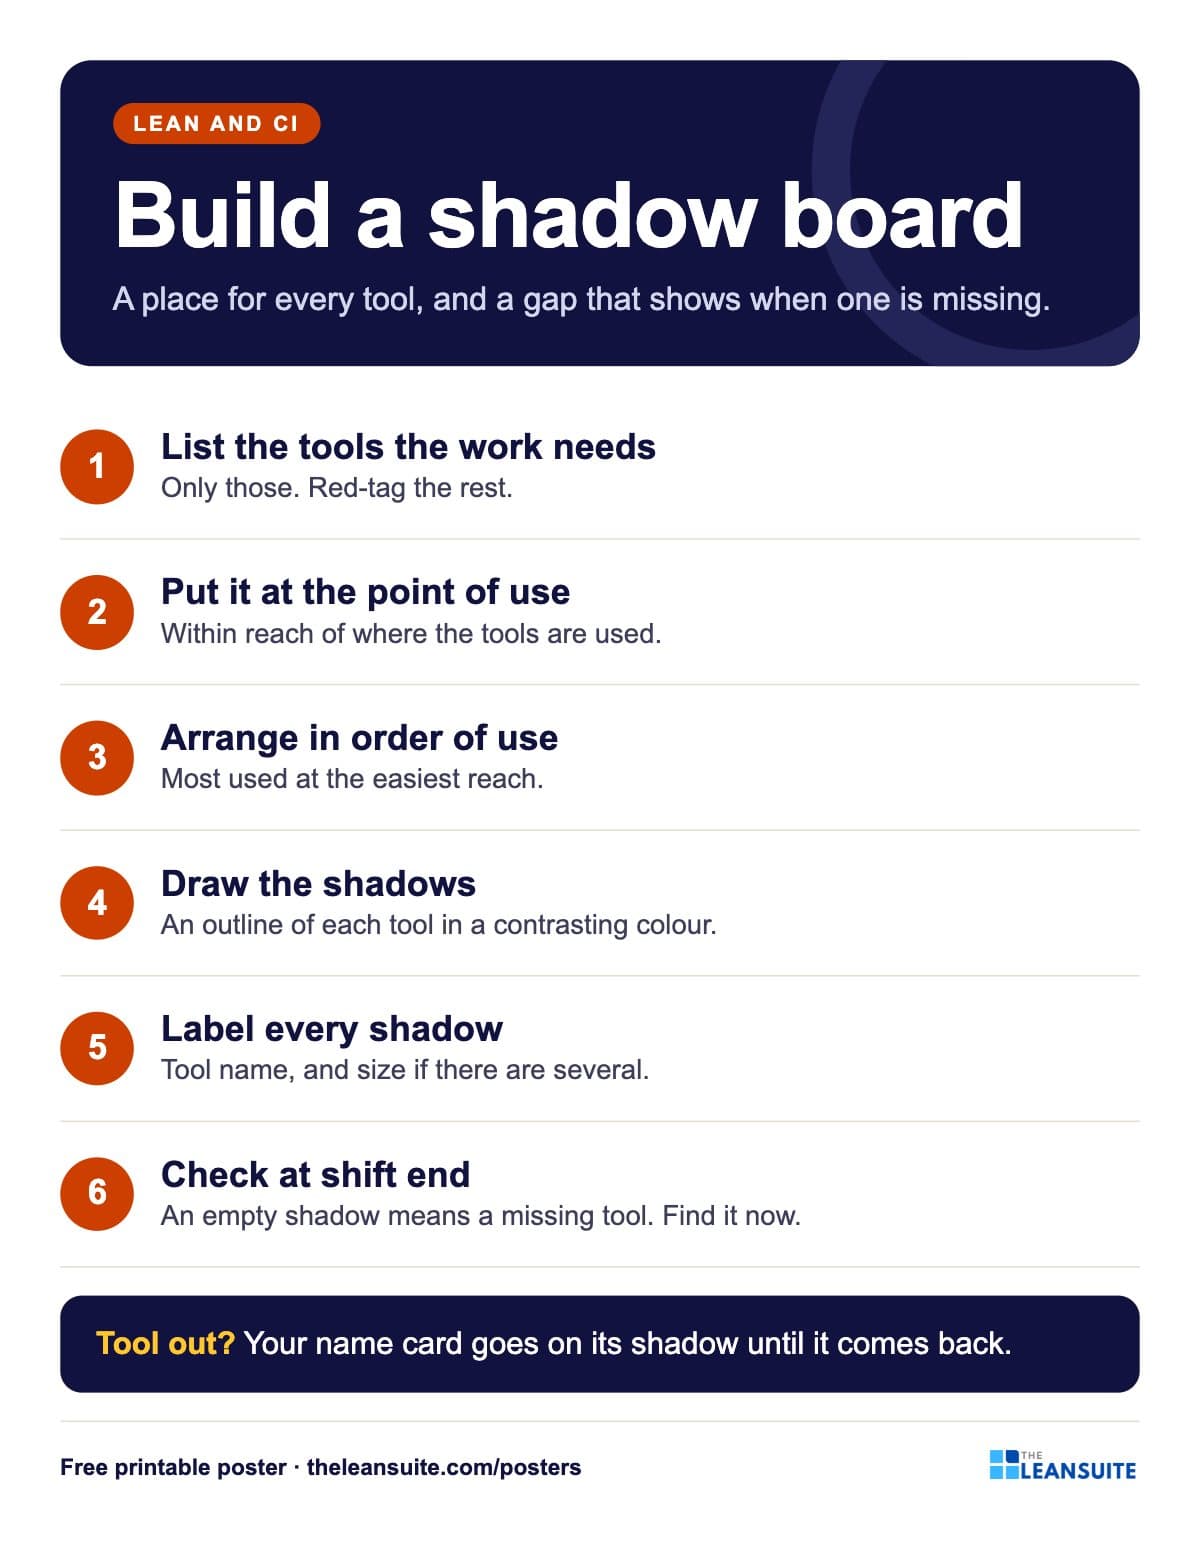 Shadow board poster
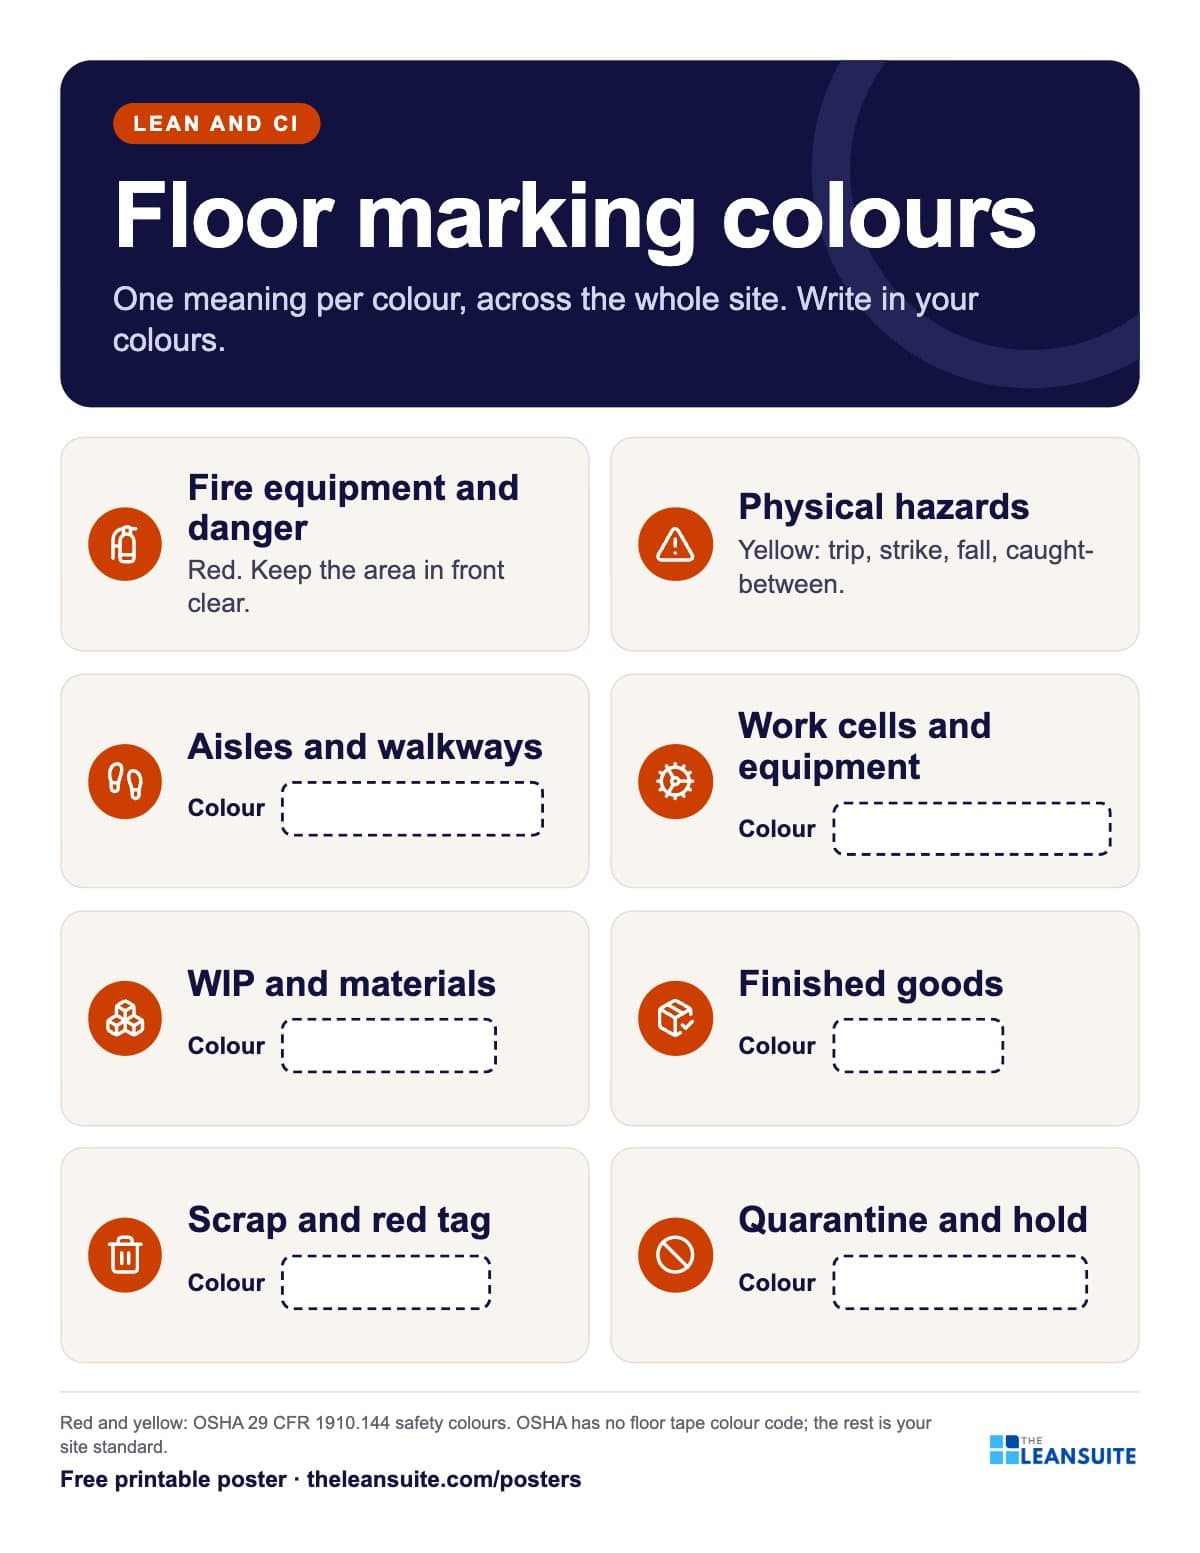 Floor marking colours poster
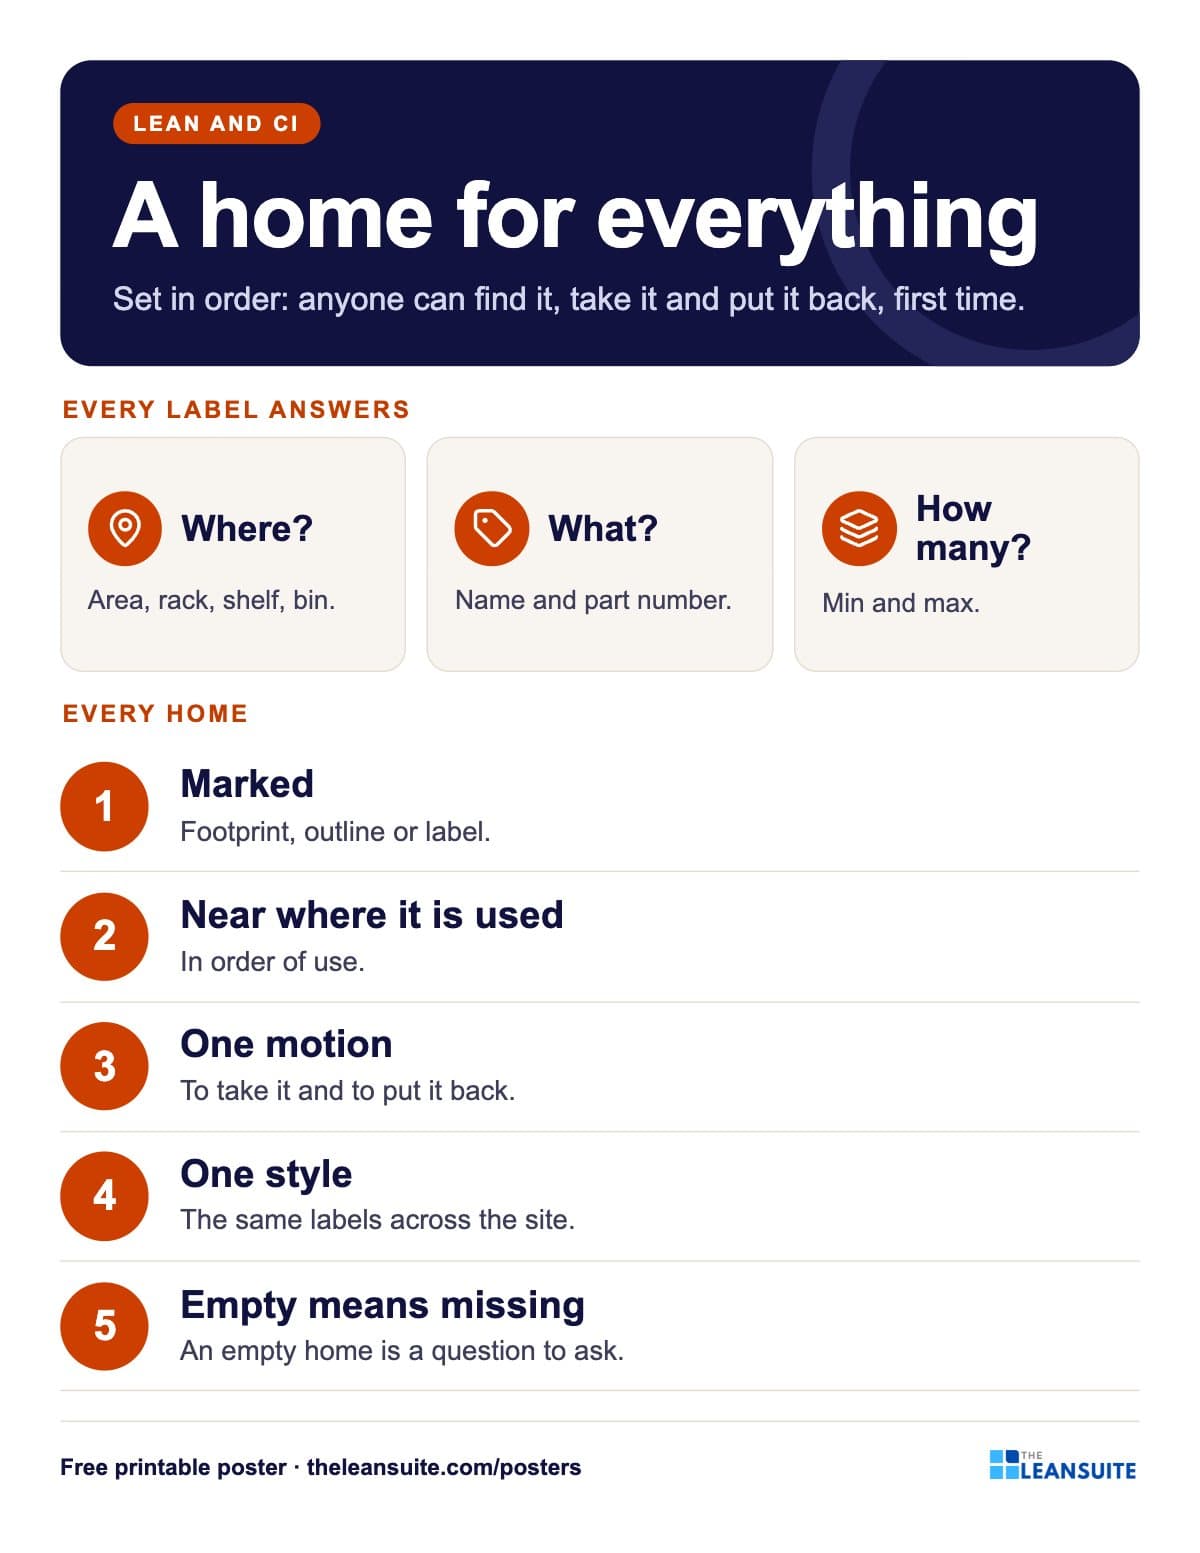 Set in order poster: where, what, how many
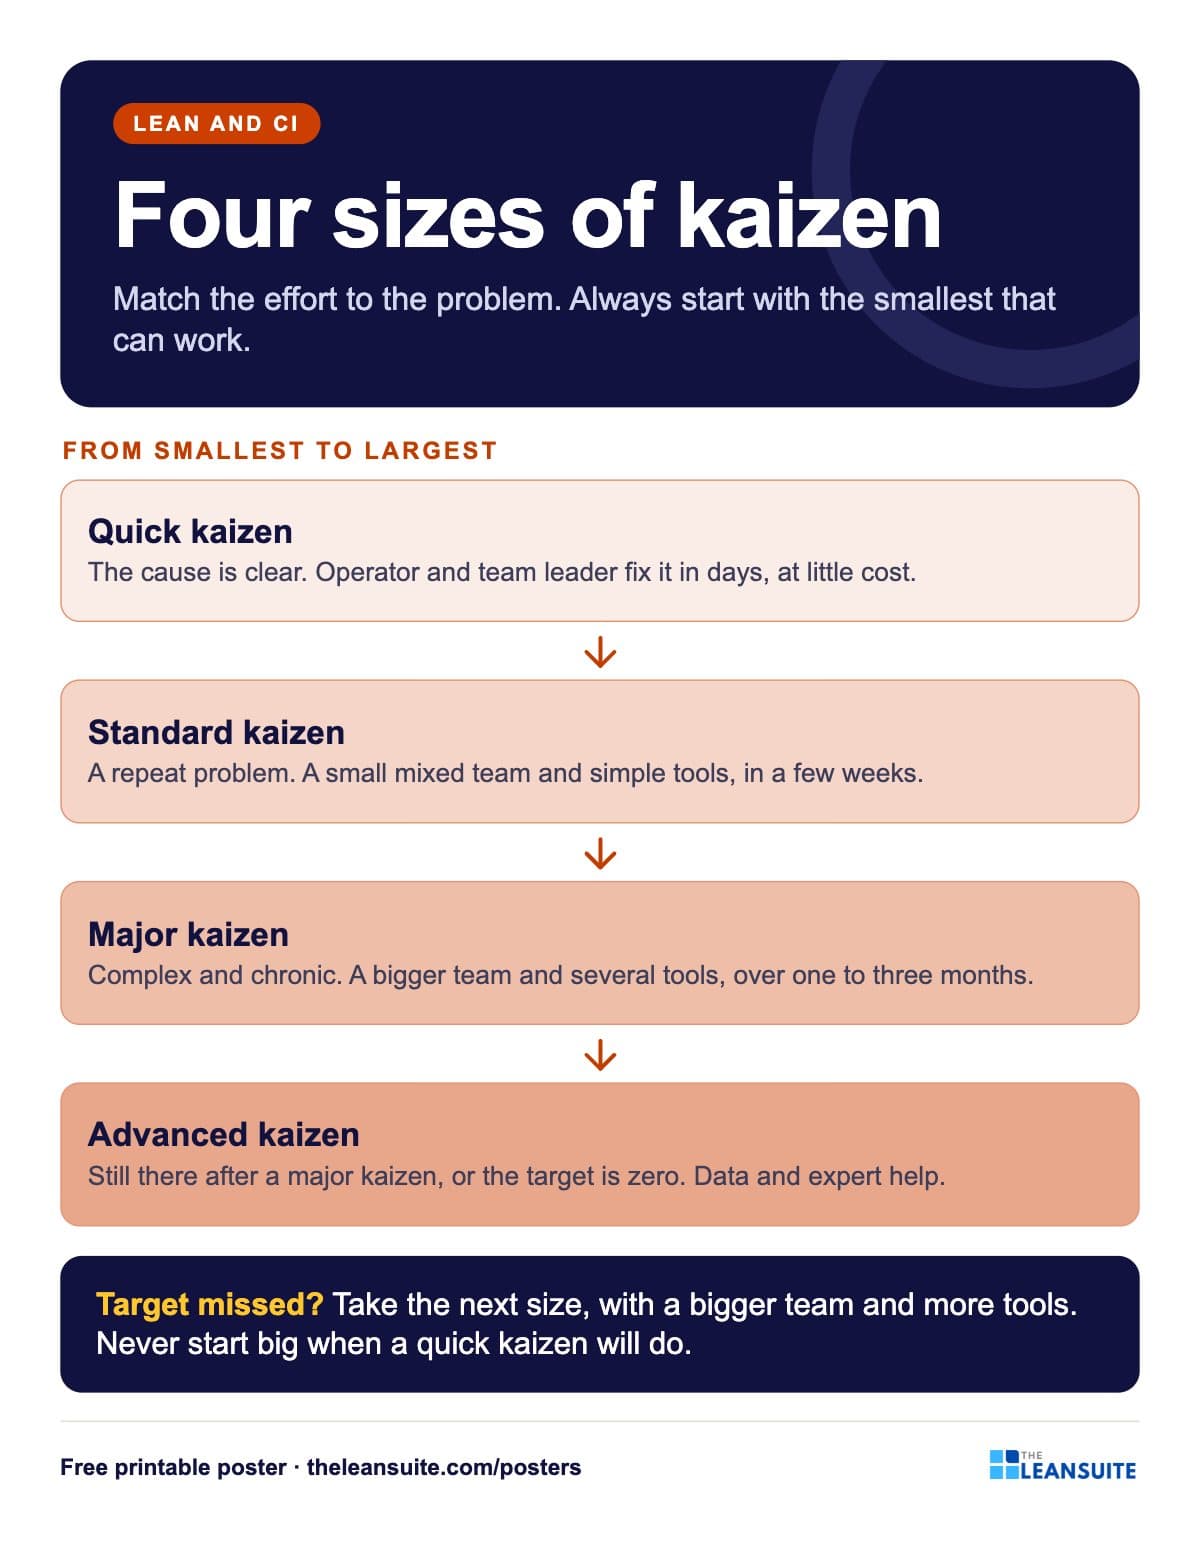 Kaizen sizes poster
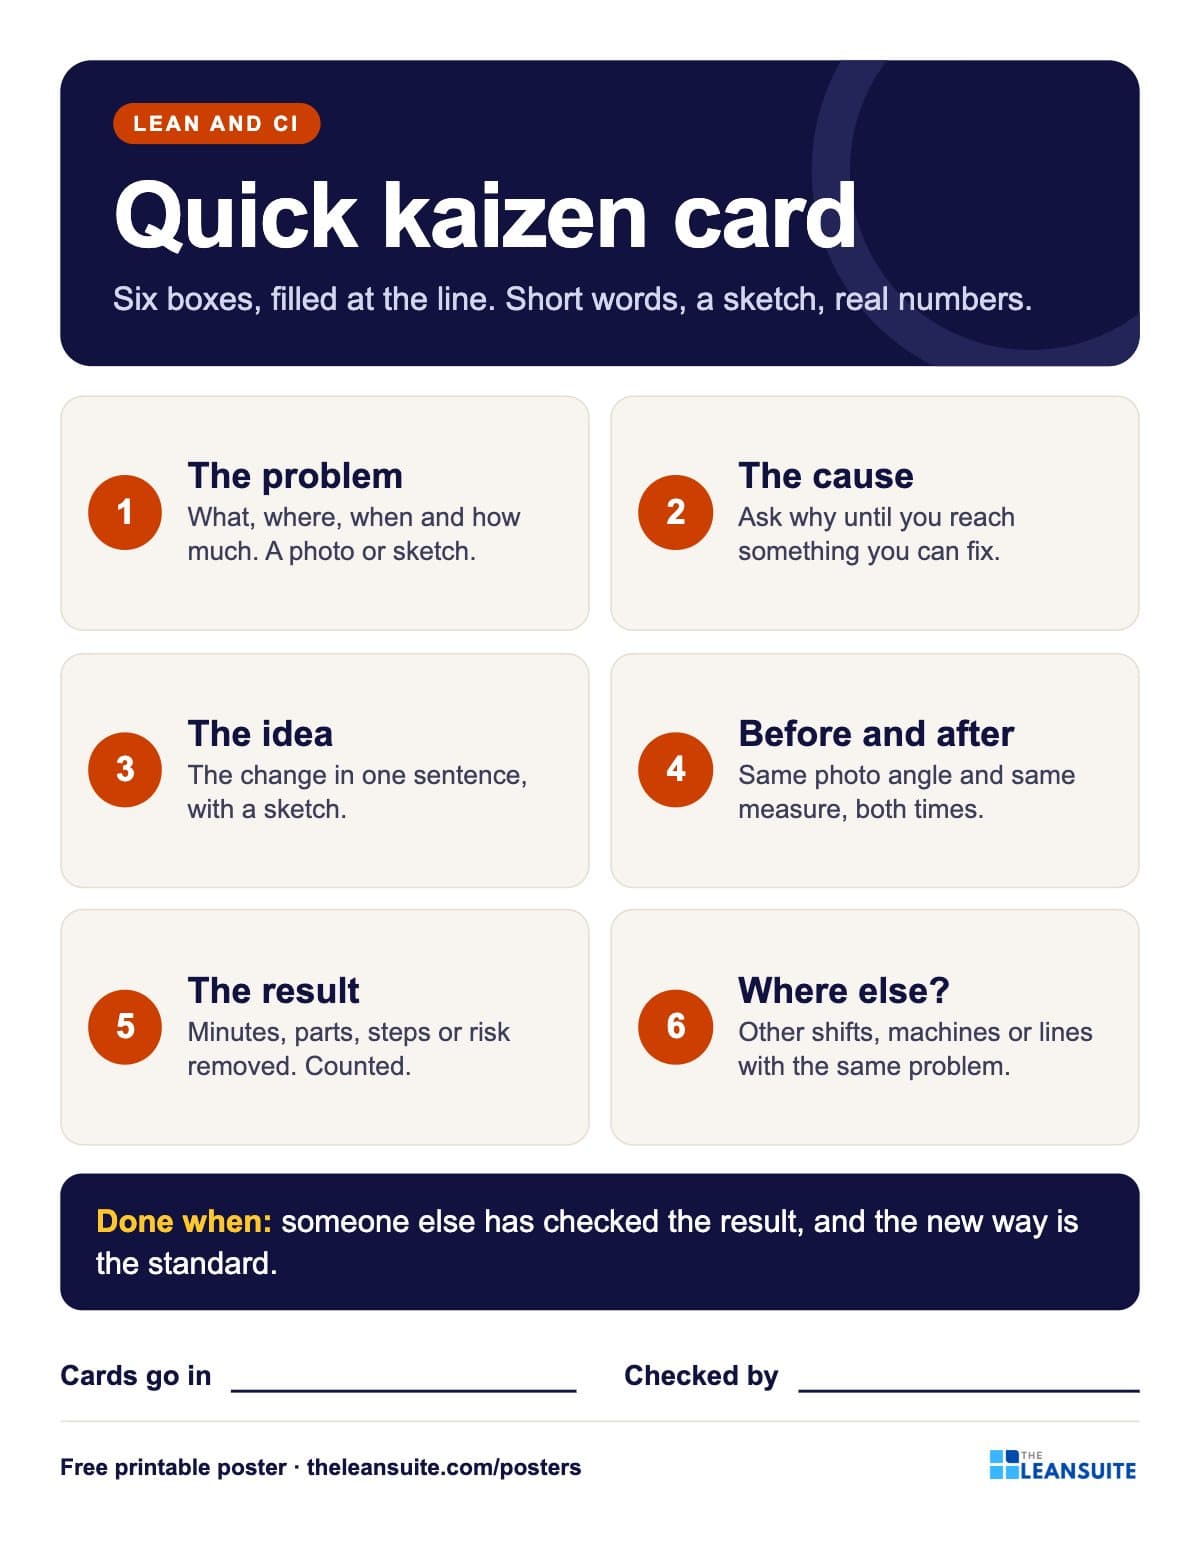 Quick kaizen card poster
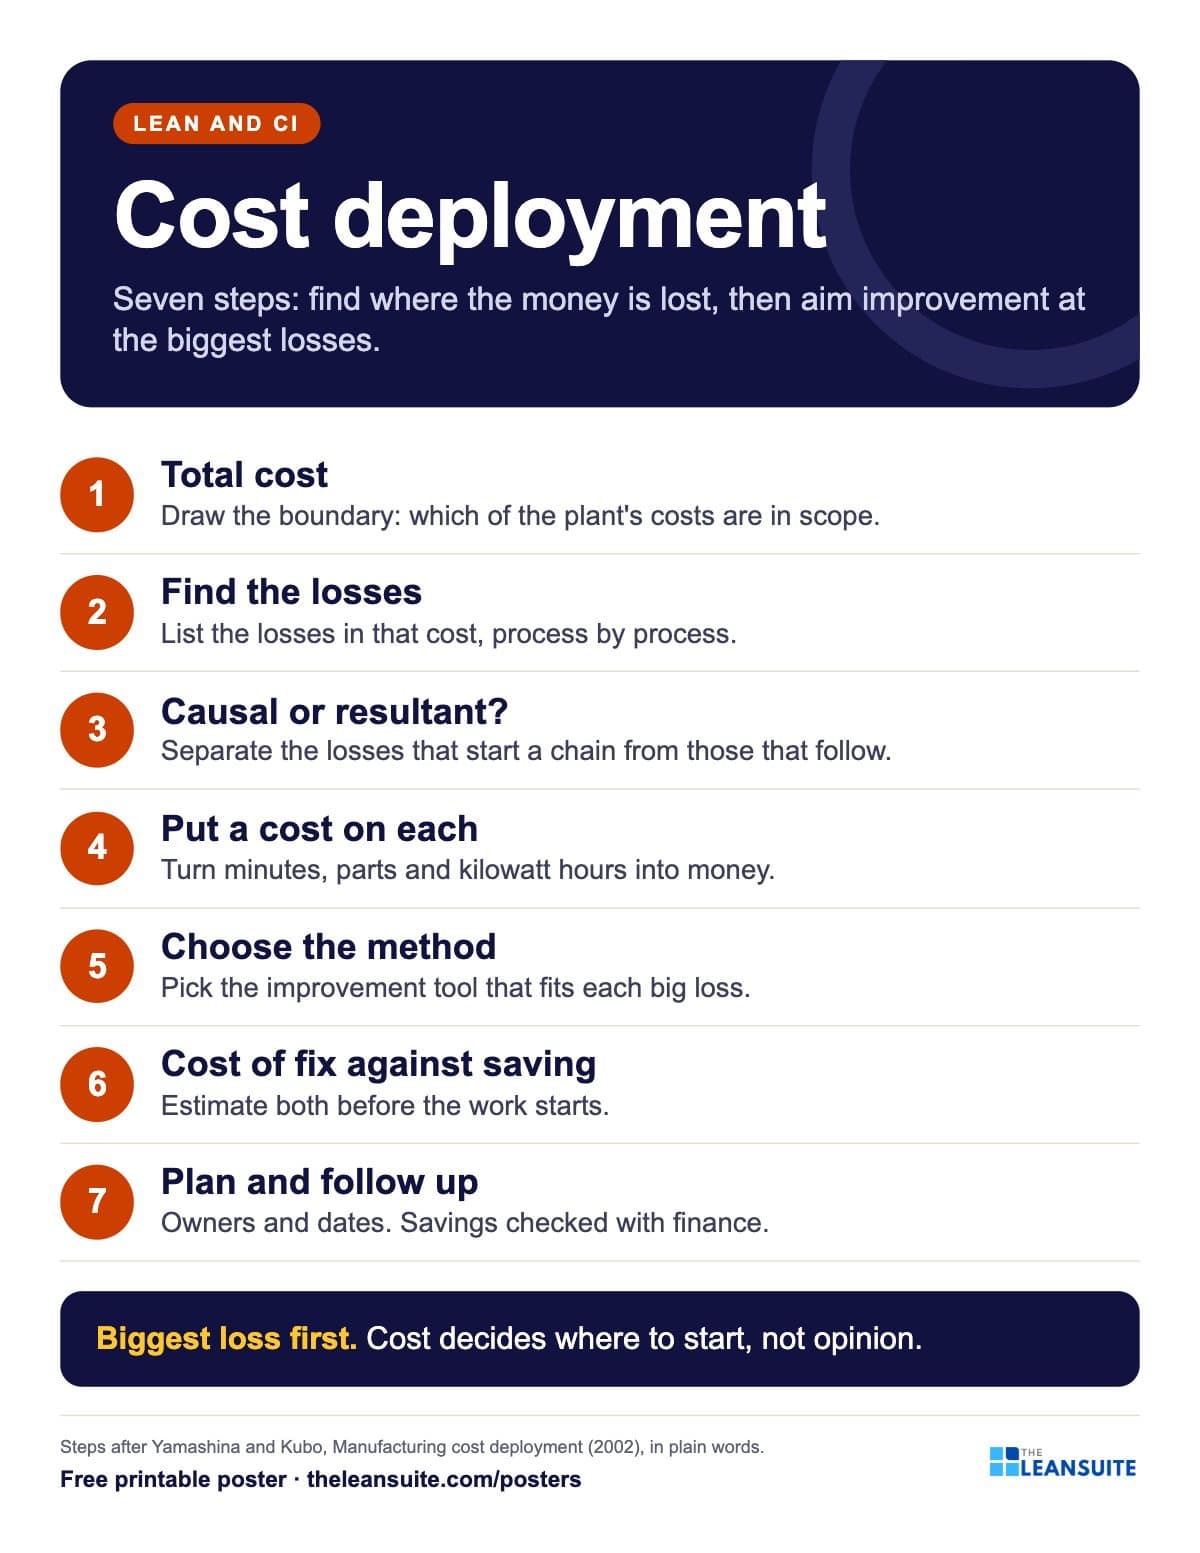 Cost deployment 7 steps poster
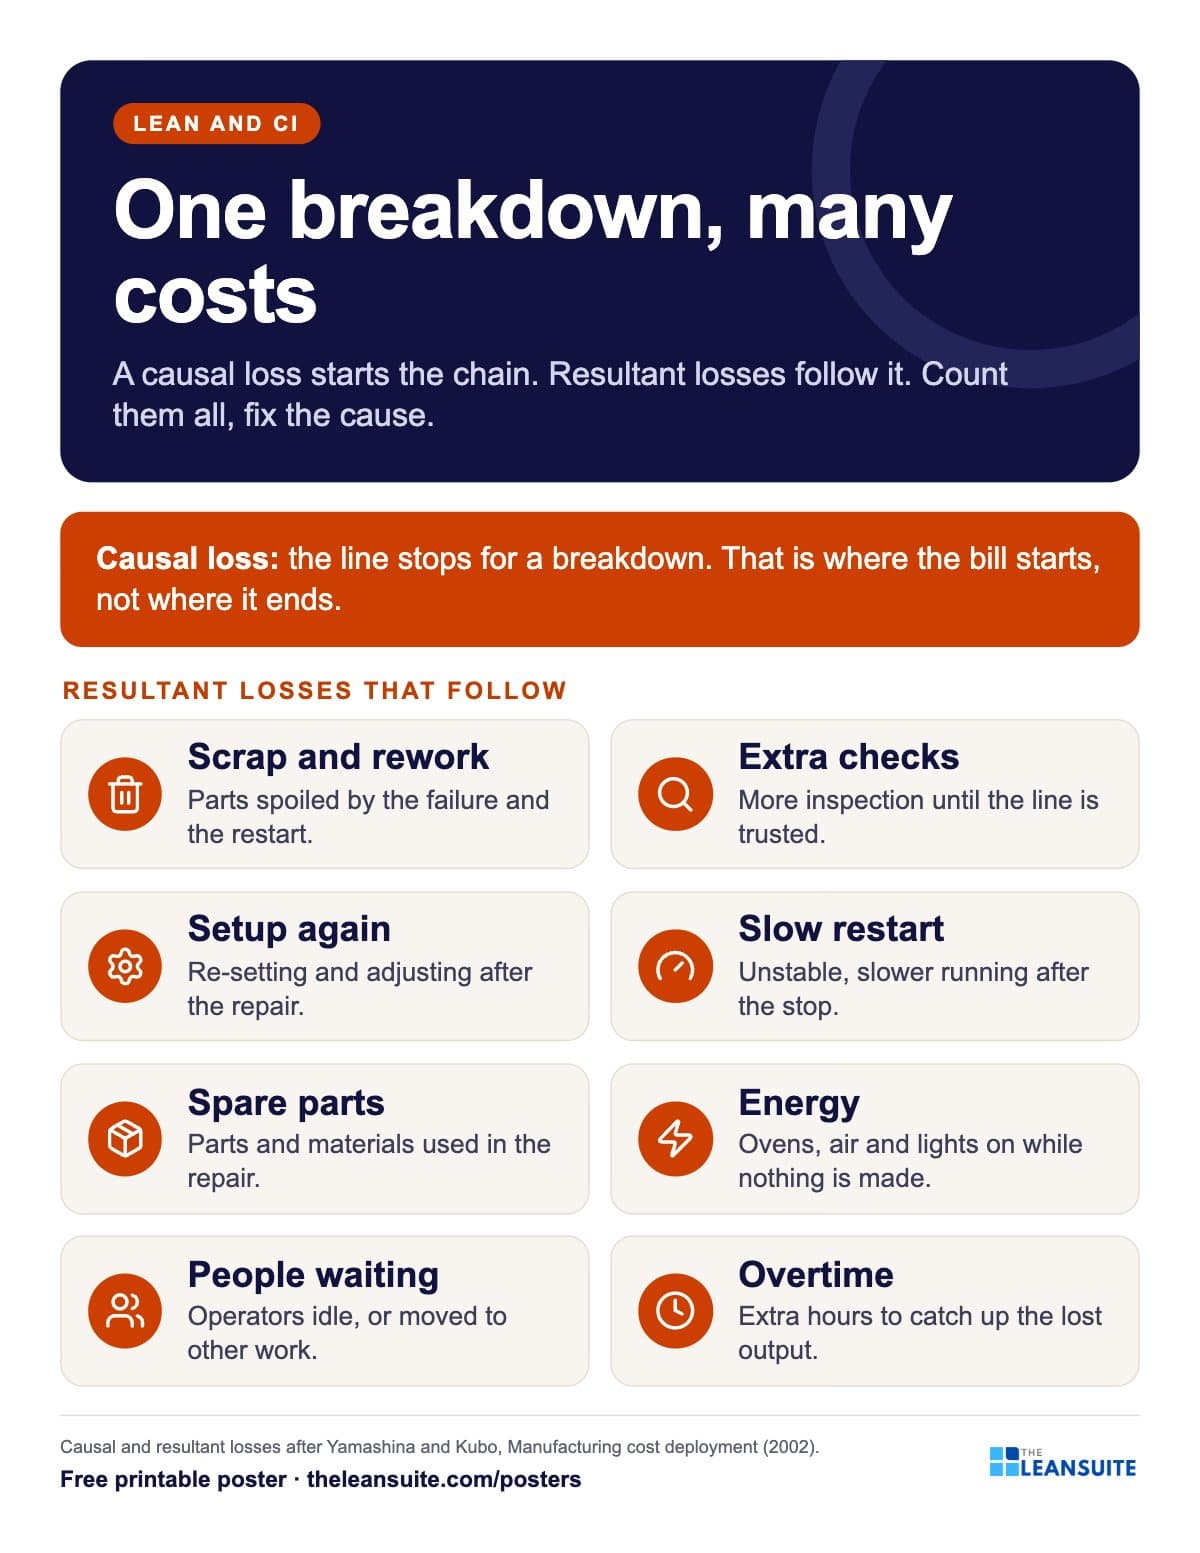 Causal and resultant losses poster
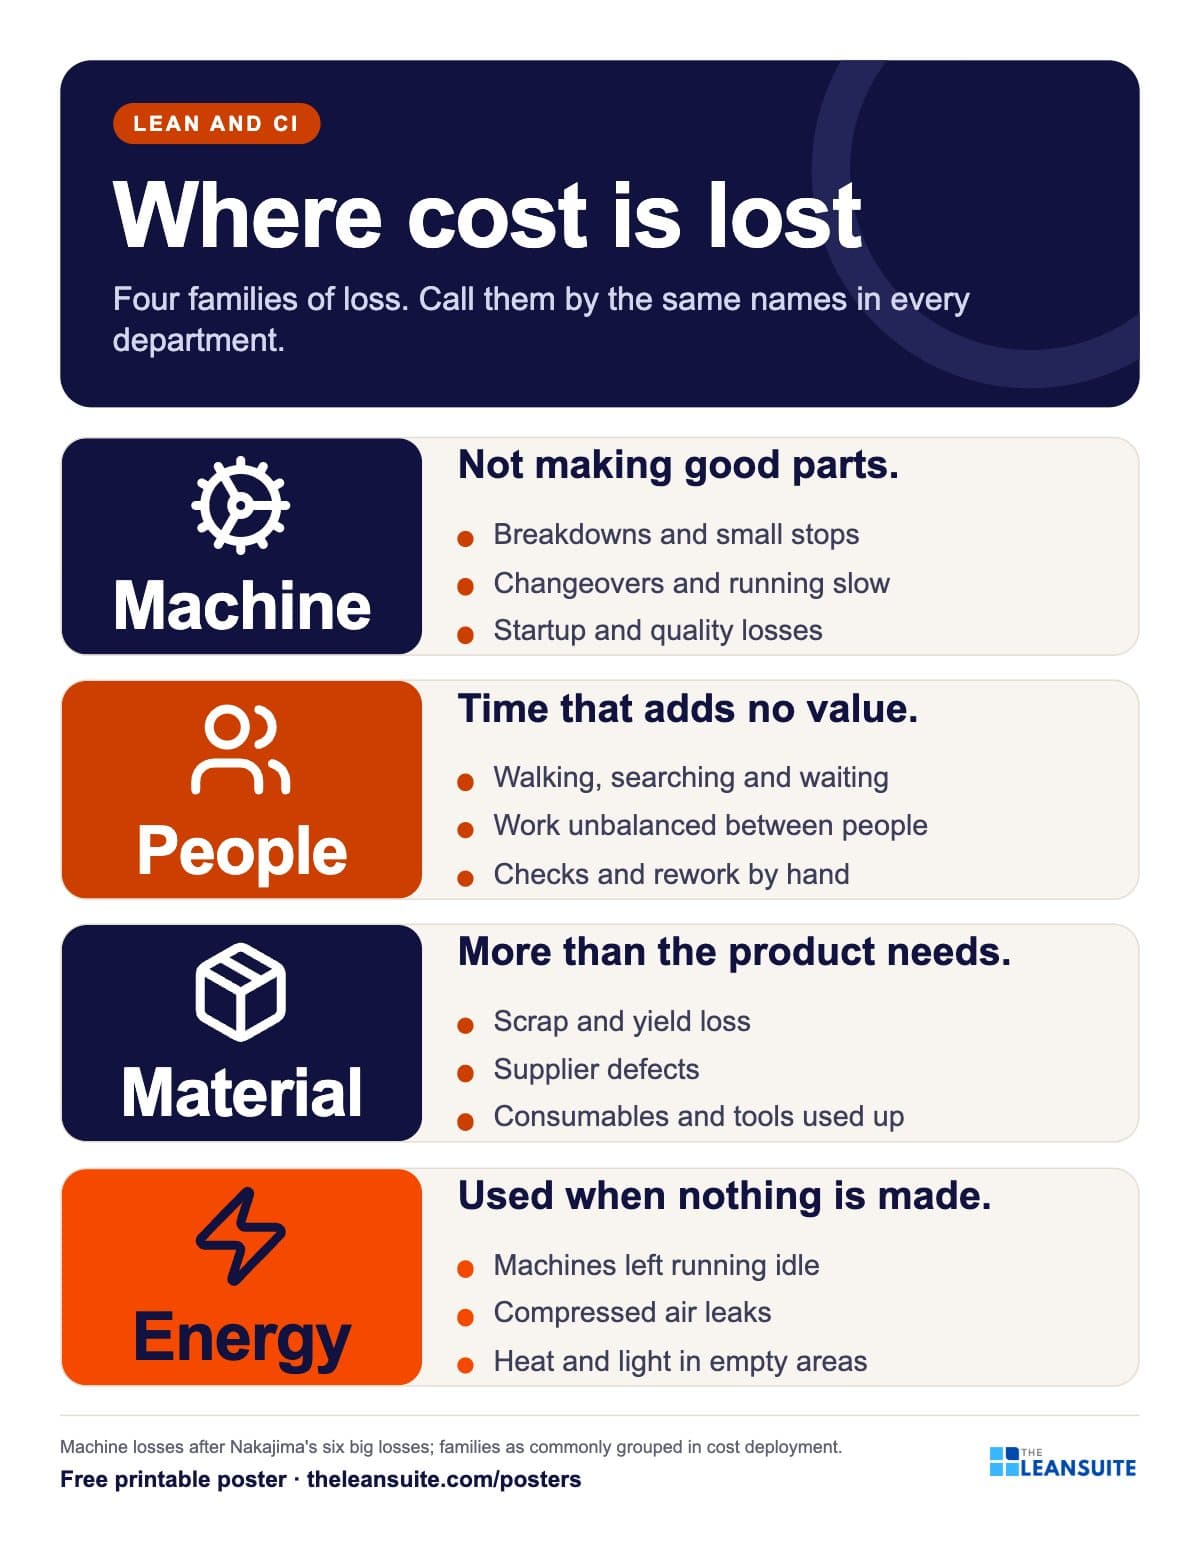 Four loss families poster
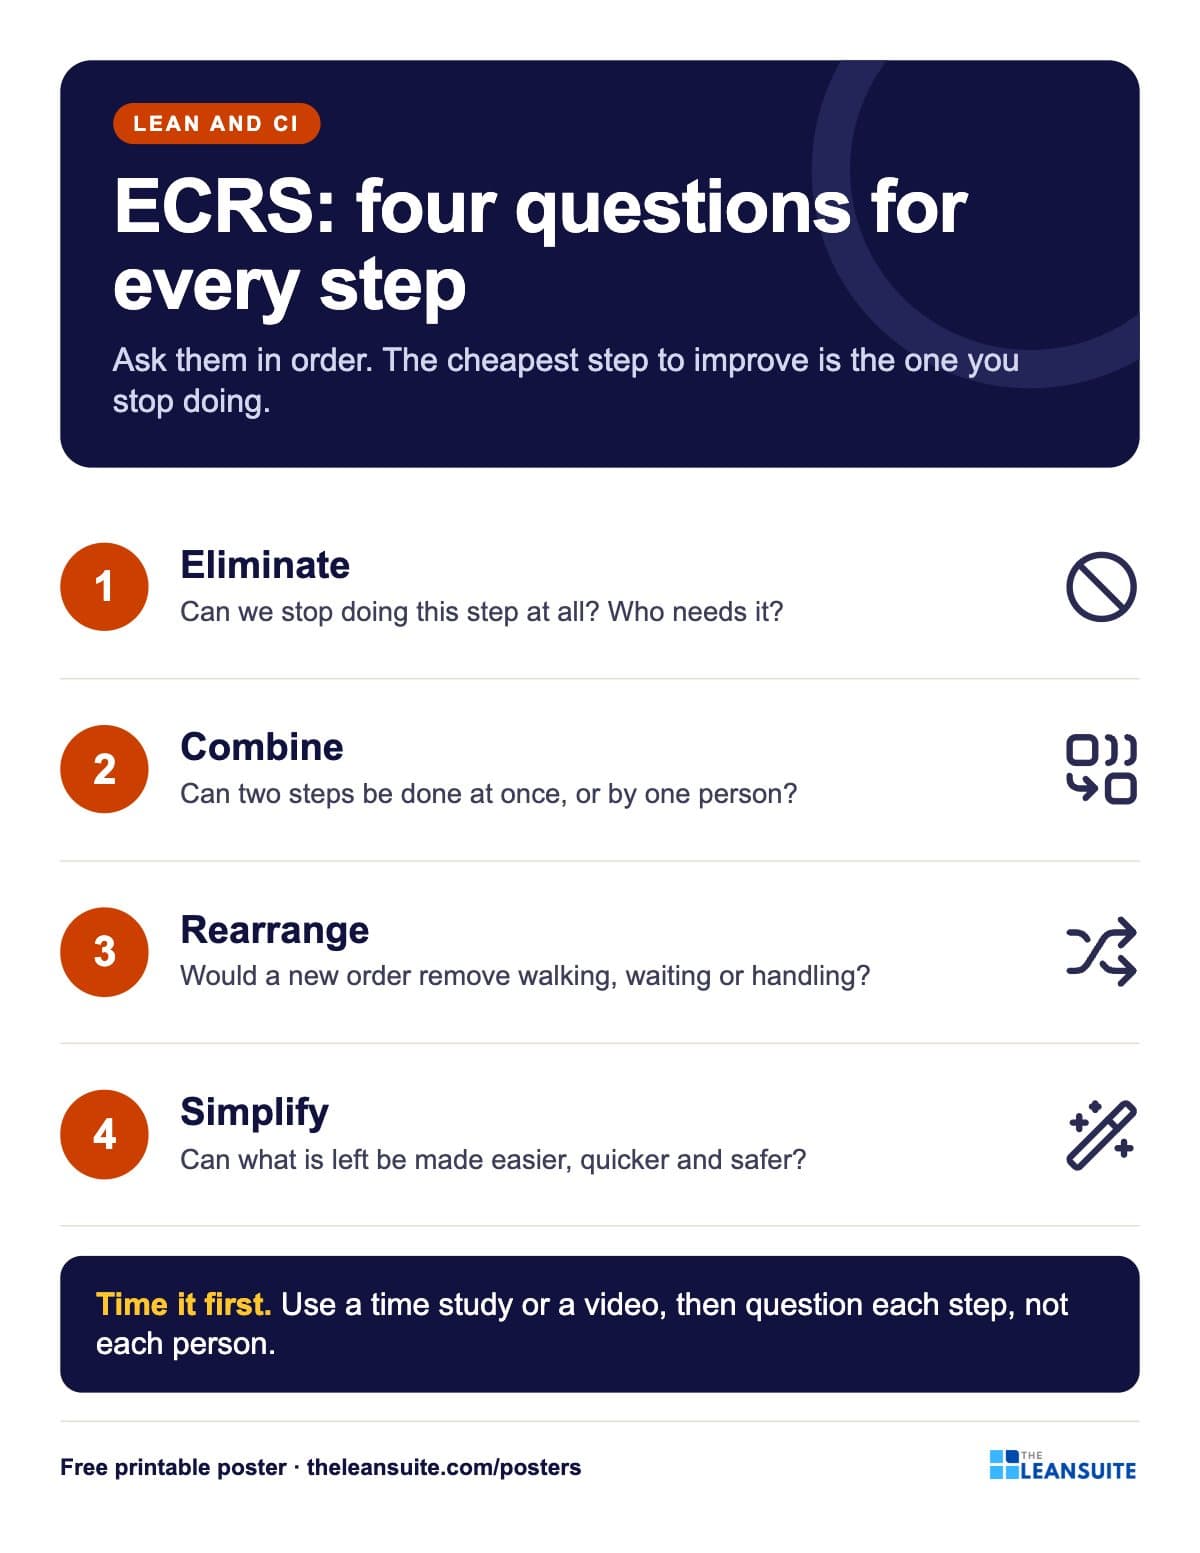 ECRS poster
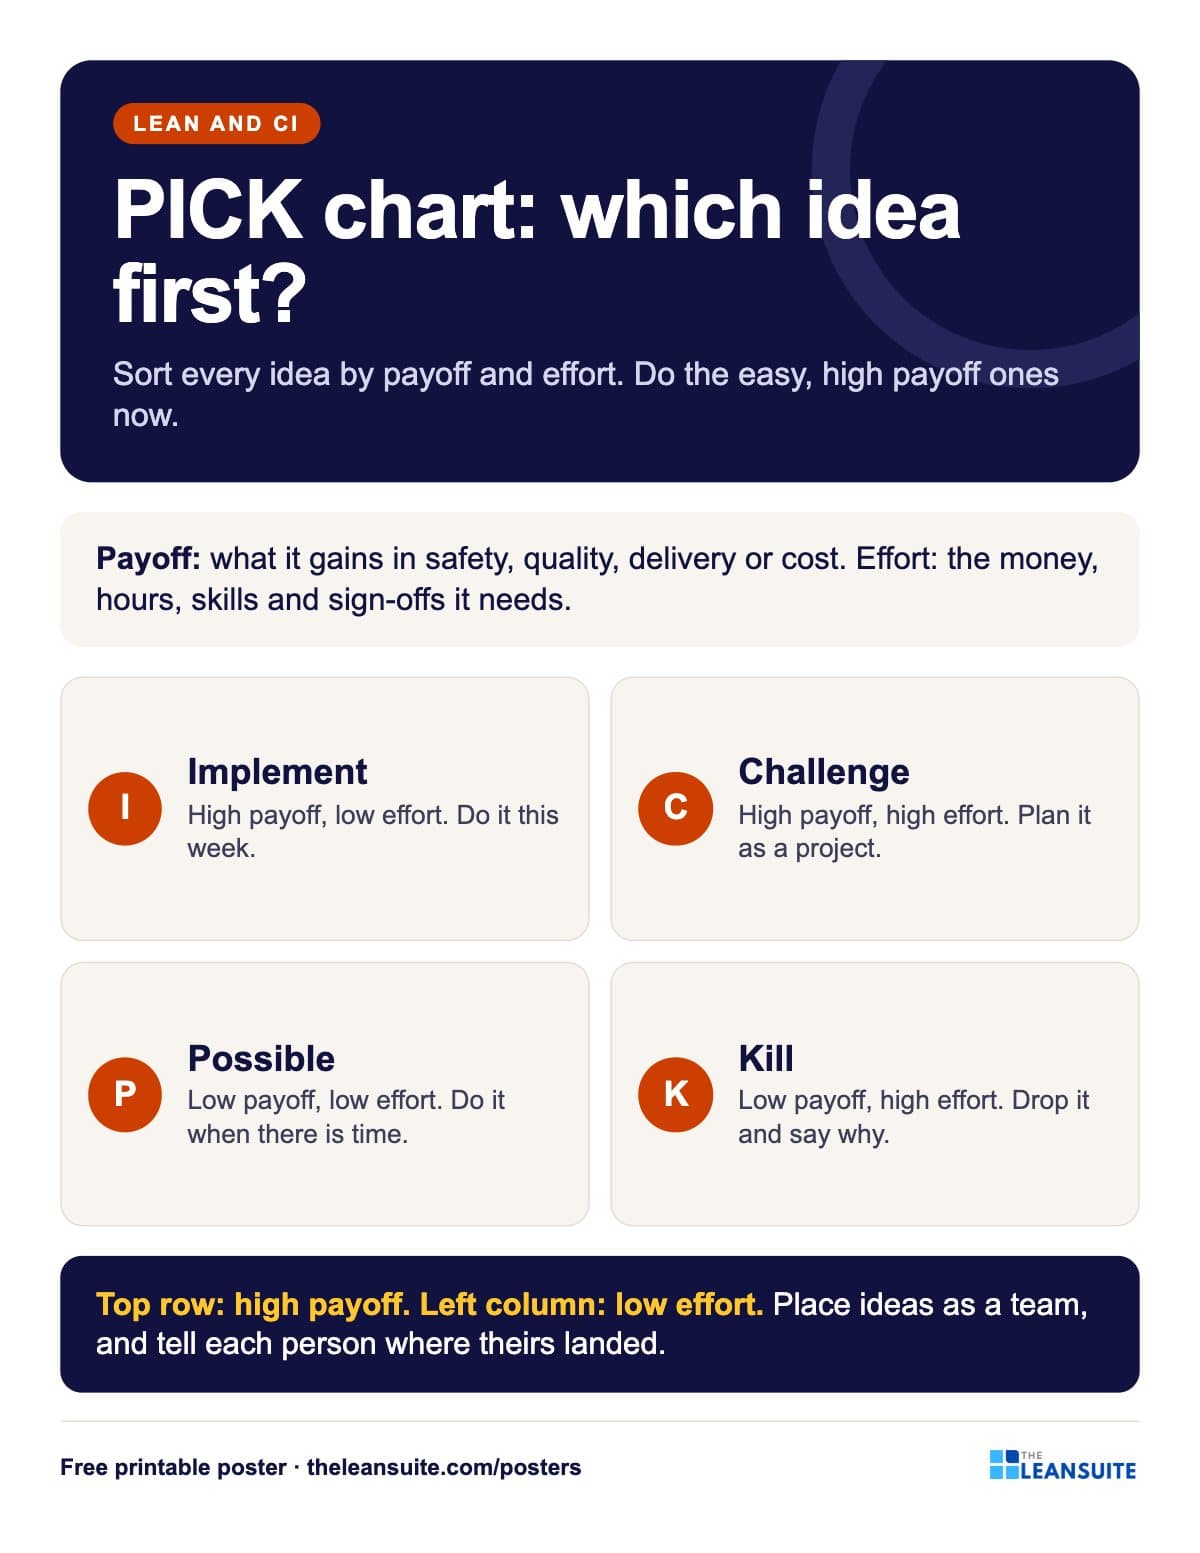 PICK chart poster
 Suggestion system poster
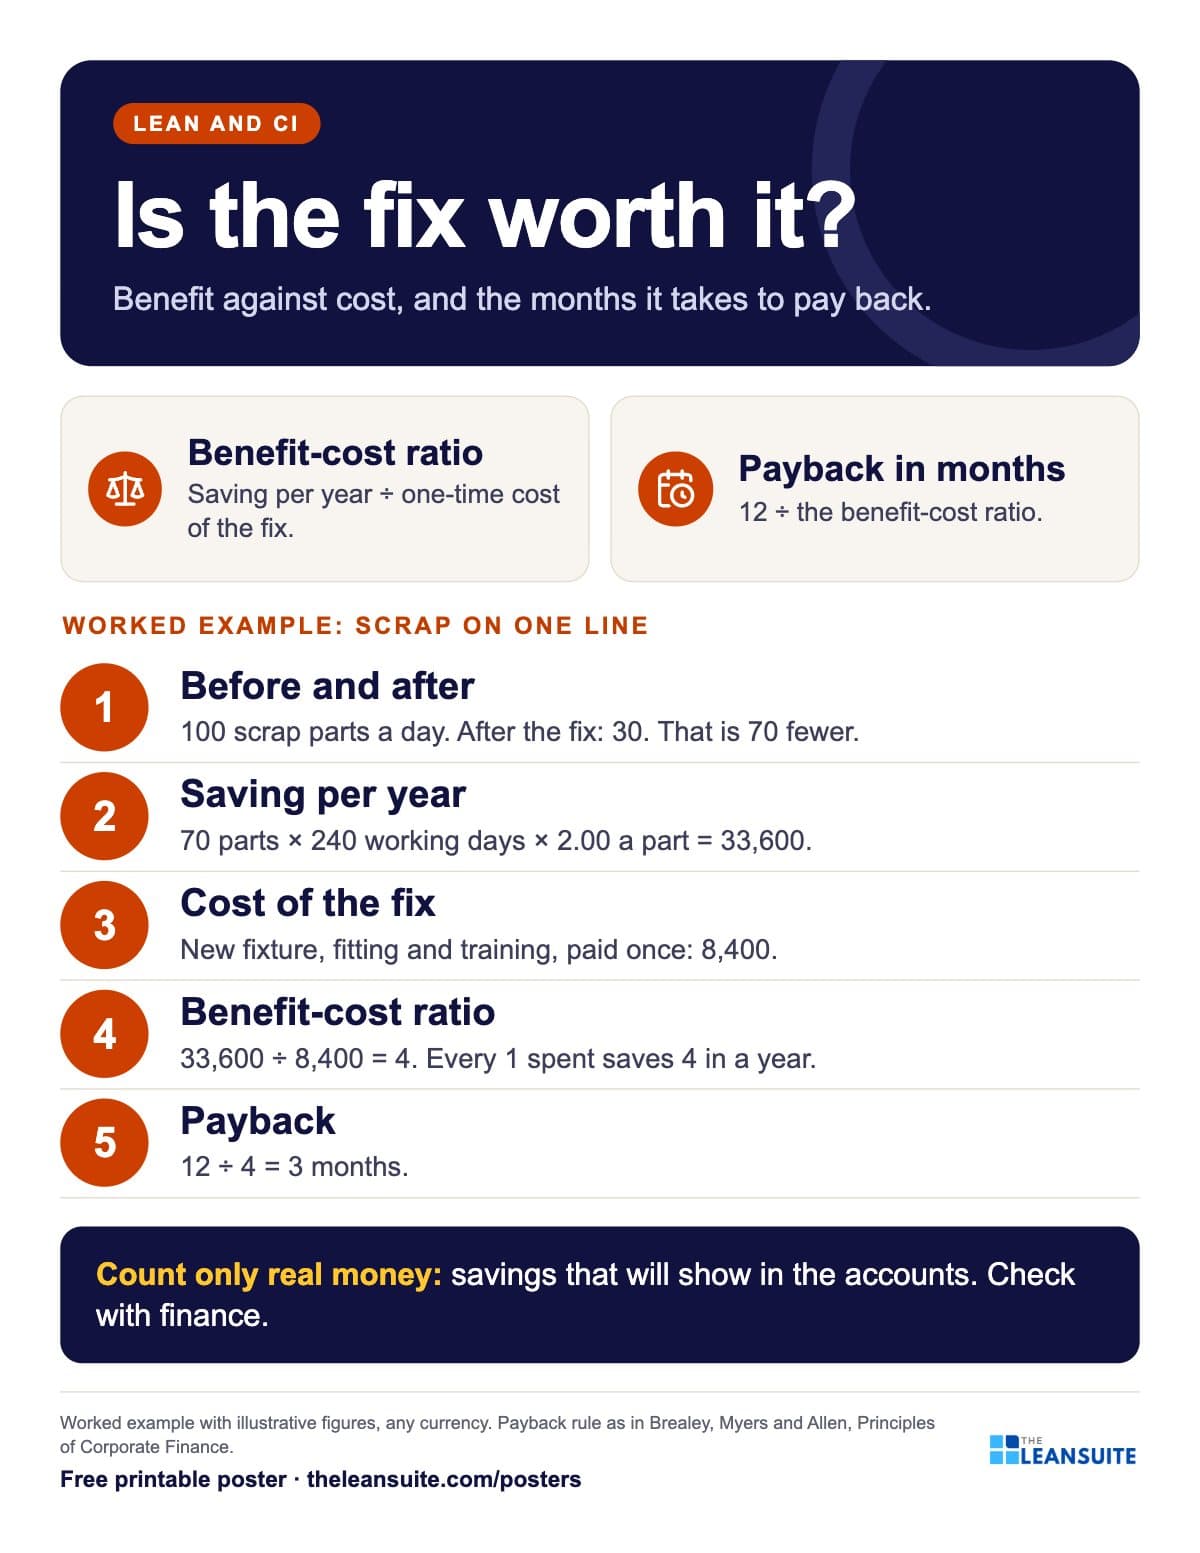 Benefit-cost ratio and payback poster
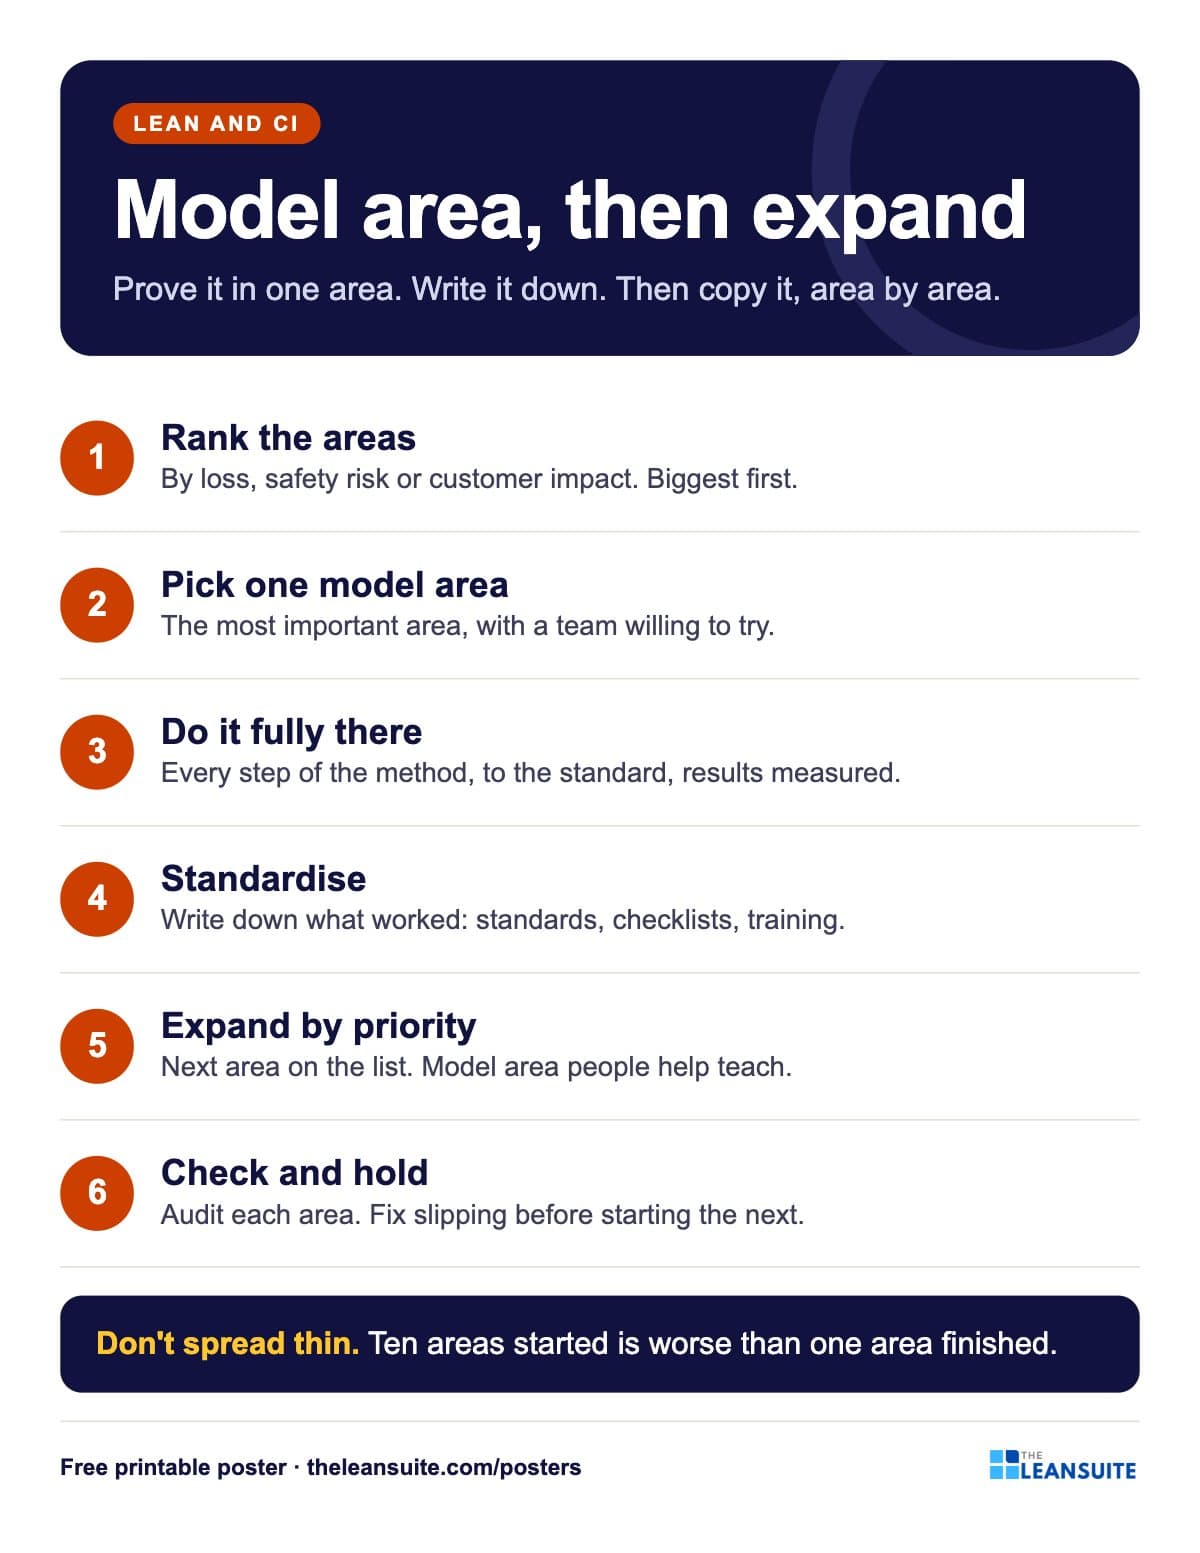 Model area and expansion poster
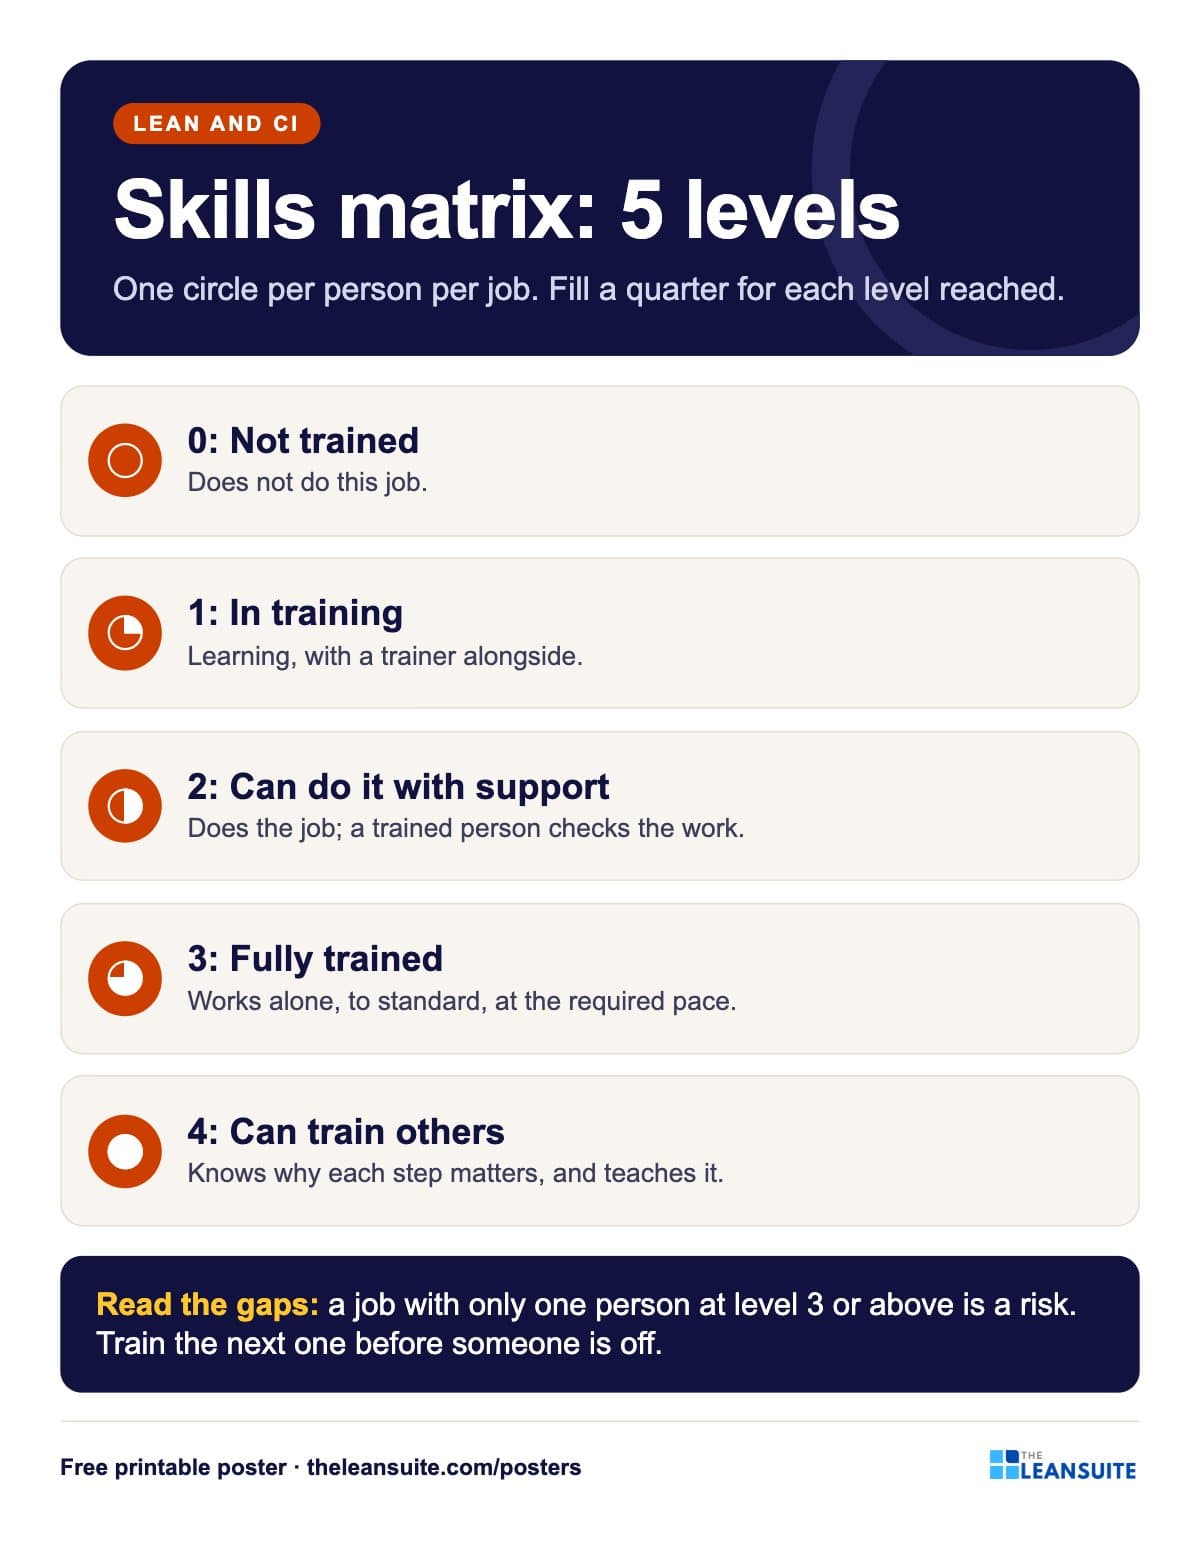 Skills matrix levels poster
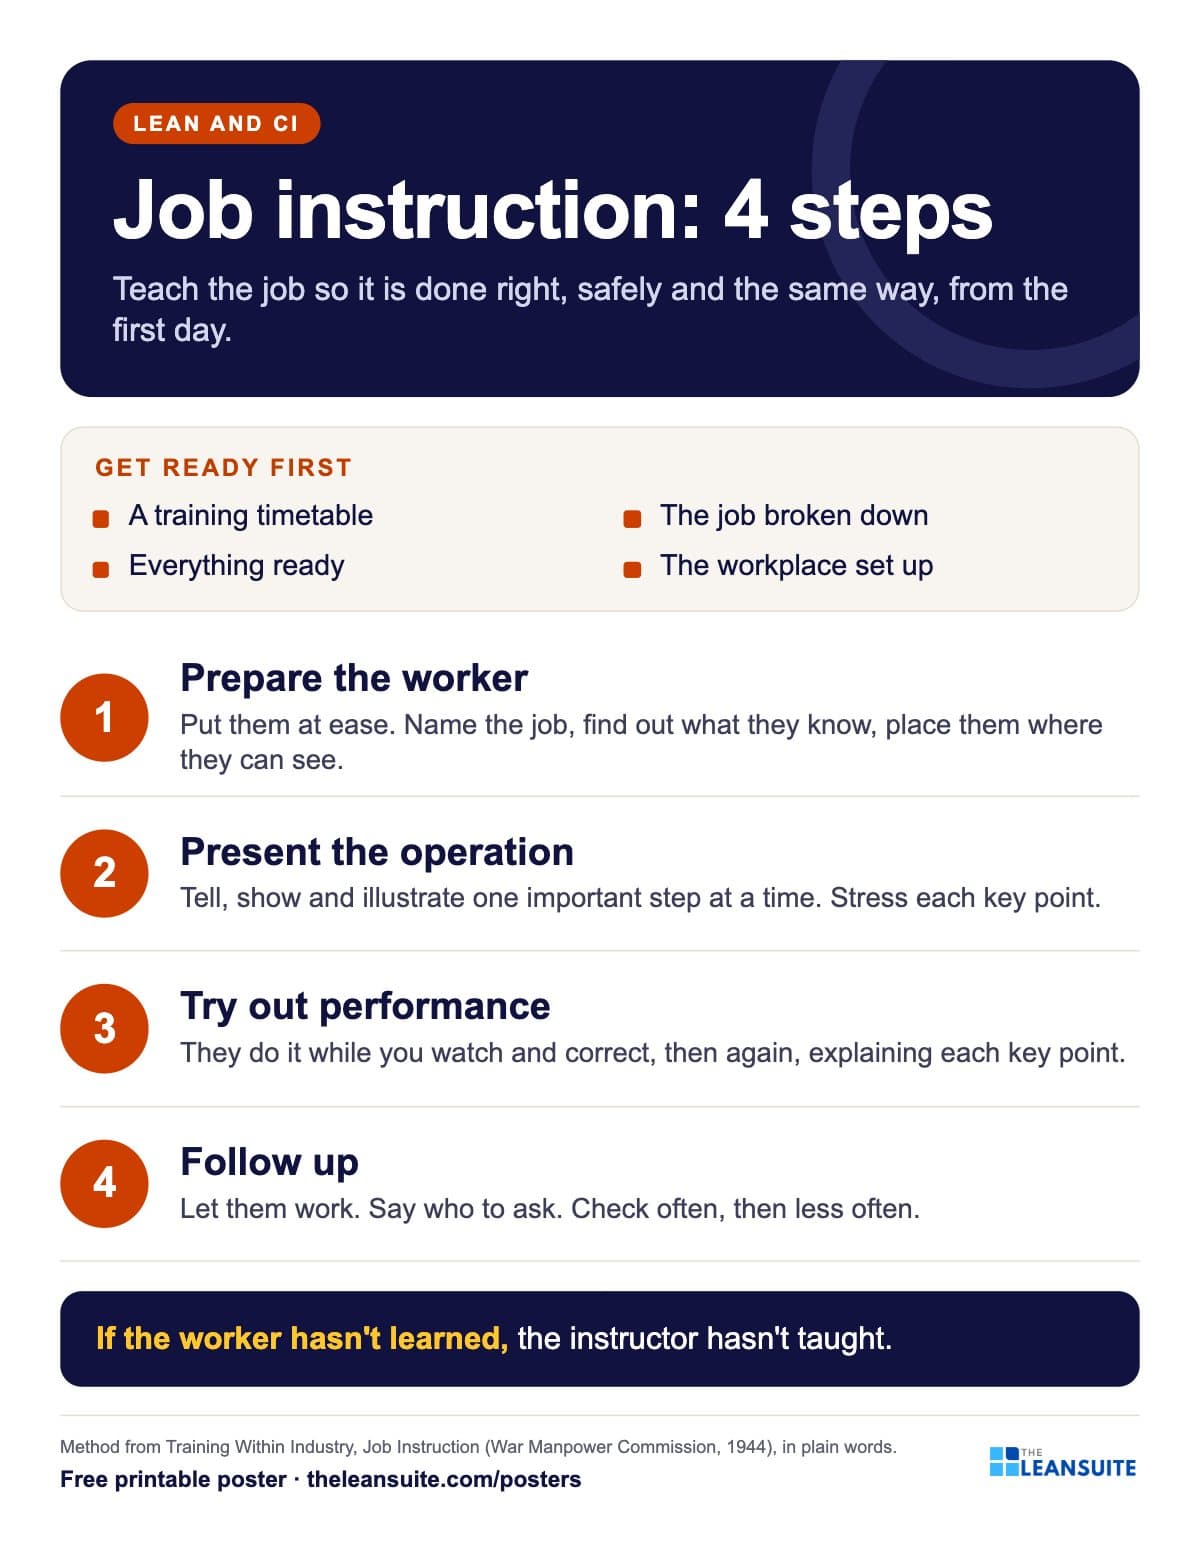 Job instruction 4 steps poster
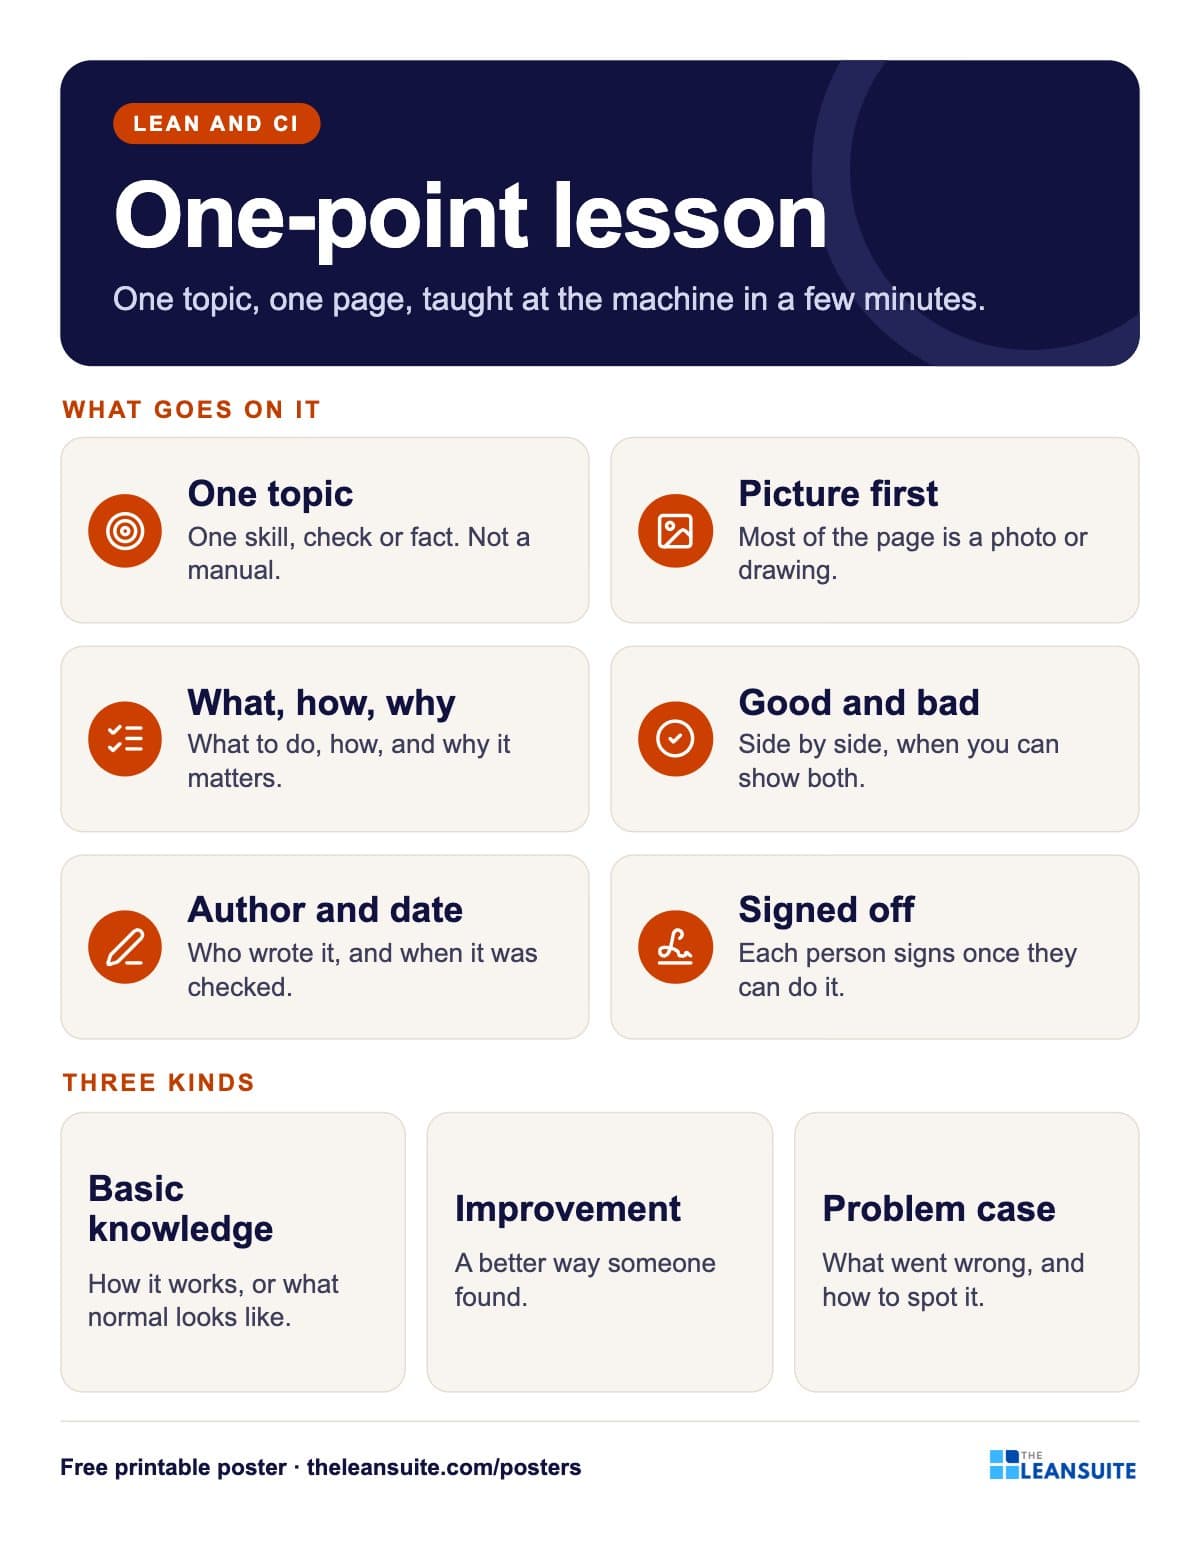 One-point lesson poster
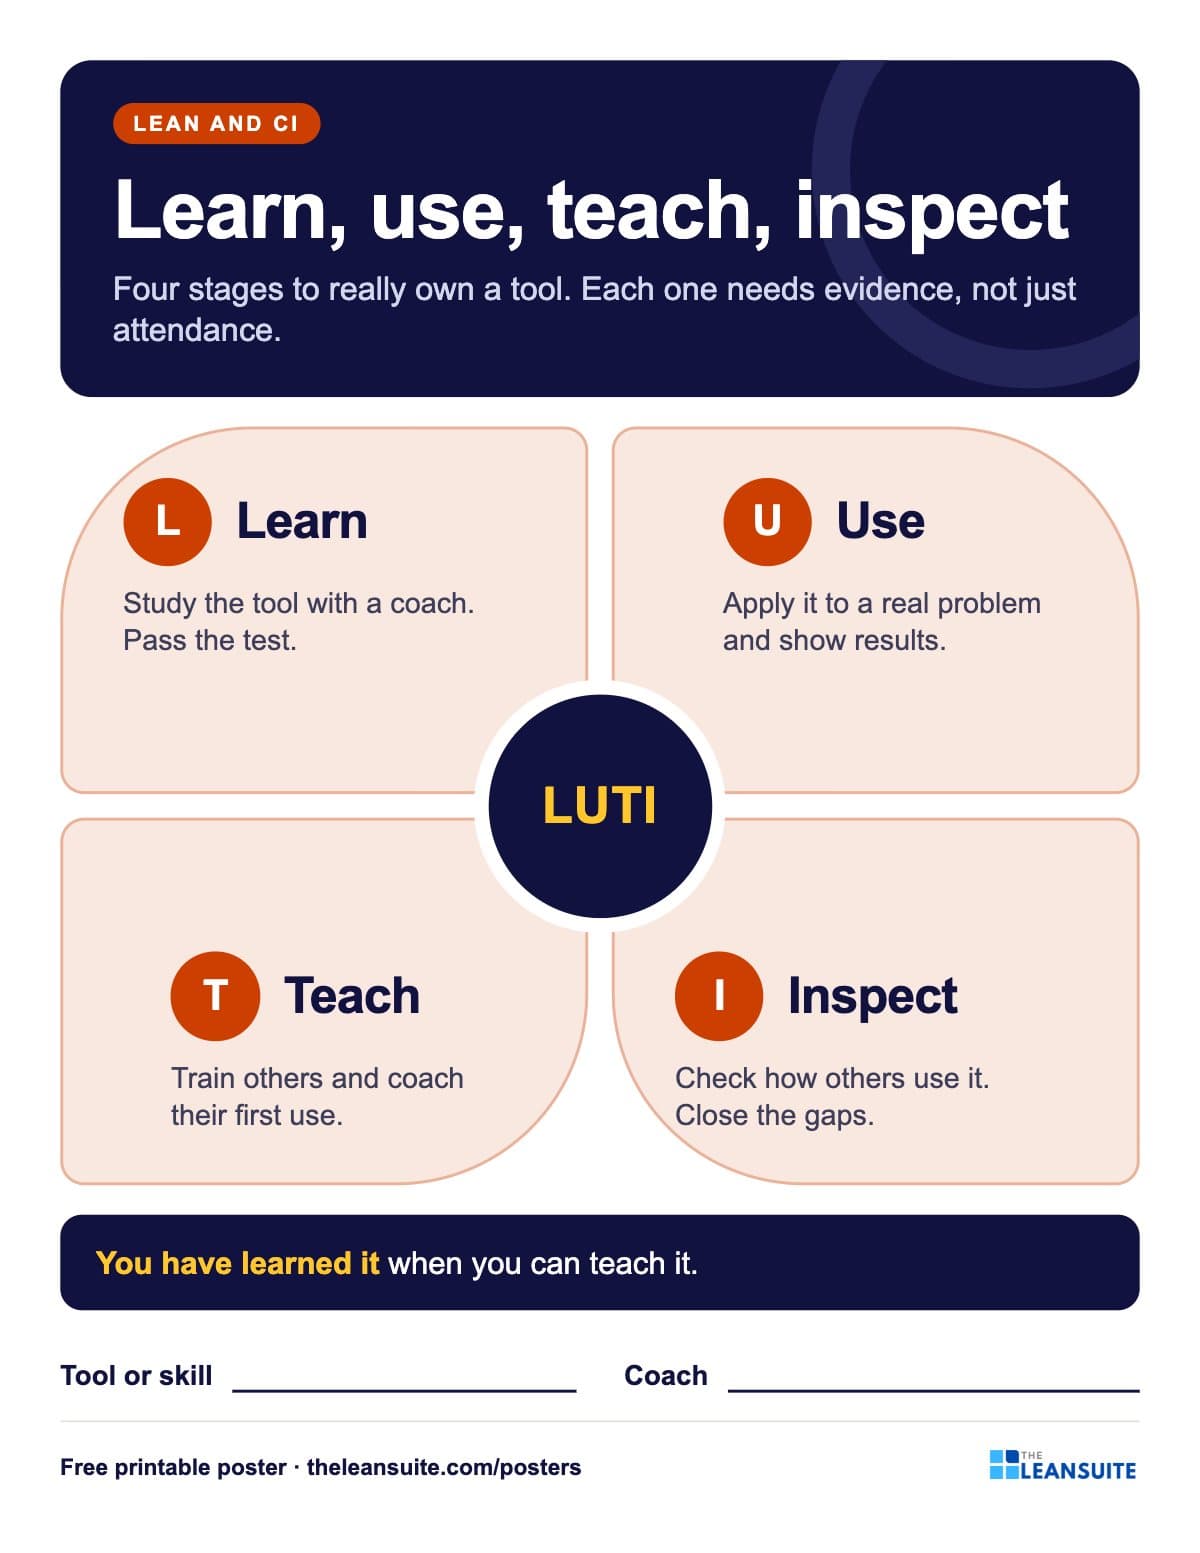 Learn, use, teach, inspect poster
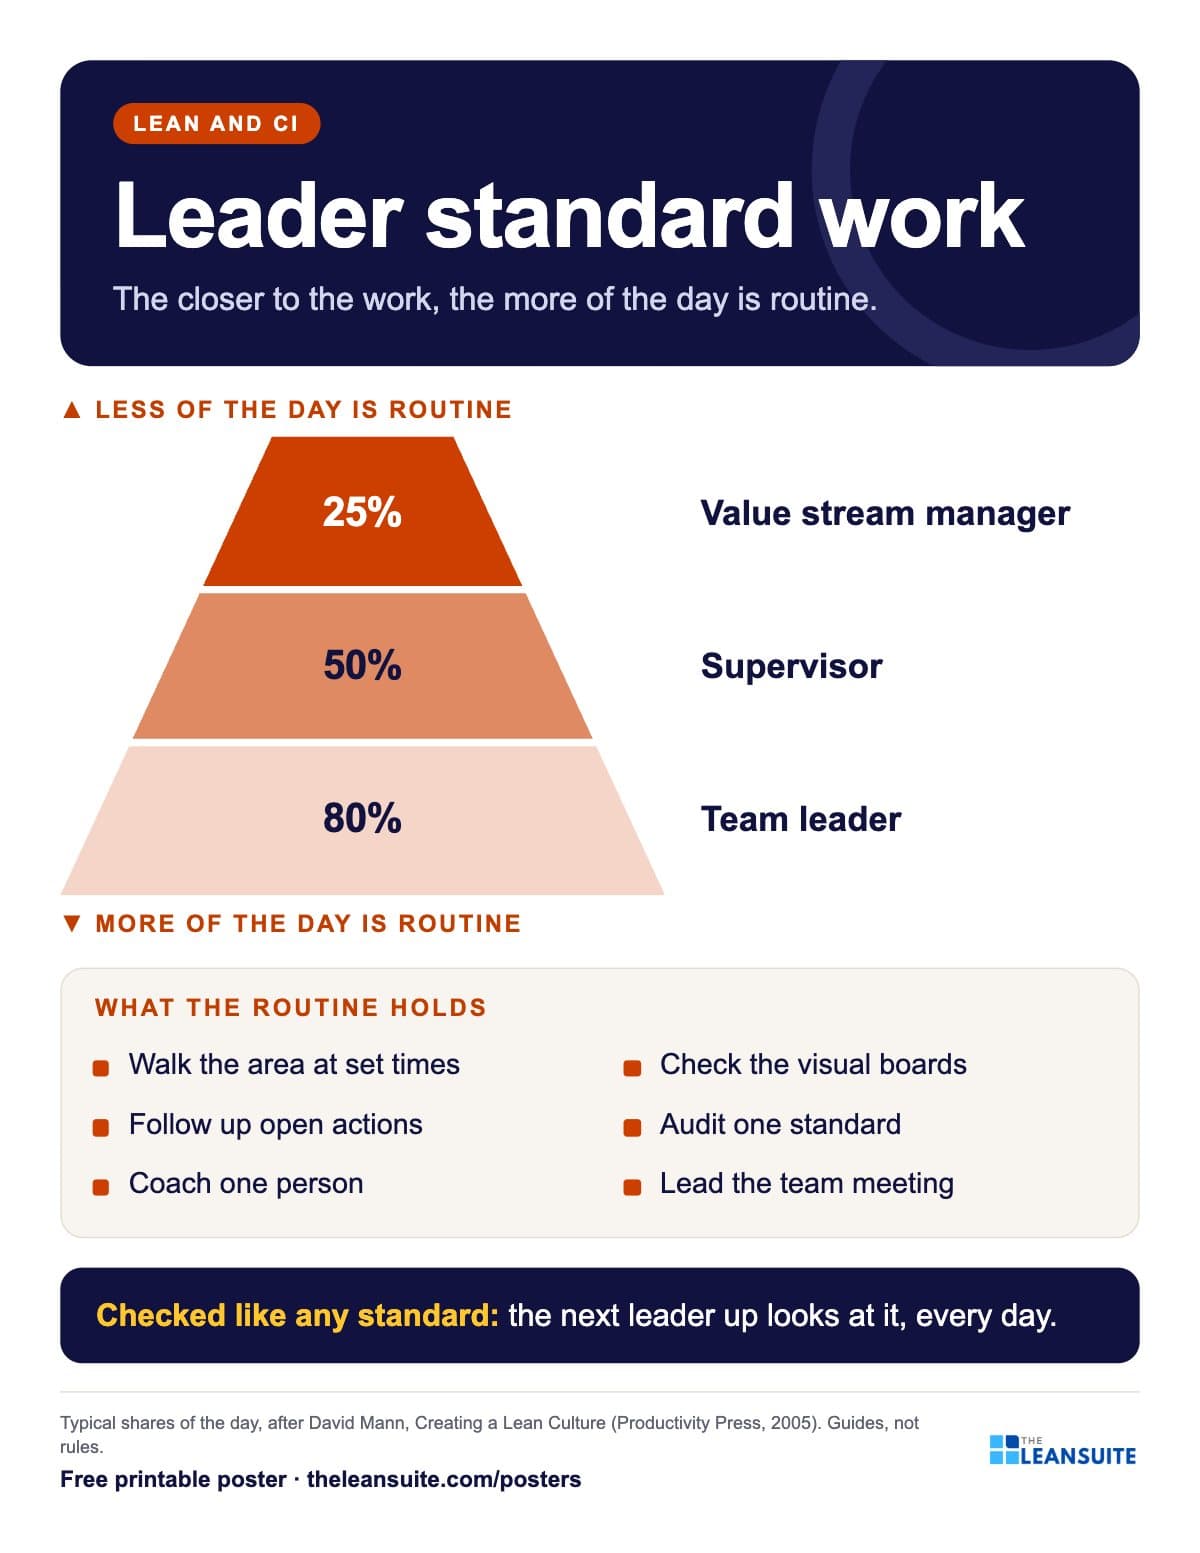 Leader standard work poster
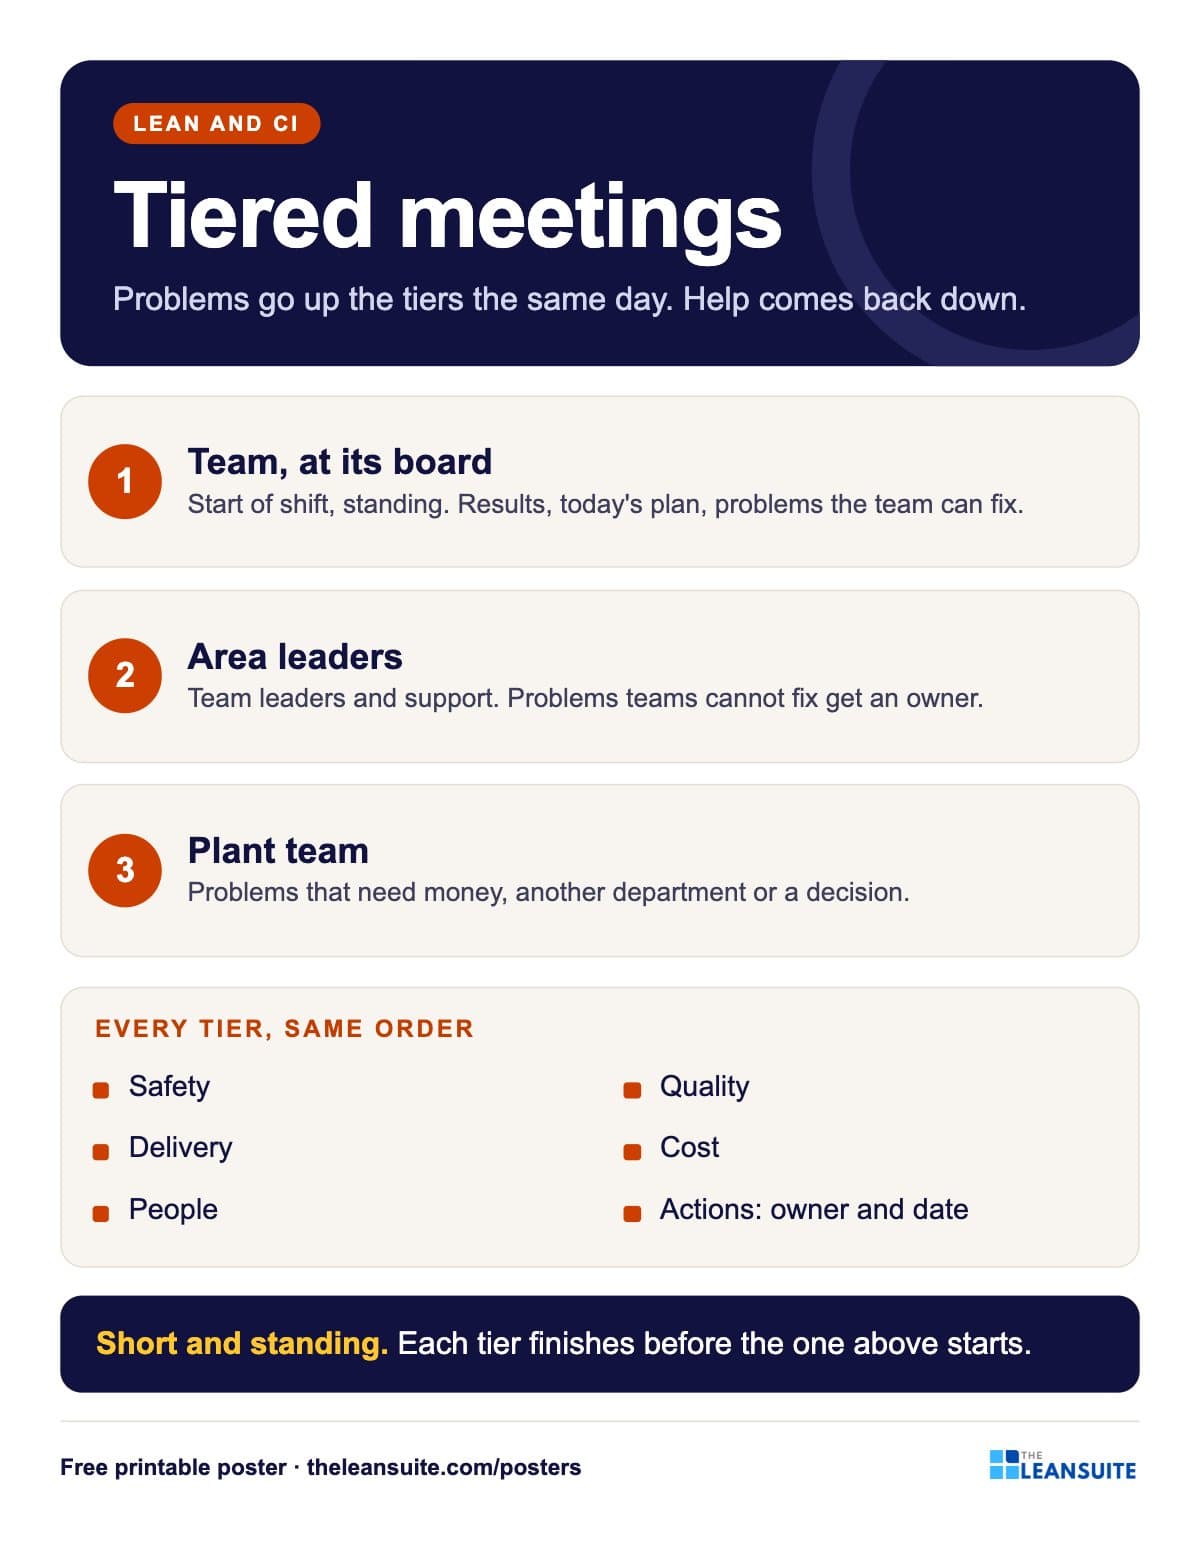 Tiered meetings poster
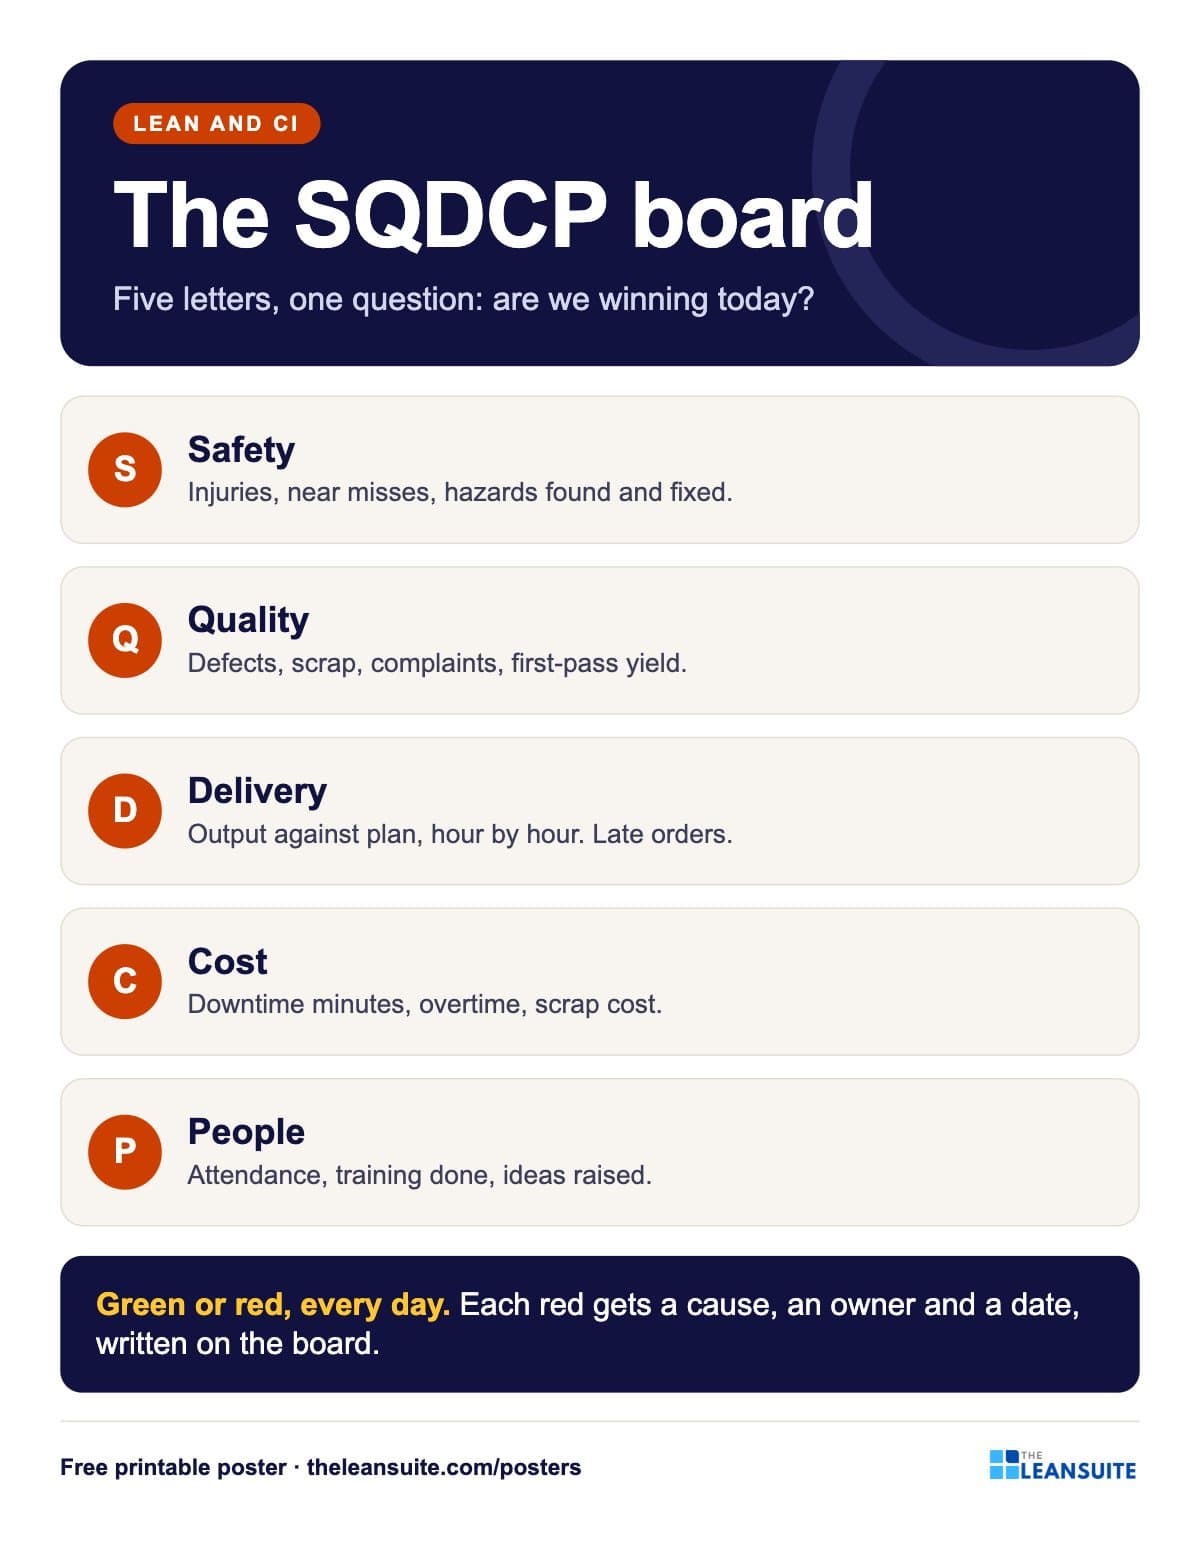 SQDCP board poster
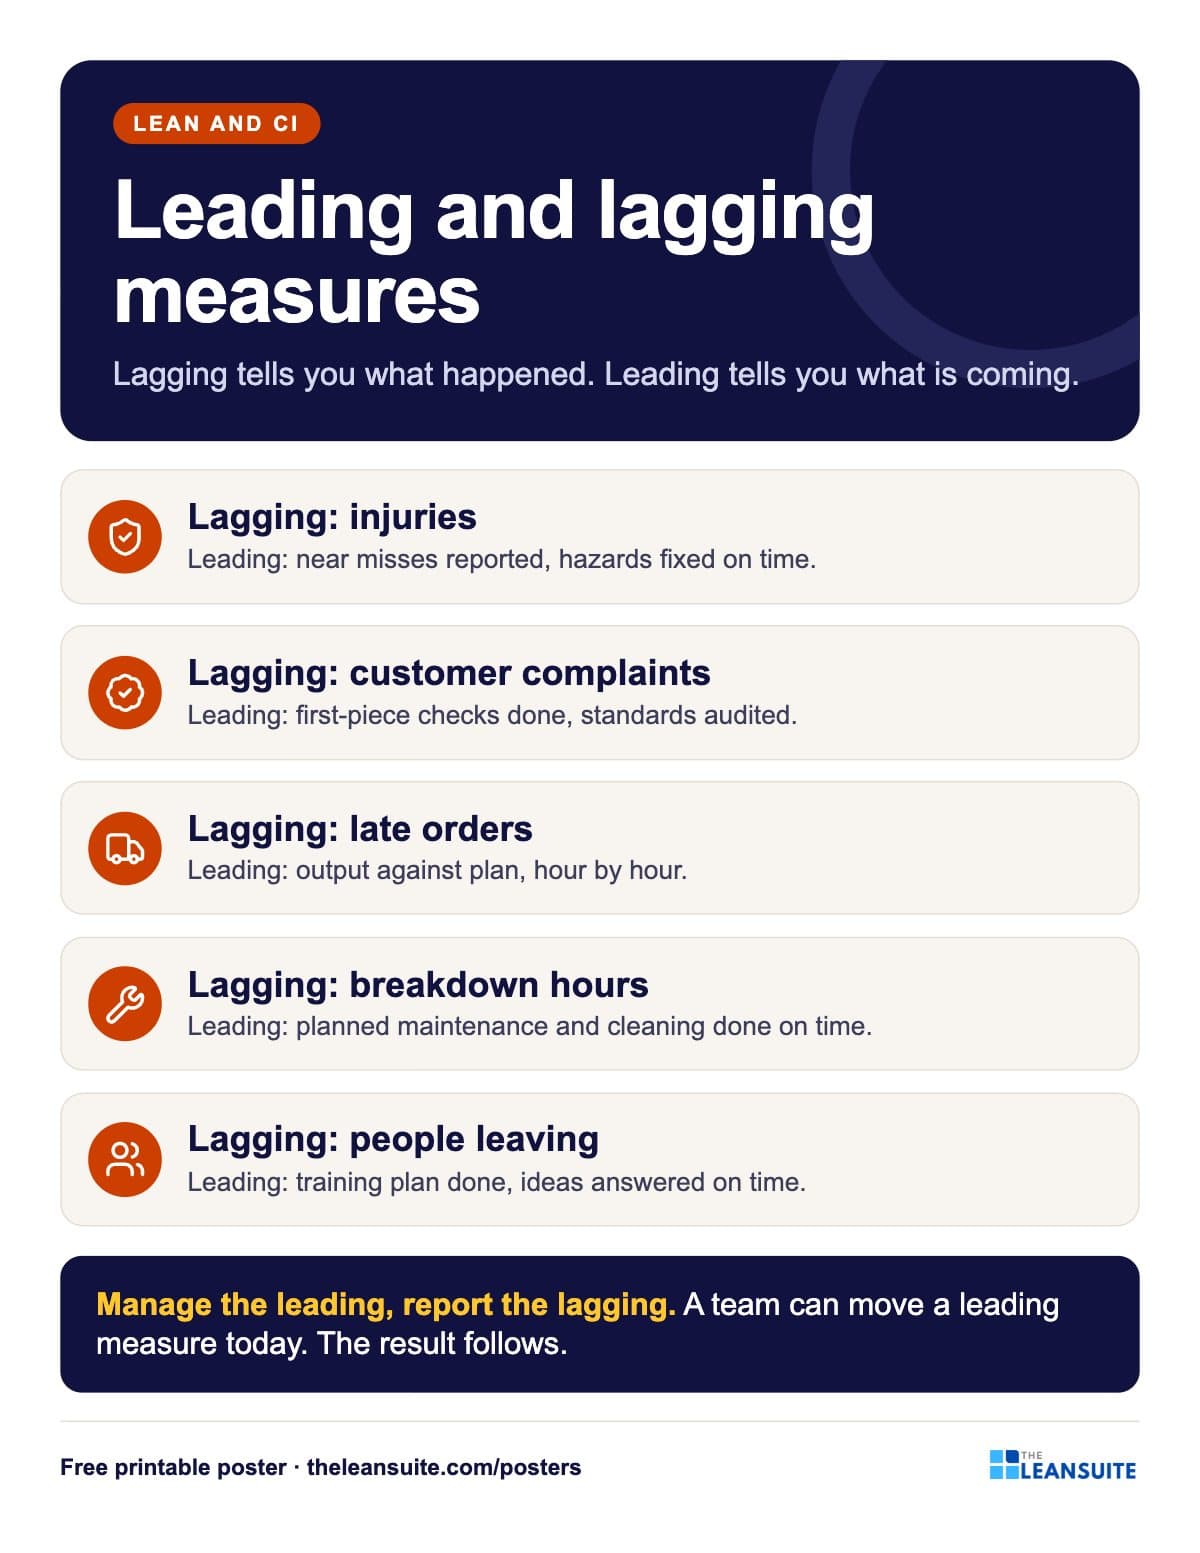 Leading and lagging indicators poster
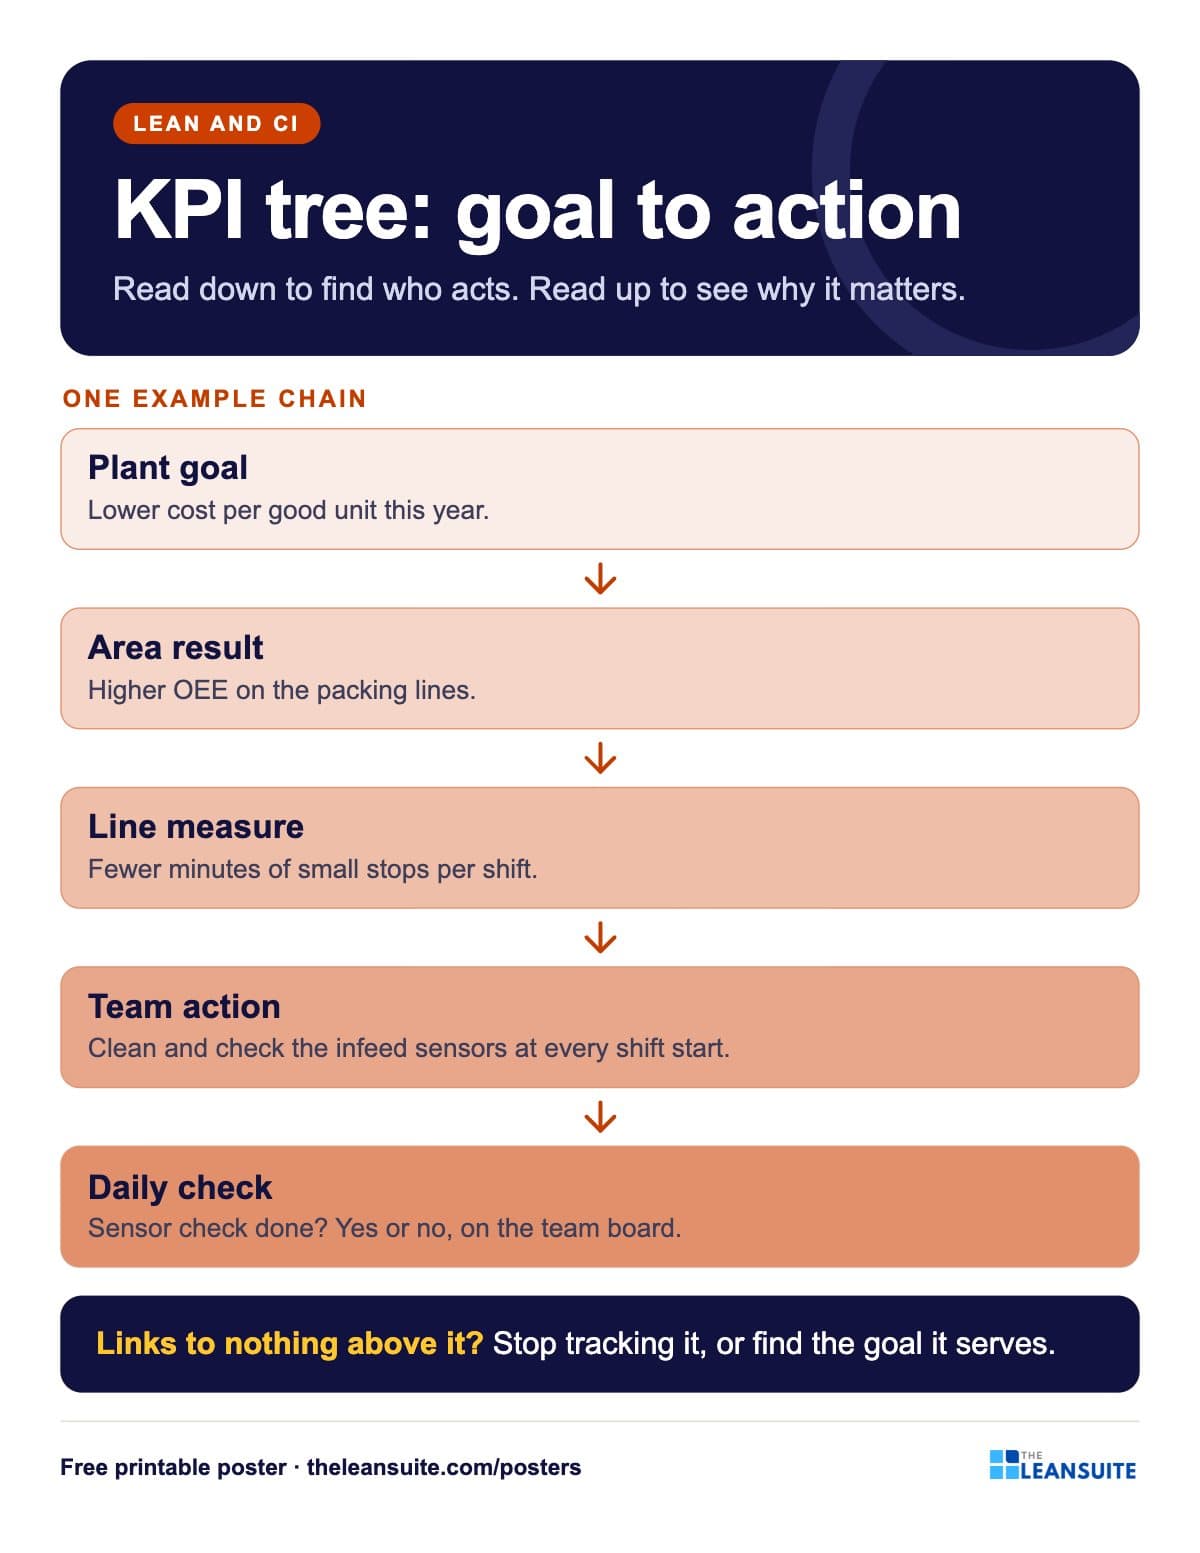 KPI tree poster
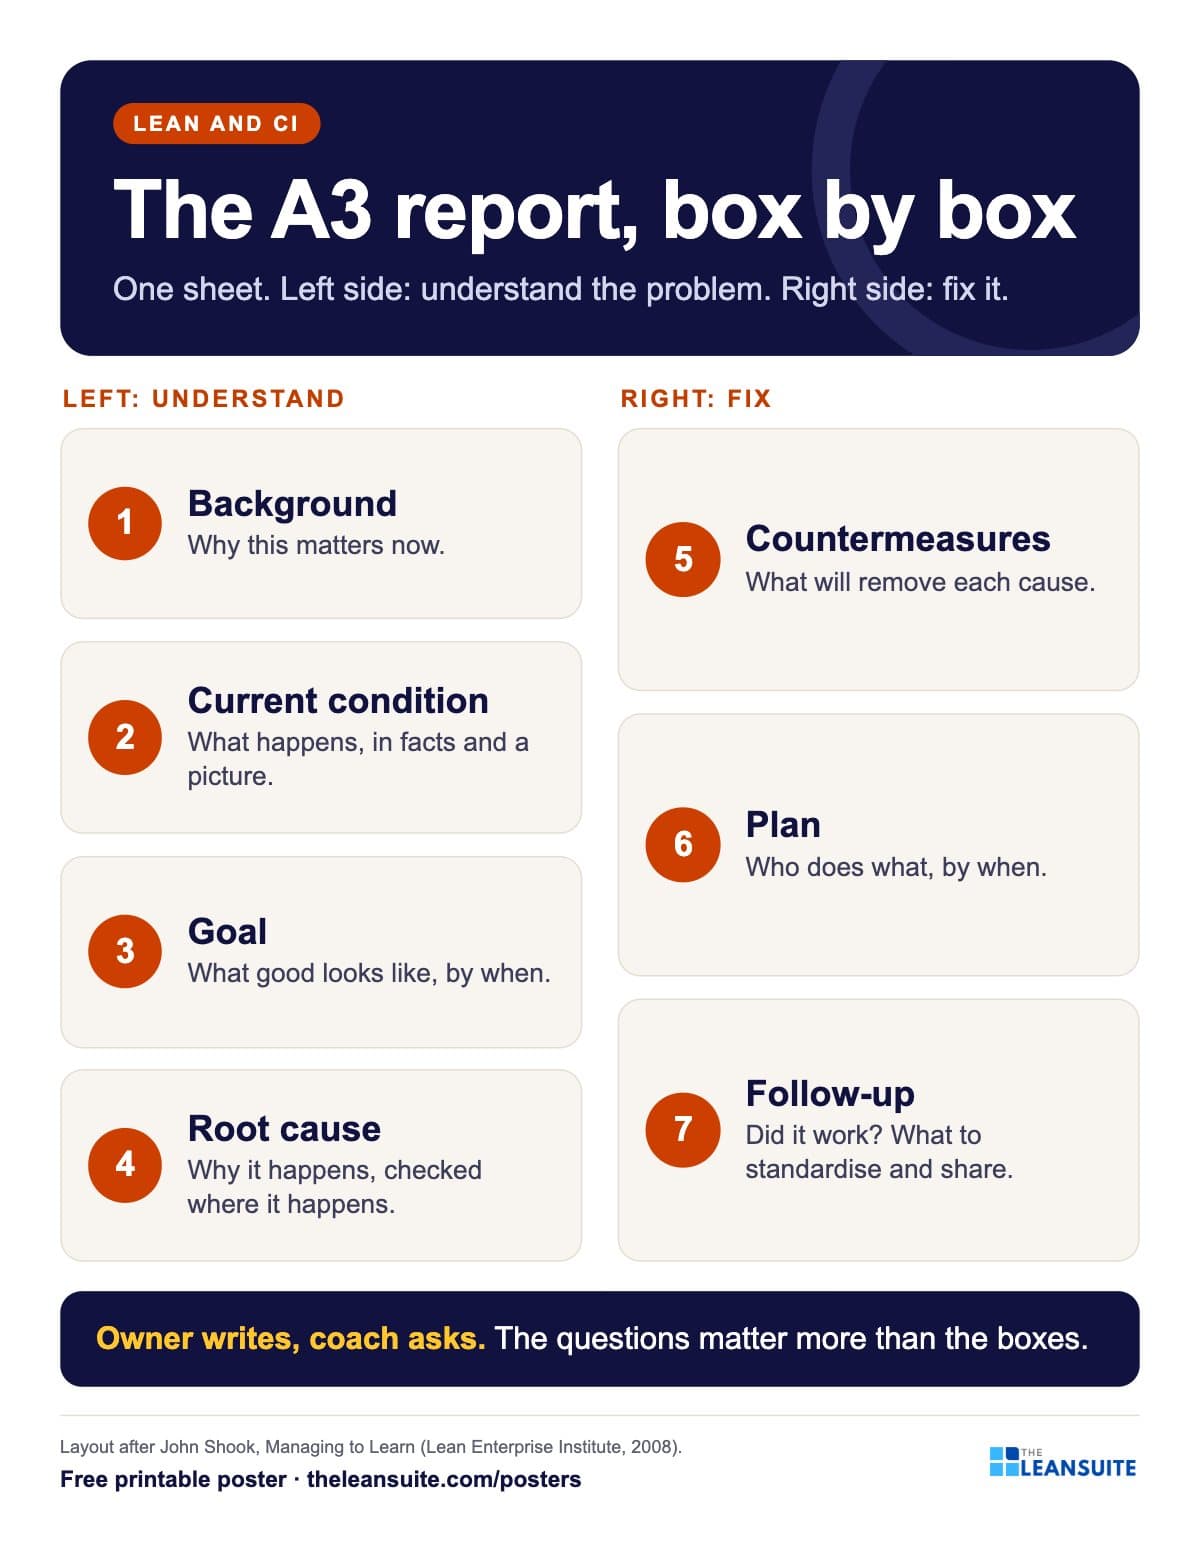 A3 report layout poster
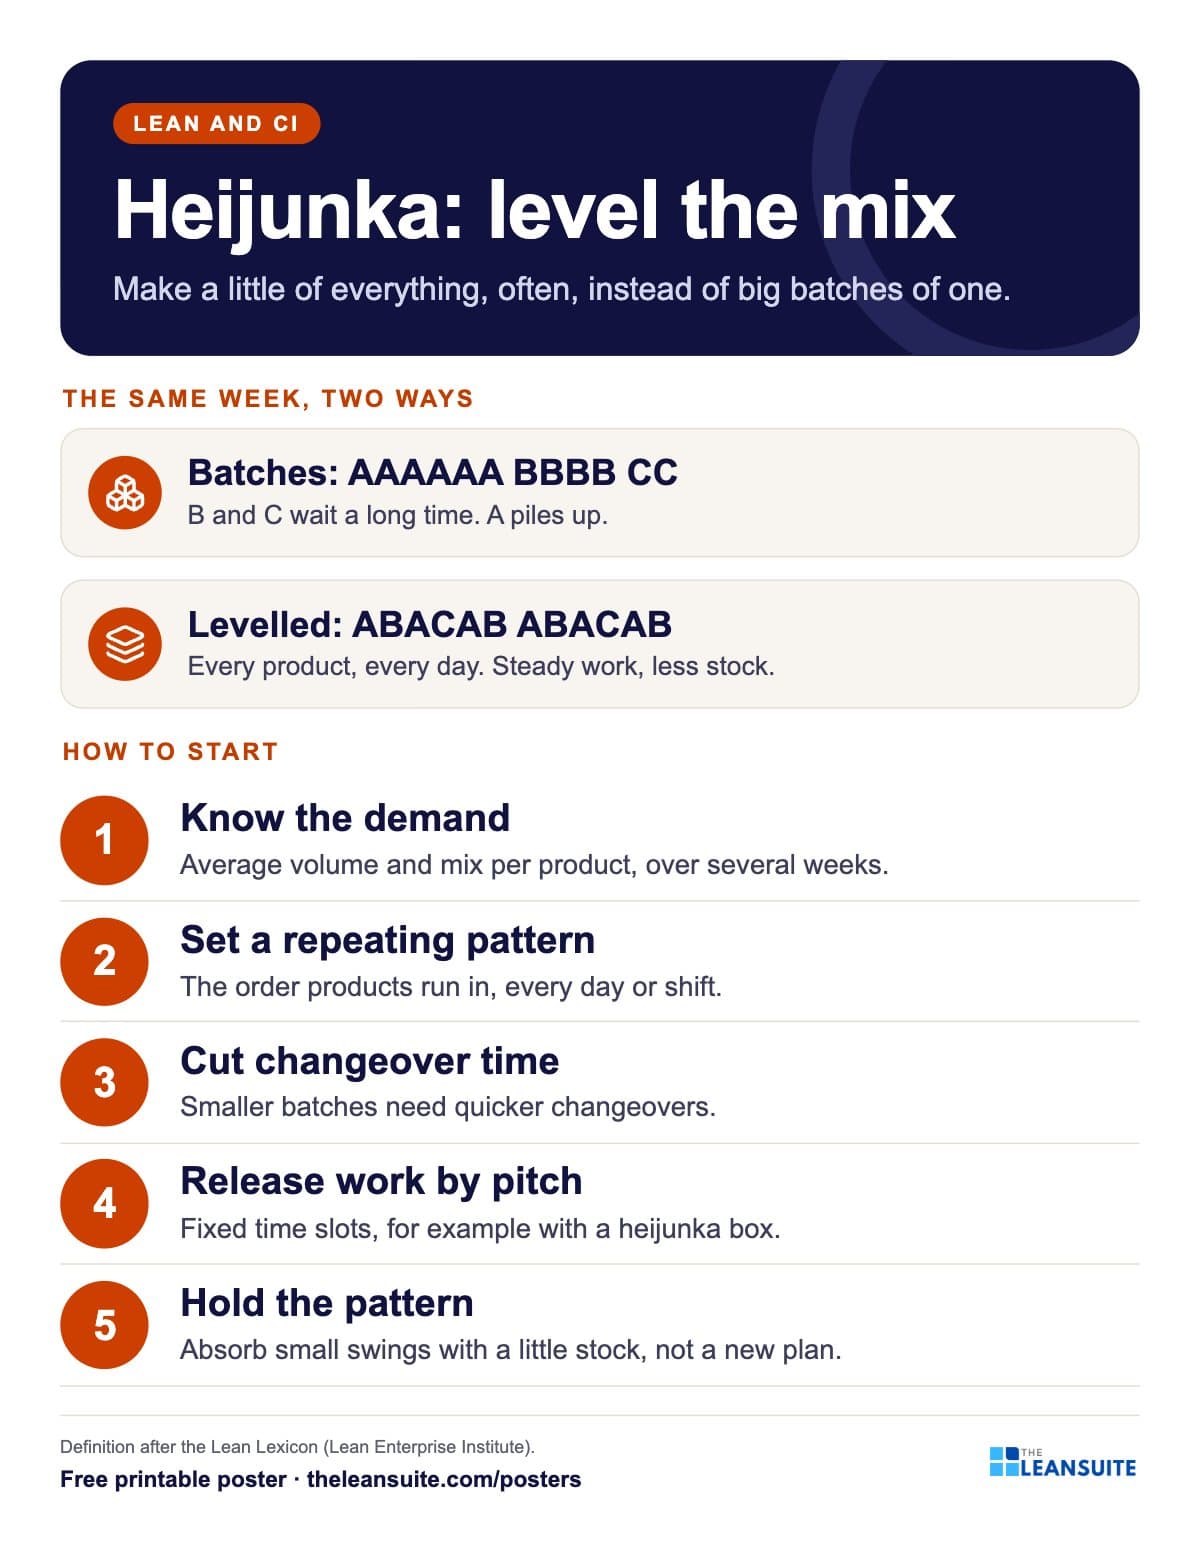 Heijunka production levelling poster
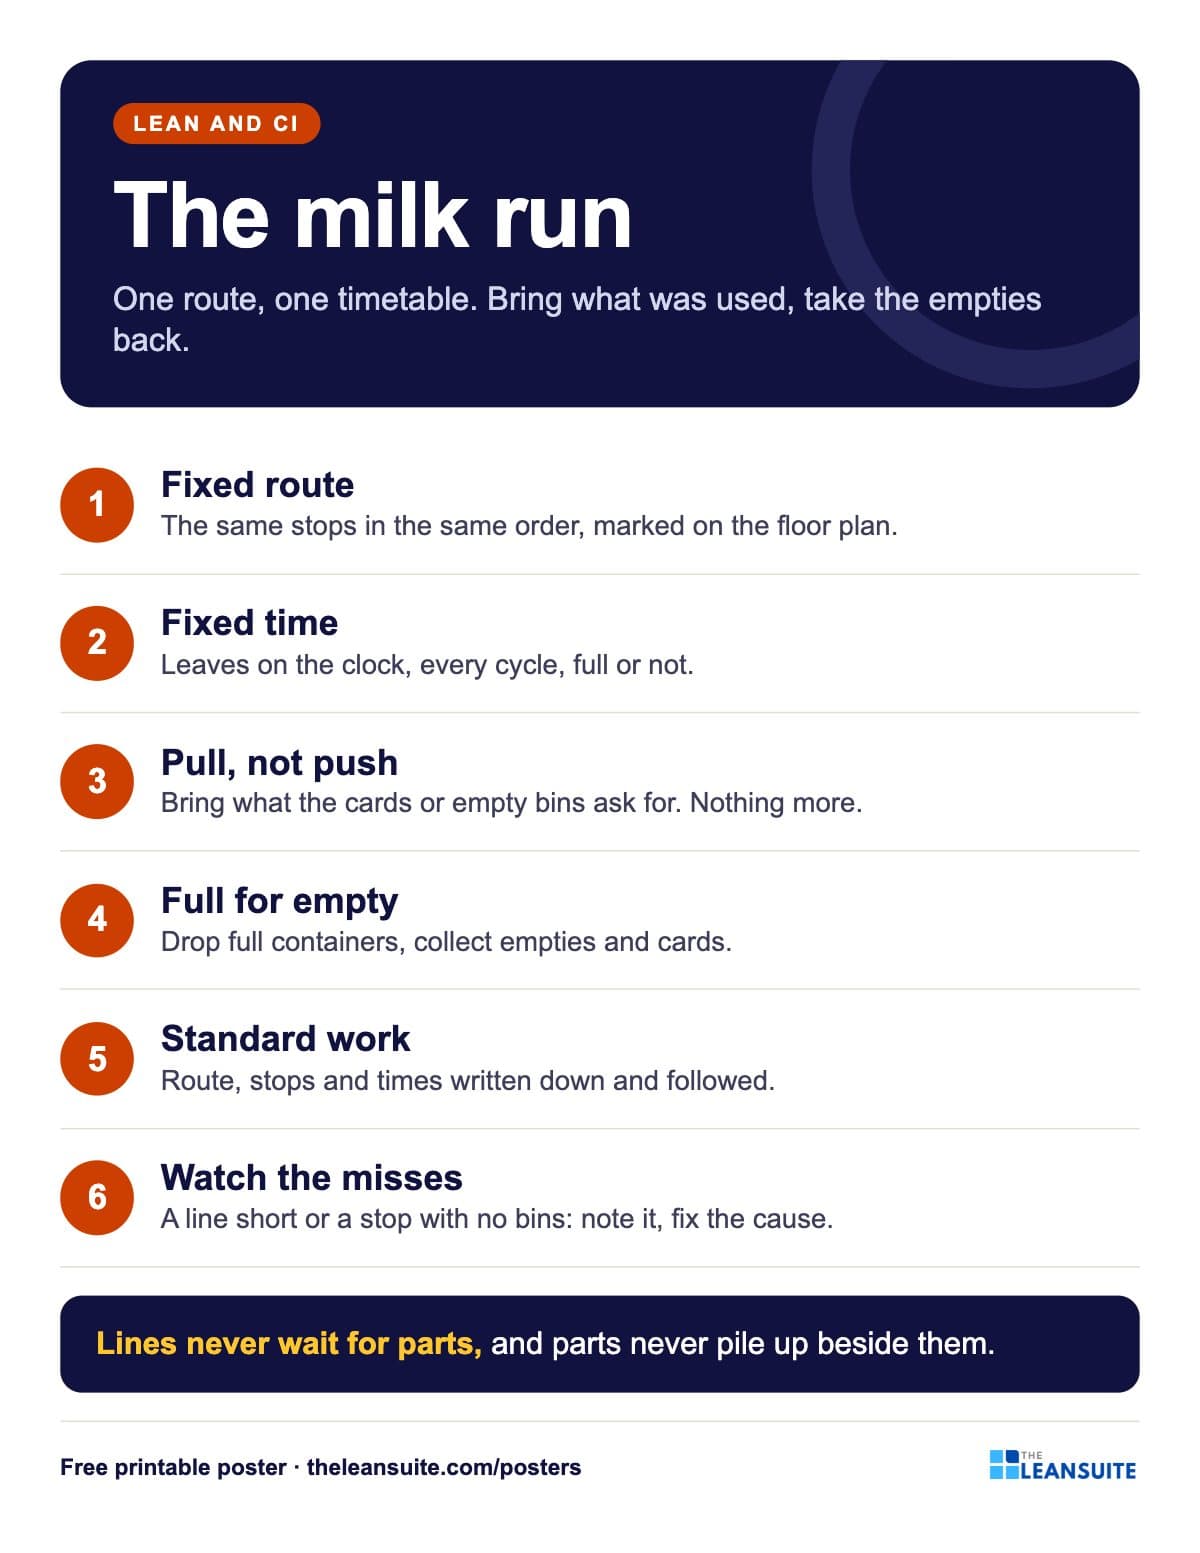 Milk run poster
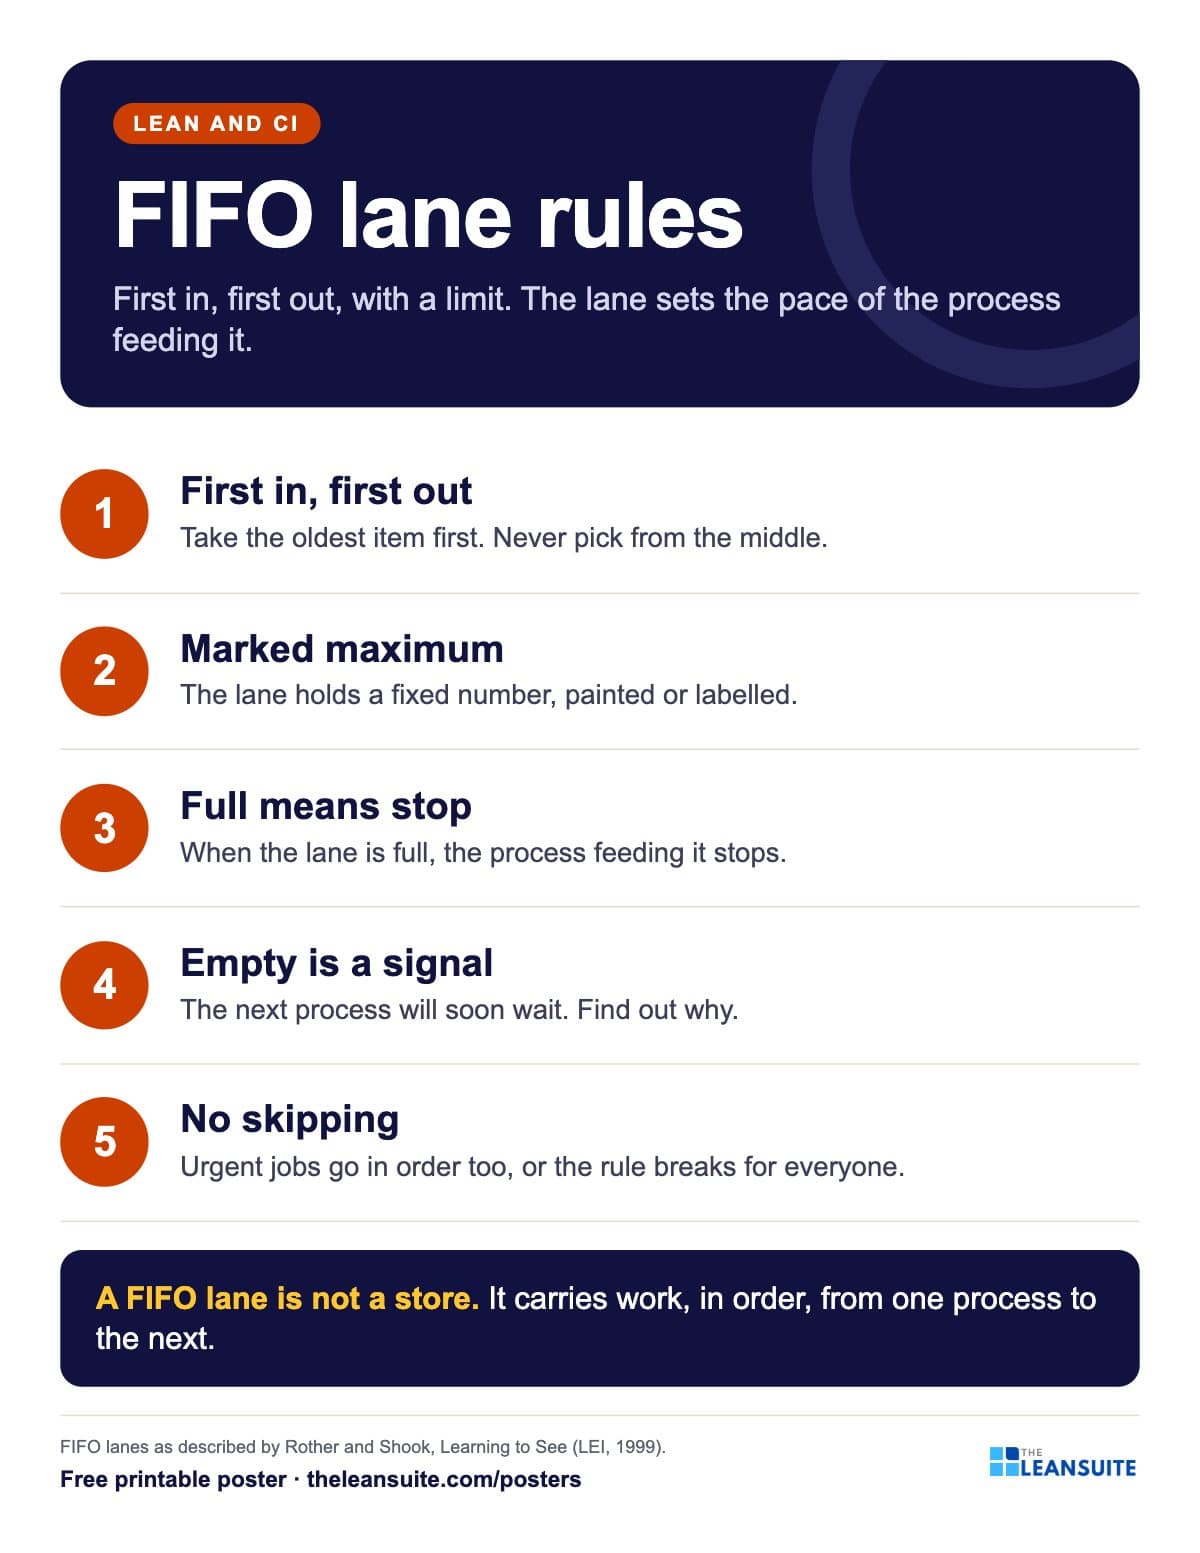 FIFO lane rules poster
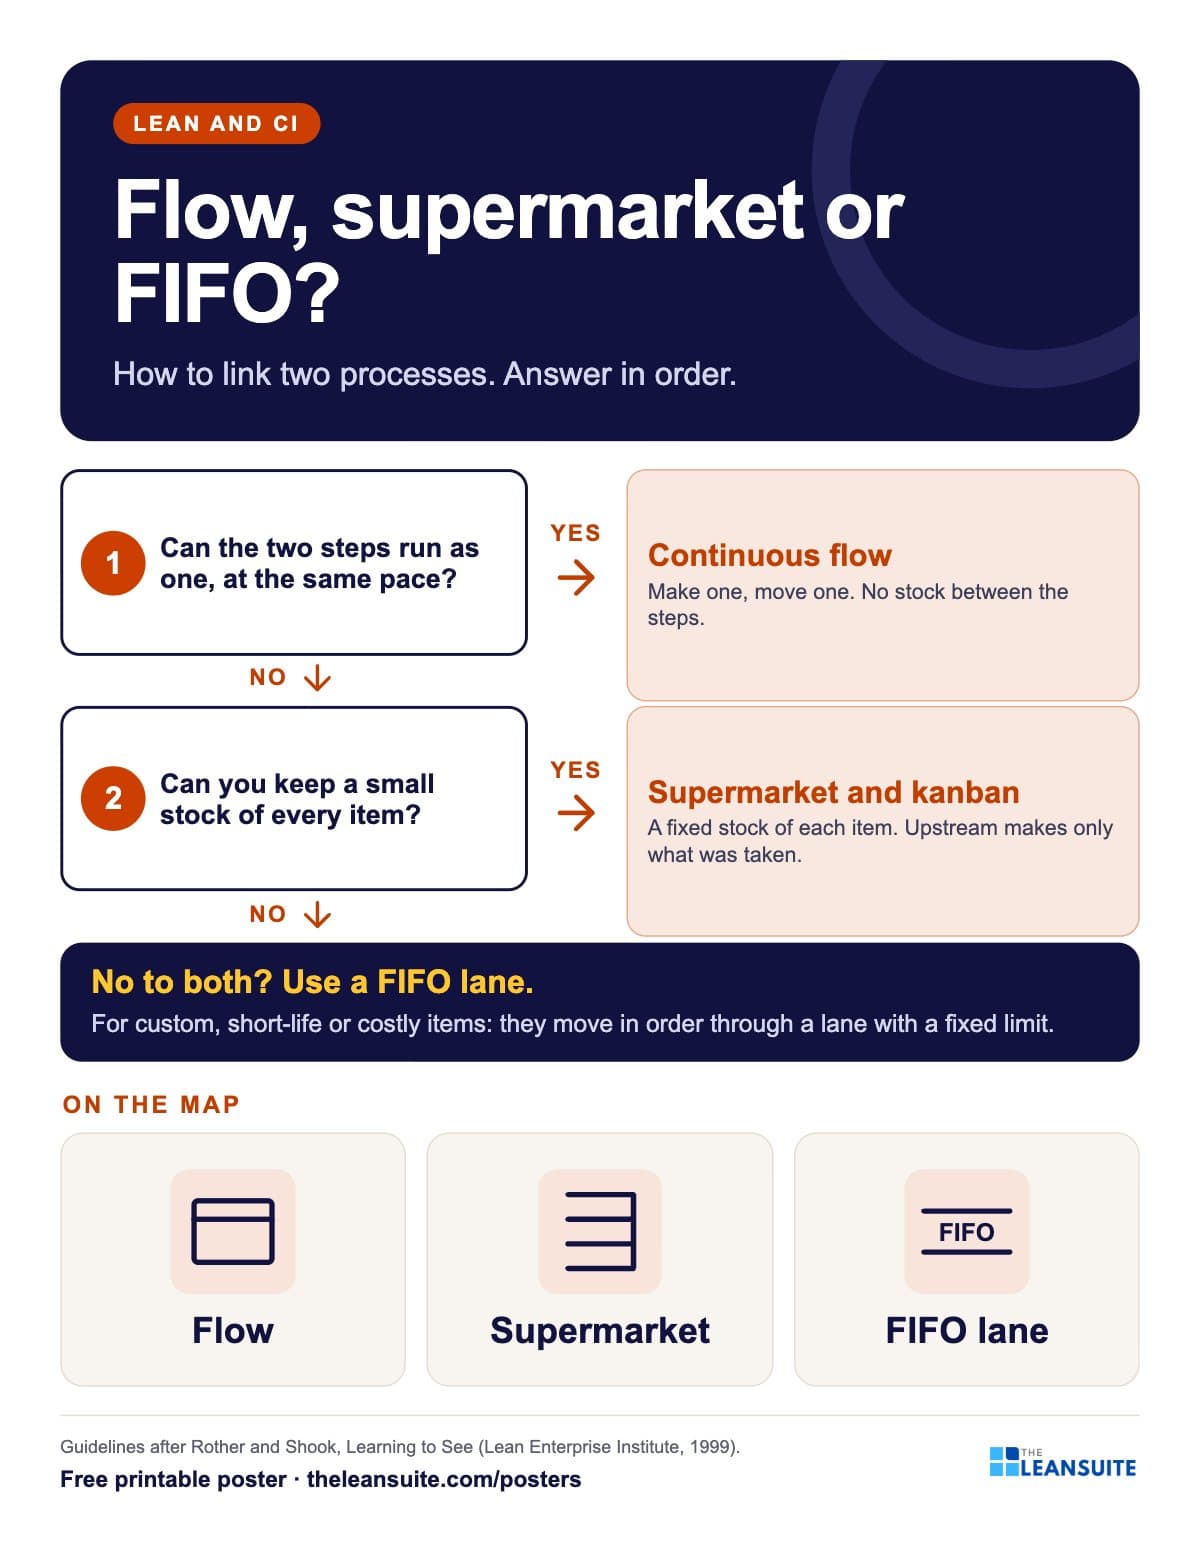 Flow, supermarket or FIFO lane poster
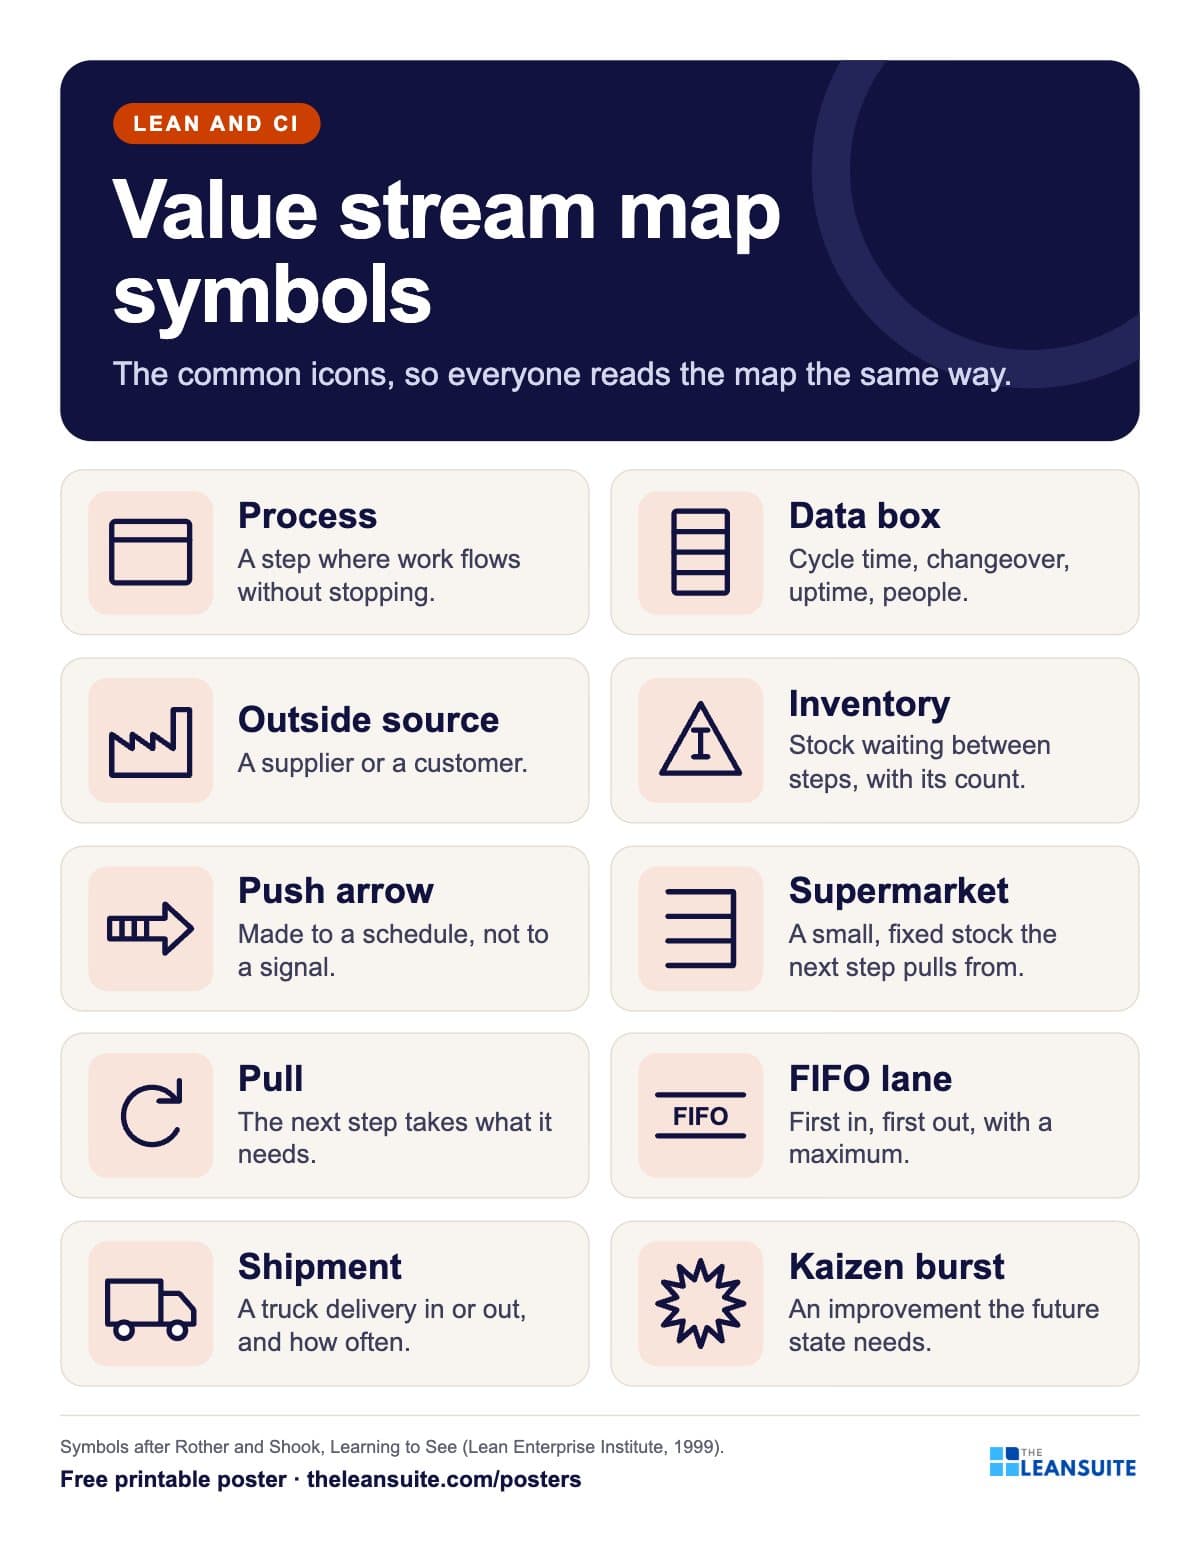 Value stream map symbols poster
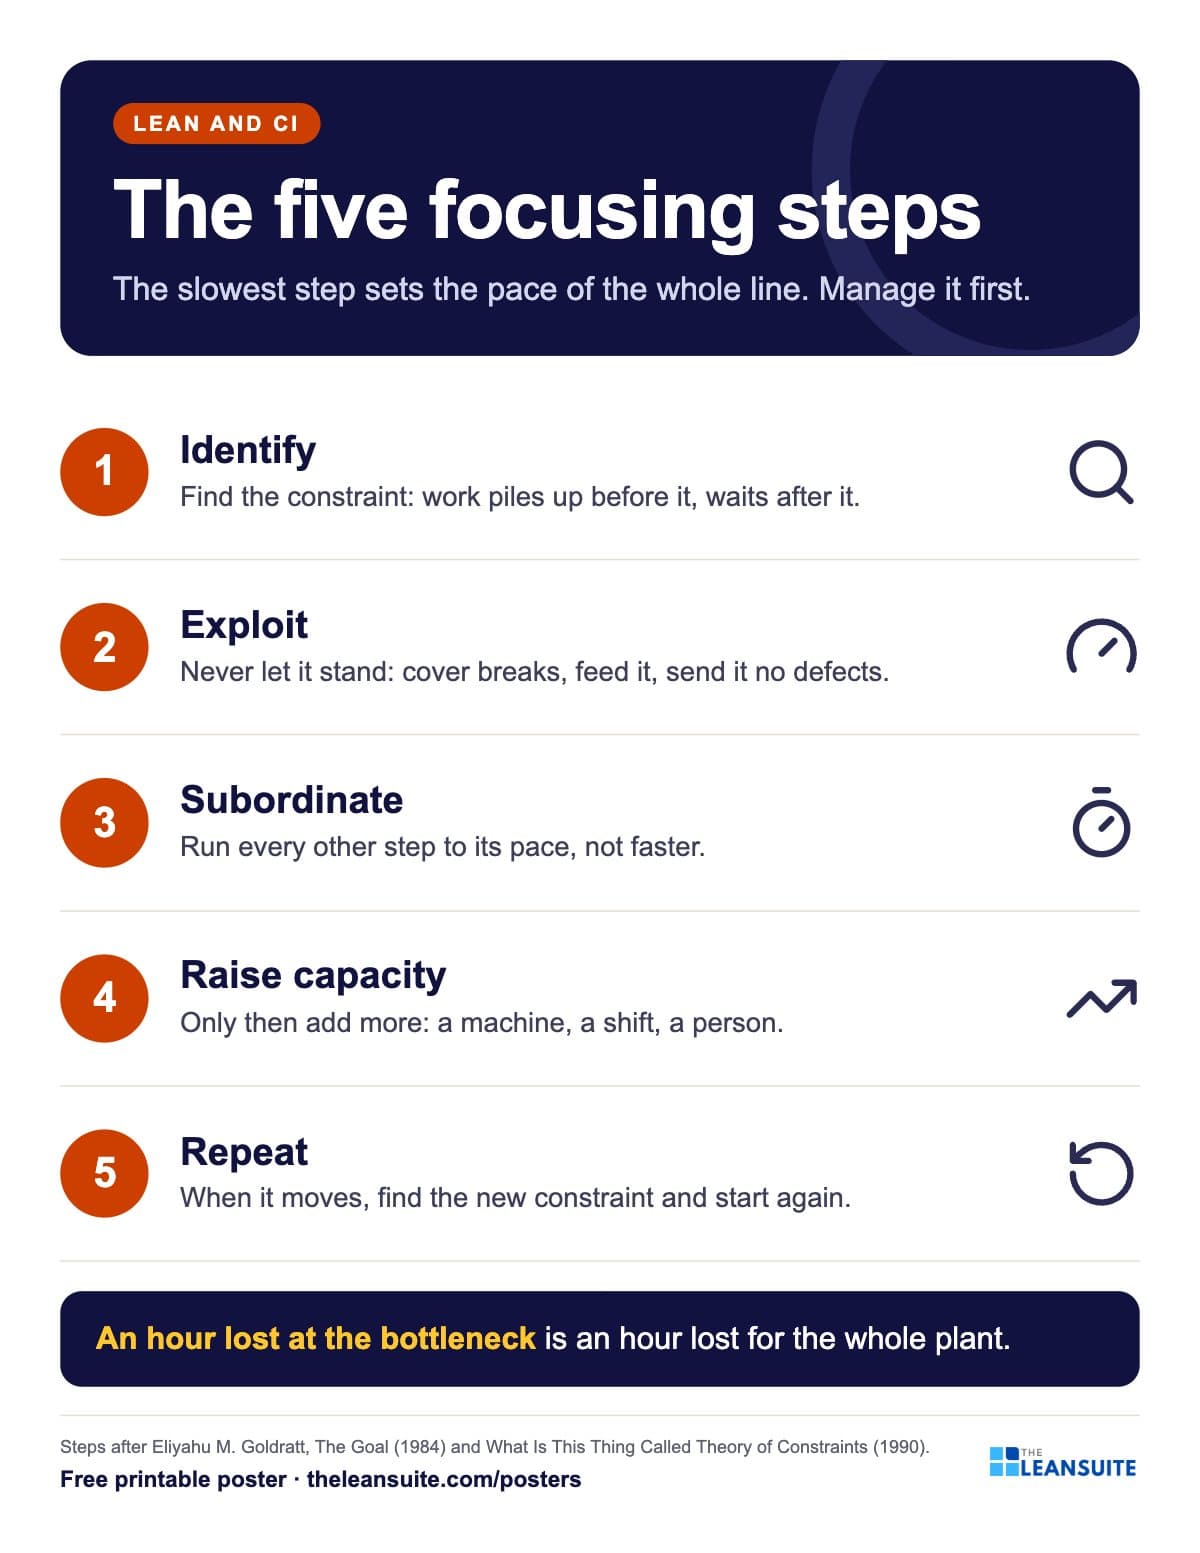 Bottleneck five focusing steps poster
A poster reminds. A routine makes it stick.
See how plants run their audits, improvements and follow-ups in LeanSuite, on a call built around your own problem.
Book a 45-minute demo