

Lean and CI poster
Updated · Free to print and share
Value stream map symbols poster
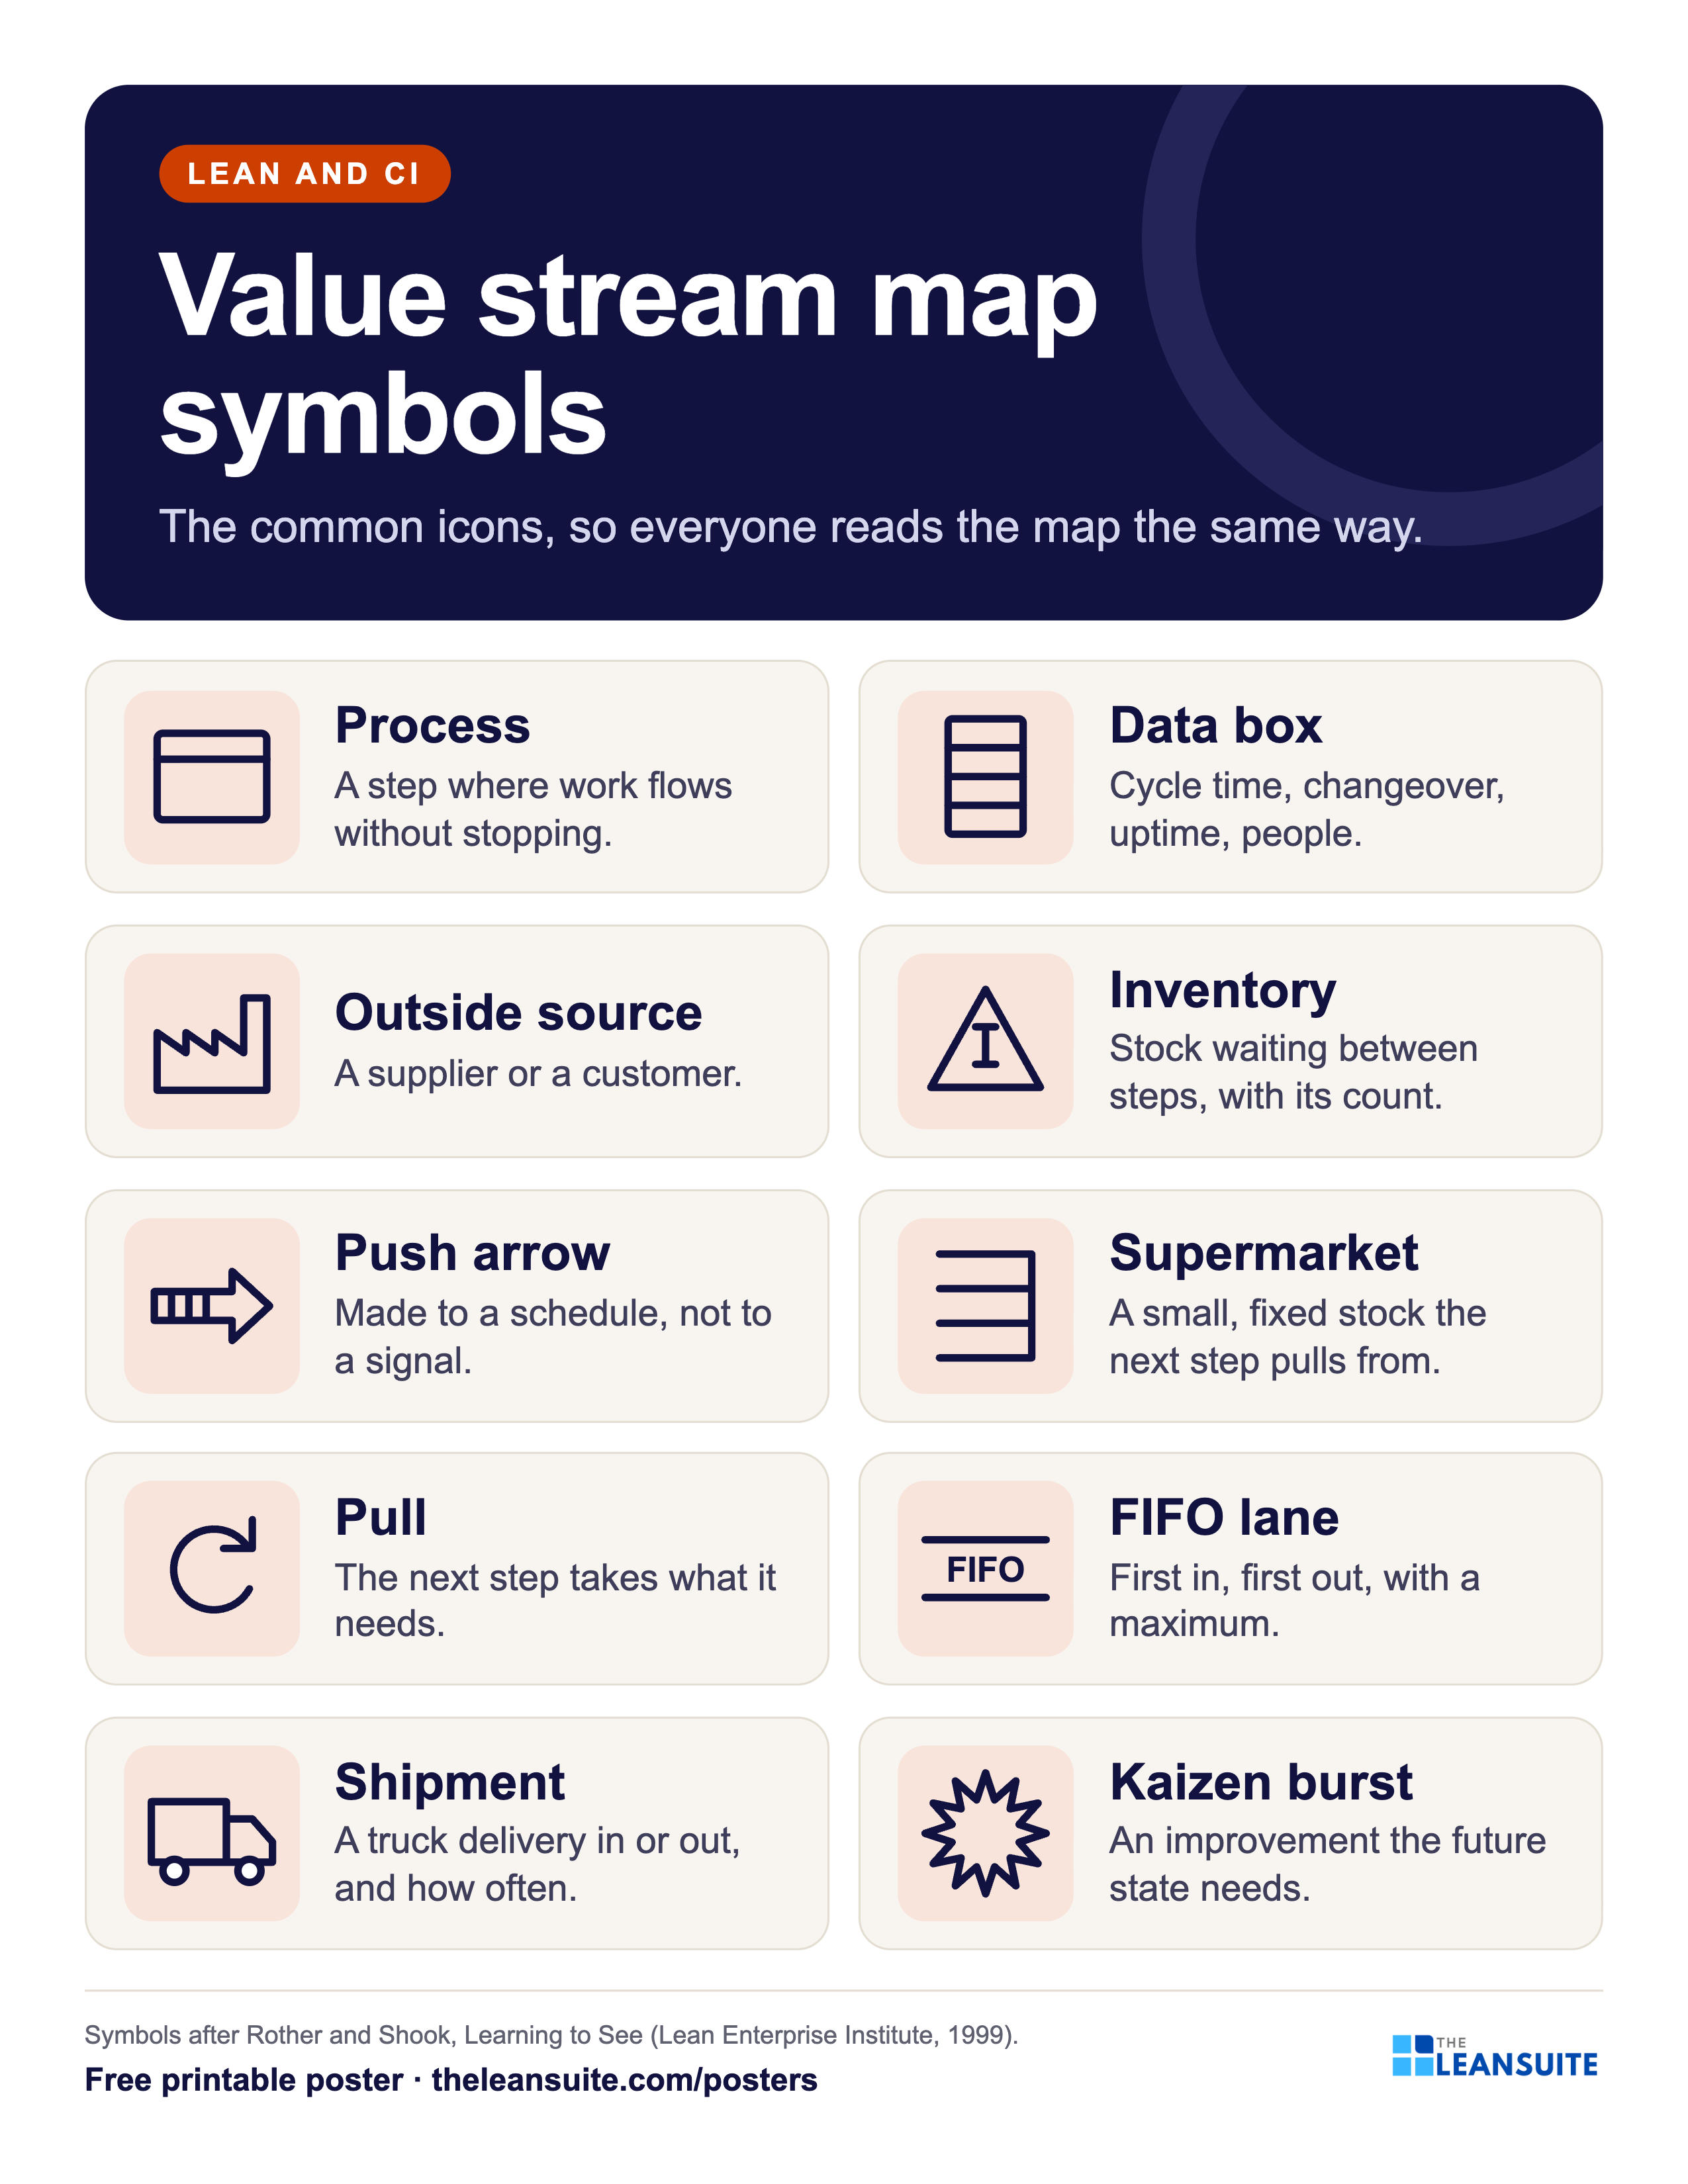
A value stream map uses a small set of symbols so that anyone can read it: a process box for each step where work flows, a data box under it, a triangle for inventory, striped push arrows, supermarkets, pull arrows, FIFO lanes, trucks for shipments and kaizen bursts for the improvements the future state needs. This poster draws ten of the most used symbols, as introduced in Rother and Shook's Learning to See, with one line on each.
Download the poster
The PNG is free to download now. The print-ready vector PDFs open after a short form, once.
Free to print and share with your team. Enter your name and work email once to download.
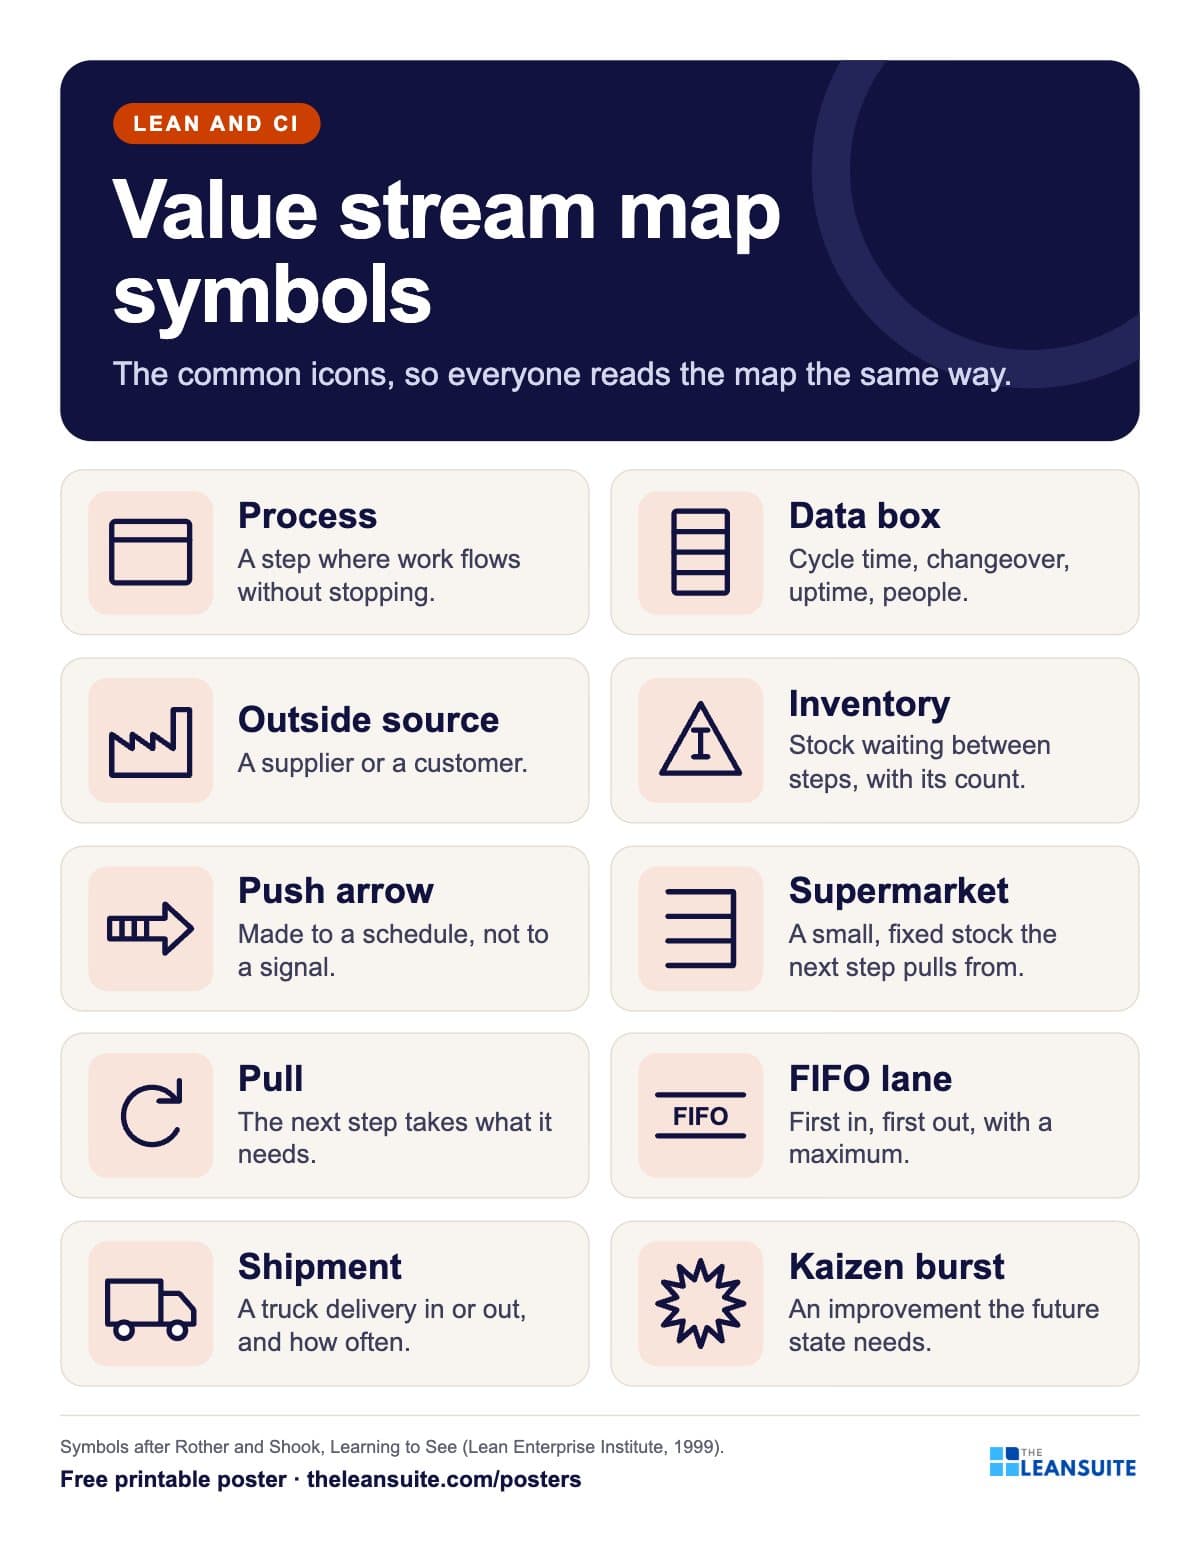 Ten cards, each with a drawn value stream map symbol such as process box, inventory triangle, supermarket and kaizen burst, and its meaning.
The words on the poster
Value stream map symbols
The common icons, so everyone reads the map the same way.
- Process A step where work flows without stopping.
- Data box Cycle time, changeover, uptime, people.
- Outside source A supplier or a customer.
- Inventory Stock waiting between steps, with its count.
- Push arrow Made to a schedule, not to a signal.
- Supermarket A small, fixed stock the next step pulls from.
- Pull The next step takes what it needs.
- FIFO lane First in, first out, with a maximum.
- Shipment A truck delivery in or out, and how often.
- Kaizen burst An improvement the future state needs.
Symbols after Rother and Shook, Learning to See (Lean Enterprise Institute, 1999).
On the floor
How to use it
Putting the Value stream map symbols poster to work
- 1
Put it on the wall where value stream maps are drawn, at the eye level of the people drawing.
- 2
Hand out the Letter size at the start of a mapping workshop.
- 3
Use it to check a finished map: is every symbol one the whole team can read?
- 4
Pair it with the free future state VSM worksheet and value stream plan.
Which size to print
- 24 x 36 in or A2: a main wall or team board, read from a few metres away.
- 18 x 24 in or A3: a station or notice board. The A3 file also fits 11 x 17 in paper.
- Letter or A4: a clipboard, binder or handout, on any office printer.
Every PDF is vector, so it stays sharp at full size. Nothing runs to the edge of the page, so no bleed is needed.
Sources and notes
Mapping software and books draw some symbols slightly differently. Information flows (a straight arrow for manual, a lightning arrow for electronic) and the timeline at the bottom of the map are not shown.
- Mike Rother and John Shook, Learning to See: Value Stream Mapping to Add Value and Eliminate Muda (Lean Enterprise Institute, 1999): the map symbols, continuous flow, supermarkets and FIFO lanes.
Templates, decks and guides to go with it
- Value stream plan (VSM action plan)The future-state map cut into loops, each with an objective and a measurable goal, and its kaizen bursts turned into owned, dated projects on a 12-month timeline.
- Future state value stream map worksheetThe eight future-state questions worked through in order: takt, pitch, flow, supermarkets, the pacemaker and the mix, with an EPEI check and current against future lead time.
- Topic: Value stream mapping and flowEvery guide we have on the subject, sorted.
More lean and ci posters
All posters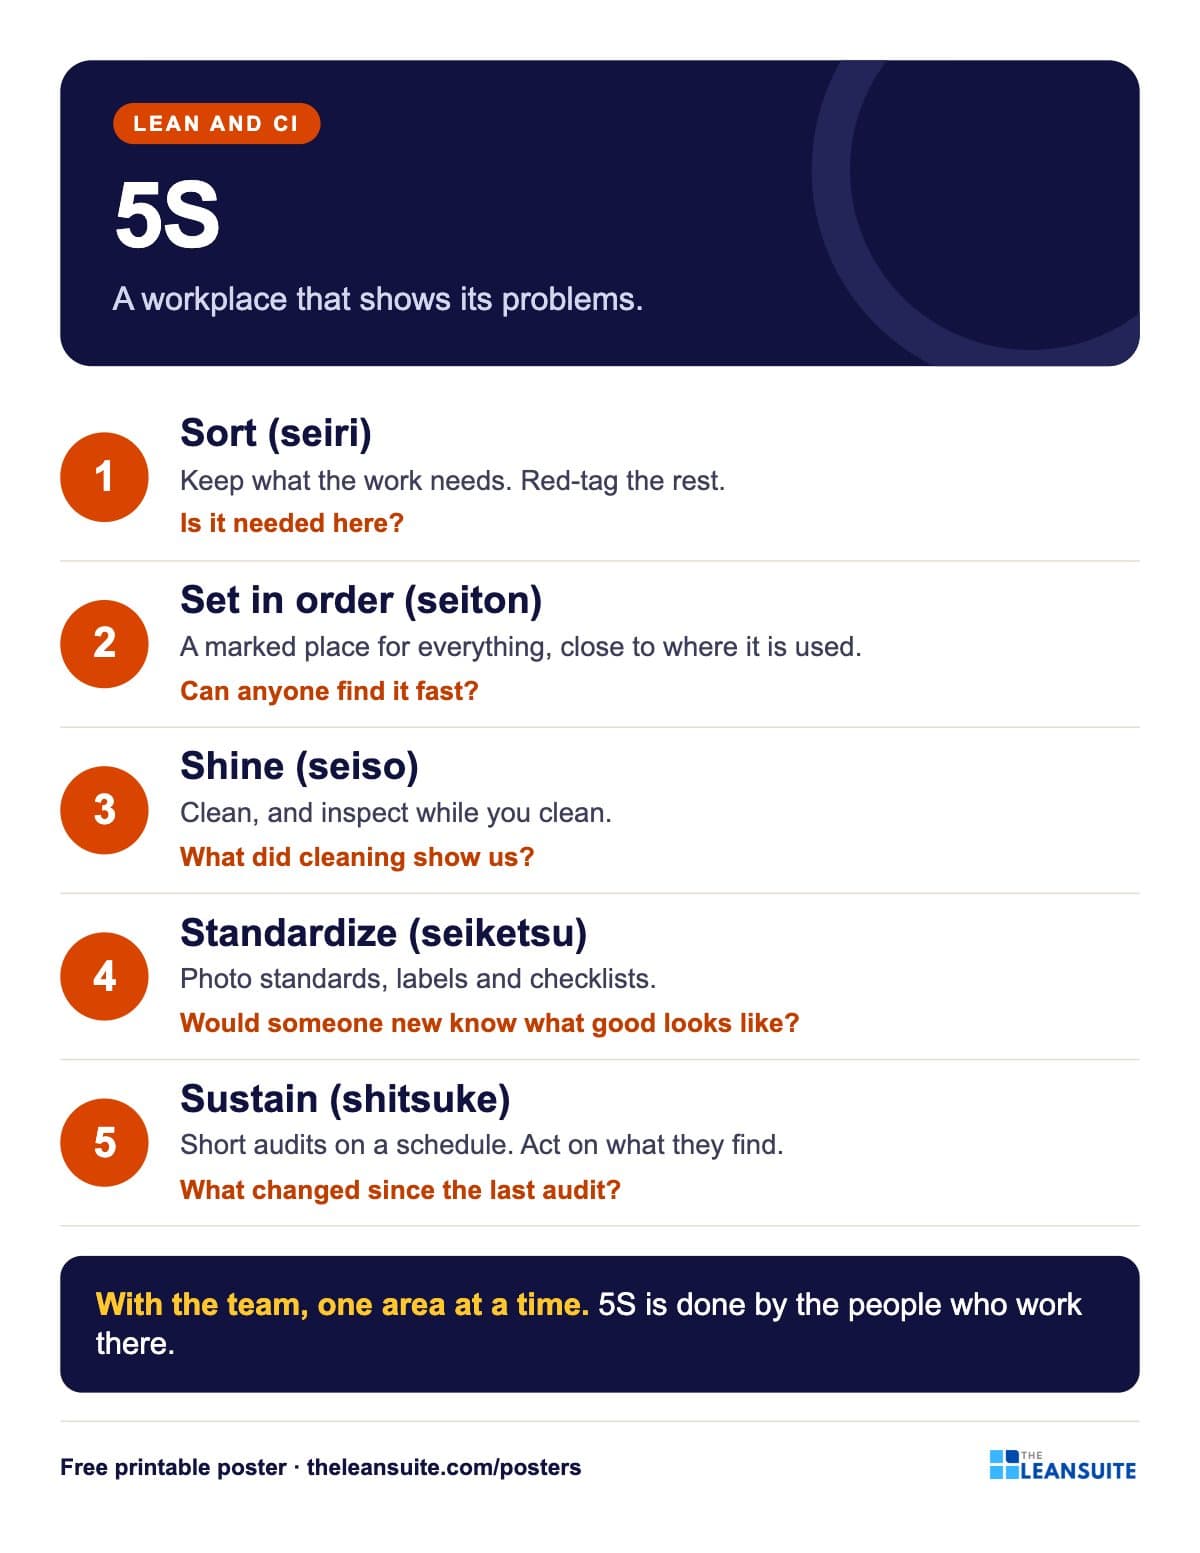 5S poster
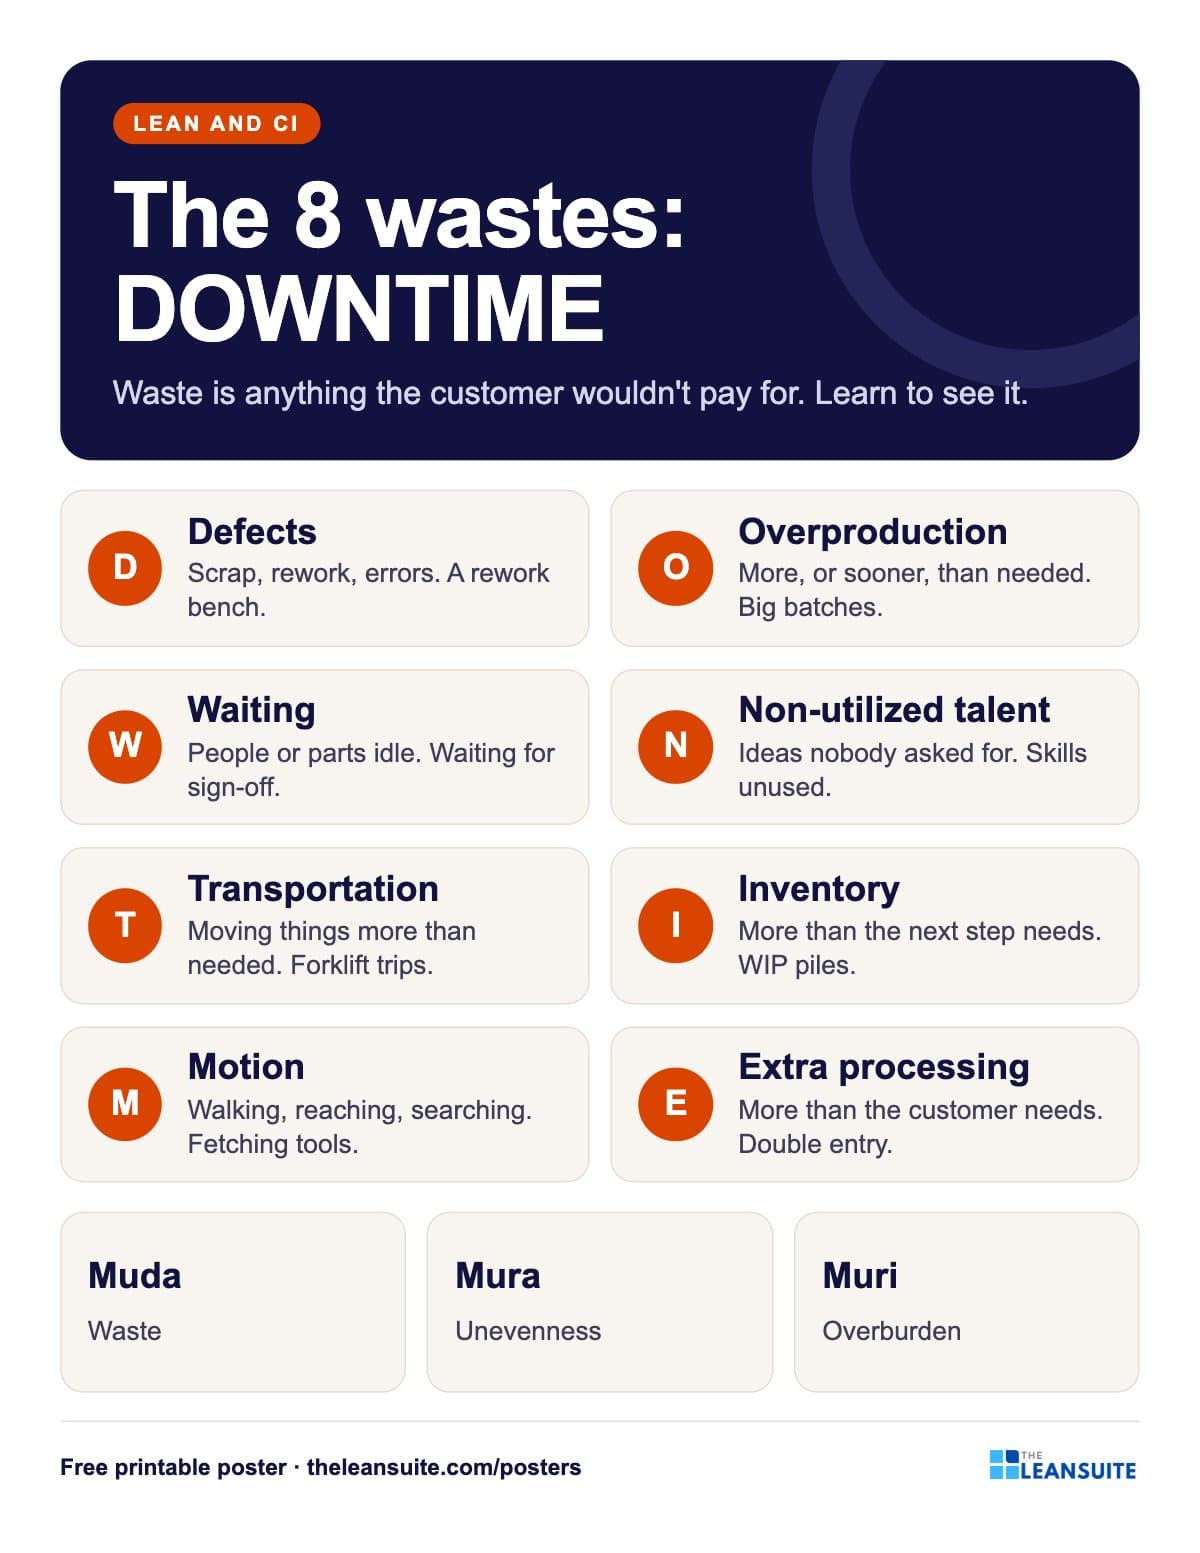 8 wastes of lean poster (DOWNTIME)
 Kaizen principles poster
 Visual management poster
 Standard work poster
 Gemba walk questions poster
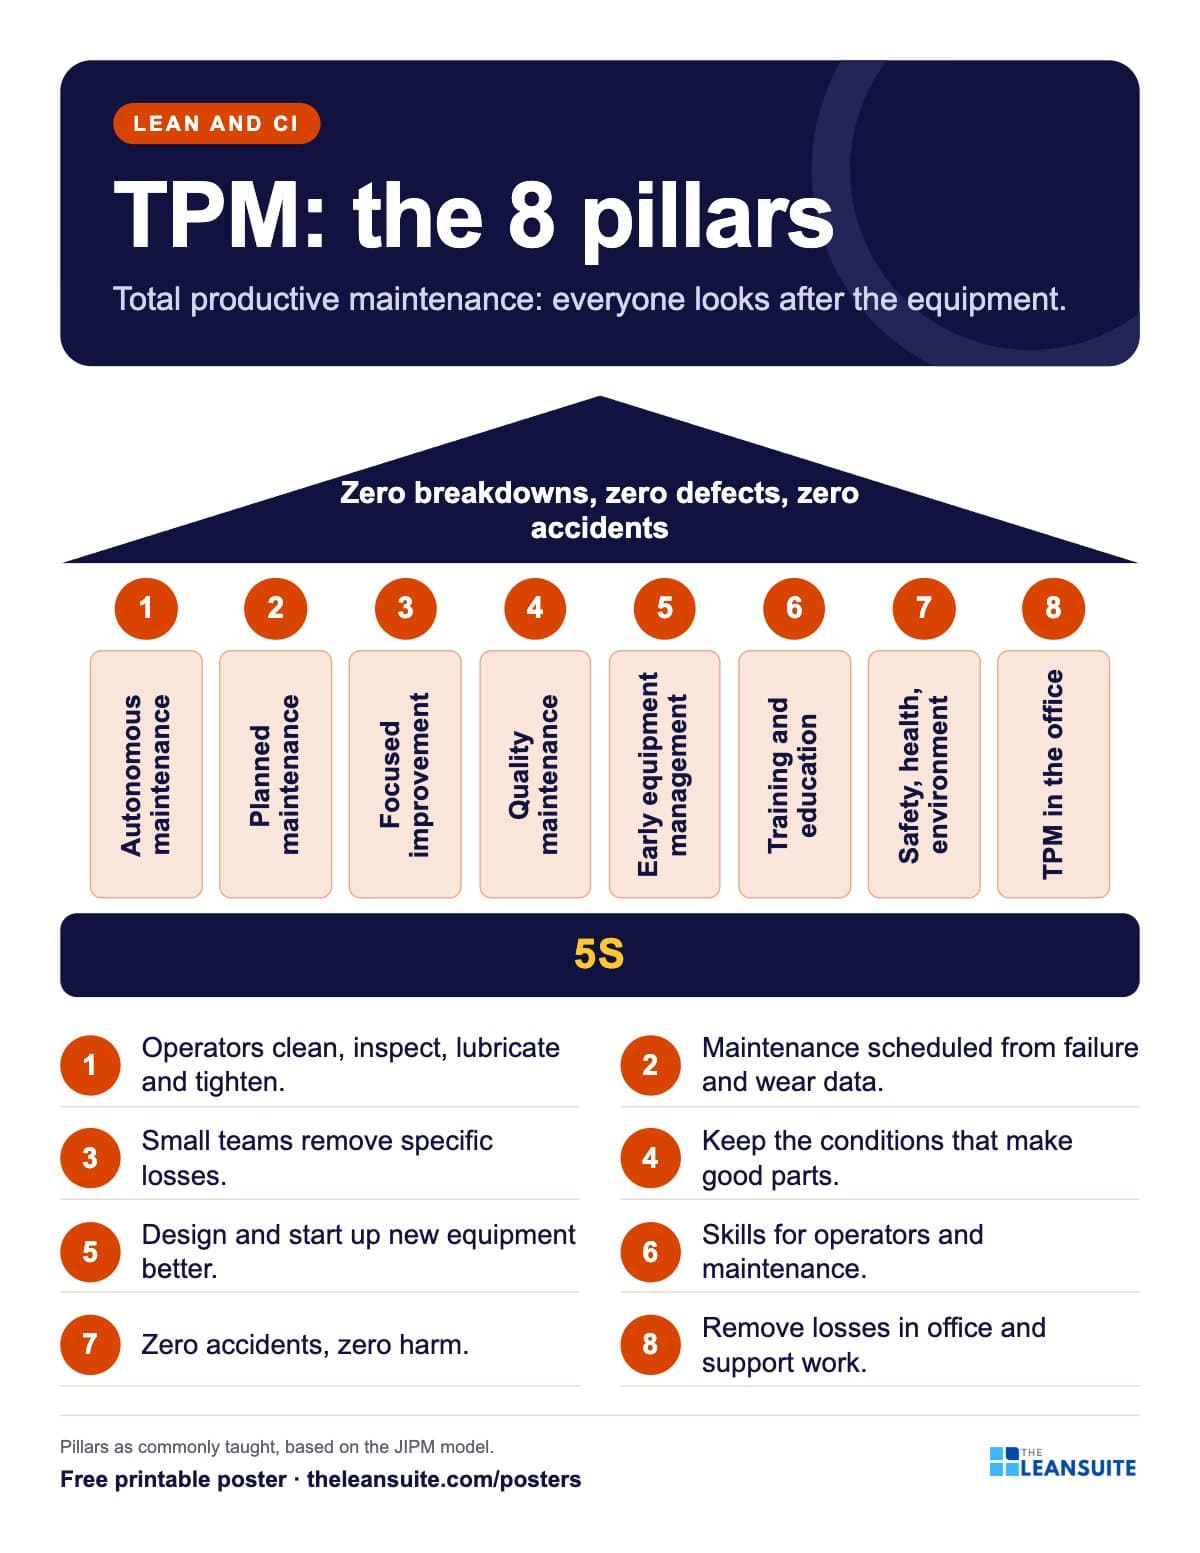 TPM 8 pillars poster
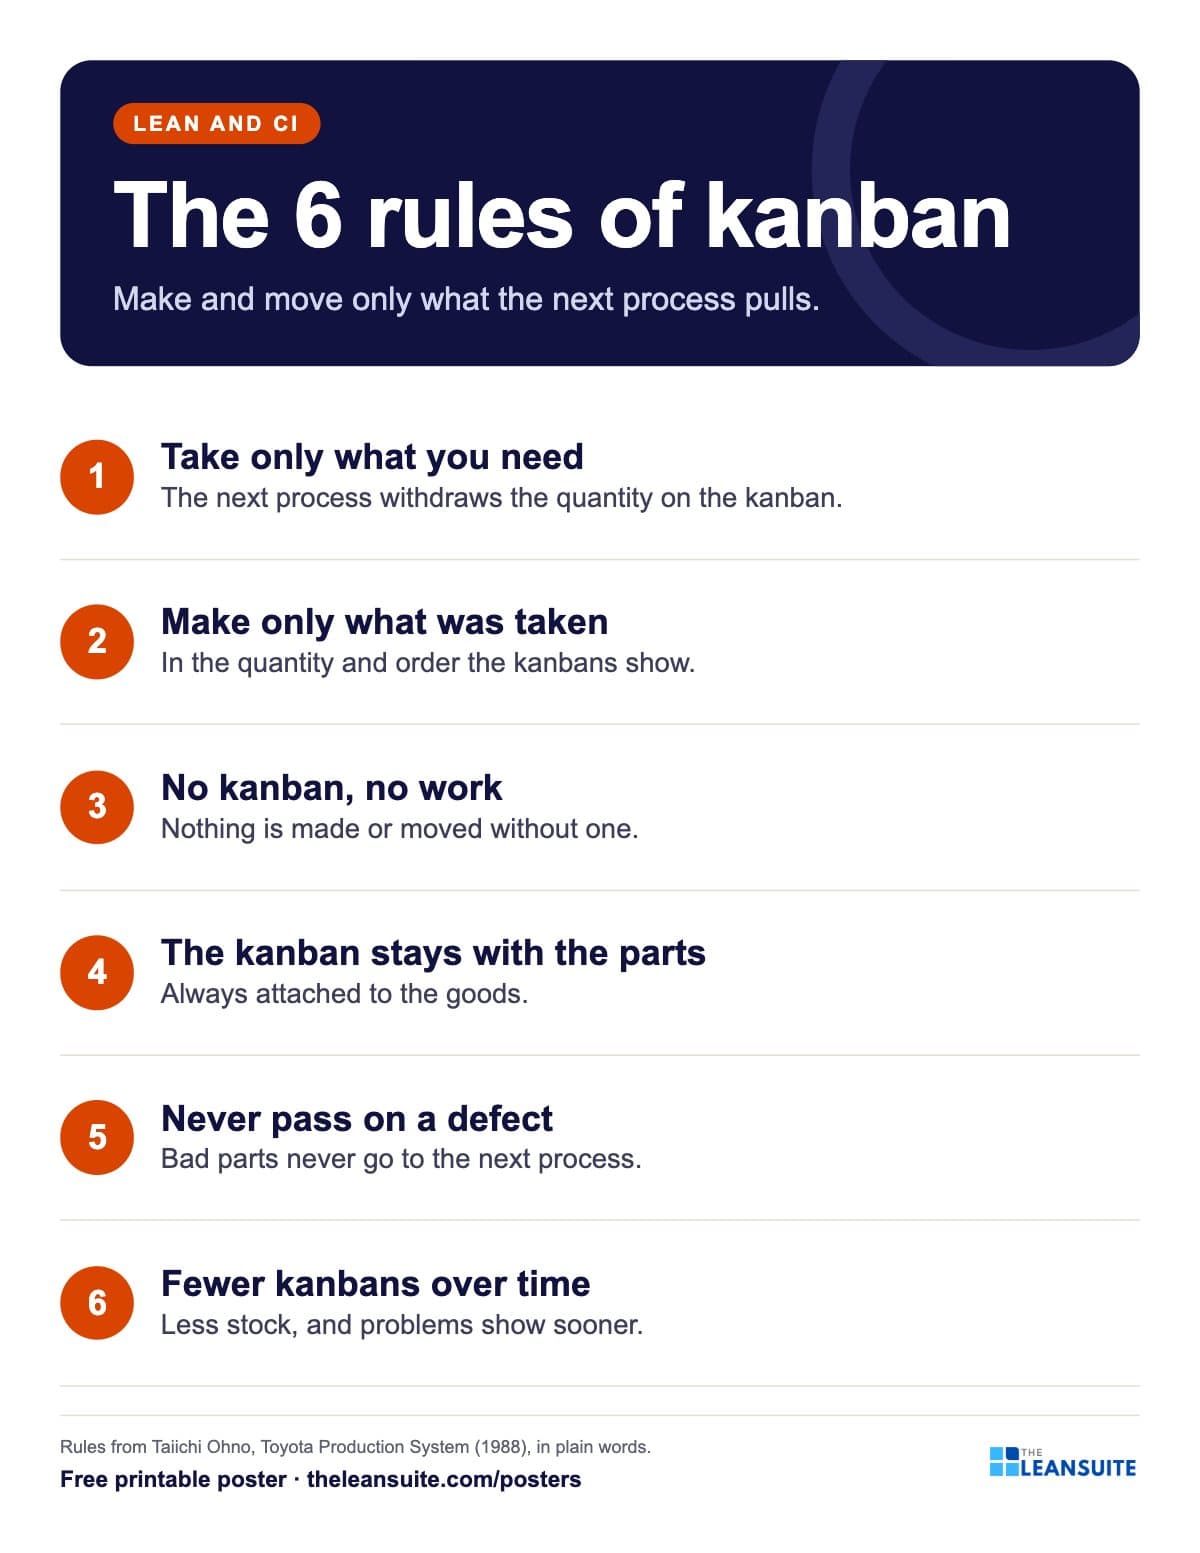 Kanban rules poster
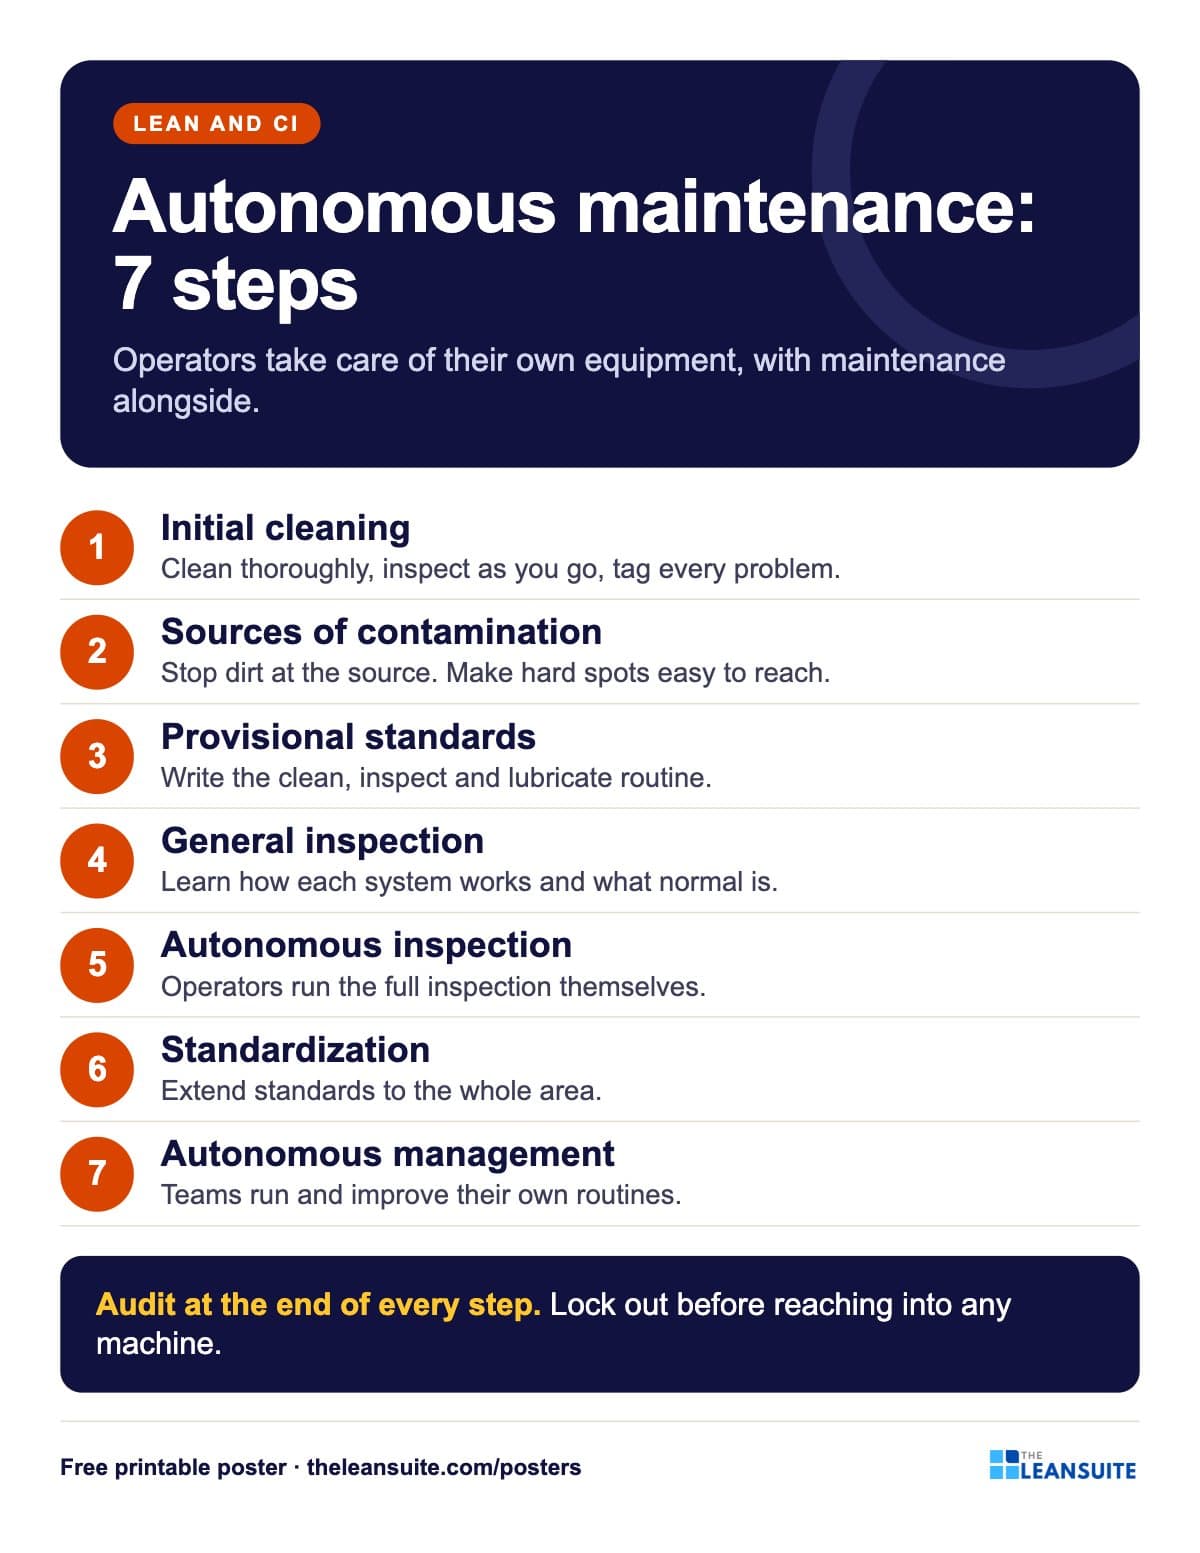 Autonomous maintenance 7 steps poster
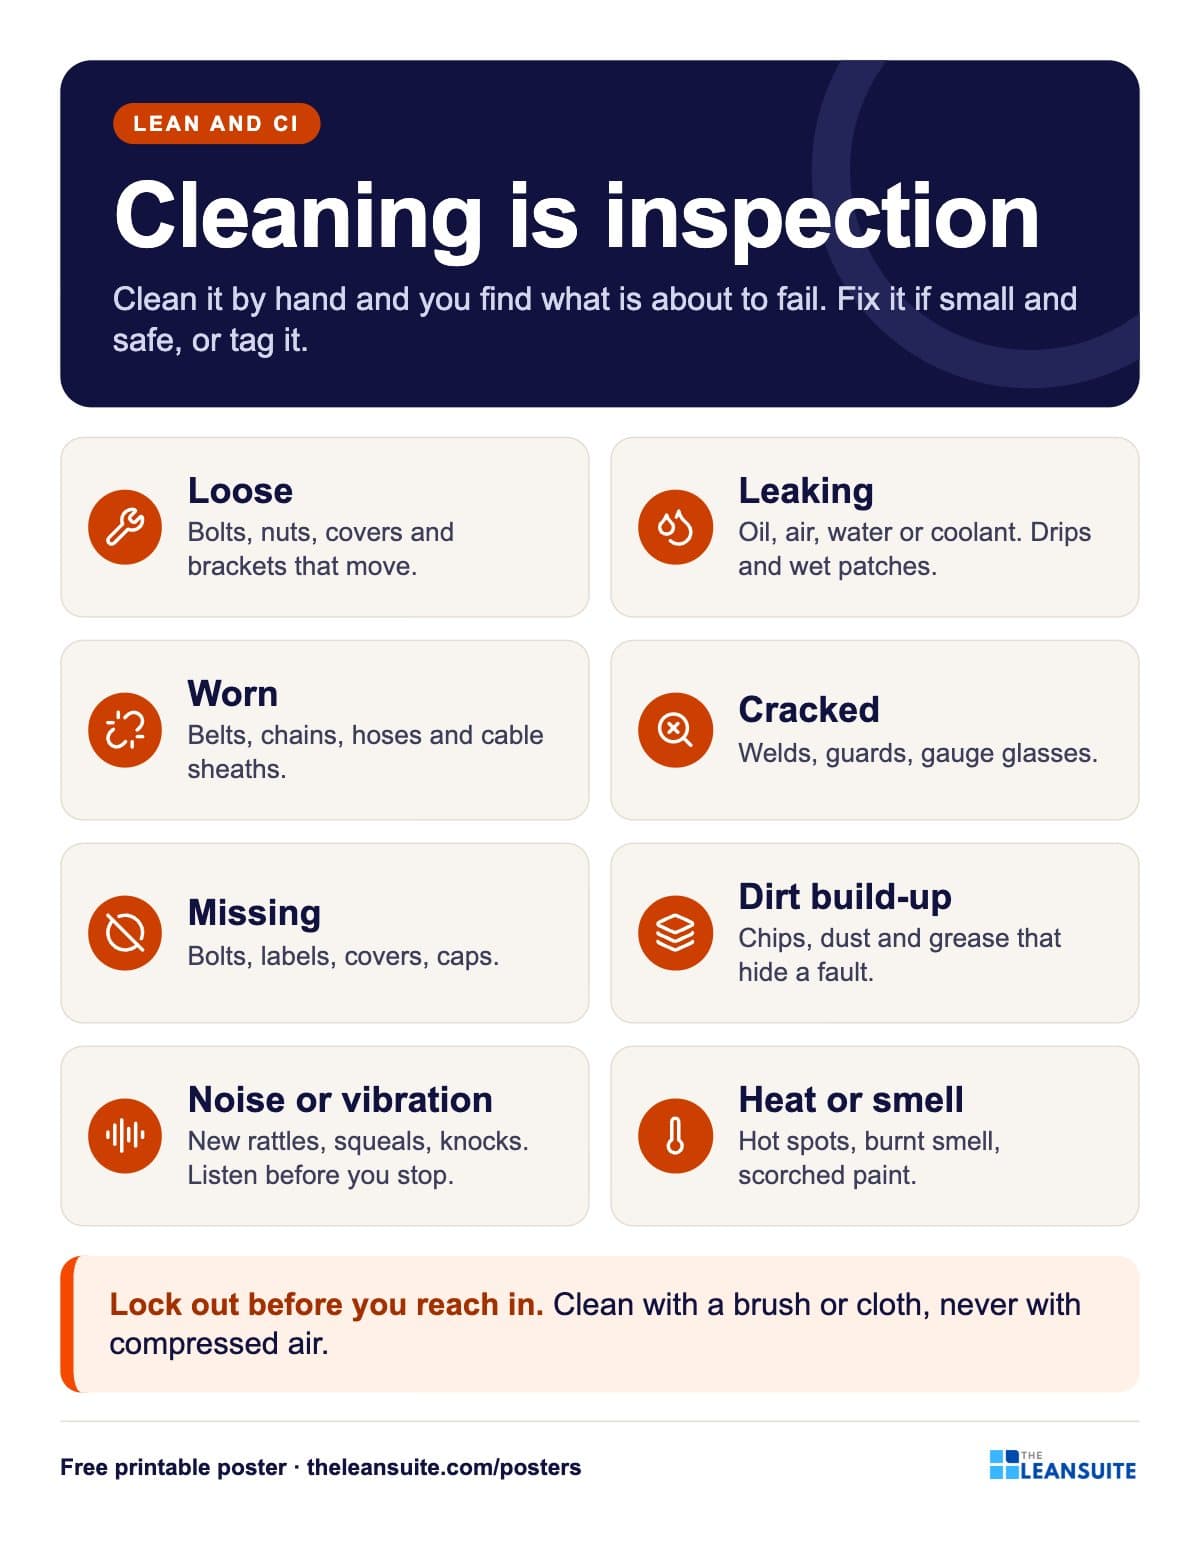 Cleaning is inspection poster
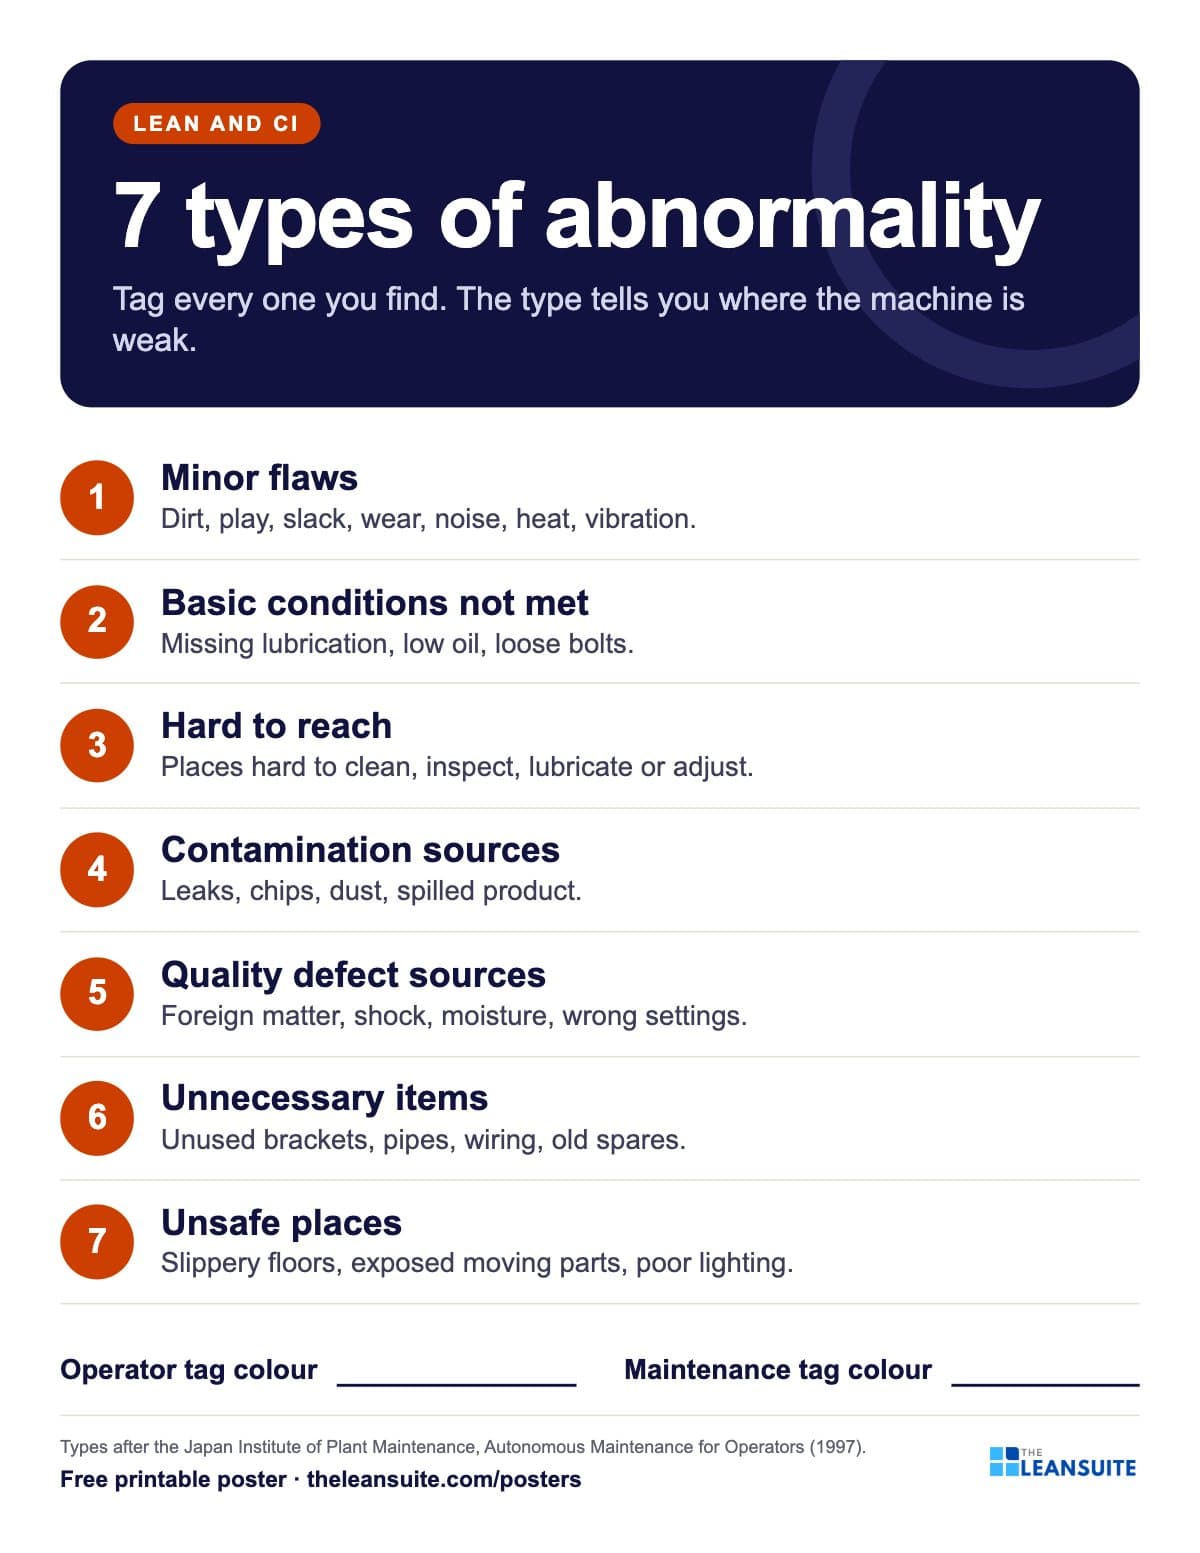 7 types of abnormality poster (TPM tags)
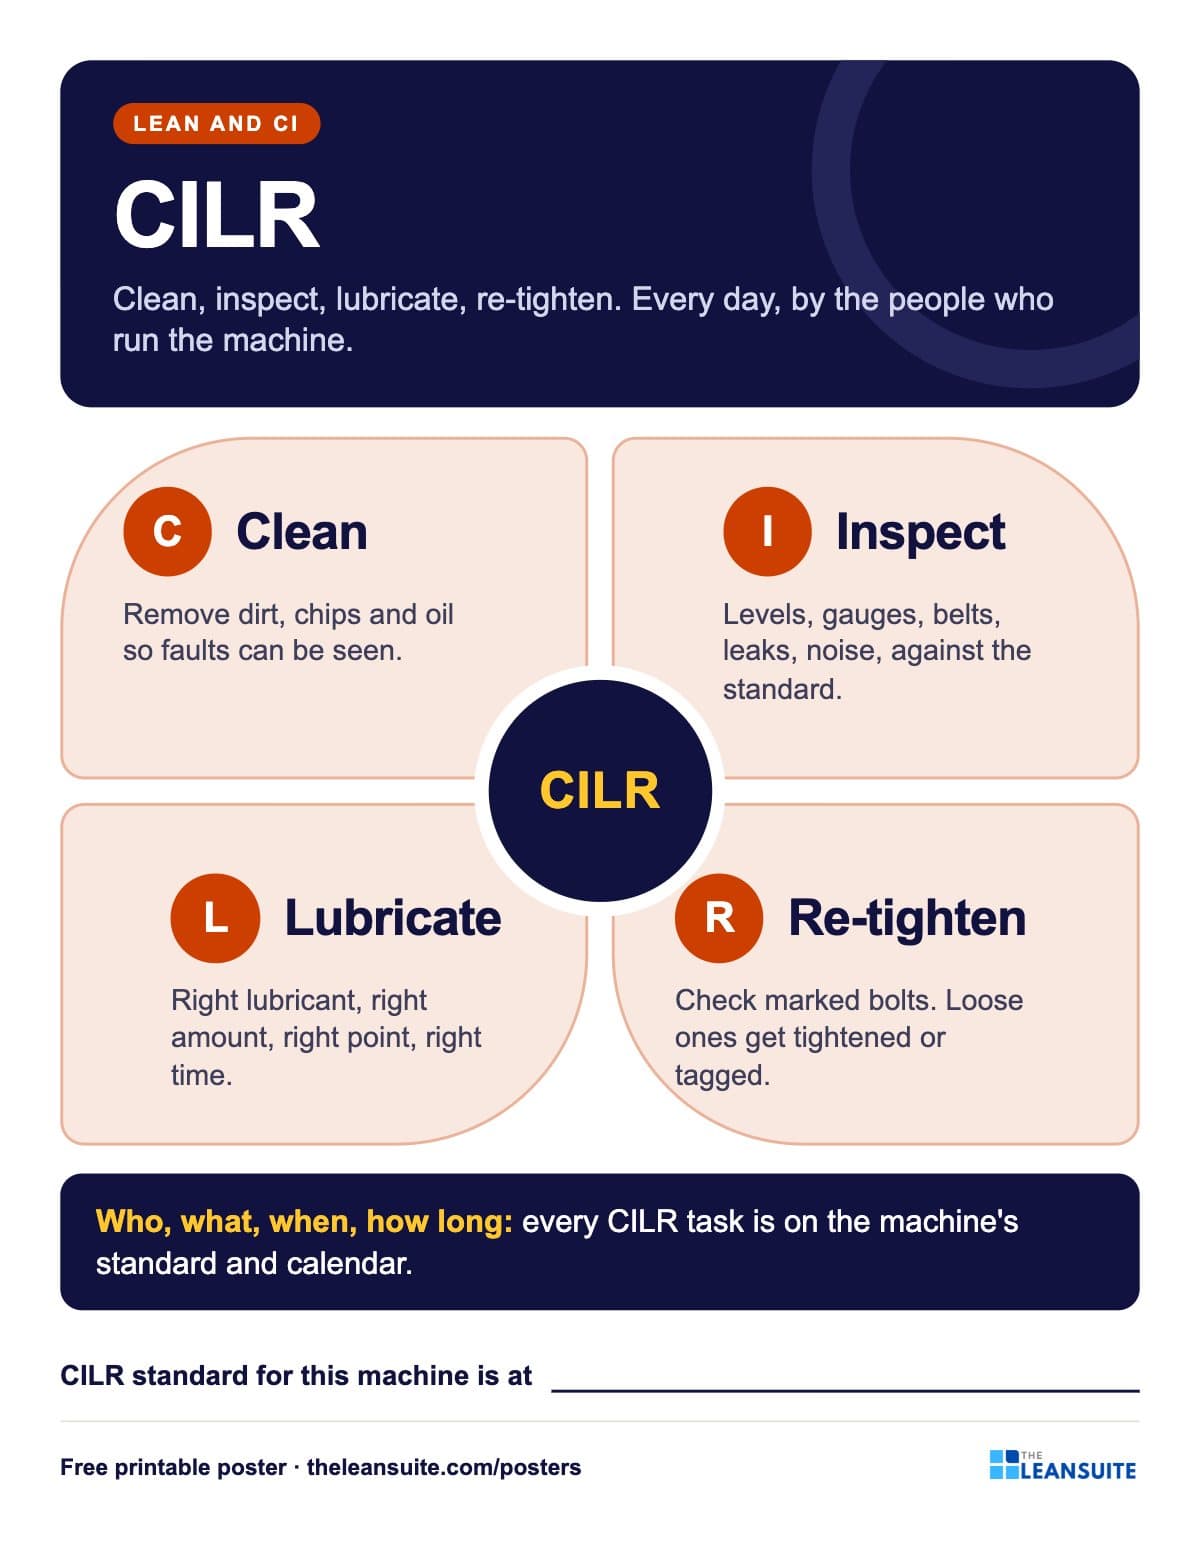 CILR poster: clean, inspect, lubricate, re-tighten
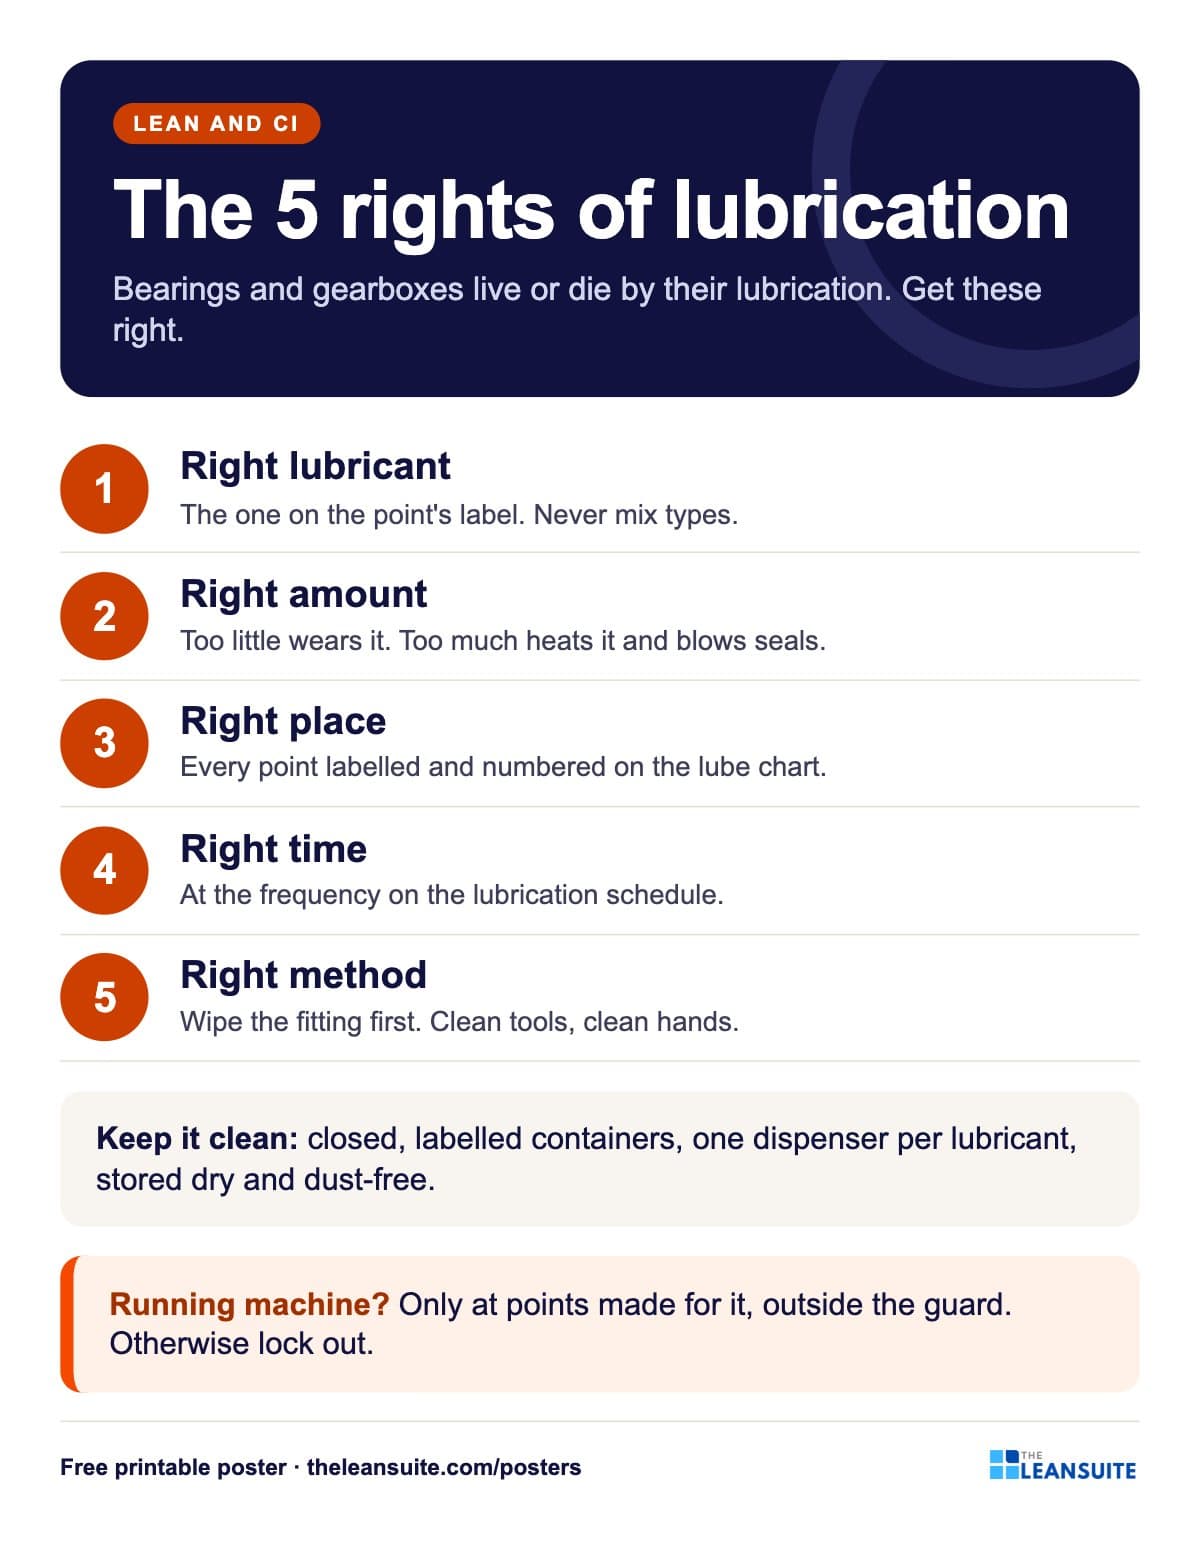 Lubrication basics poster: the five rights
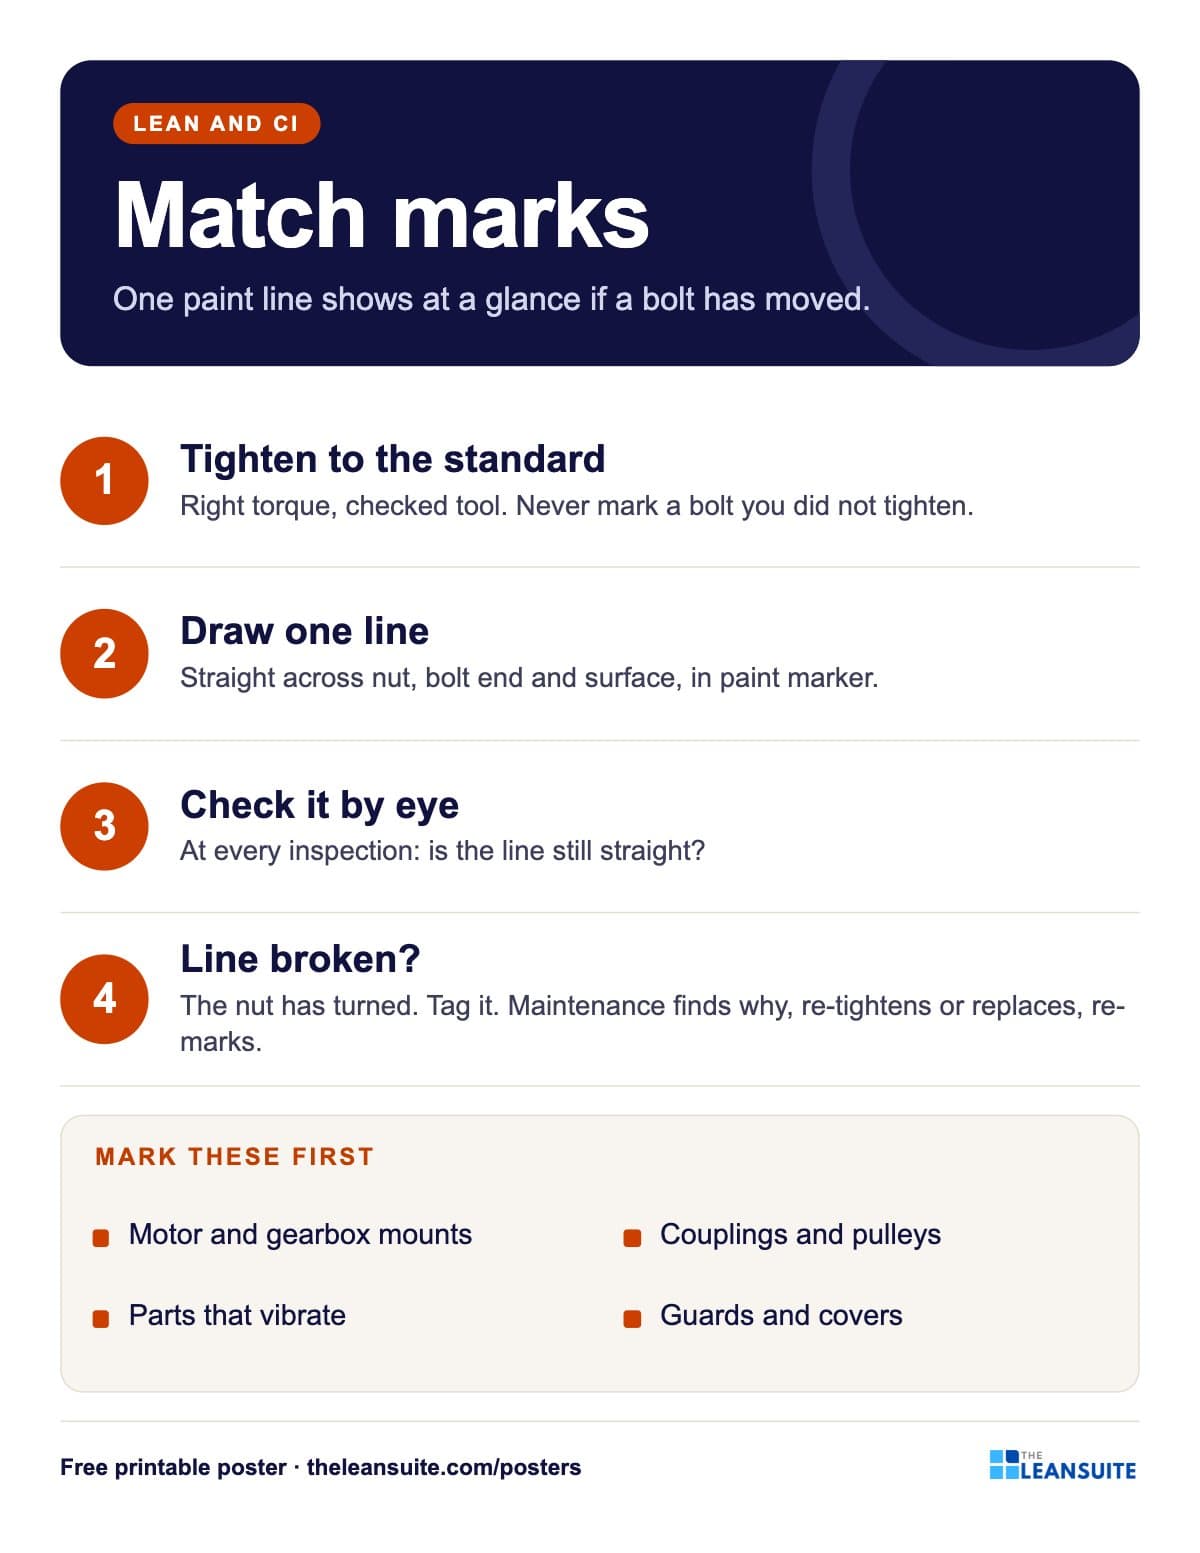 Bolt match marks poster
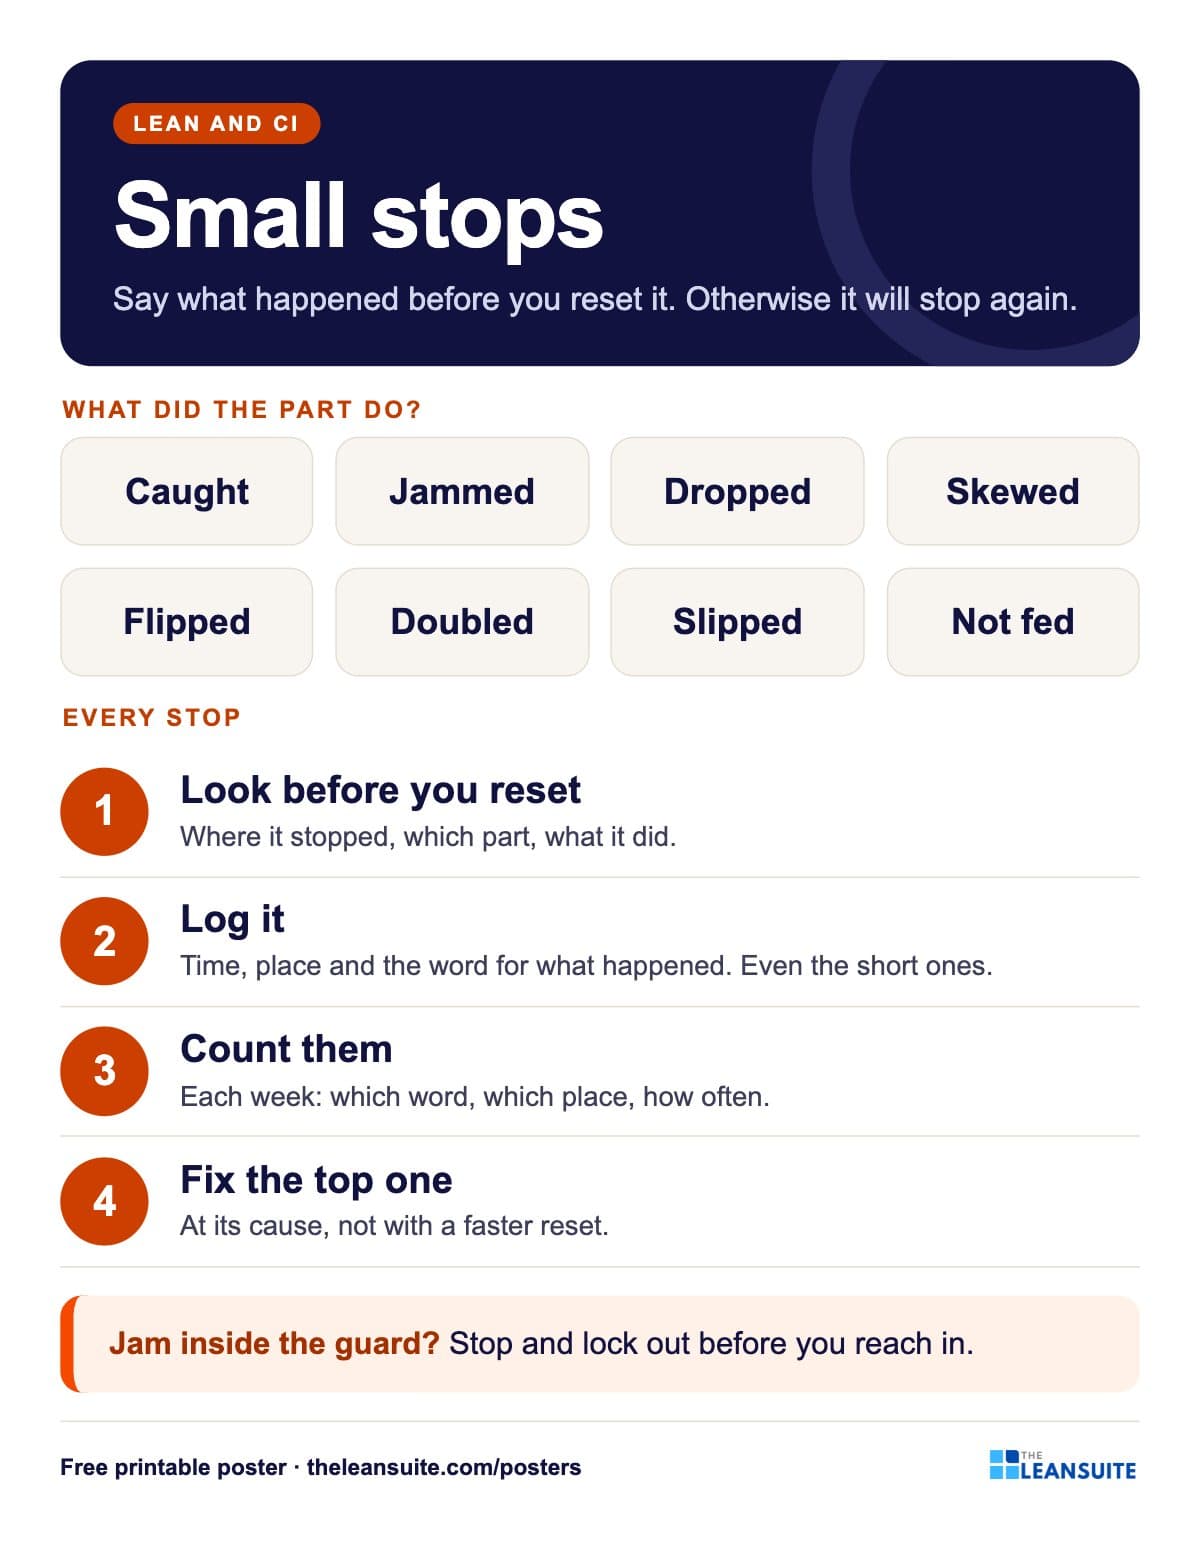 Small stops poster
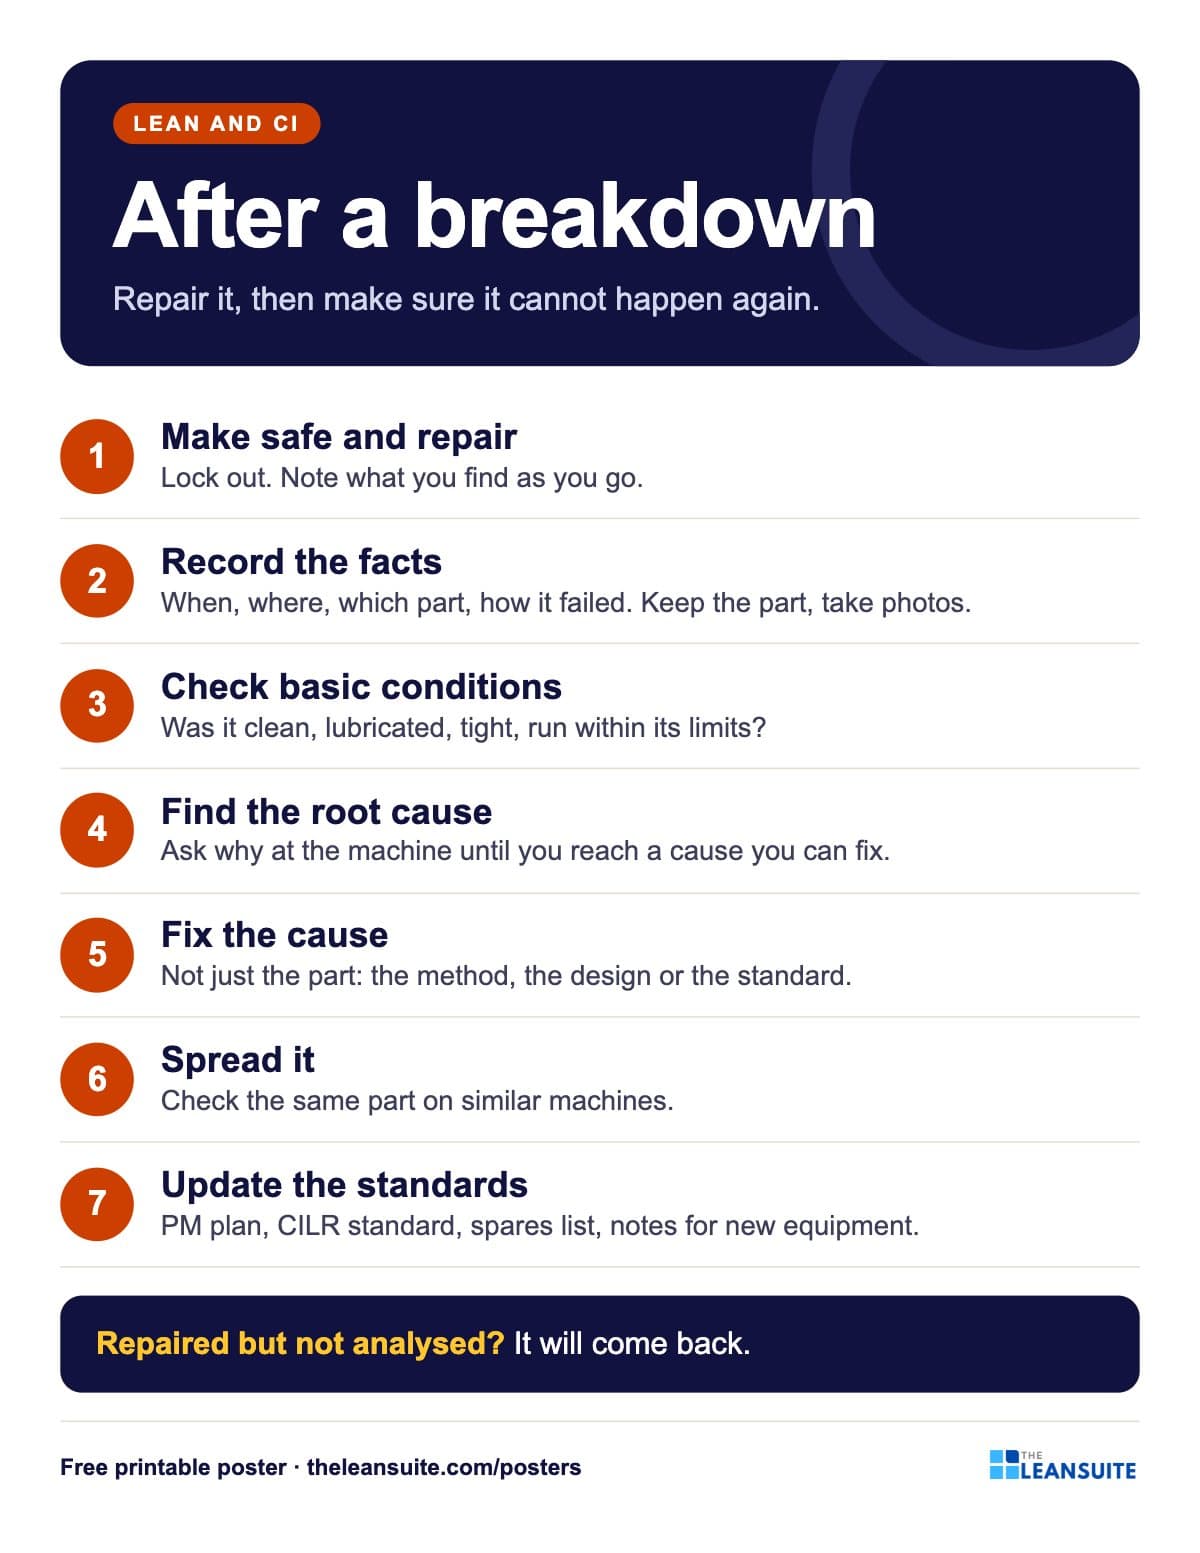 Breakdown analysis poster
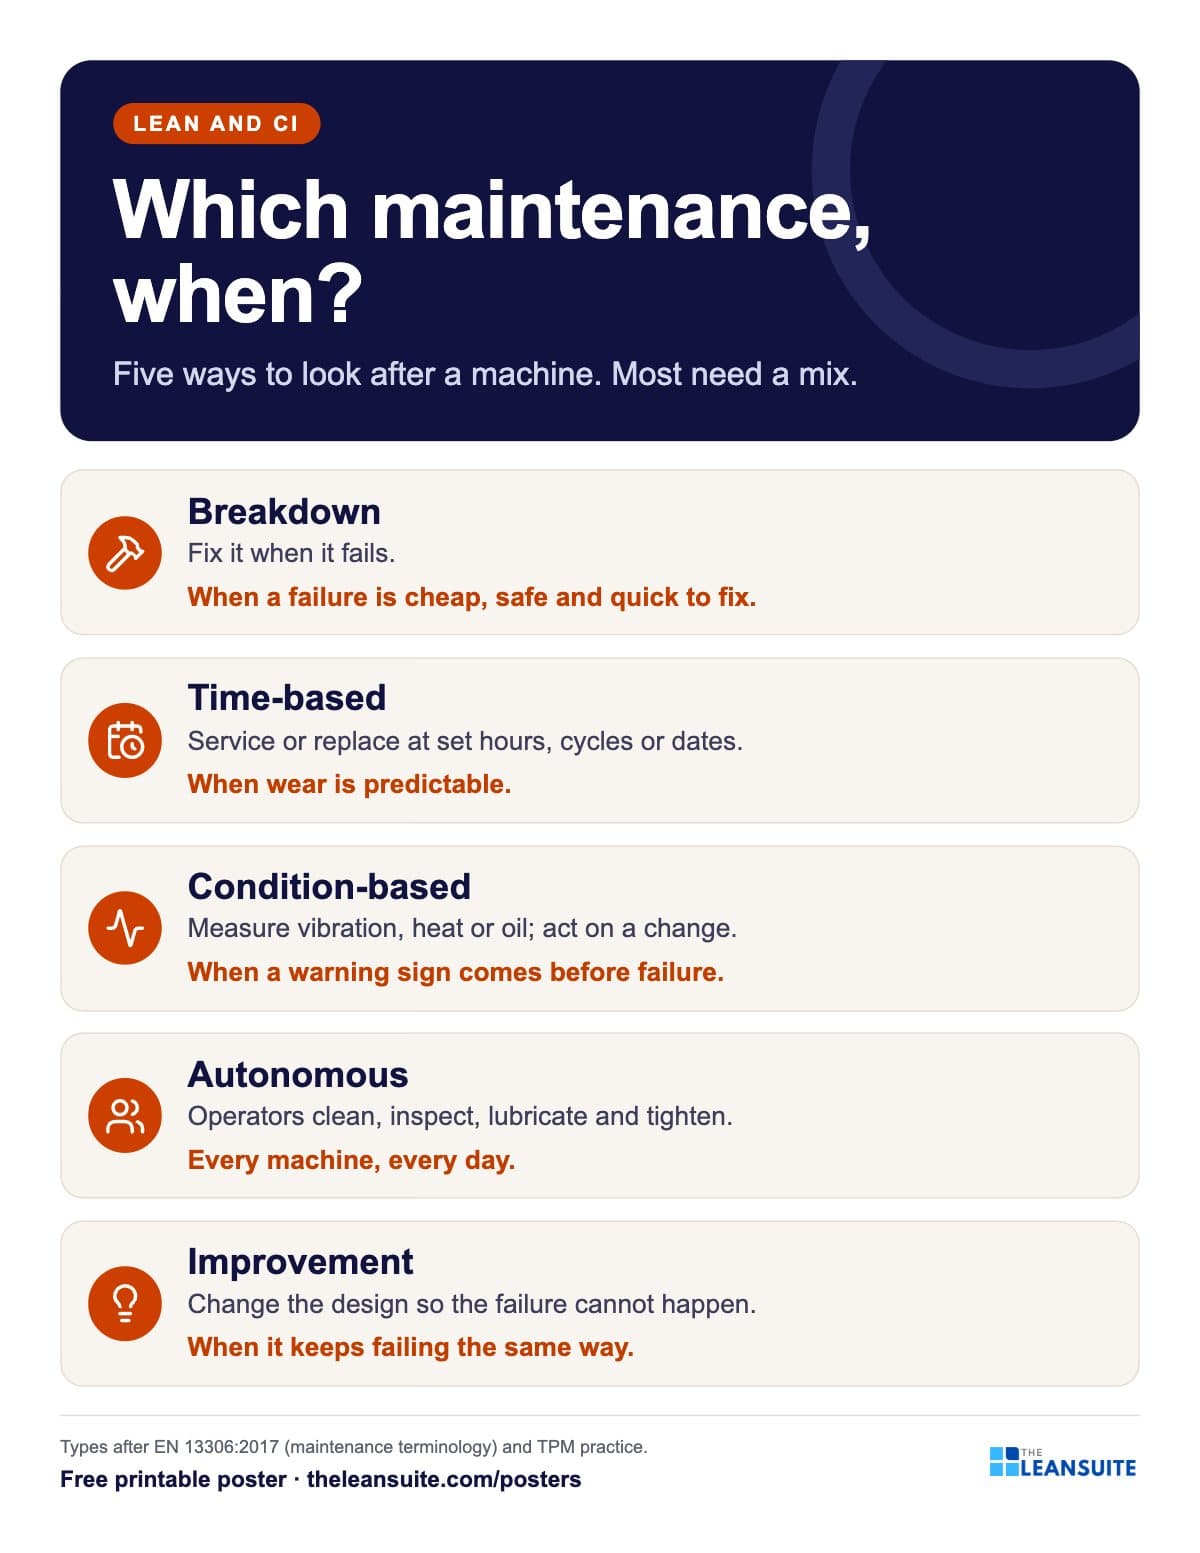 Types of maintenance poster
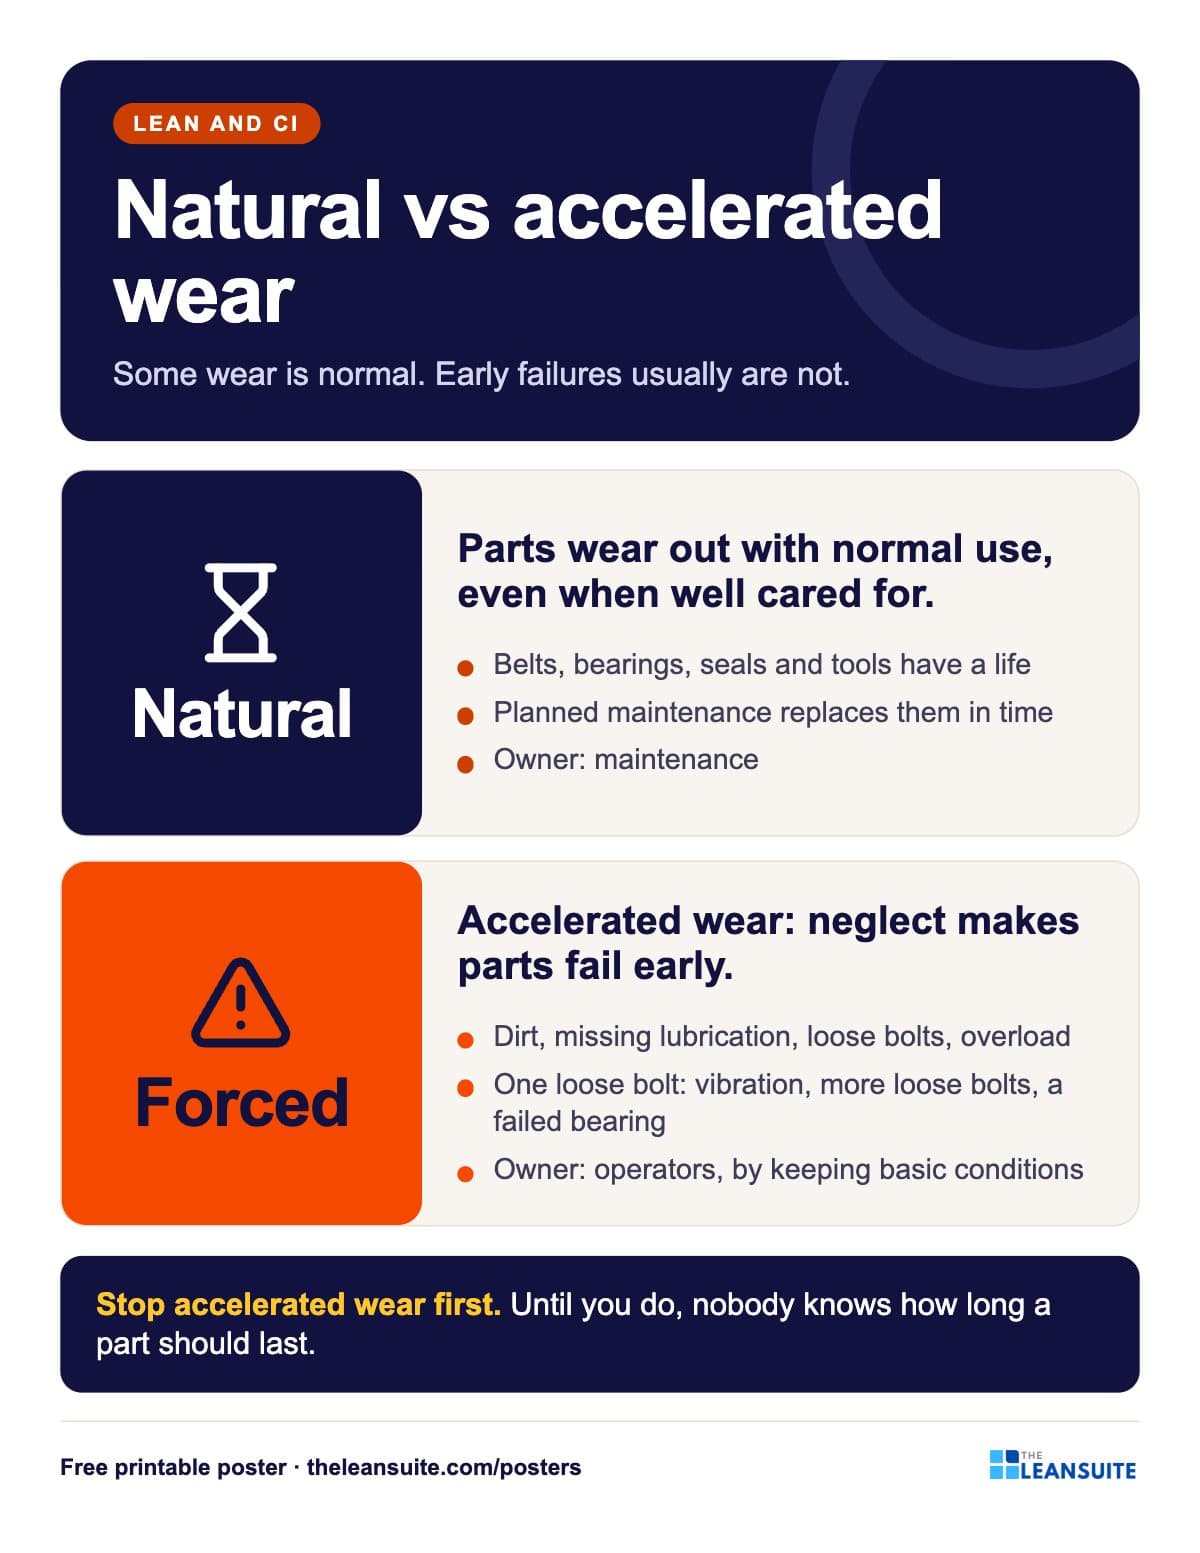 Natural vs accelerated wear poster
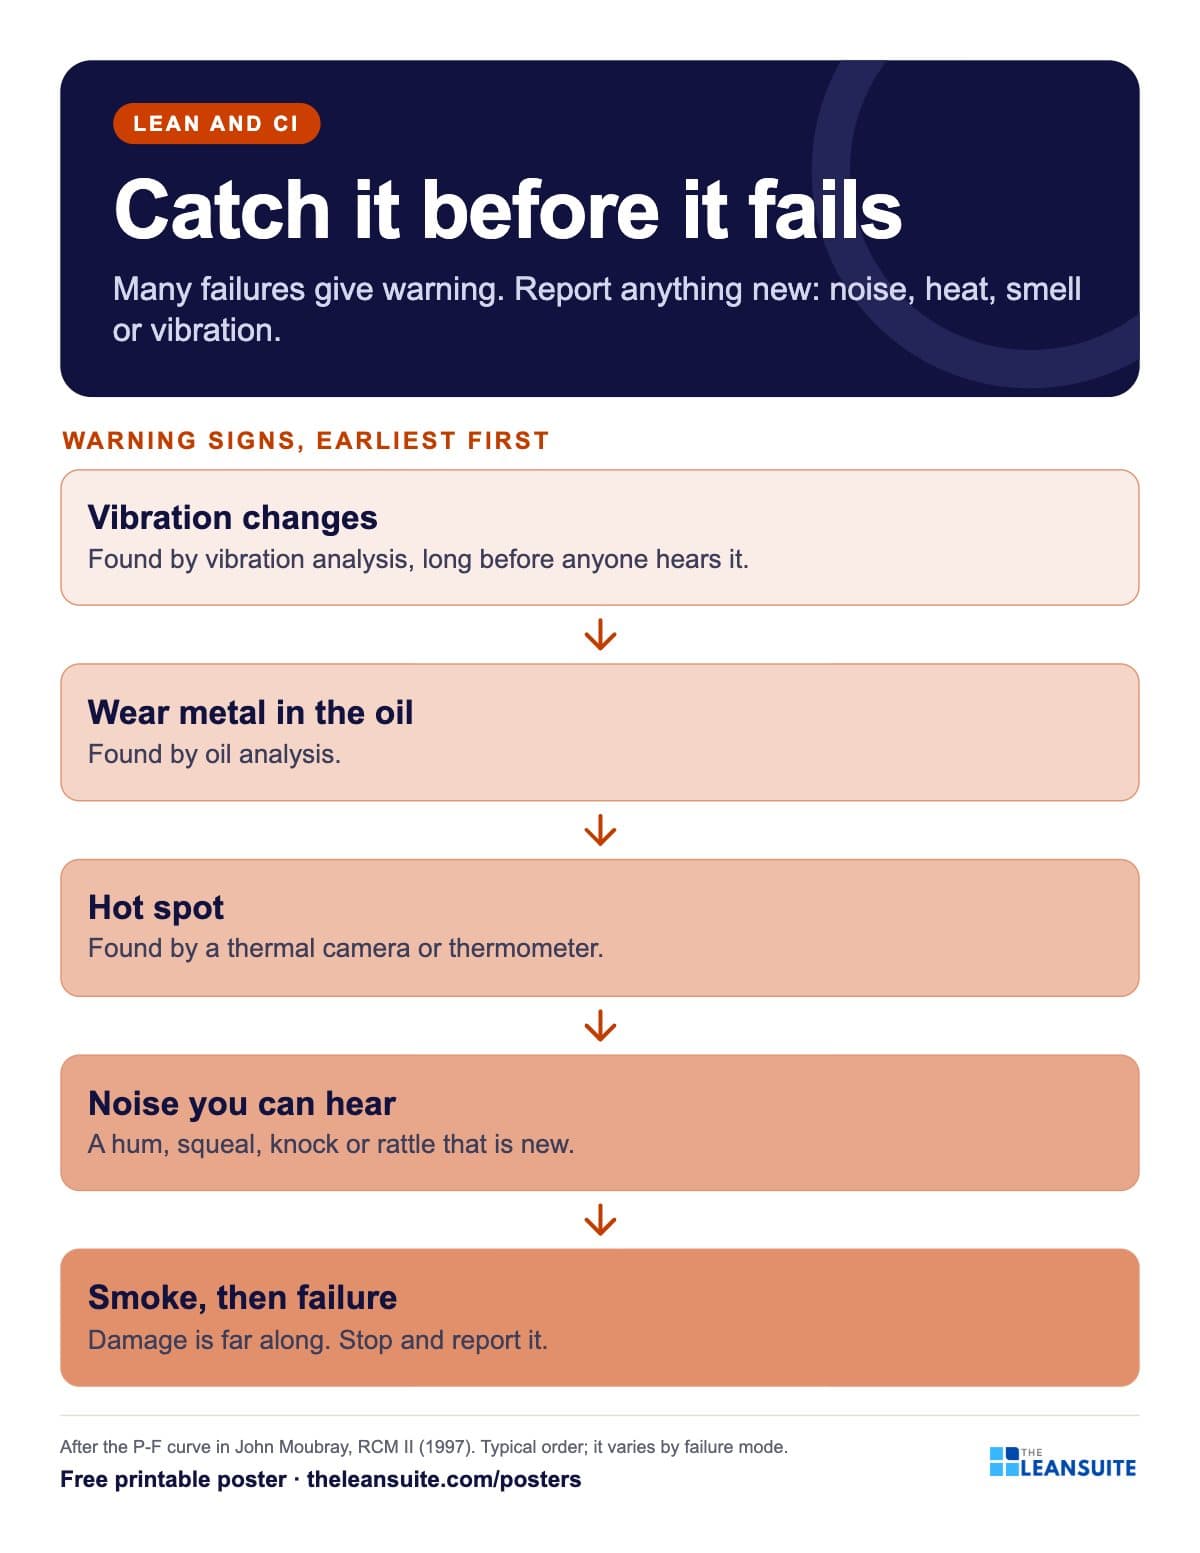 Failure warning signs poster (P-F curve)
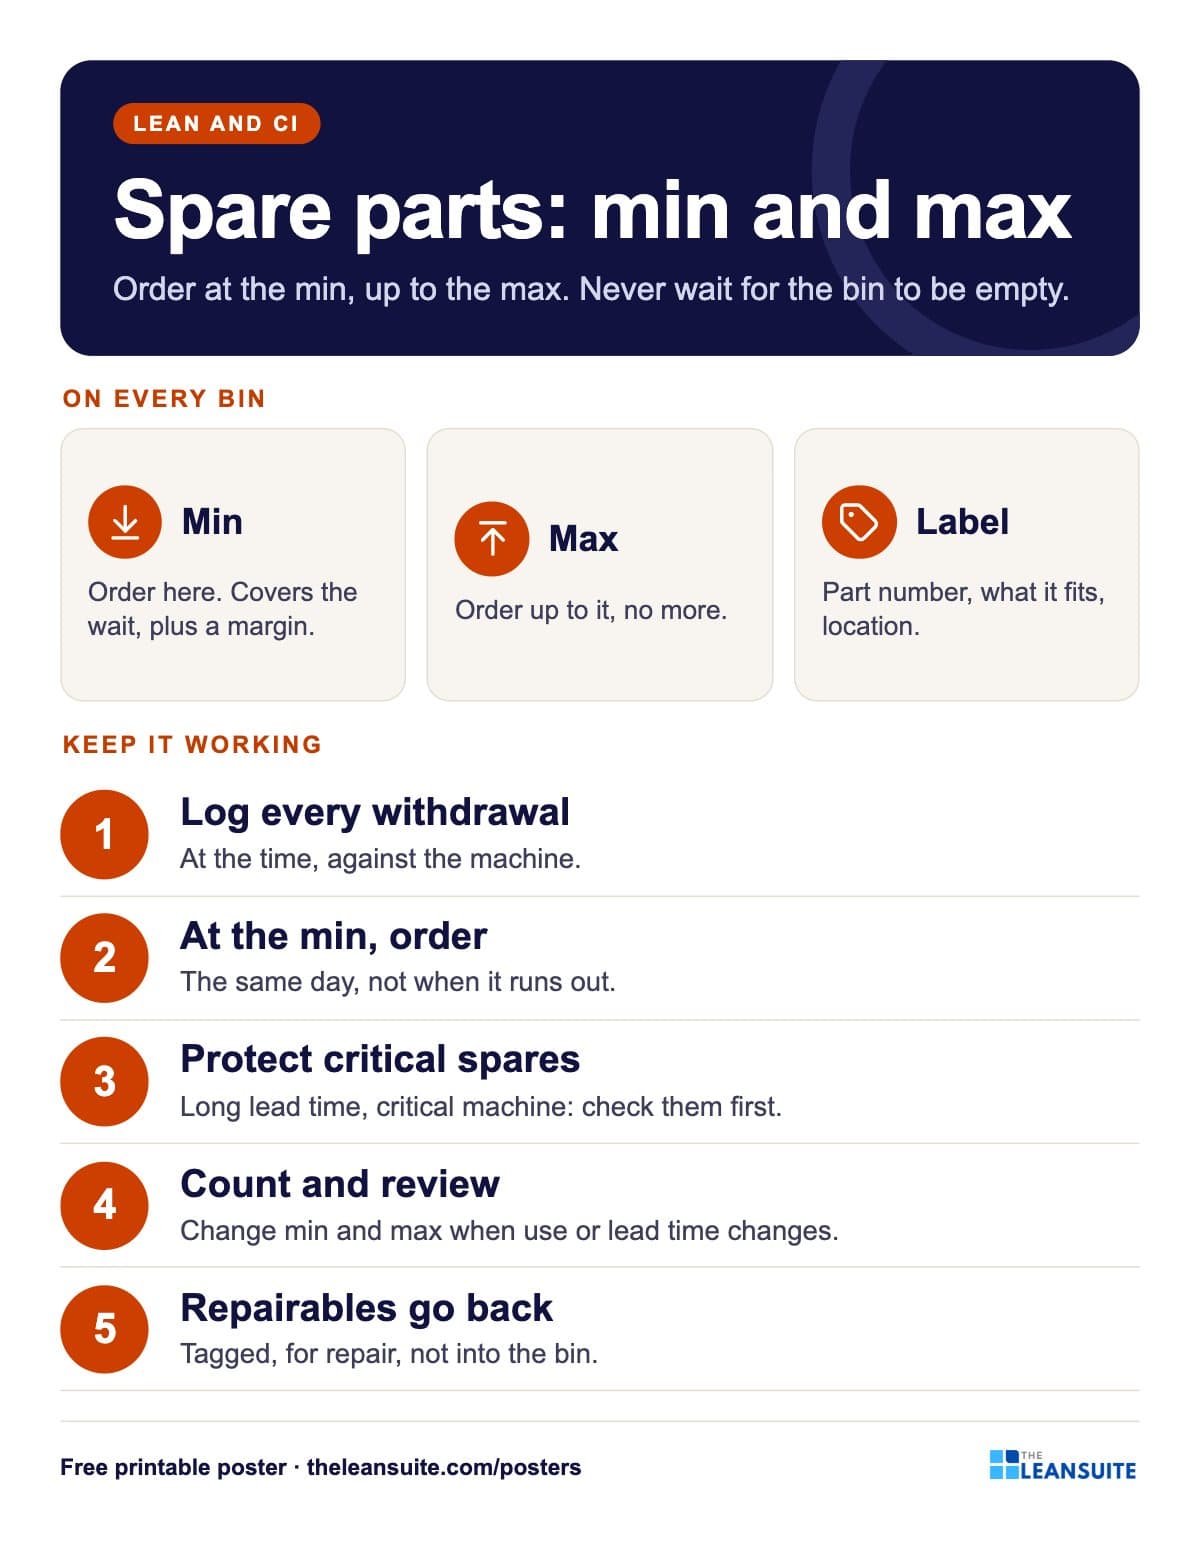 Spare parts min/max poster
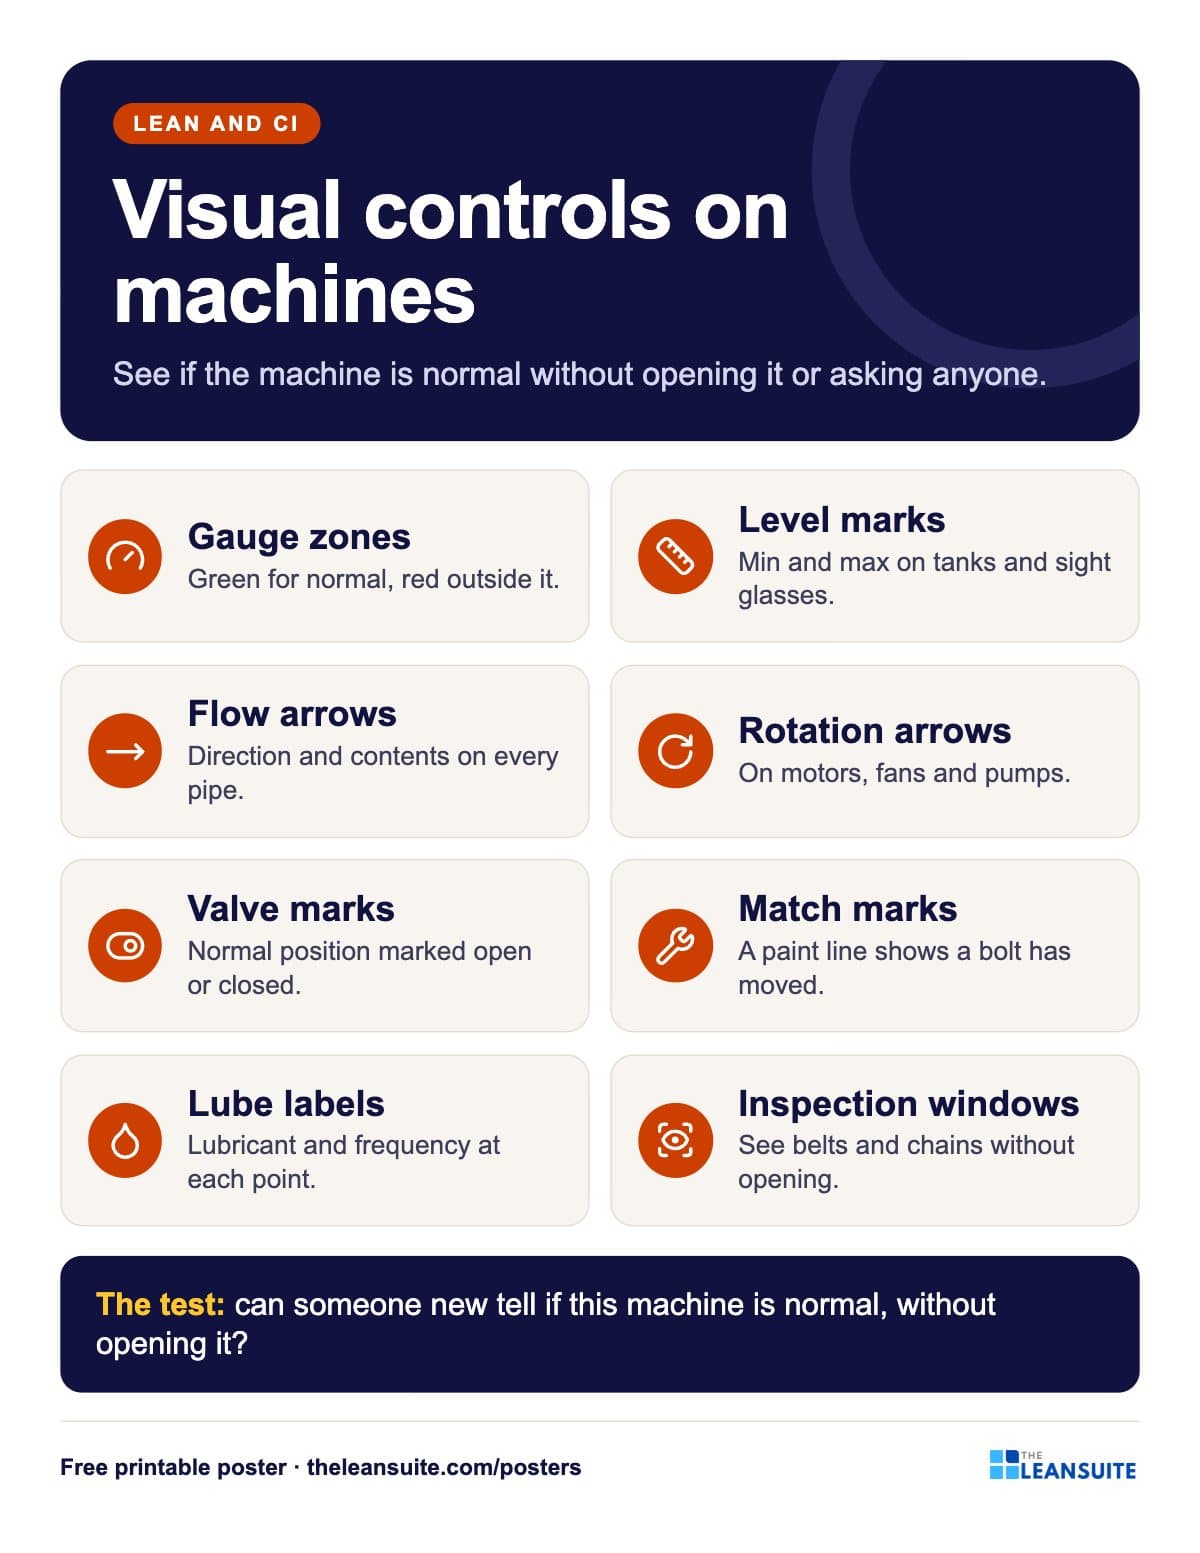 Machine visual controls poster
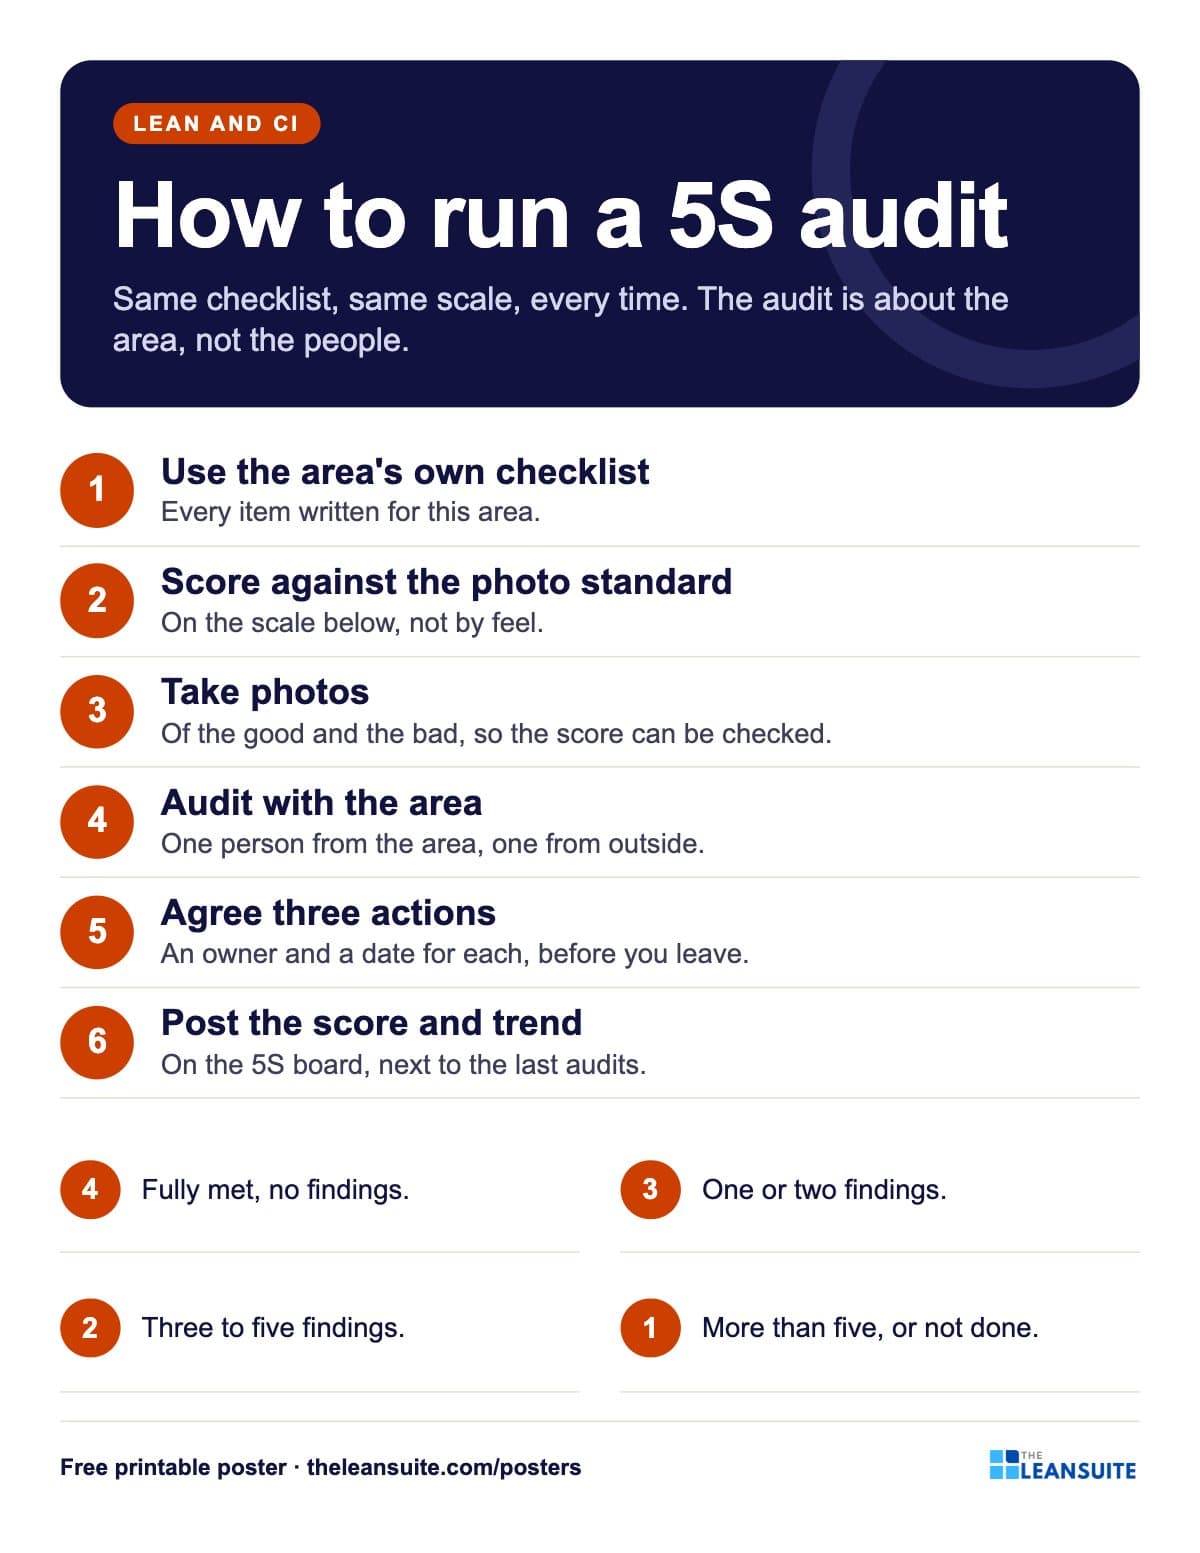 How to run a 5S audit poster
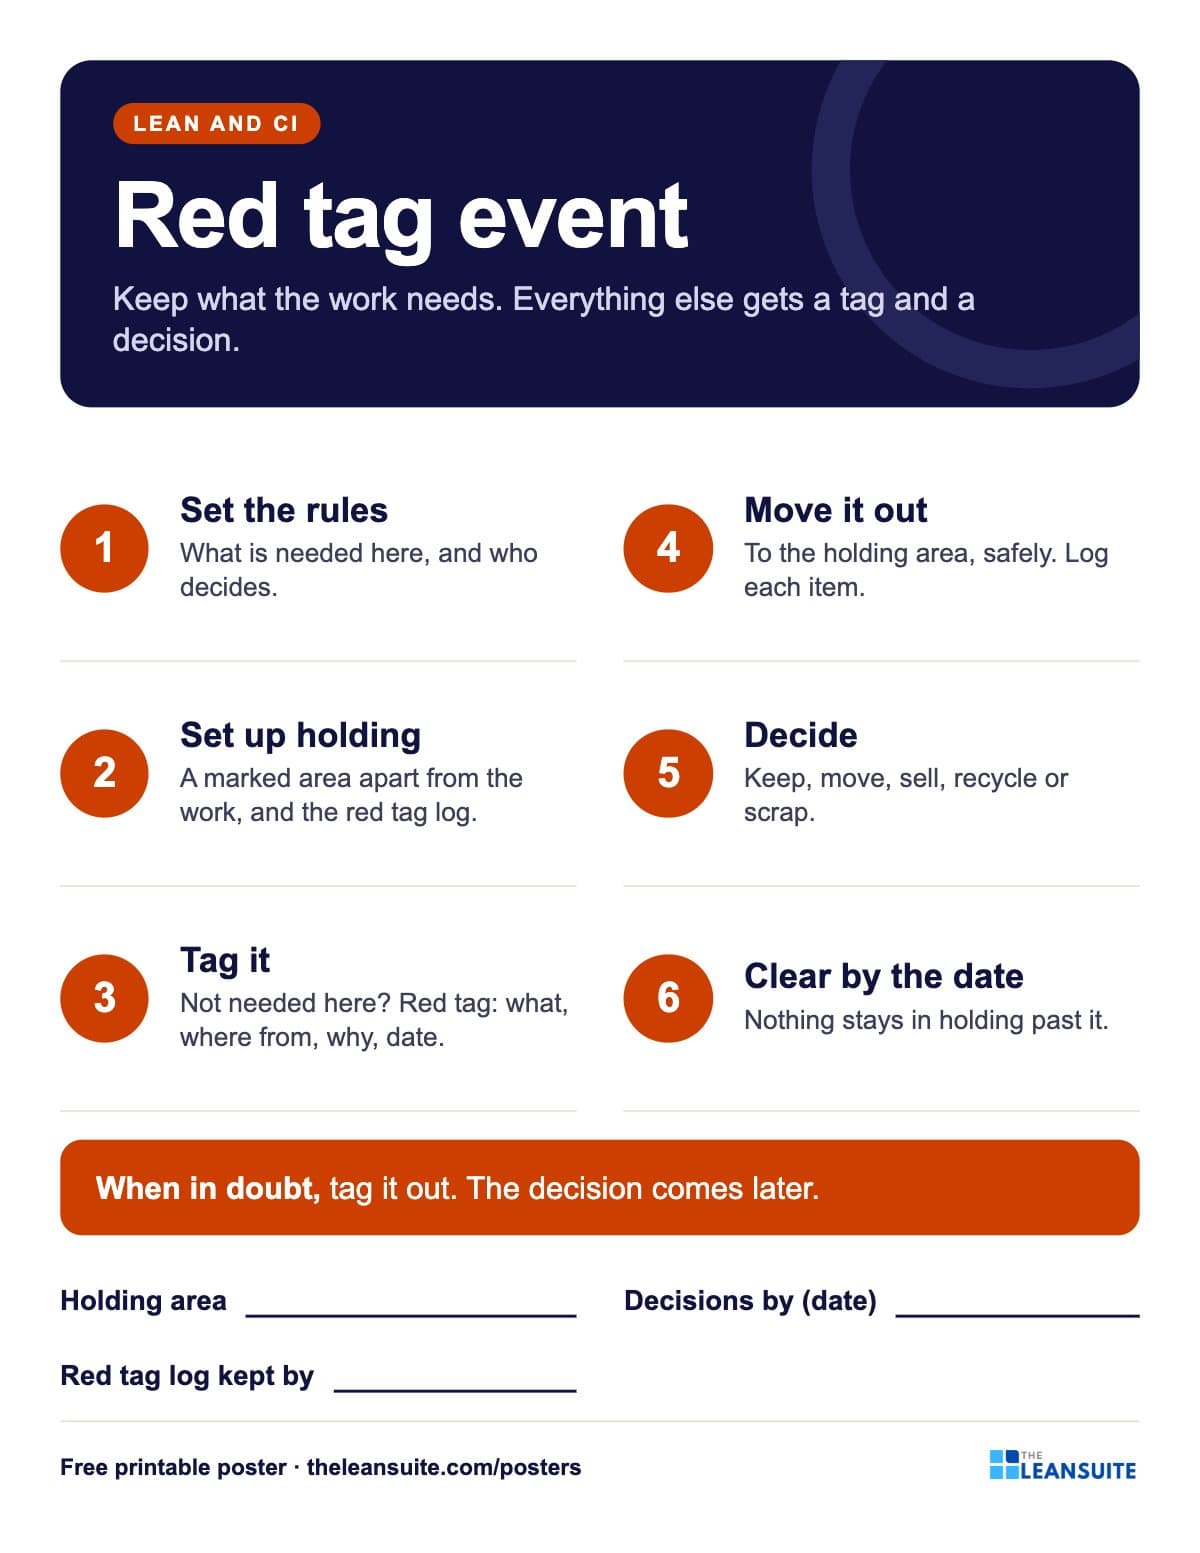 Red tag event poster
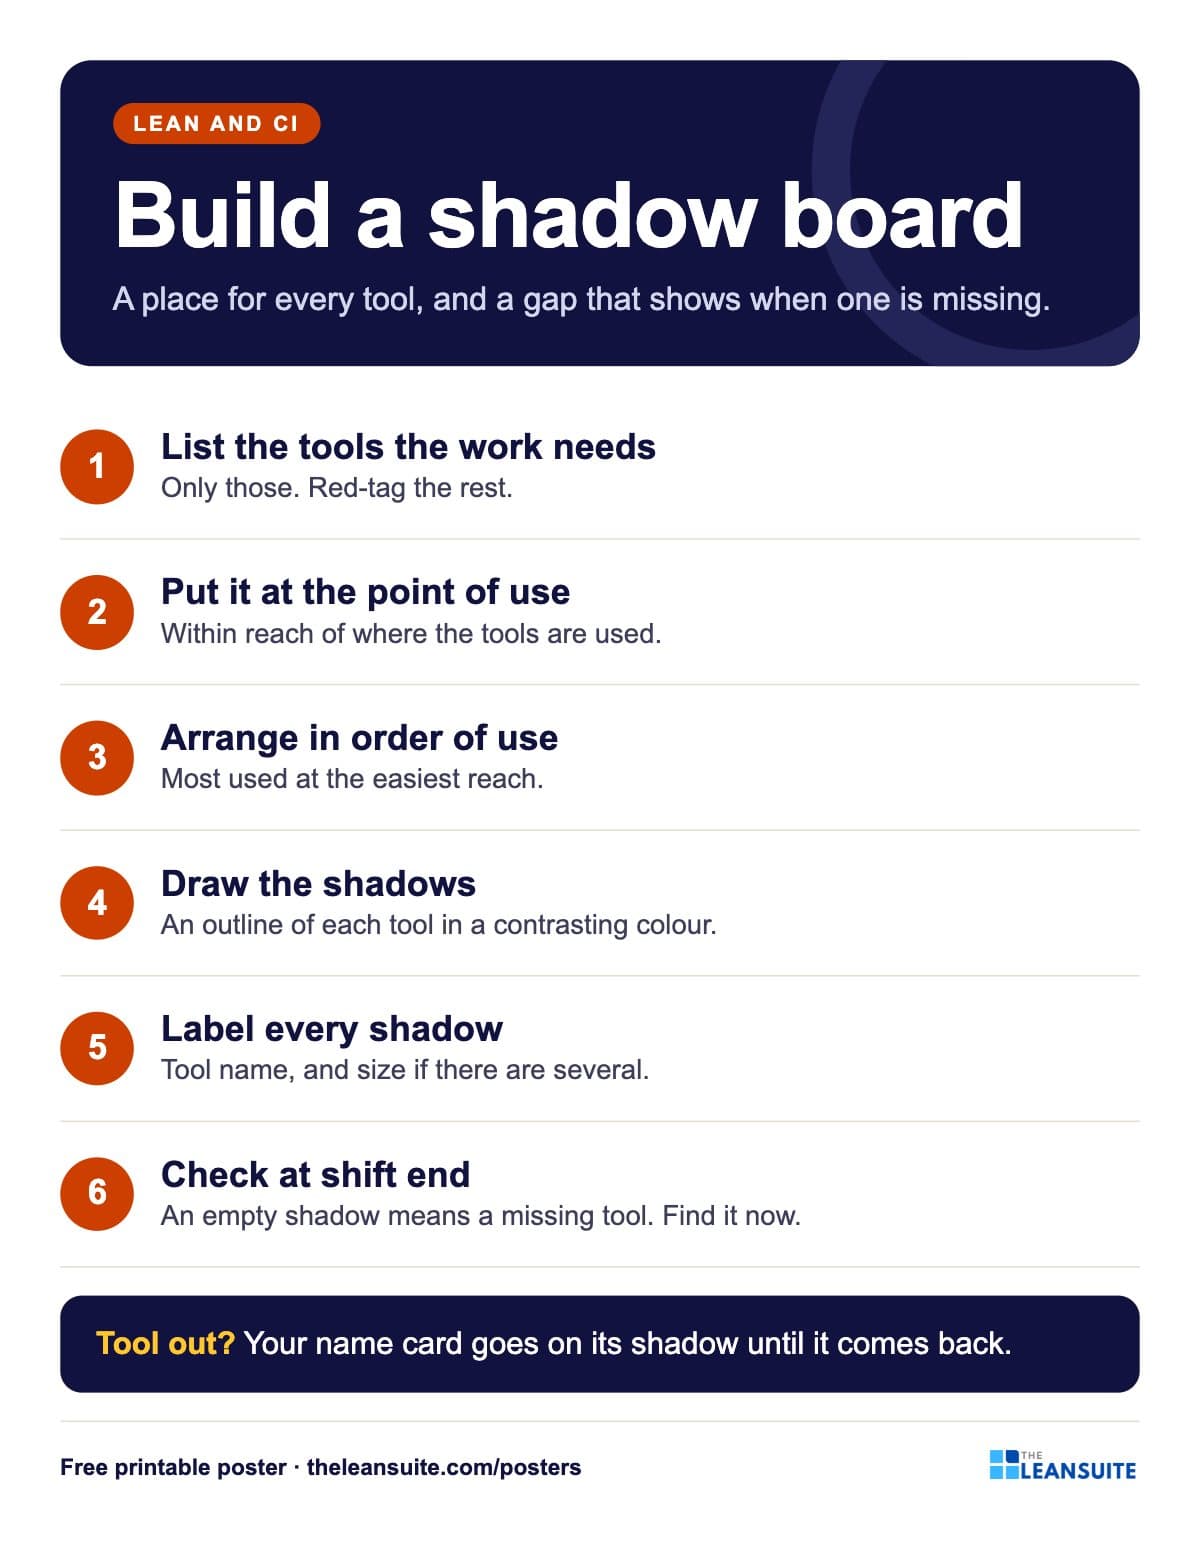 Shadow board poster
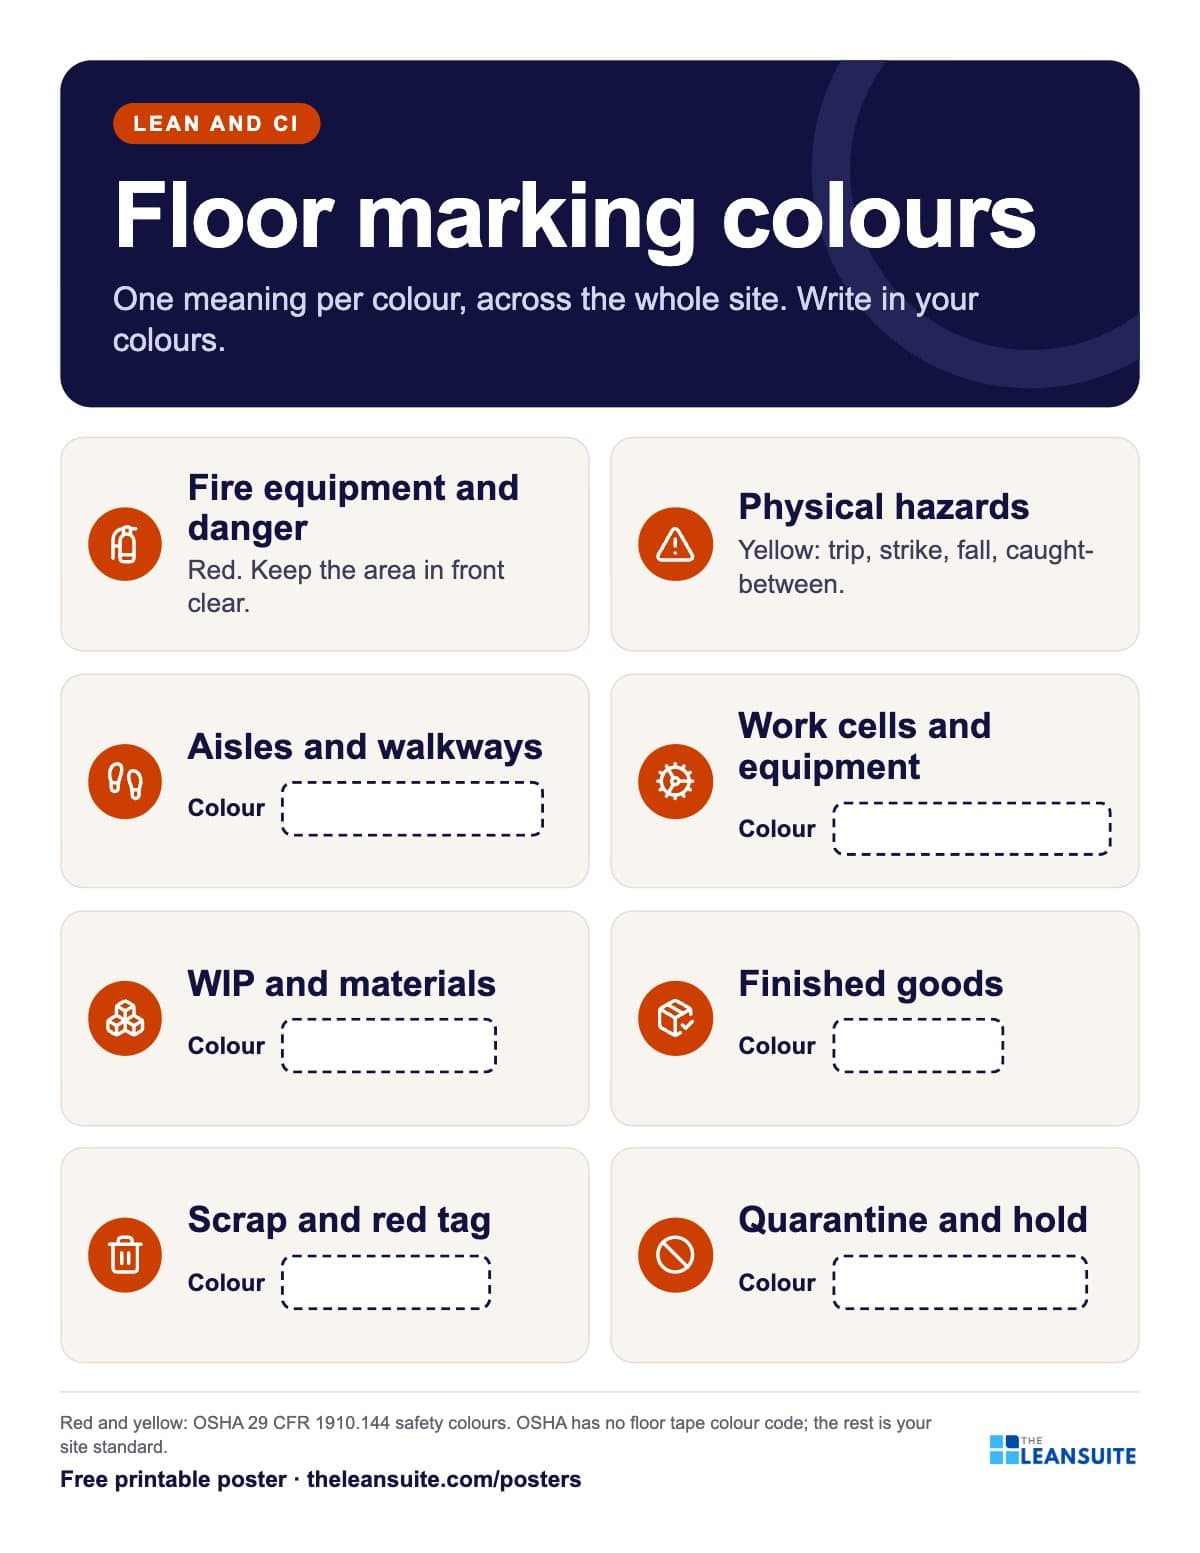 Floor marking colours poster
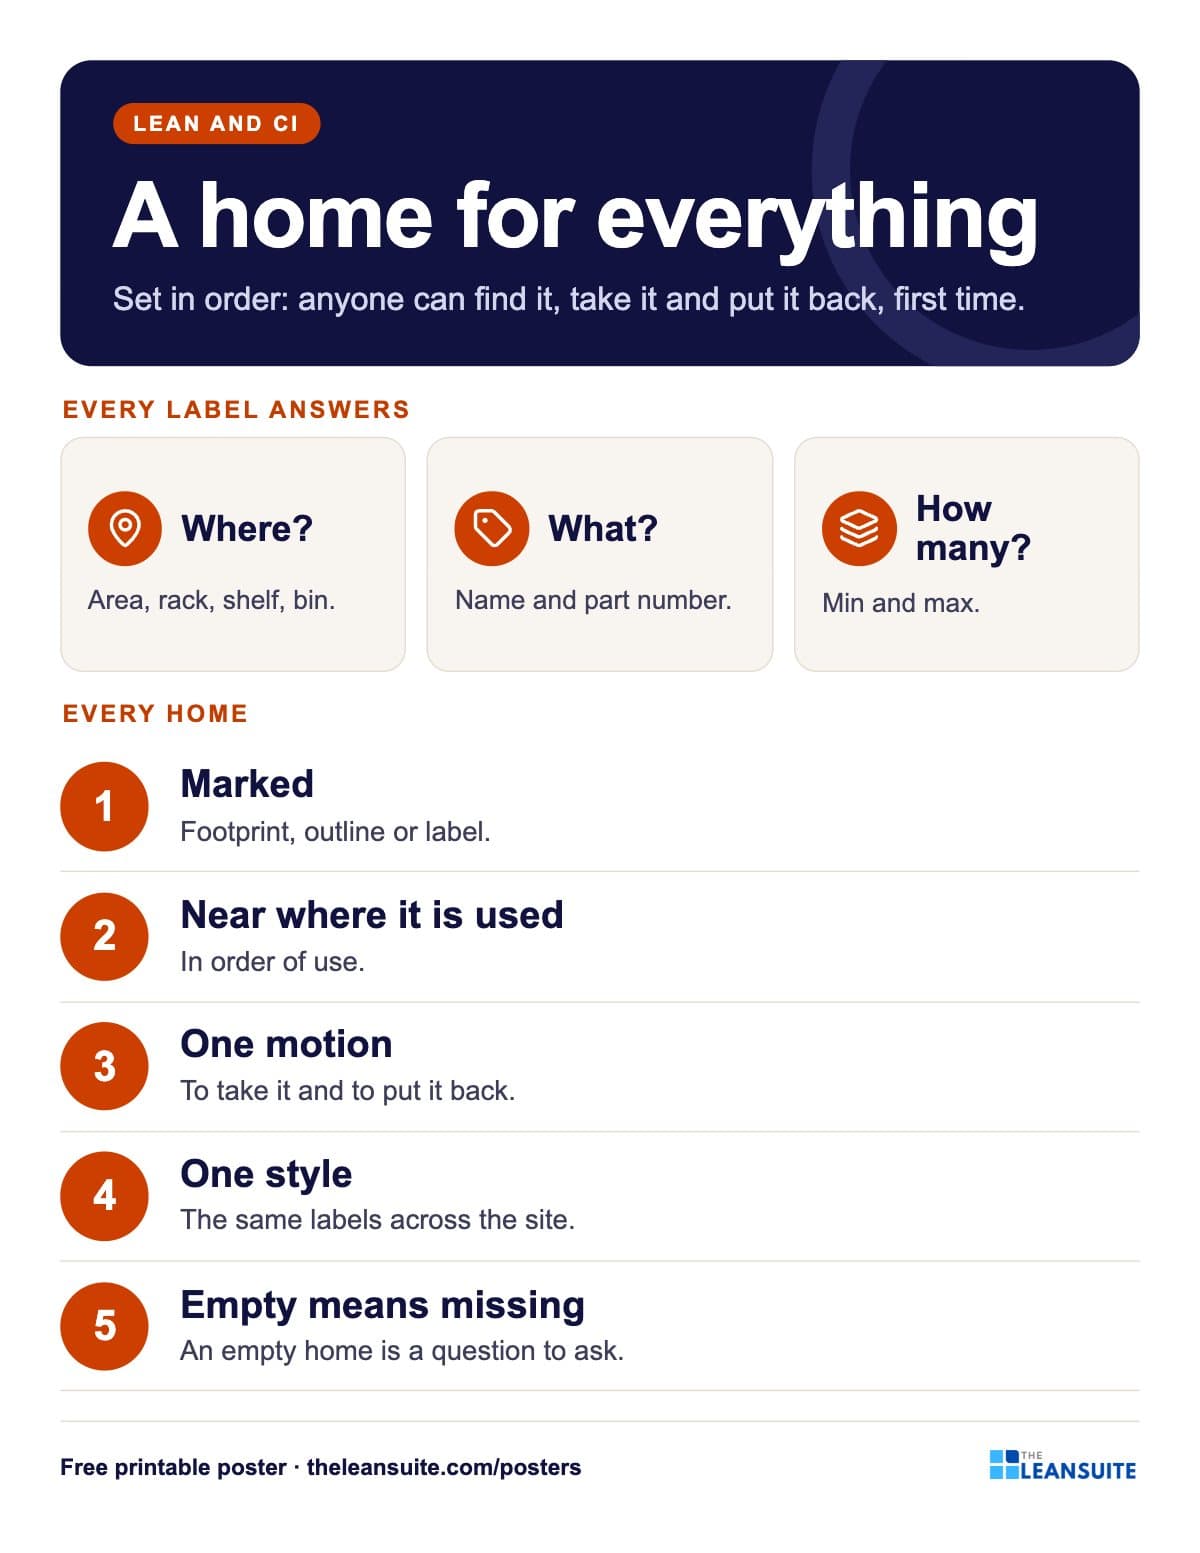 Set in order poster: where, what, how many
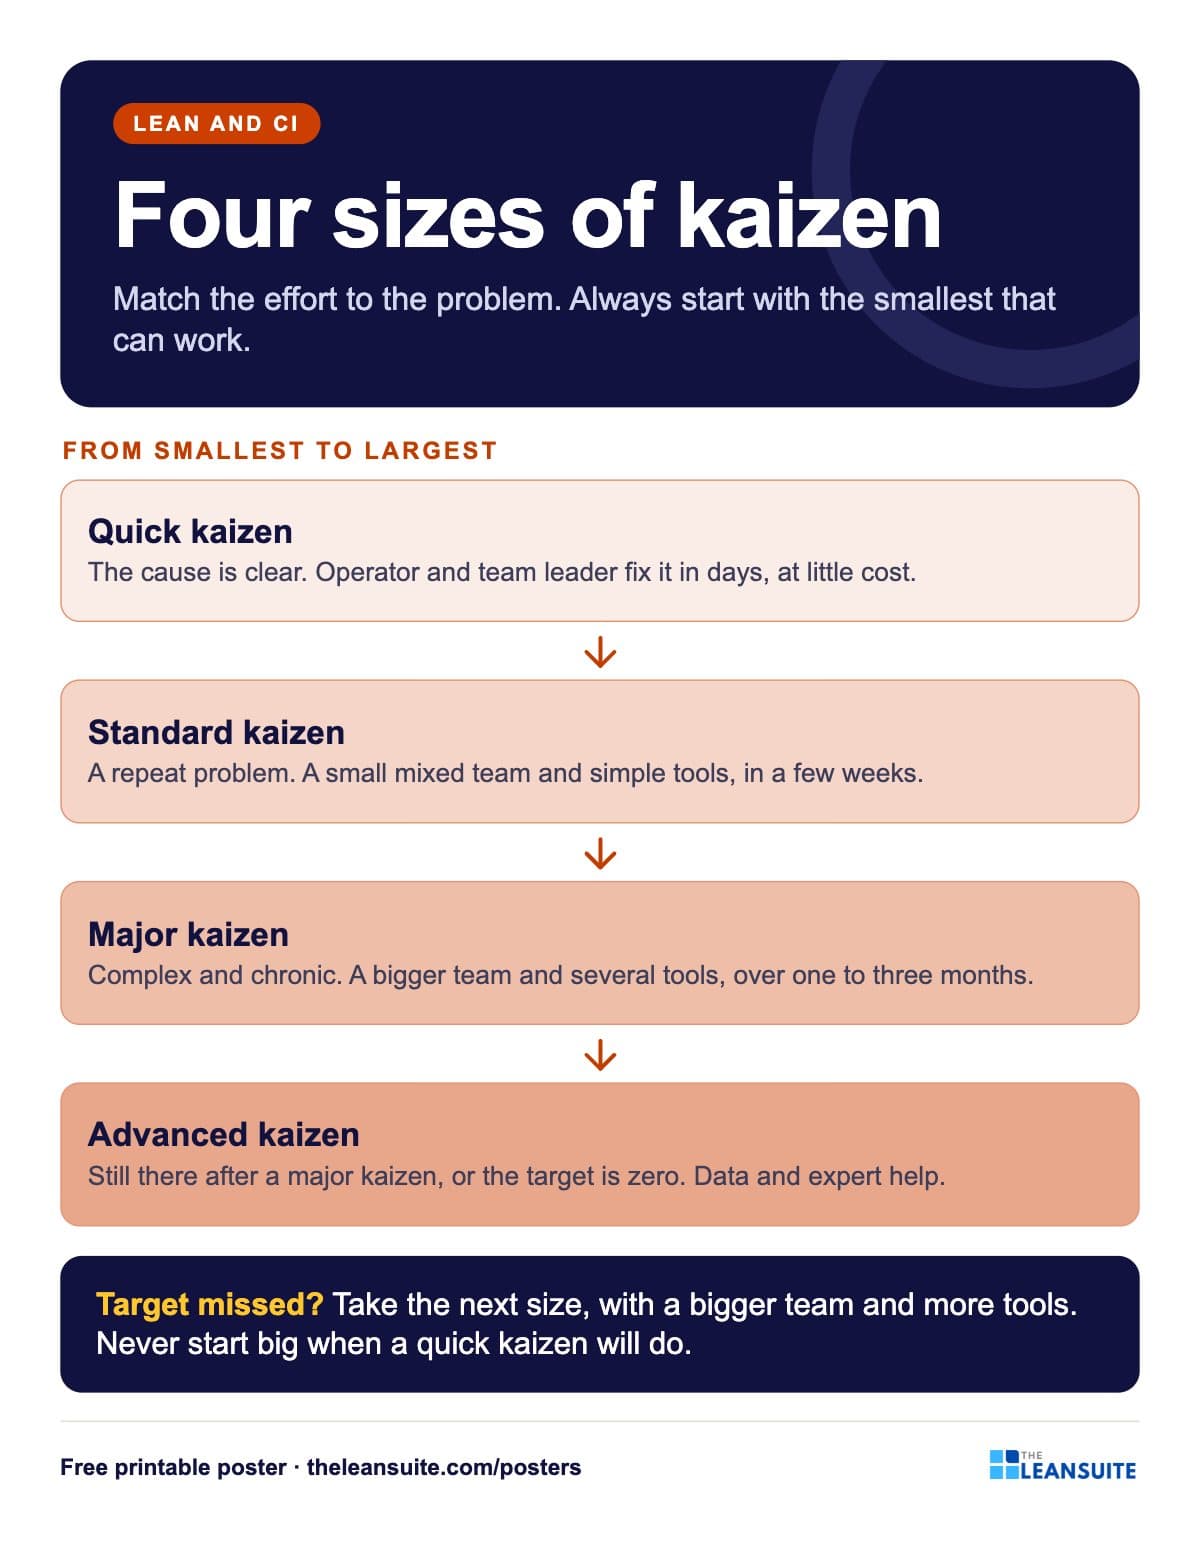 Kaizen sizes poster
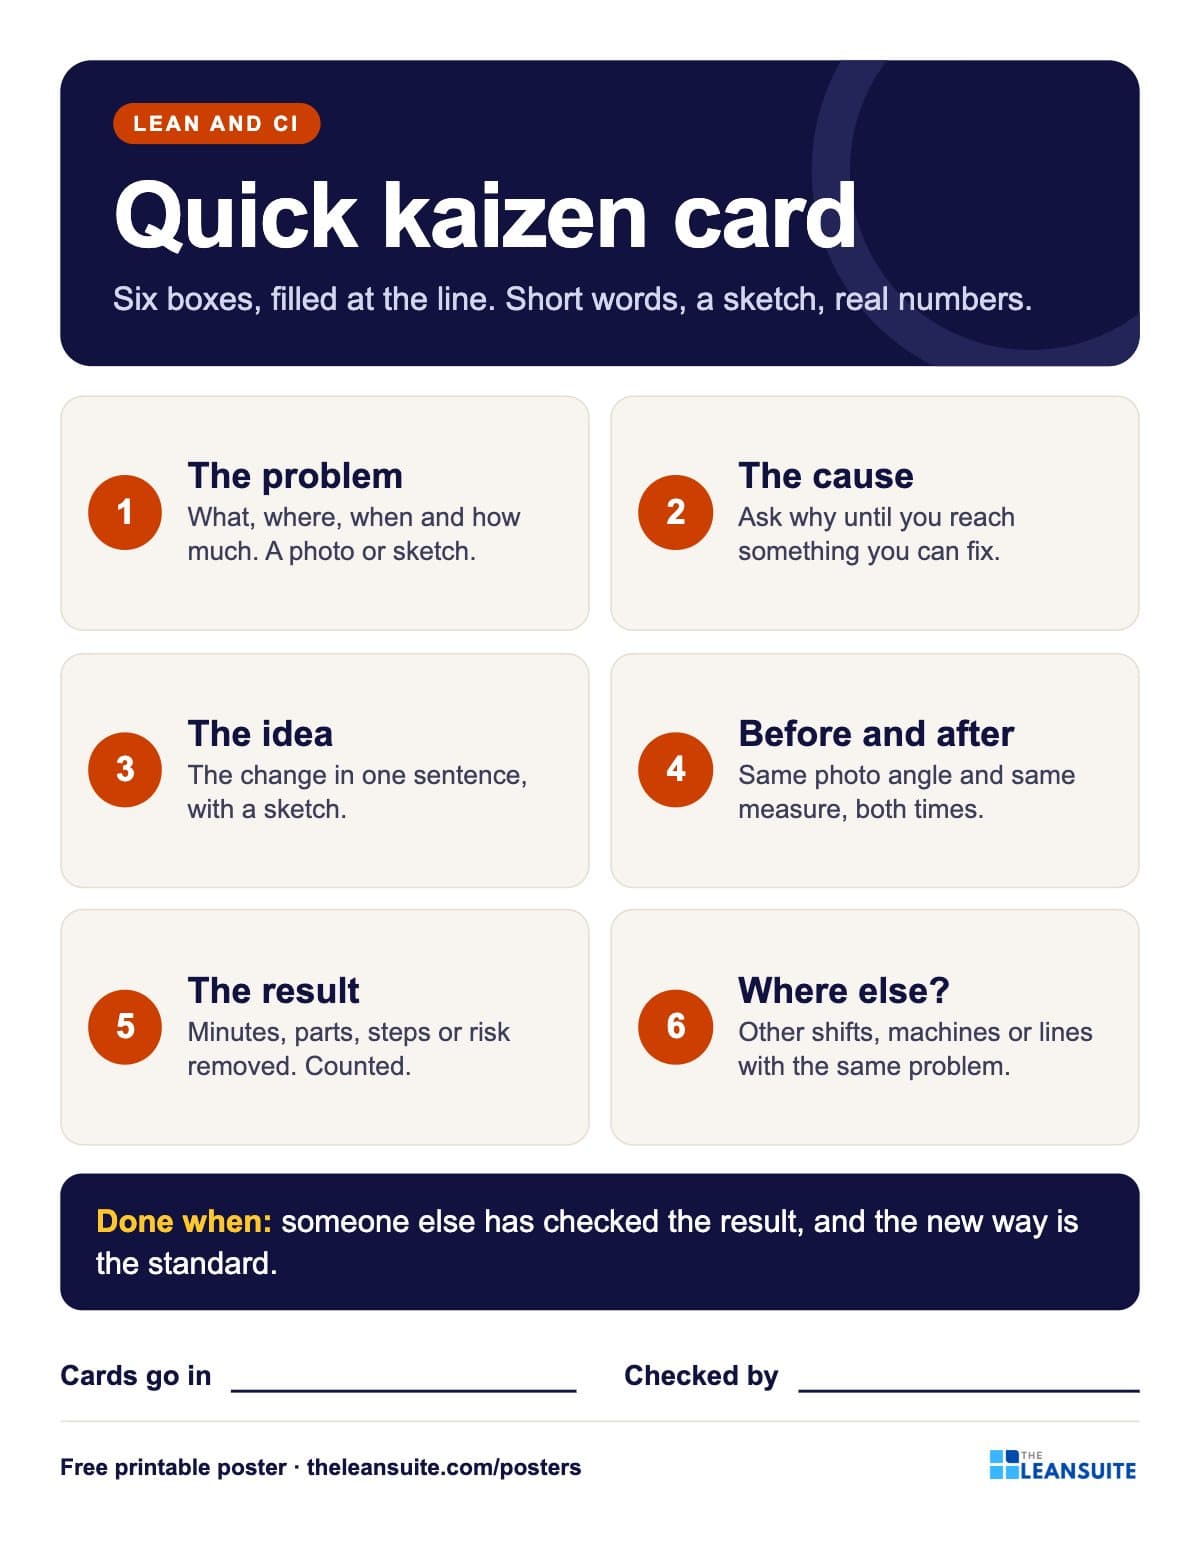 Quick kaizen card poster
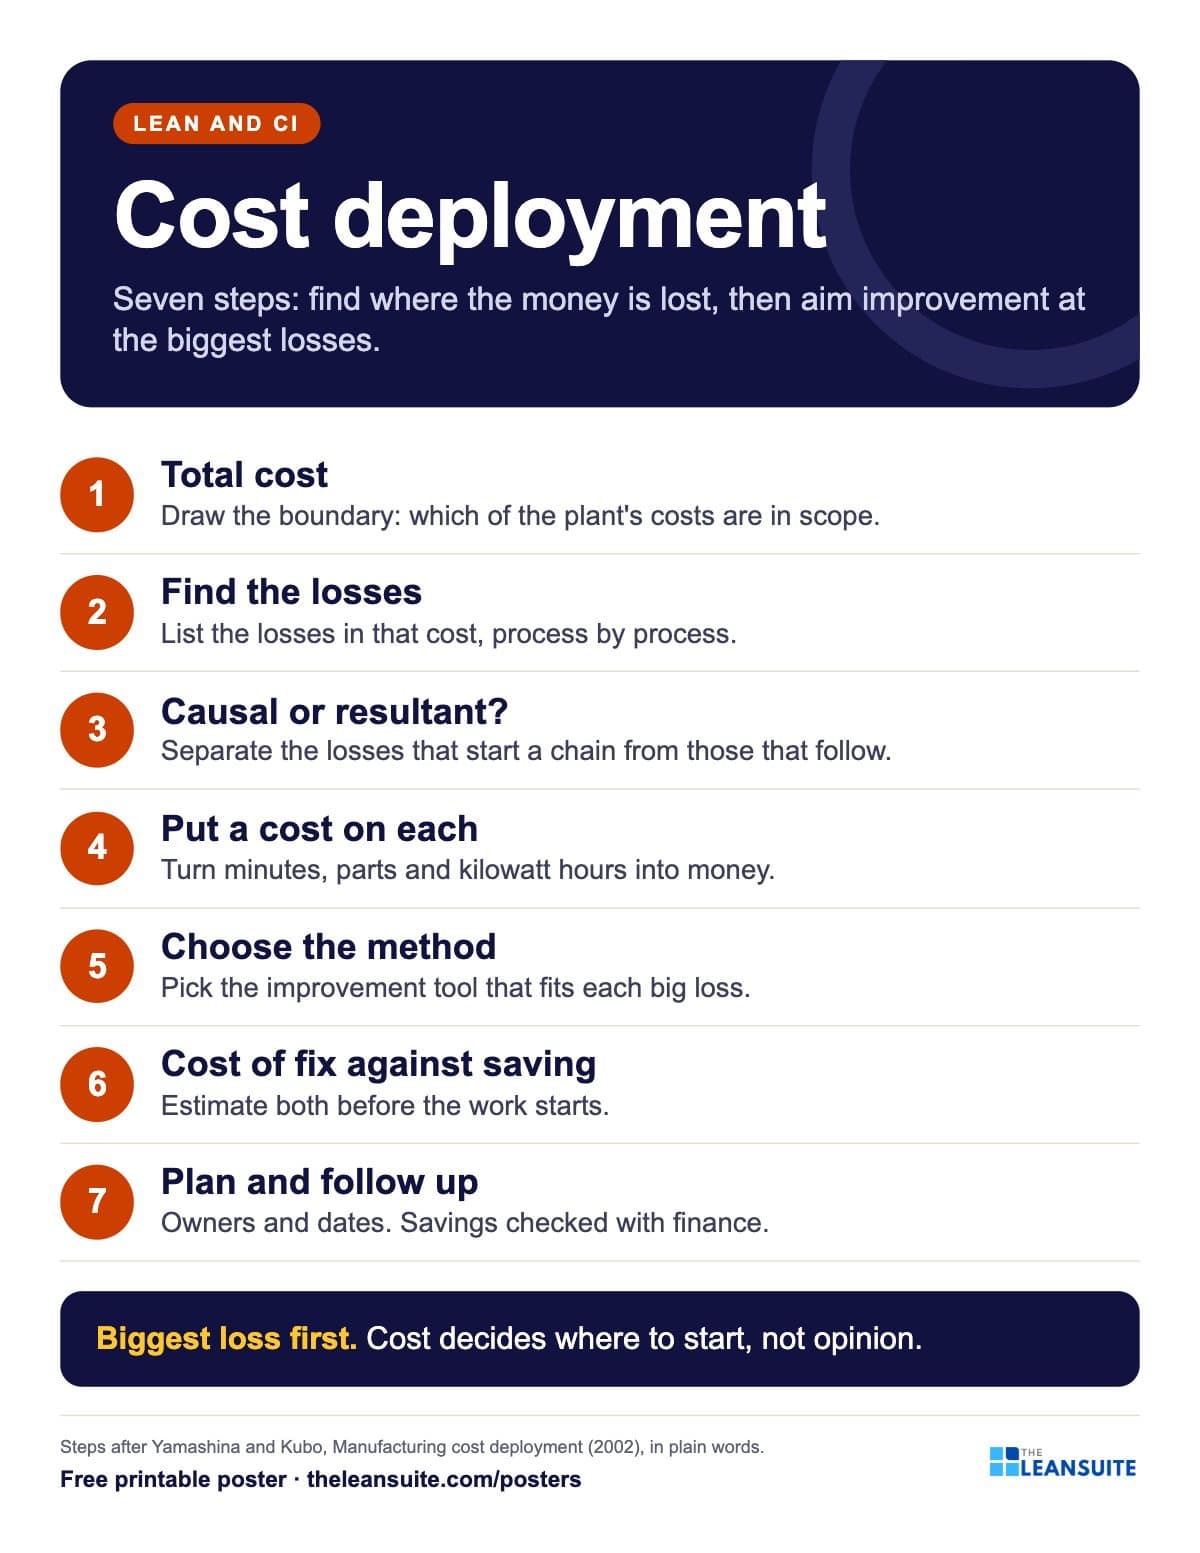 Cost deployment 7 steps poster
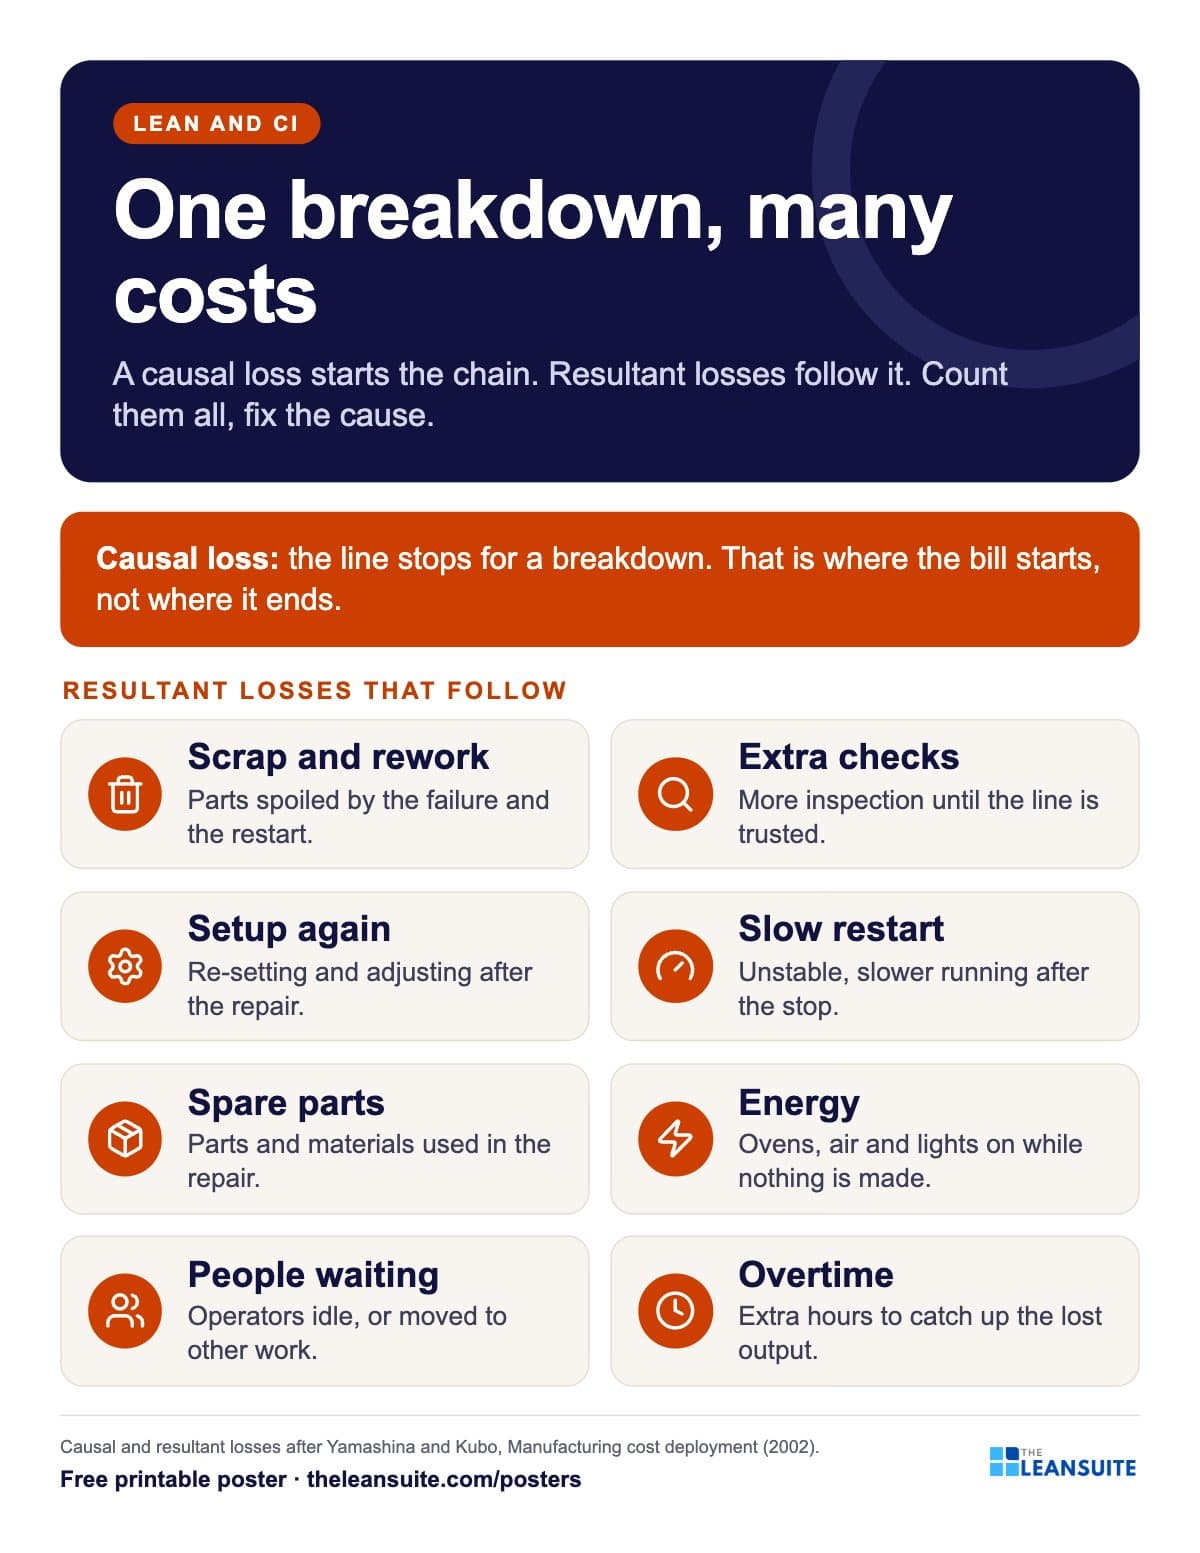 Causal and resultant losses poster
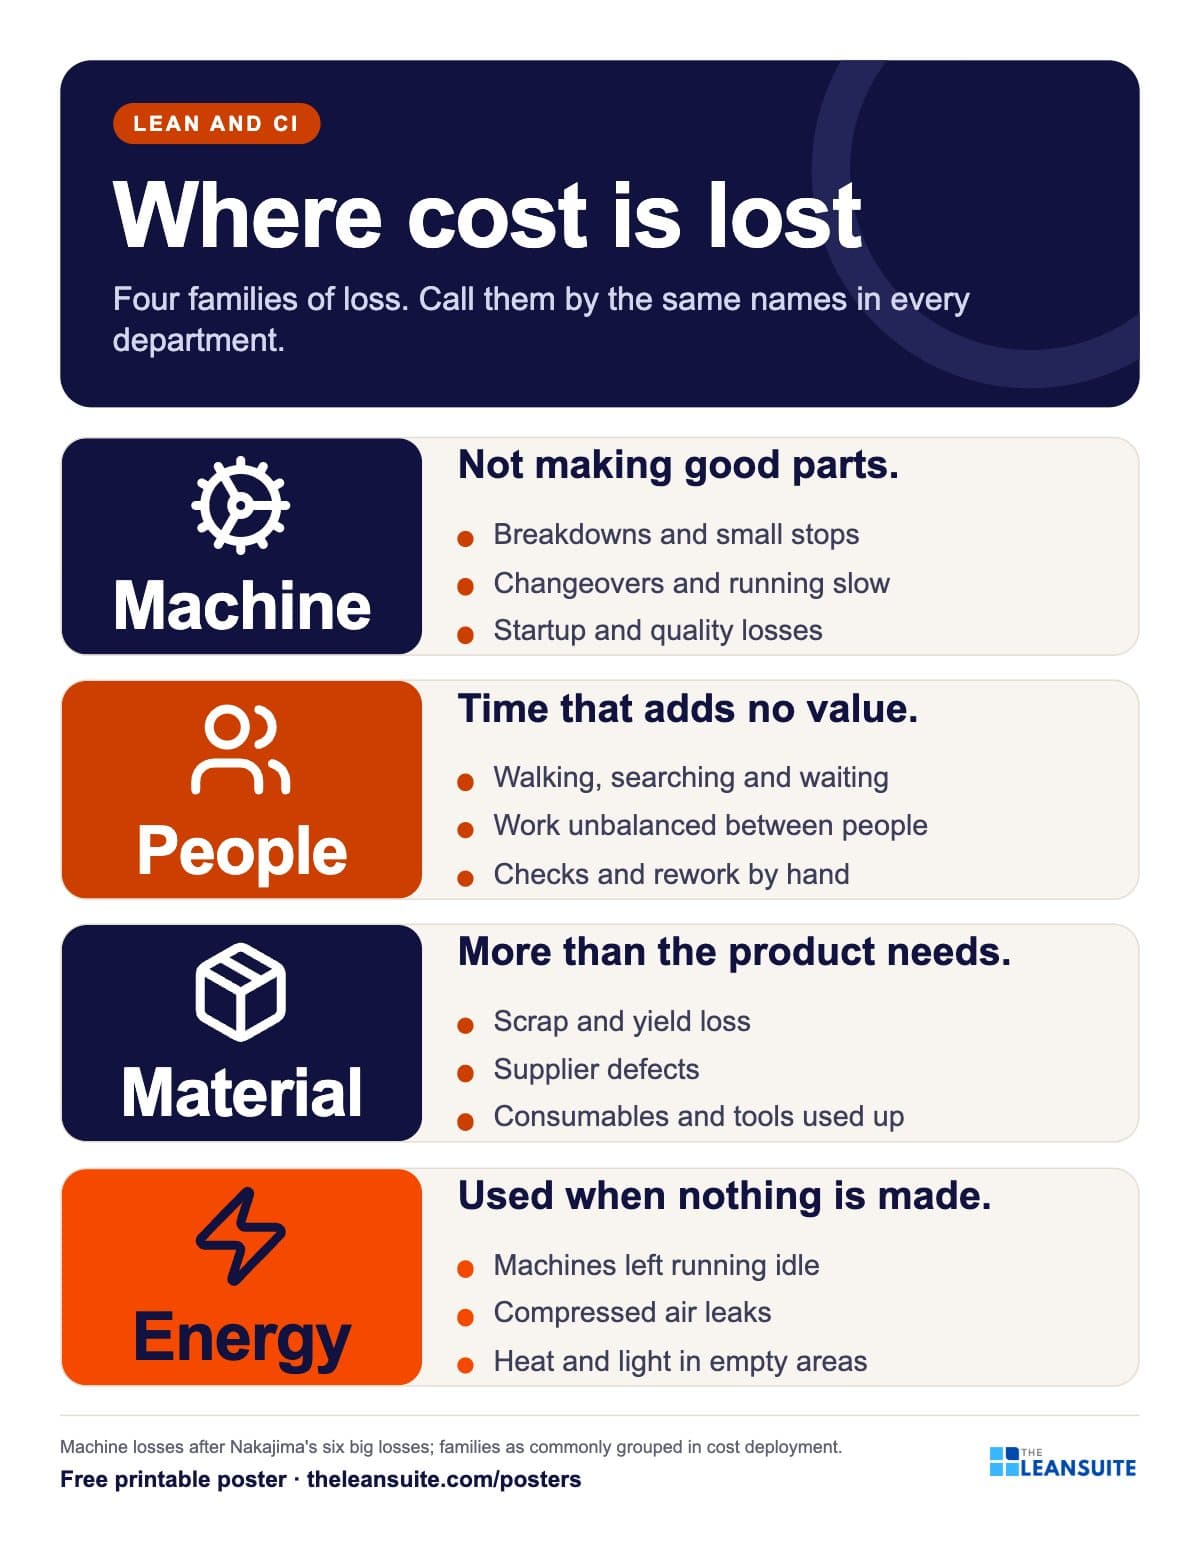 Four loss families poster
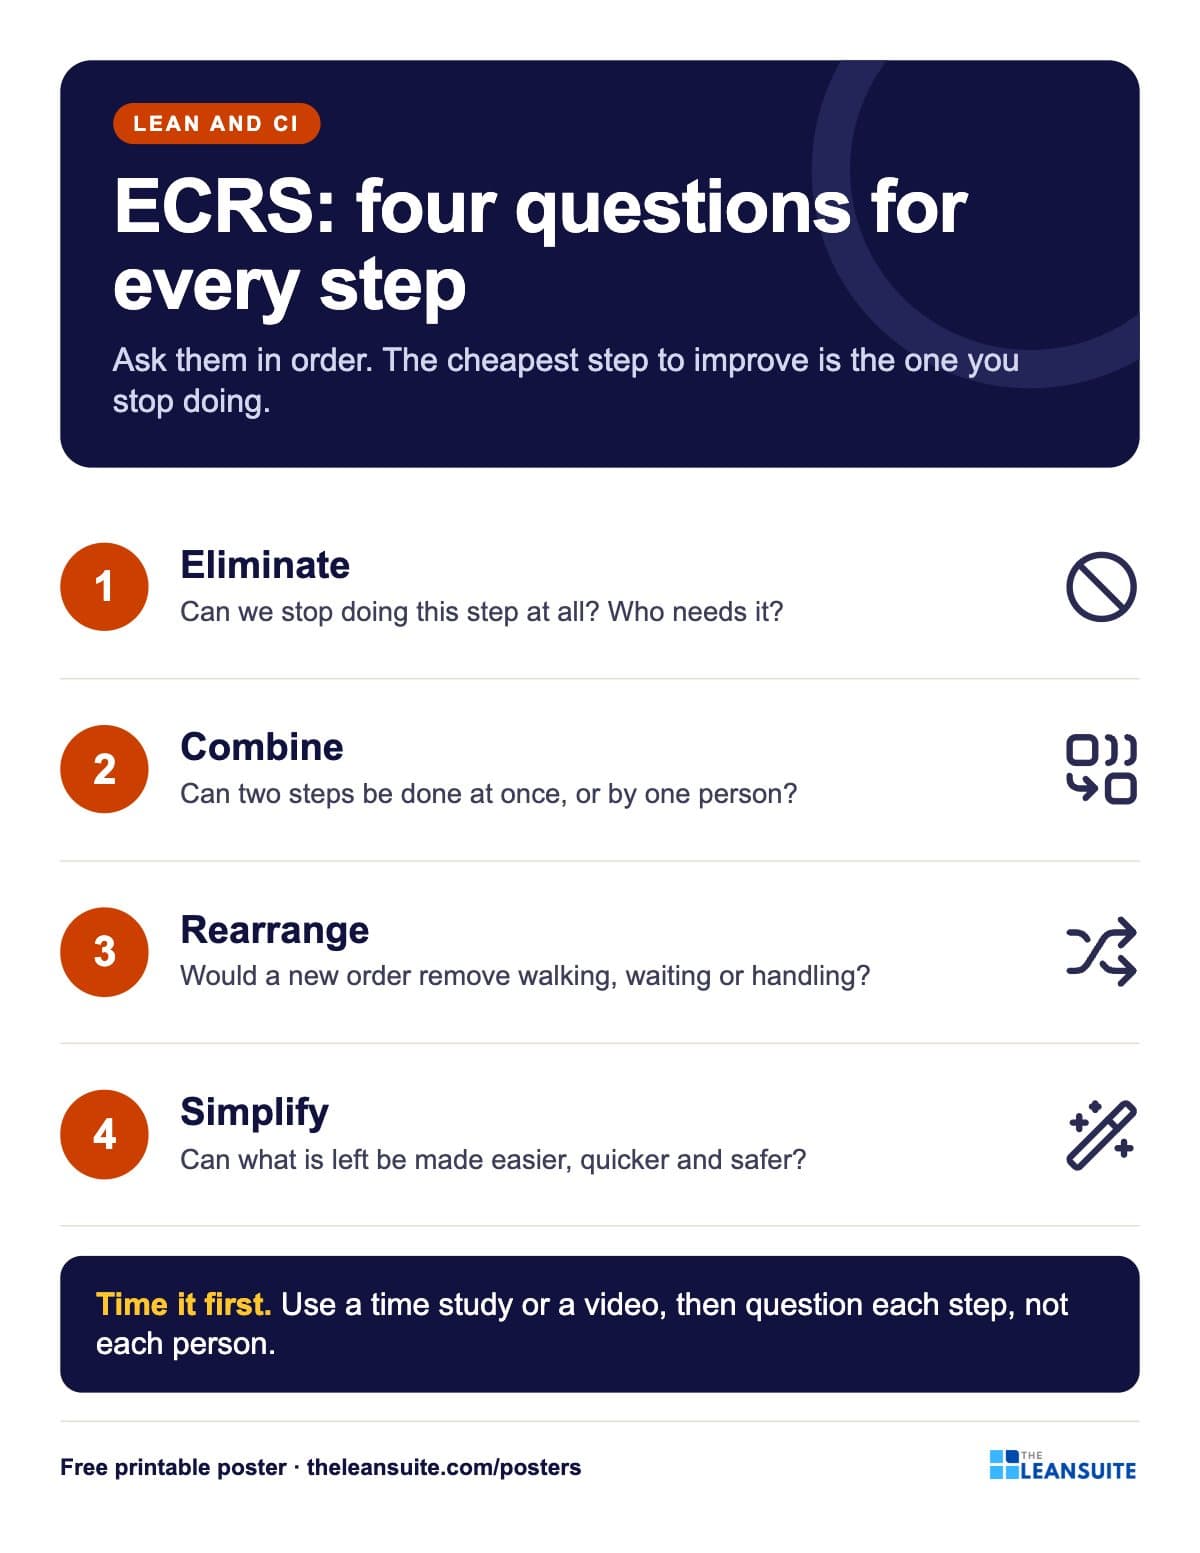 ECRS poster
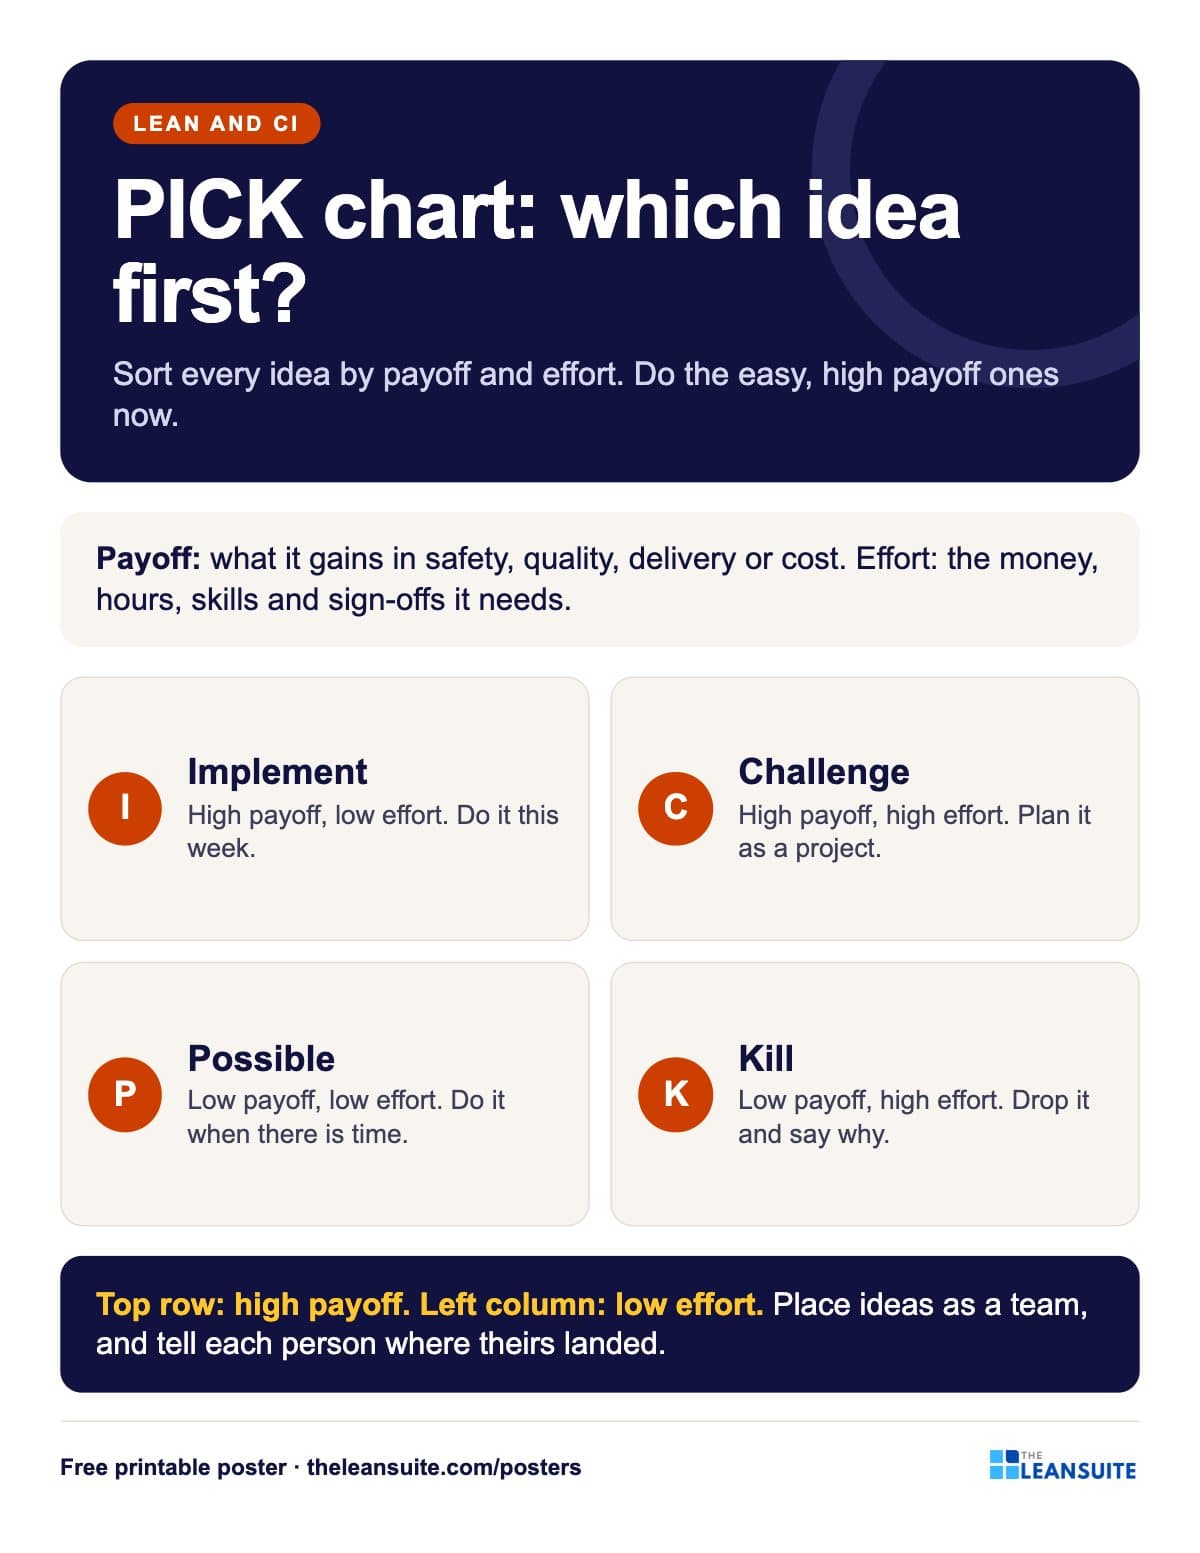 PICK chart poster
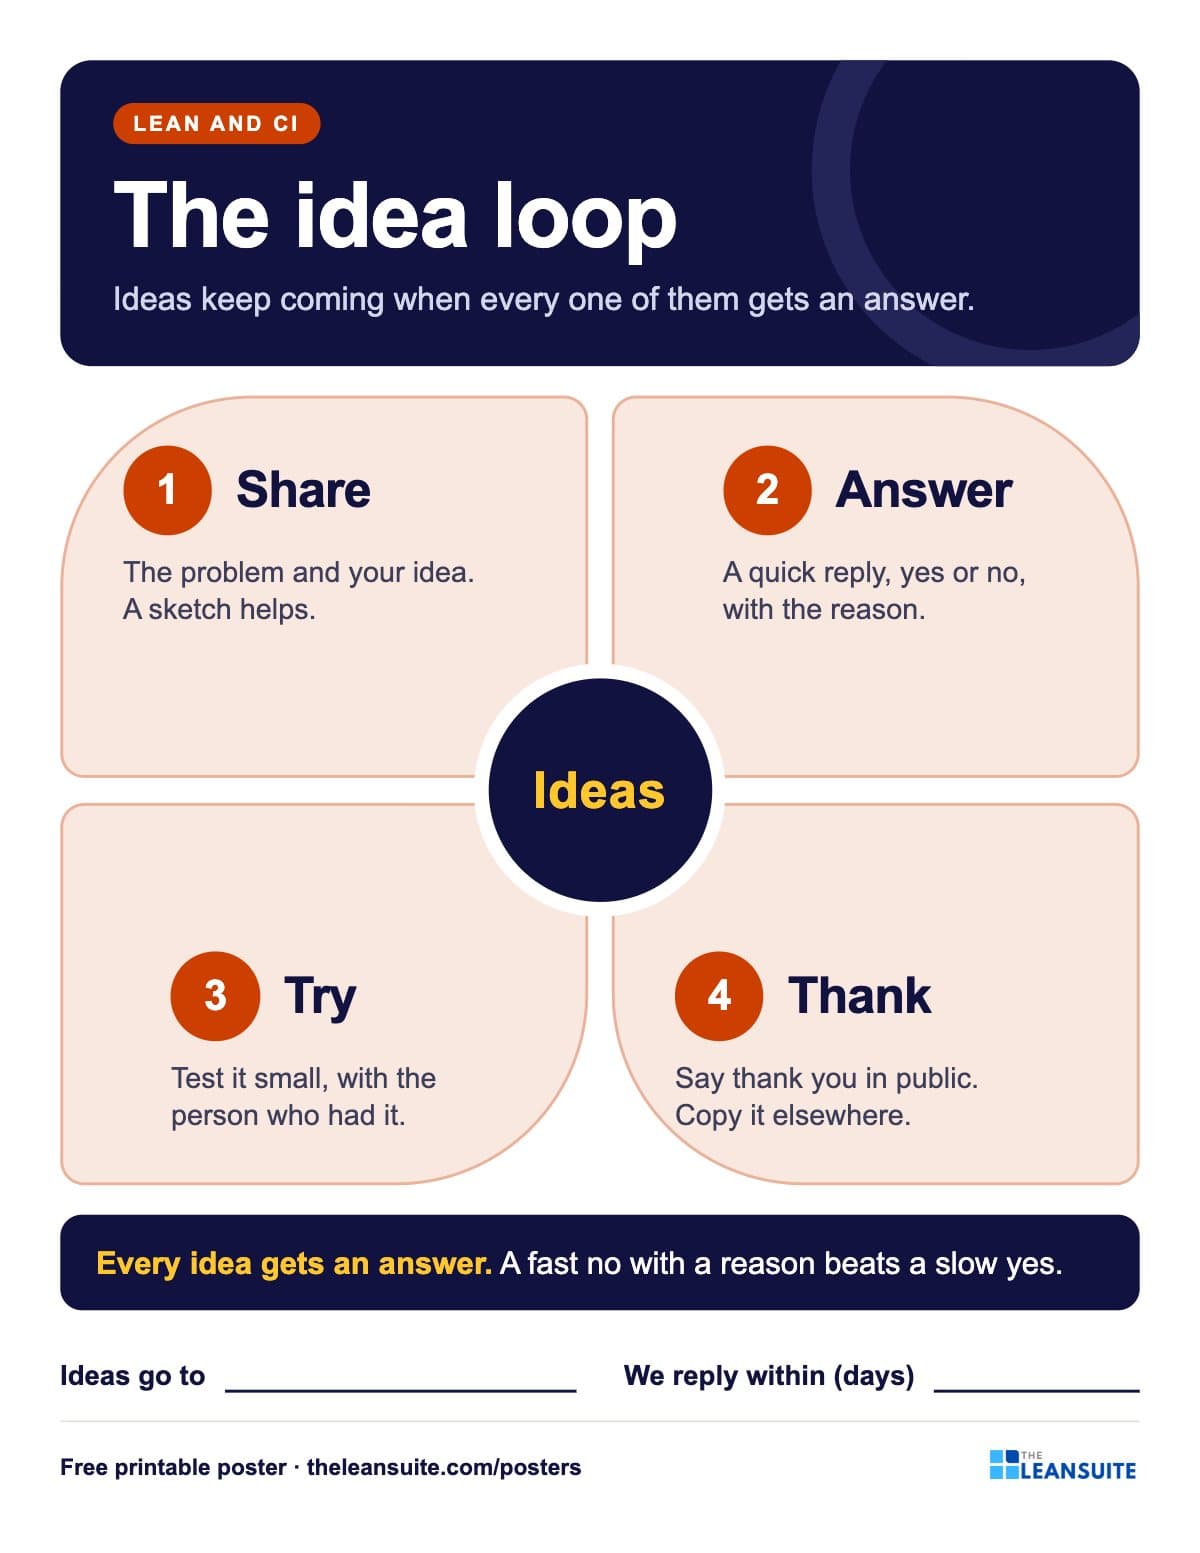 Suggestion system poster
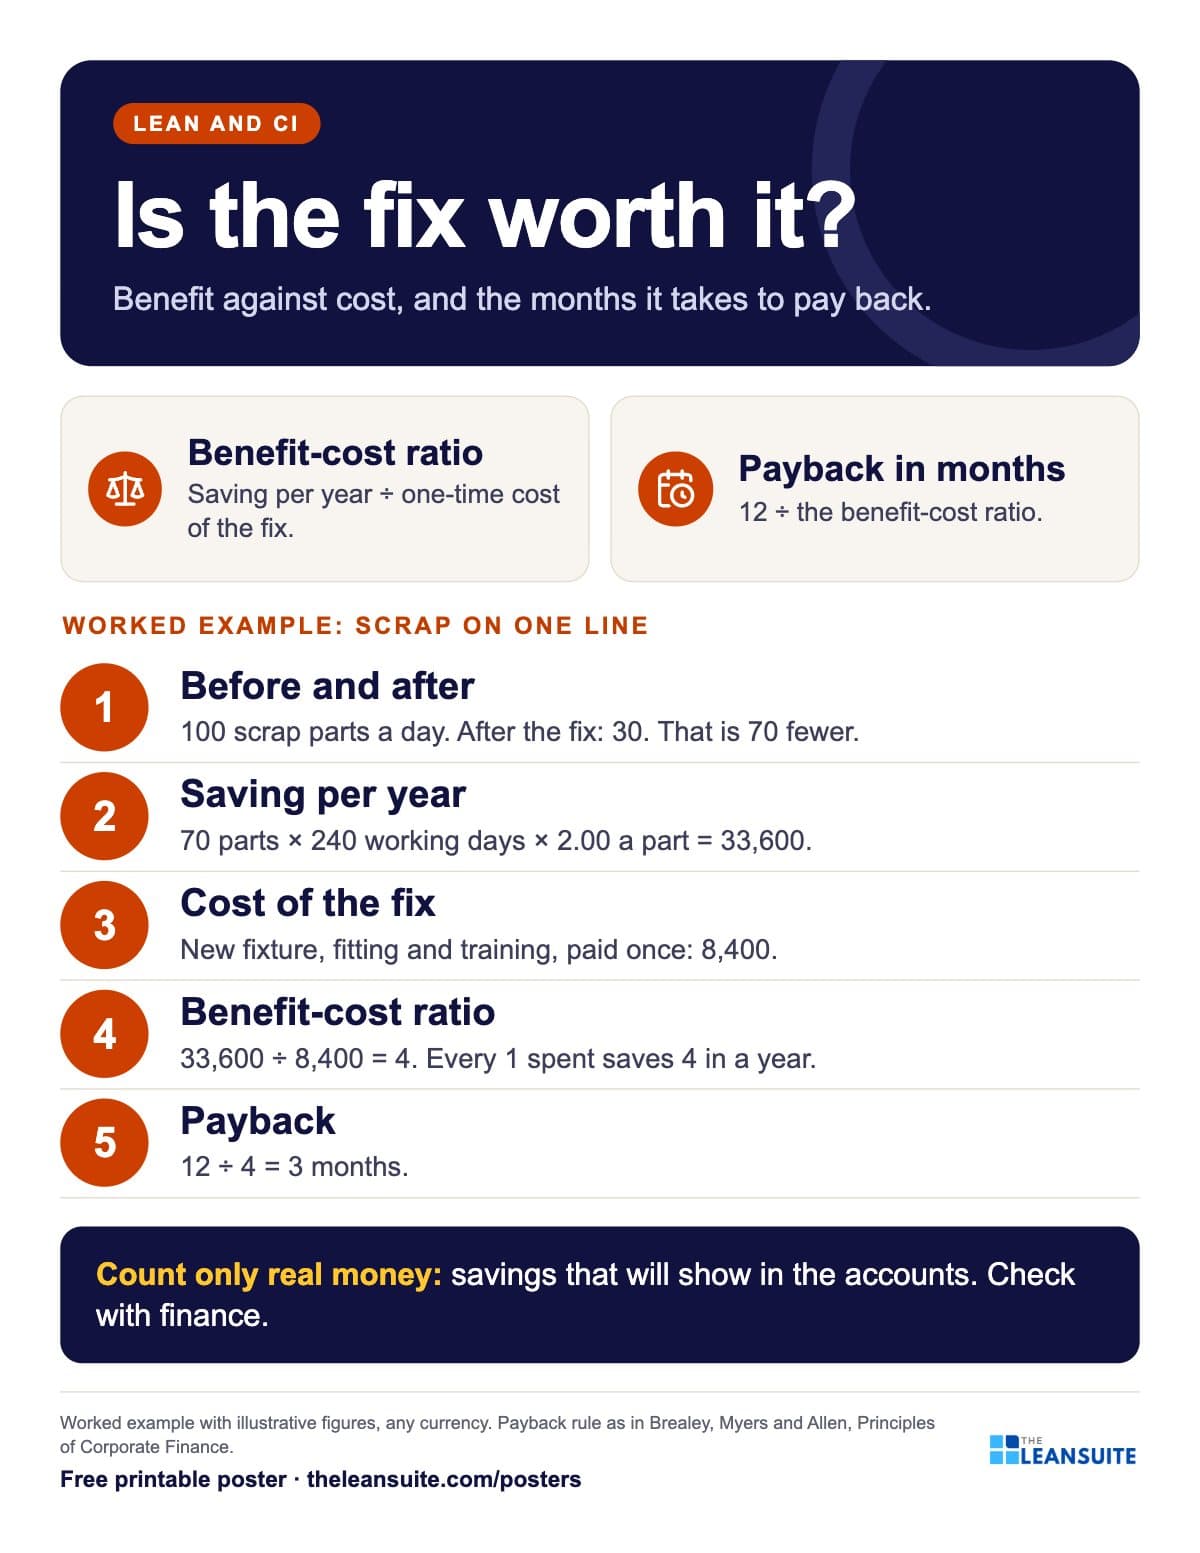 Benefit-cost ratio and payback poster
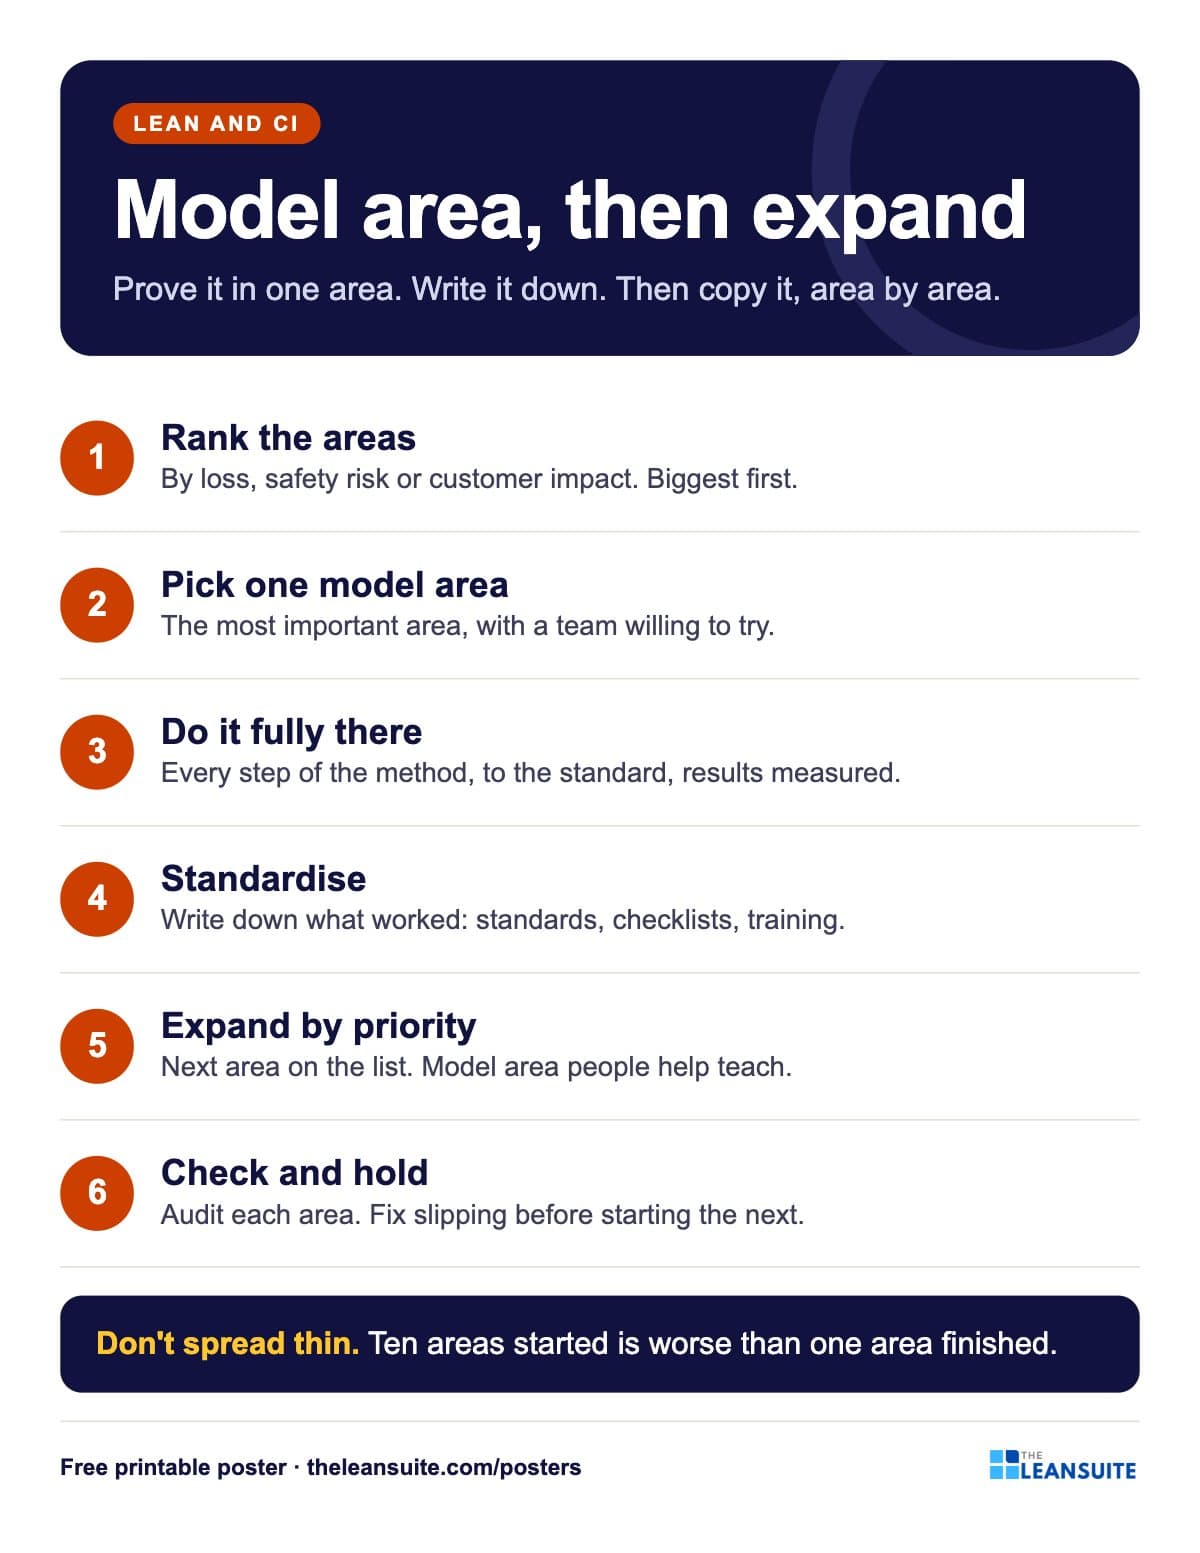 Model area and expansion poster
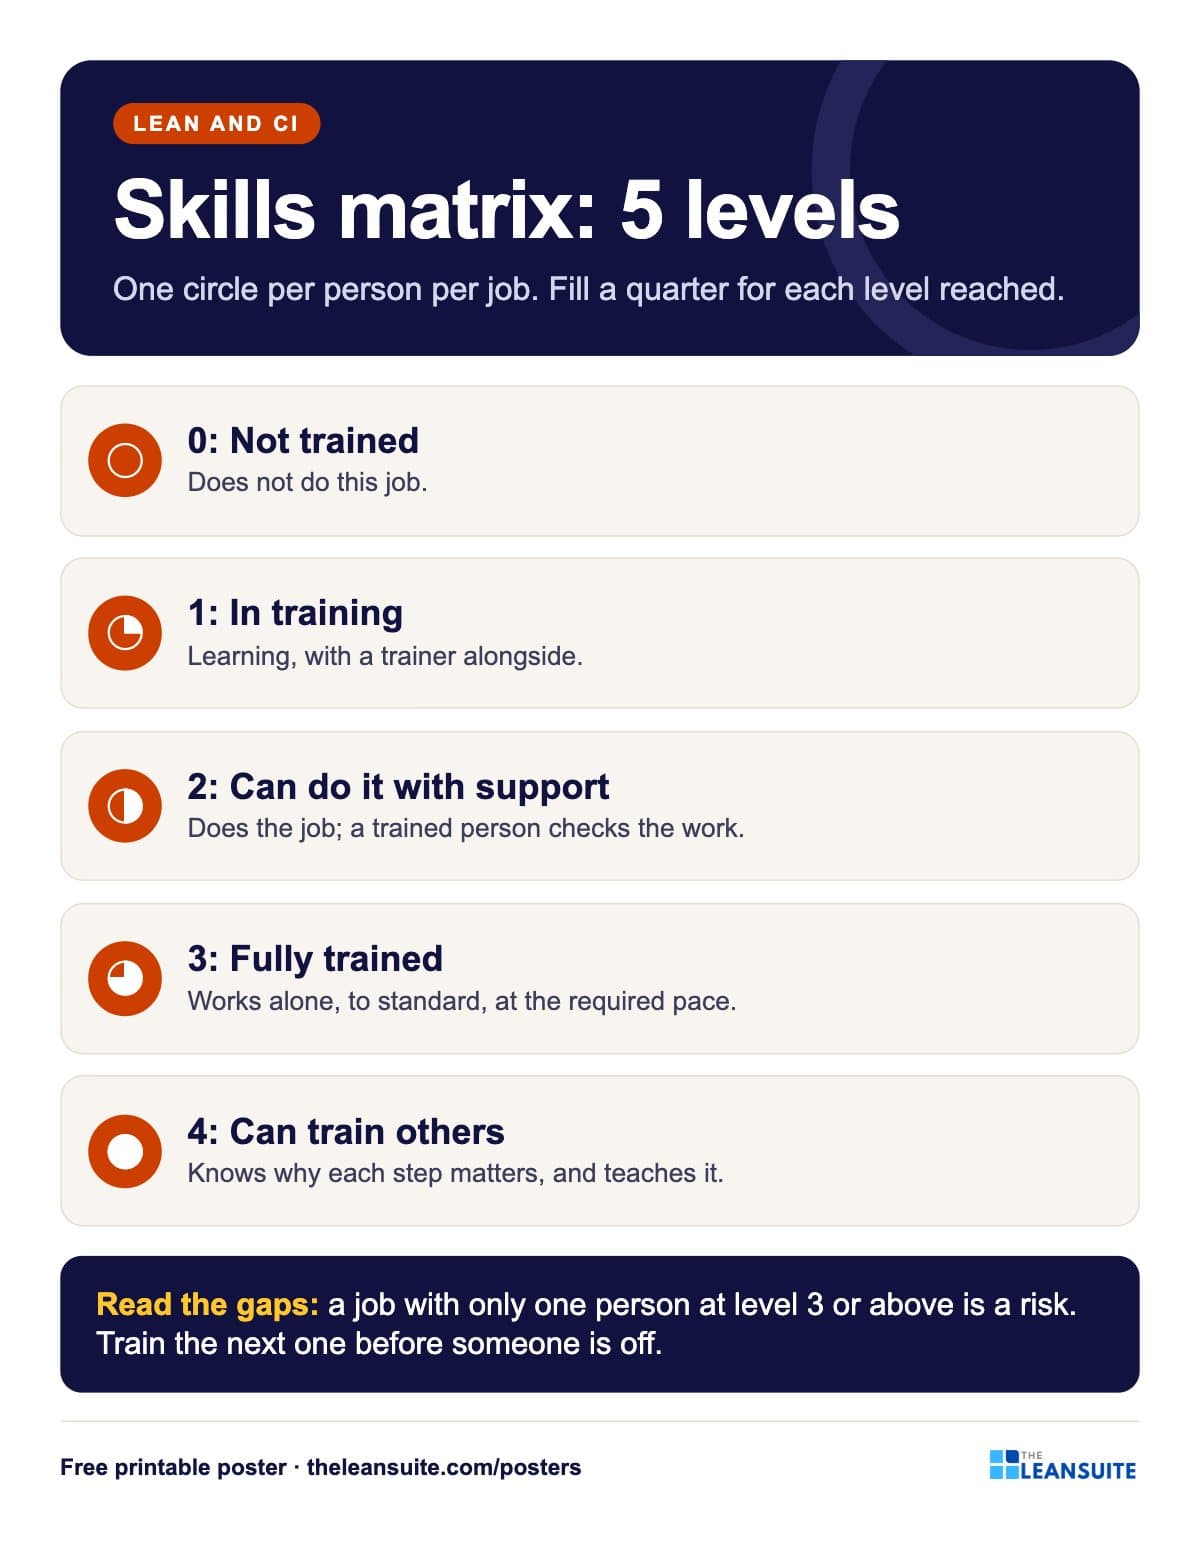 Skills matrix levels poster
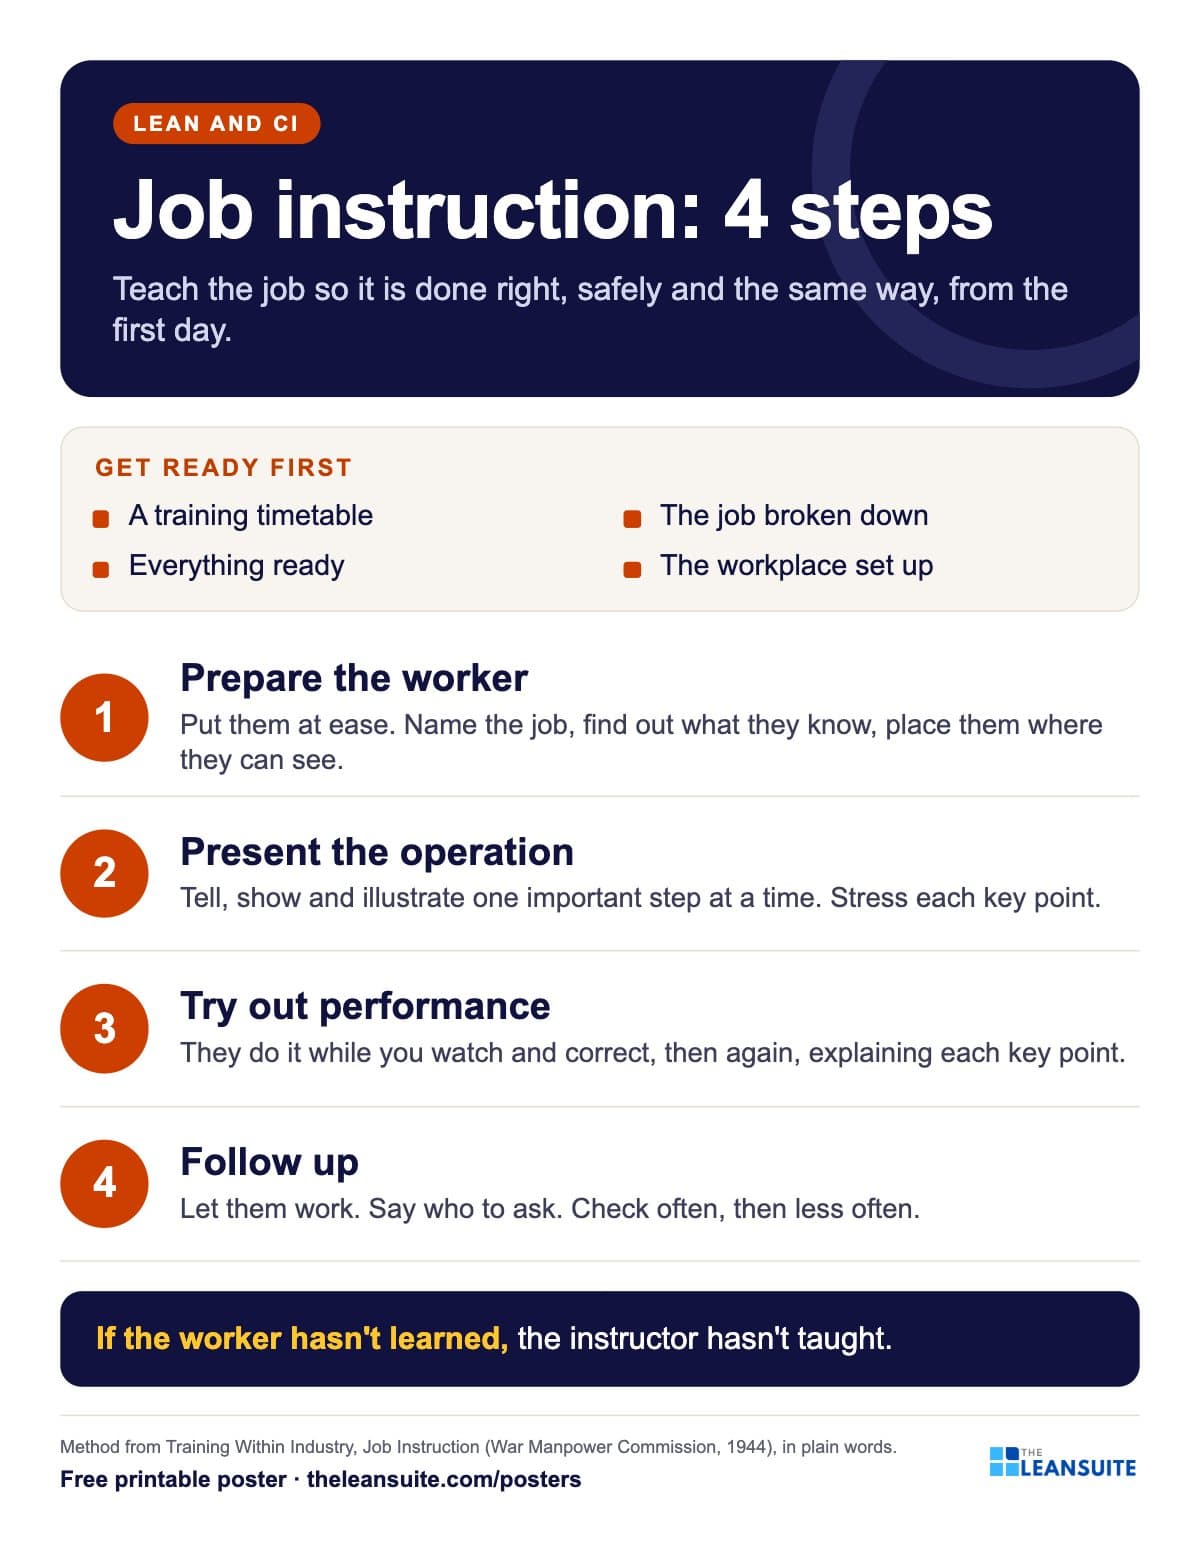 Job instruction 4 steps poster
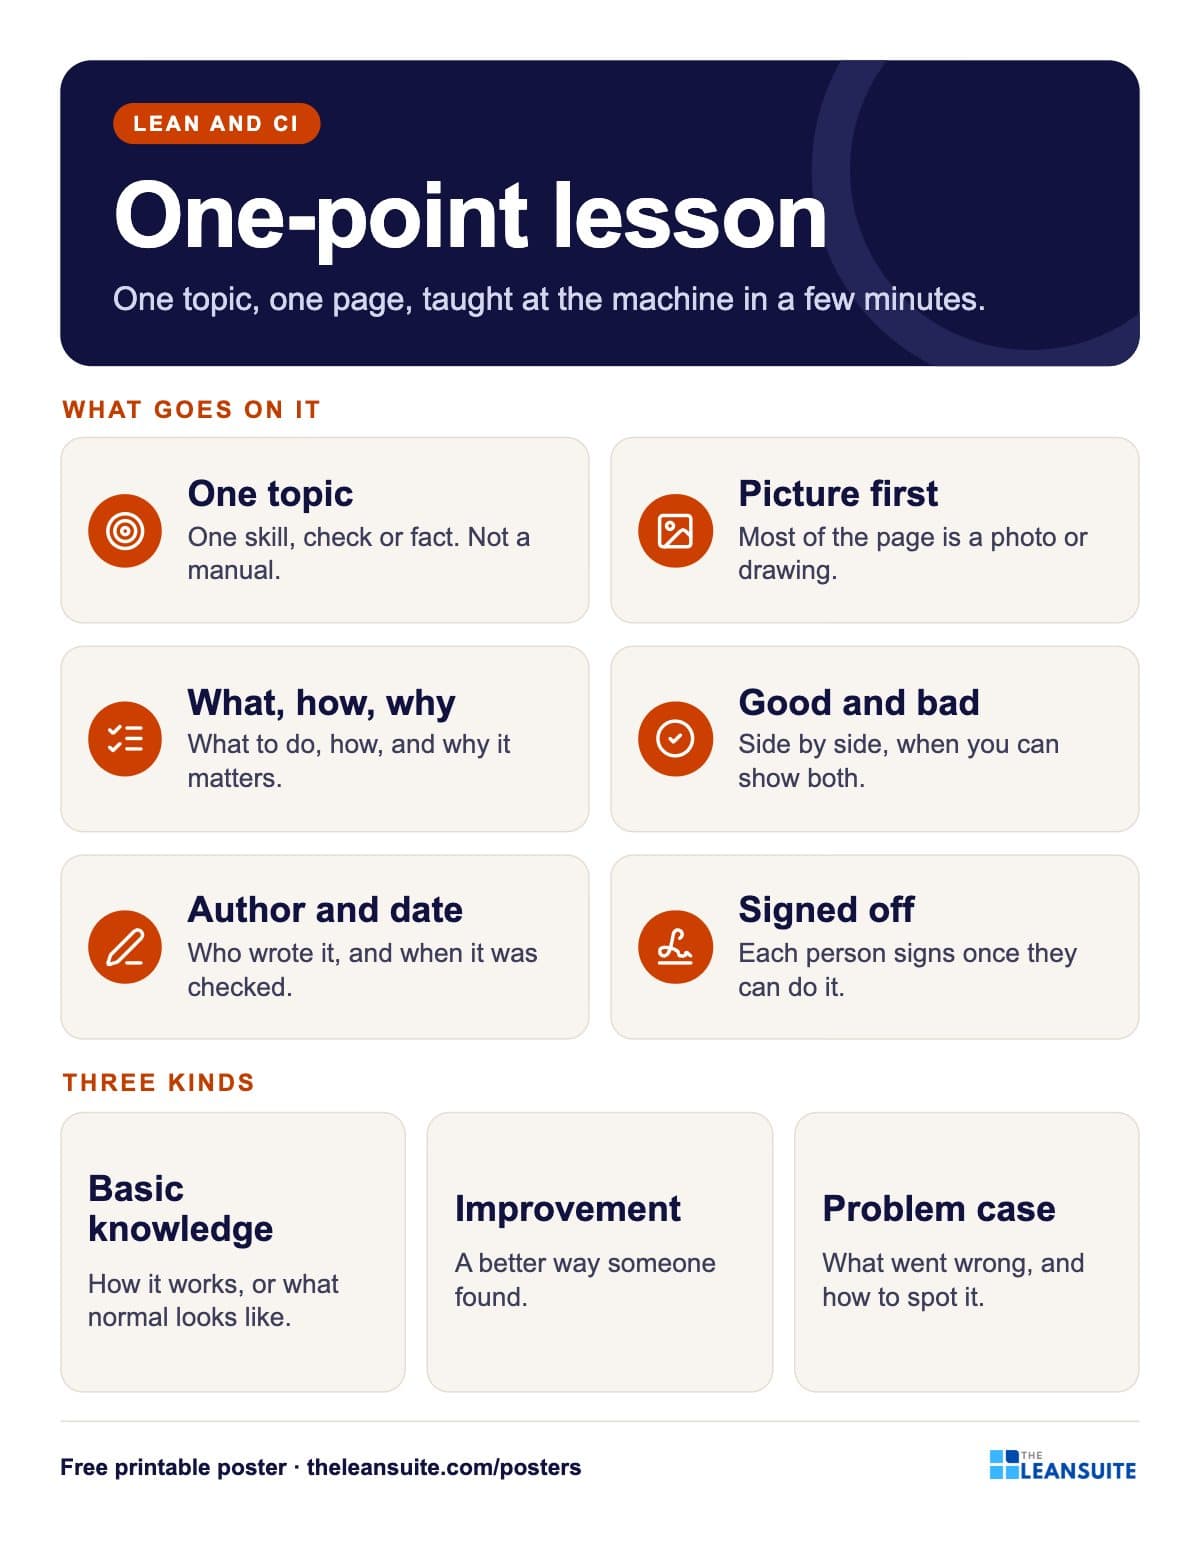 One-point lesson poster
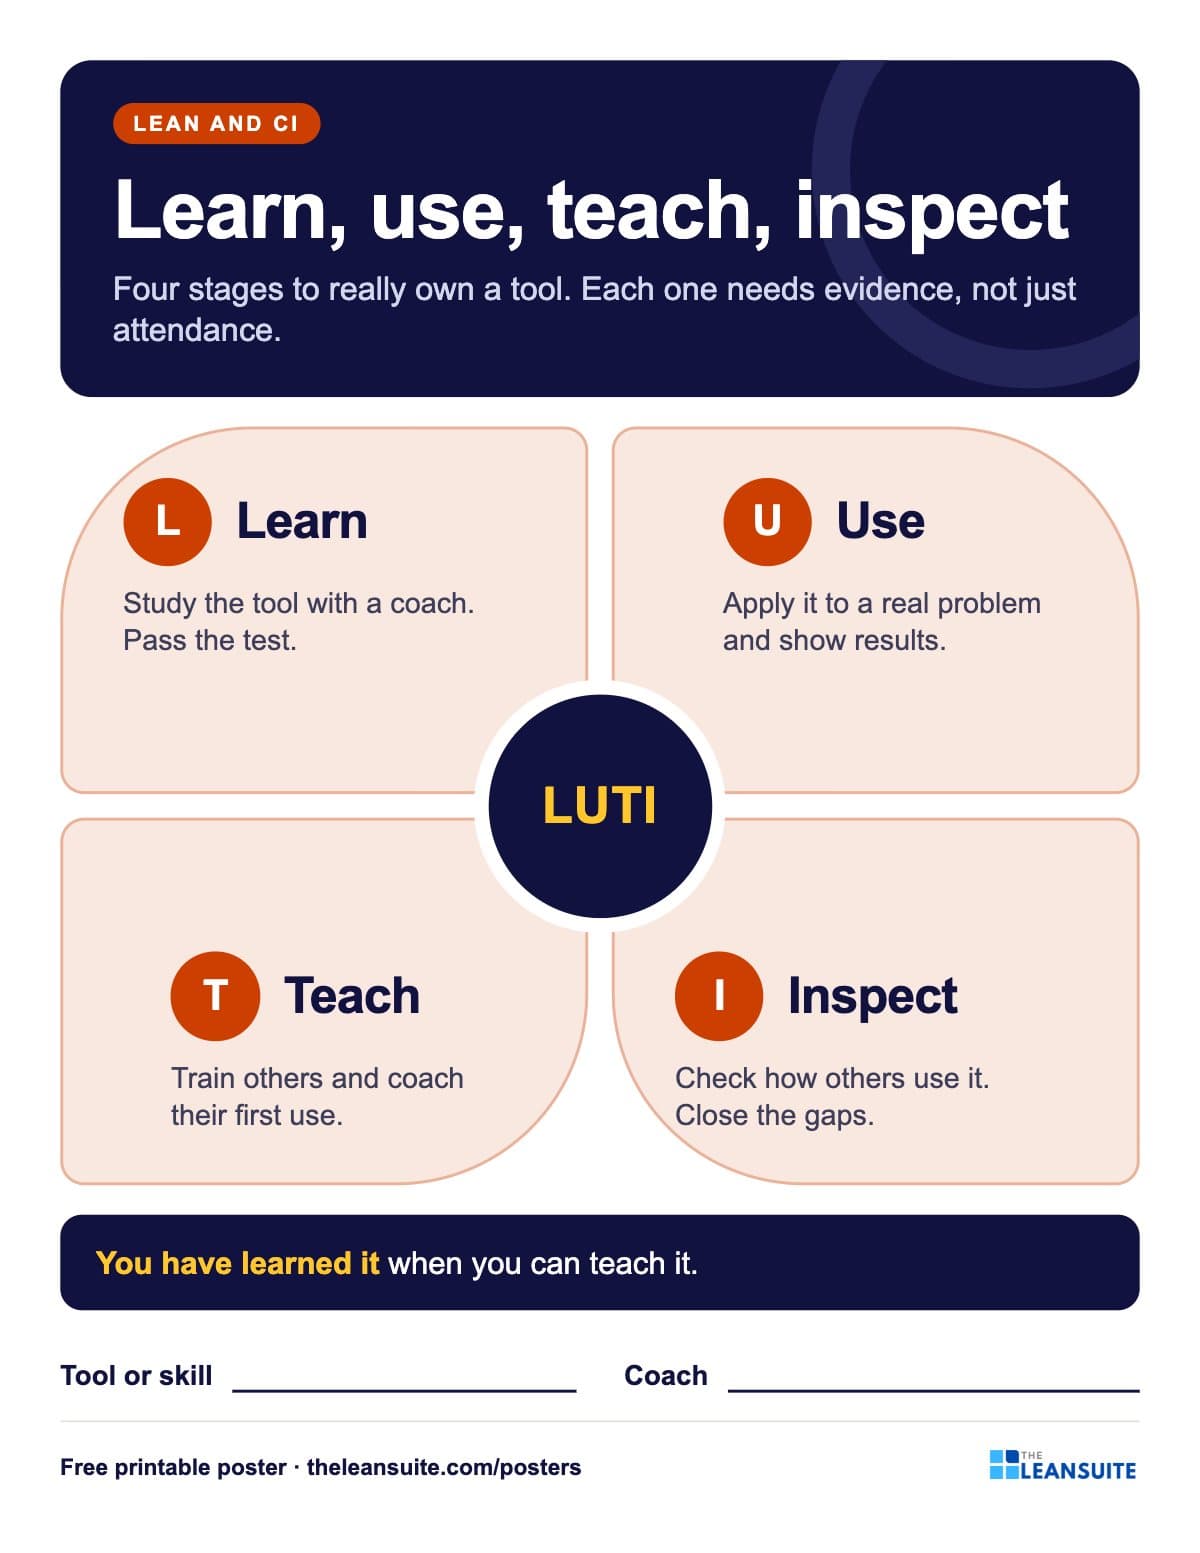 Learn, use, teach, inspect poster
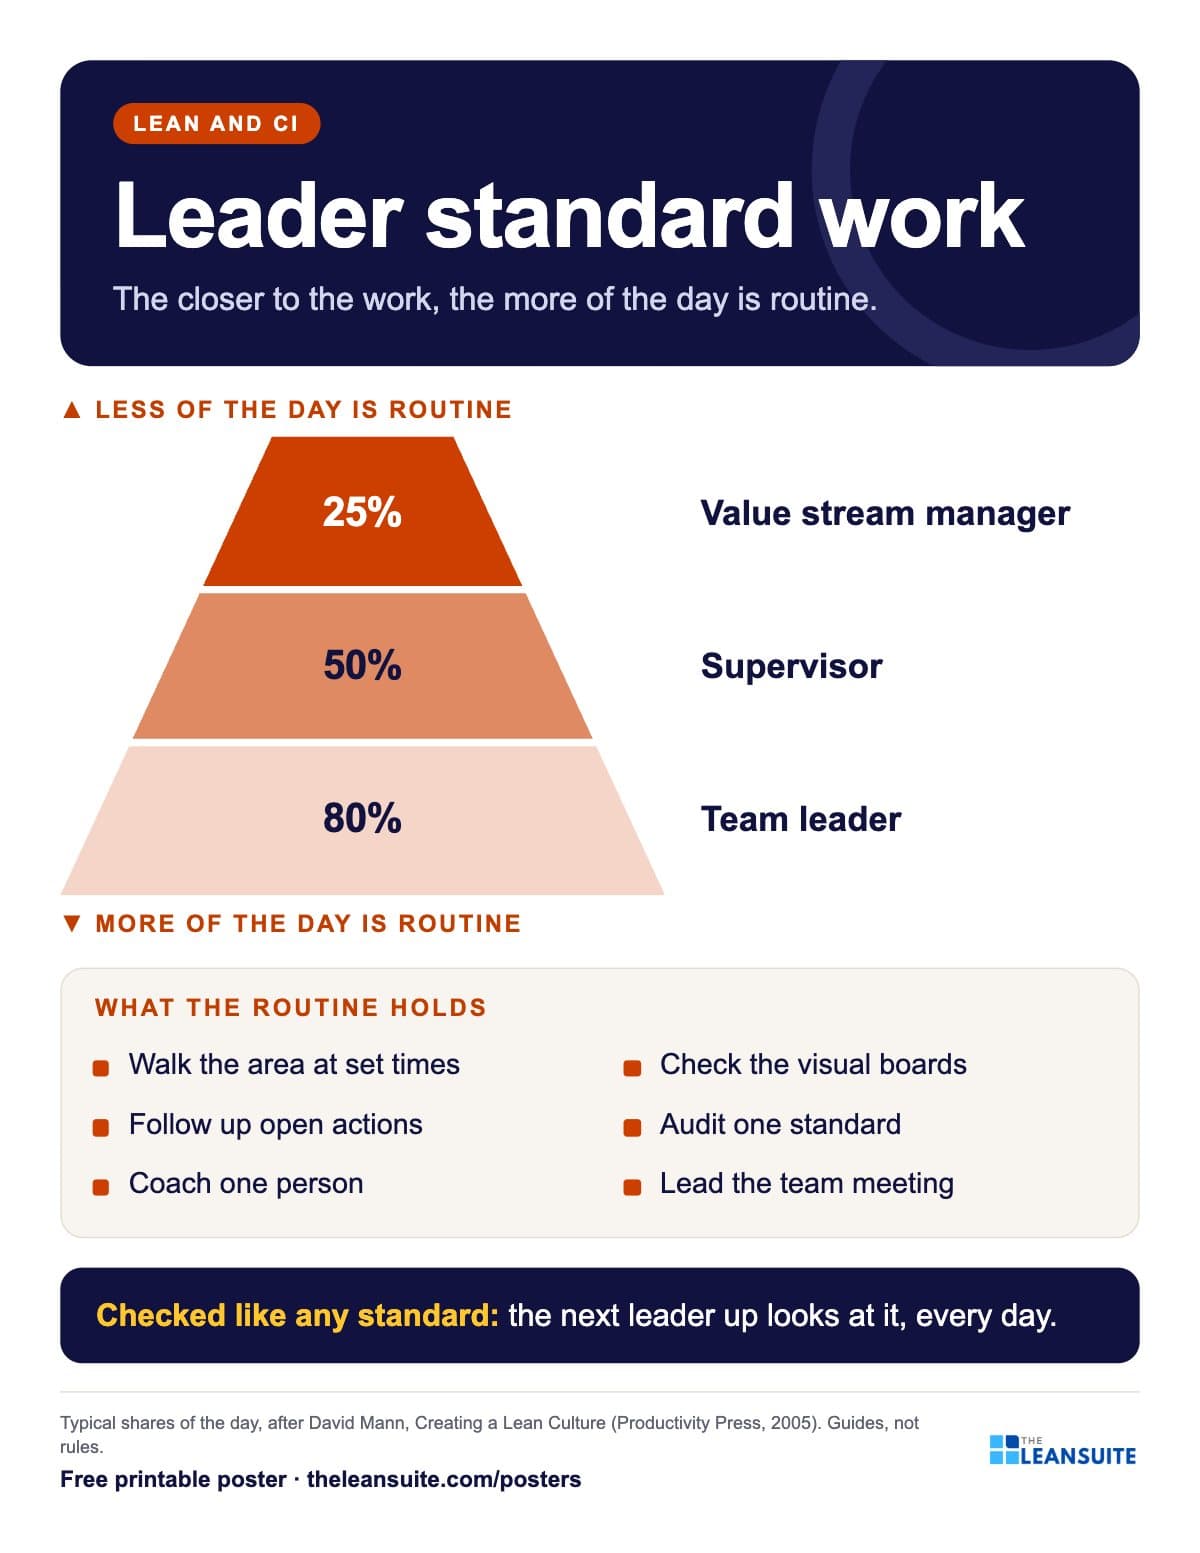 Leader standard work poster
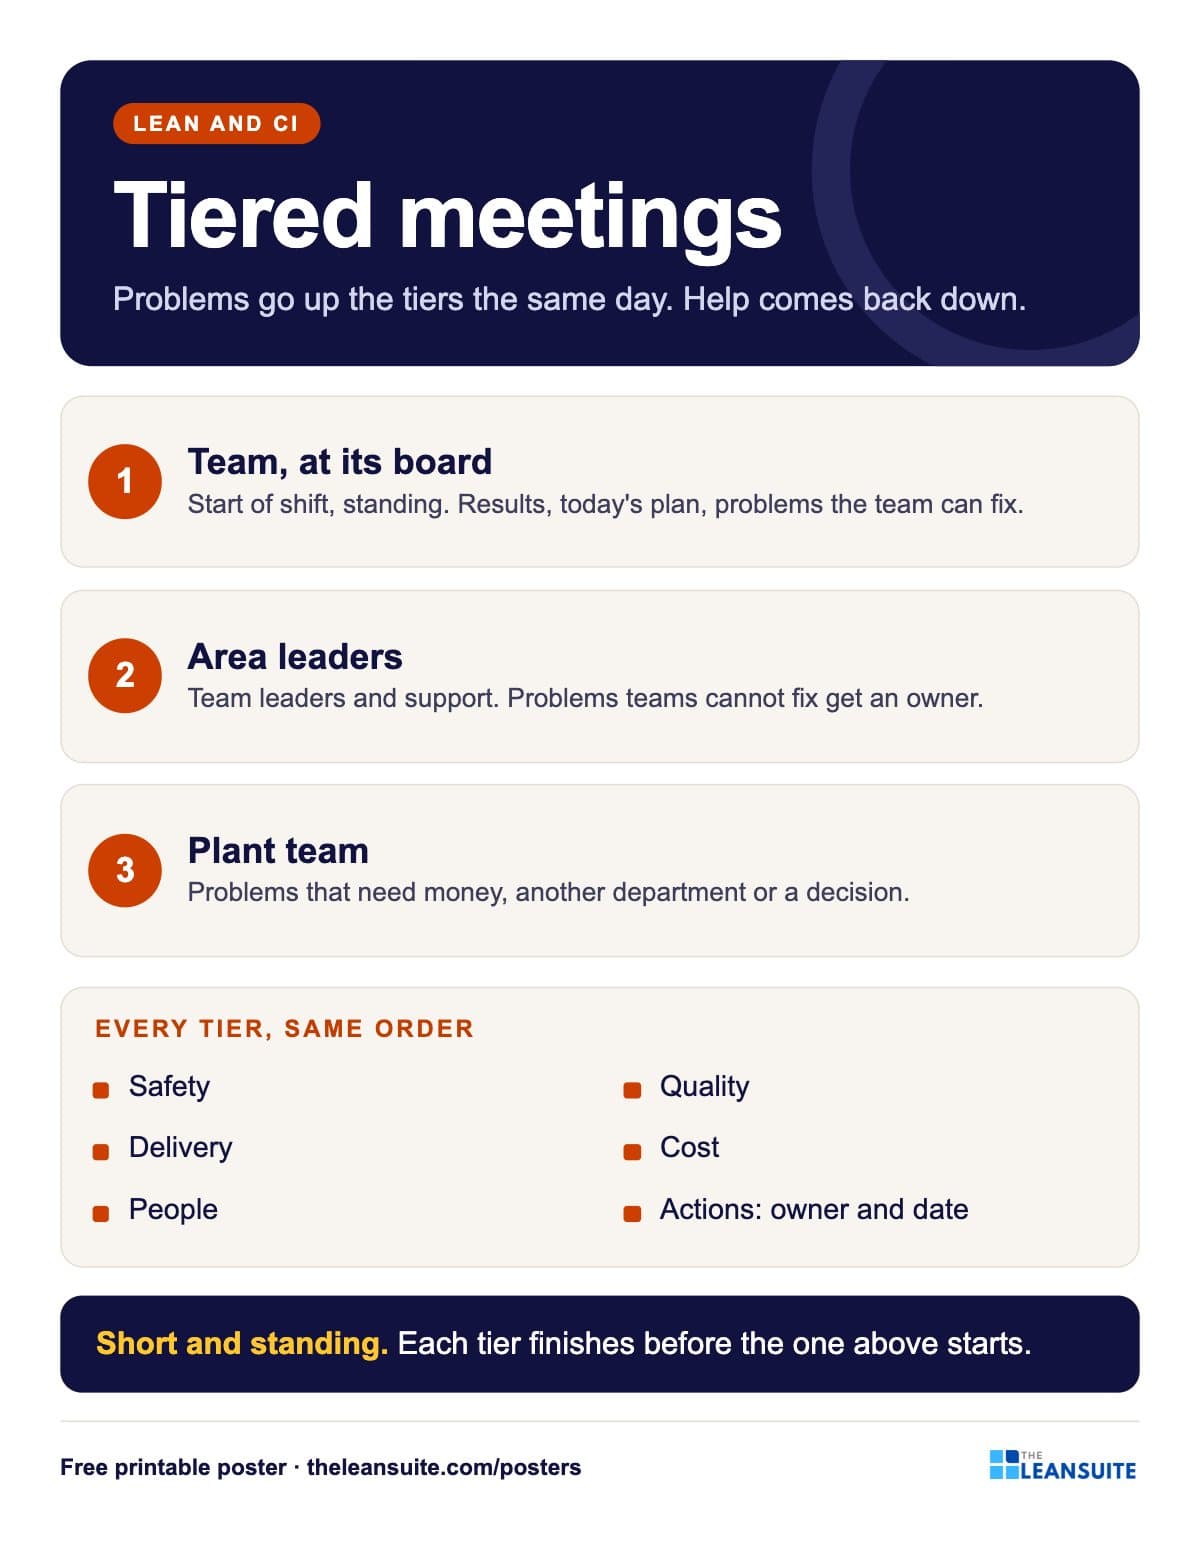 Tiered meetings poster
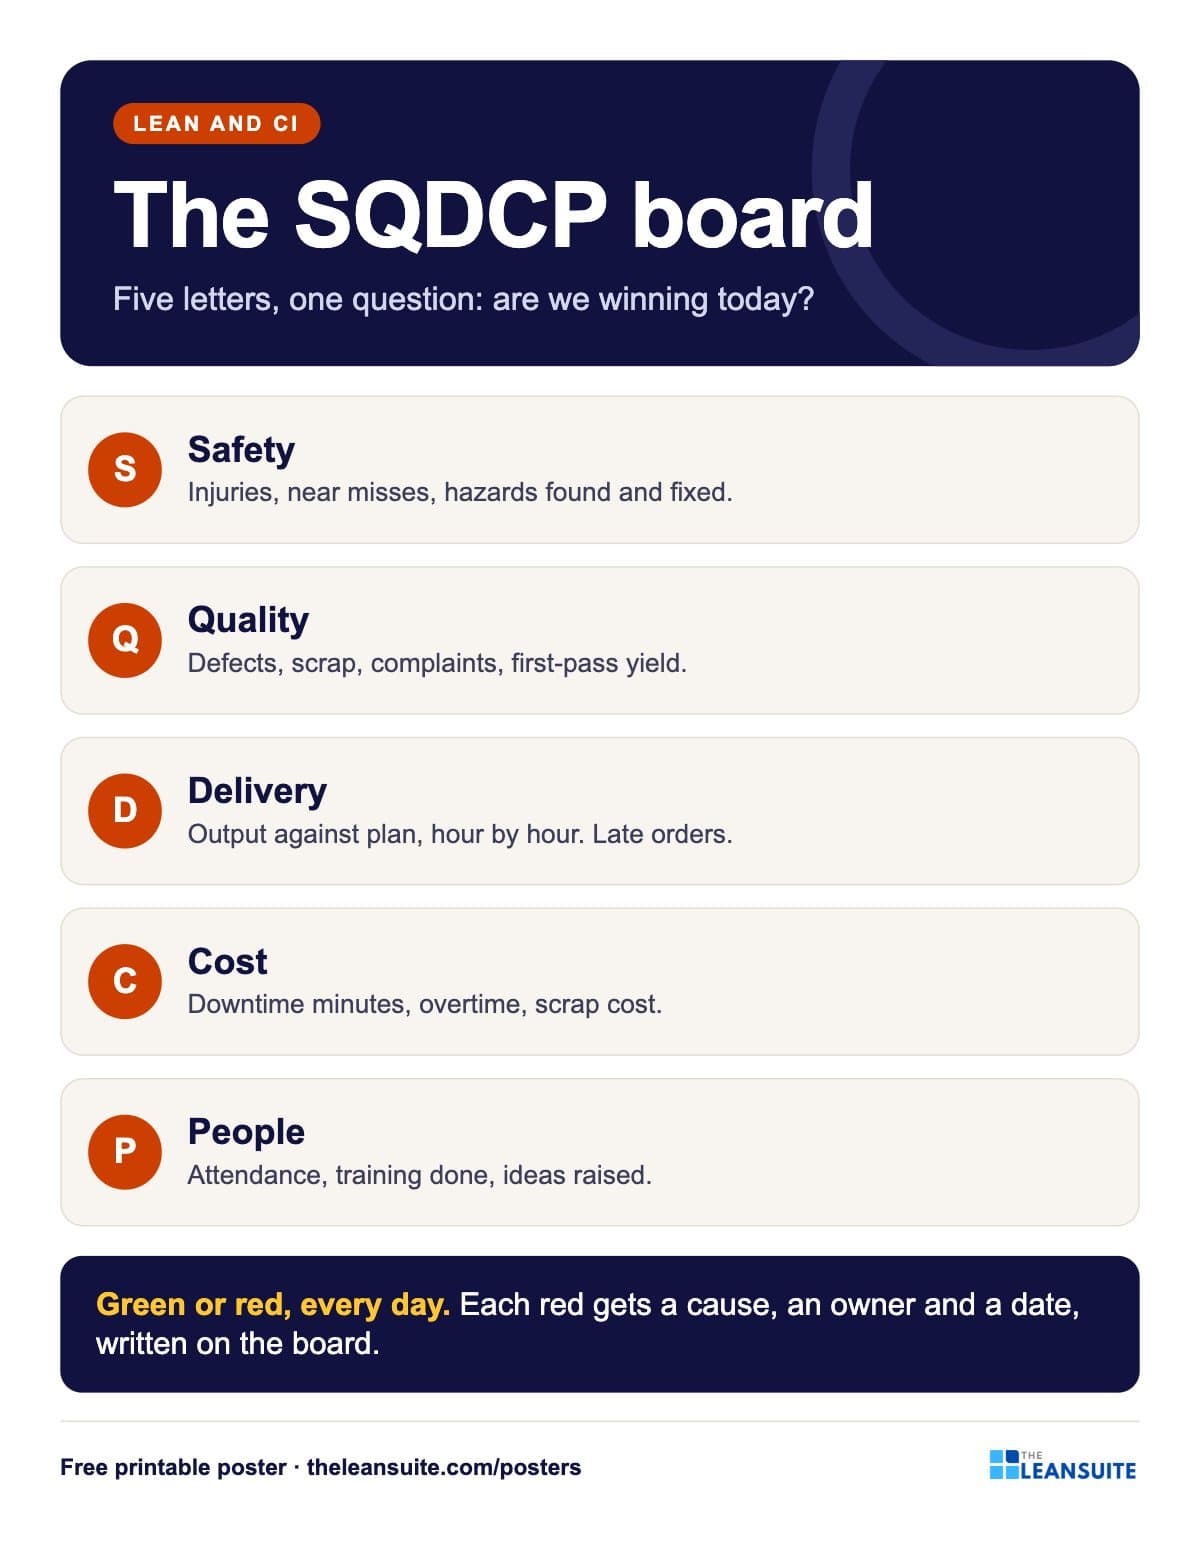 SQDCP board poster
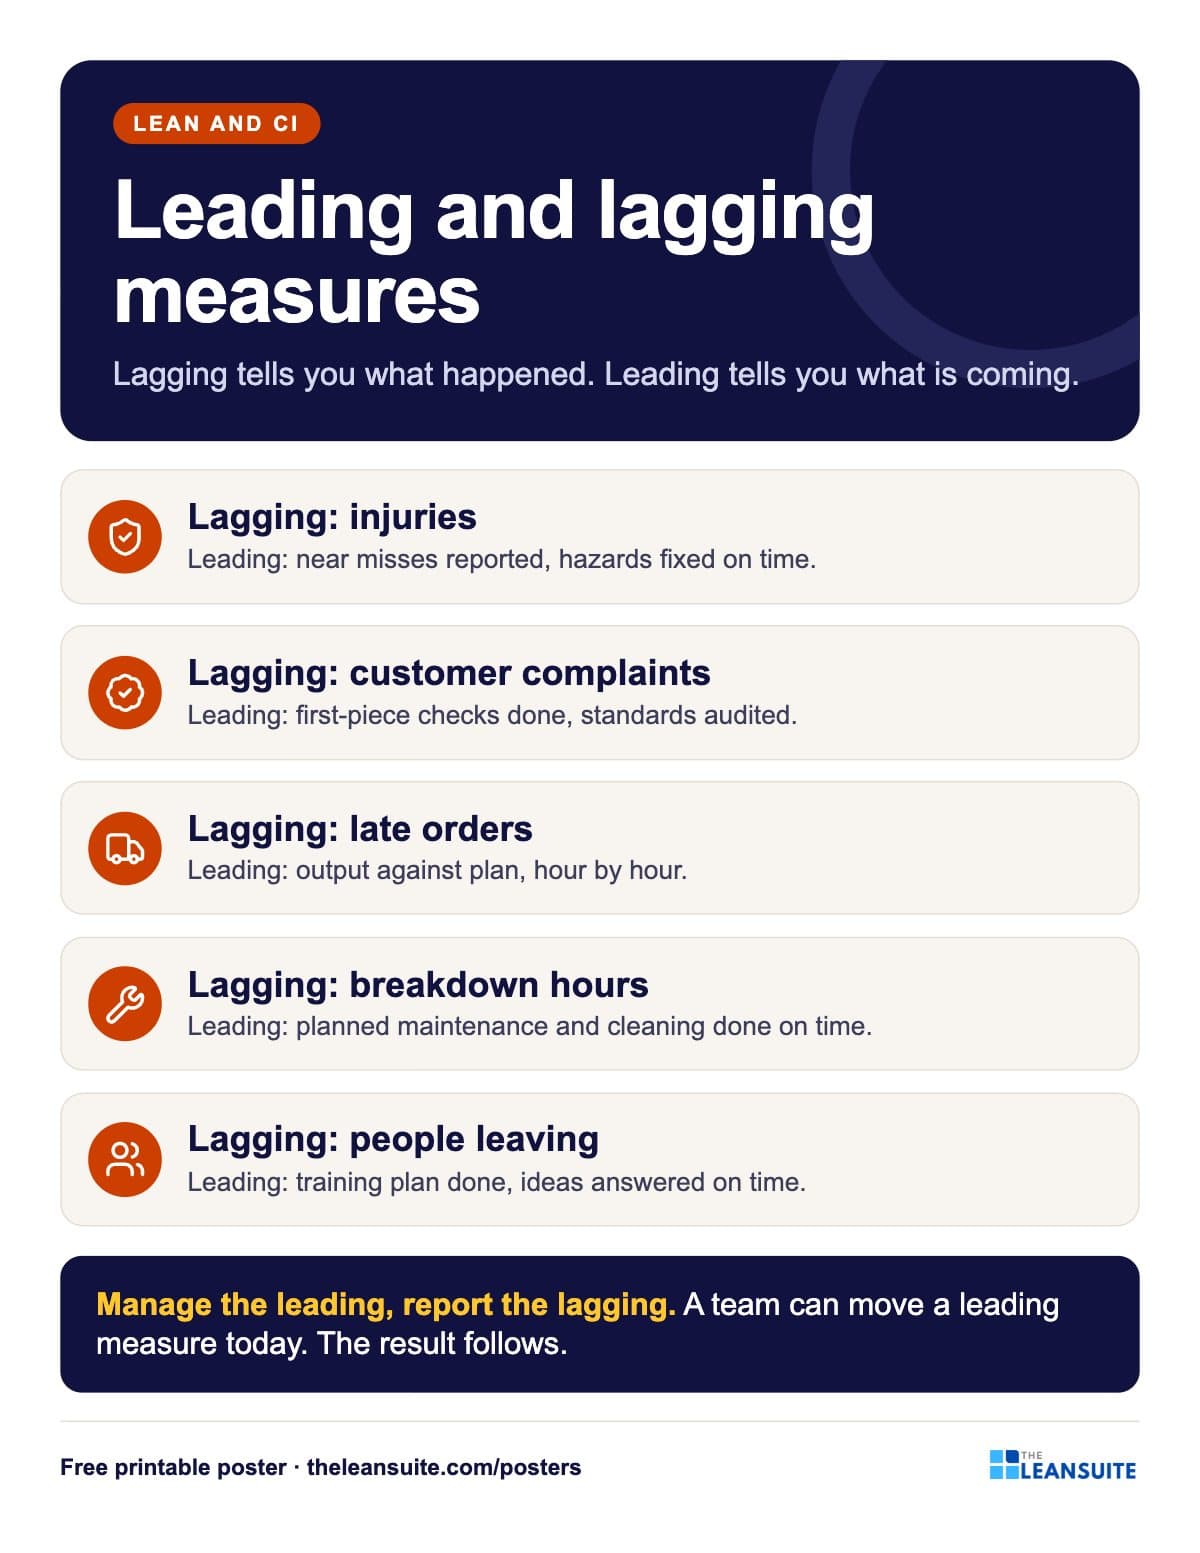 Leading and lagging indicators poster
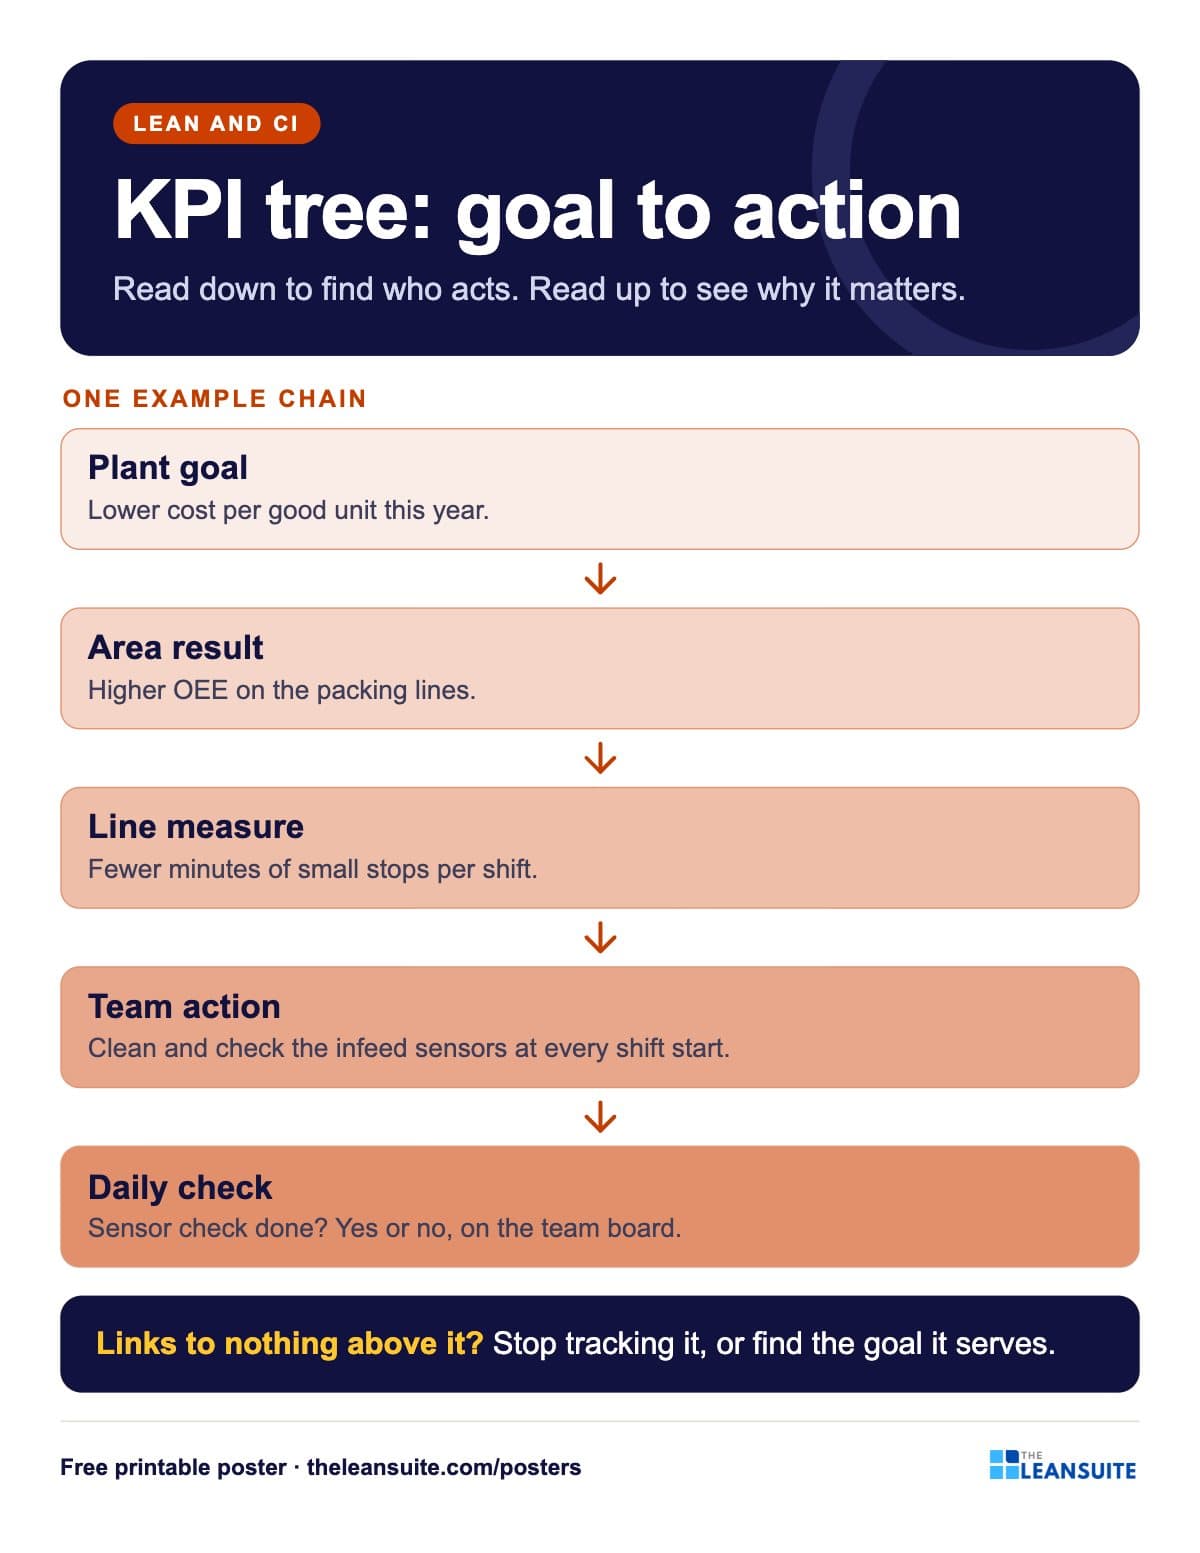 KPI tree poster
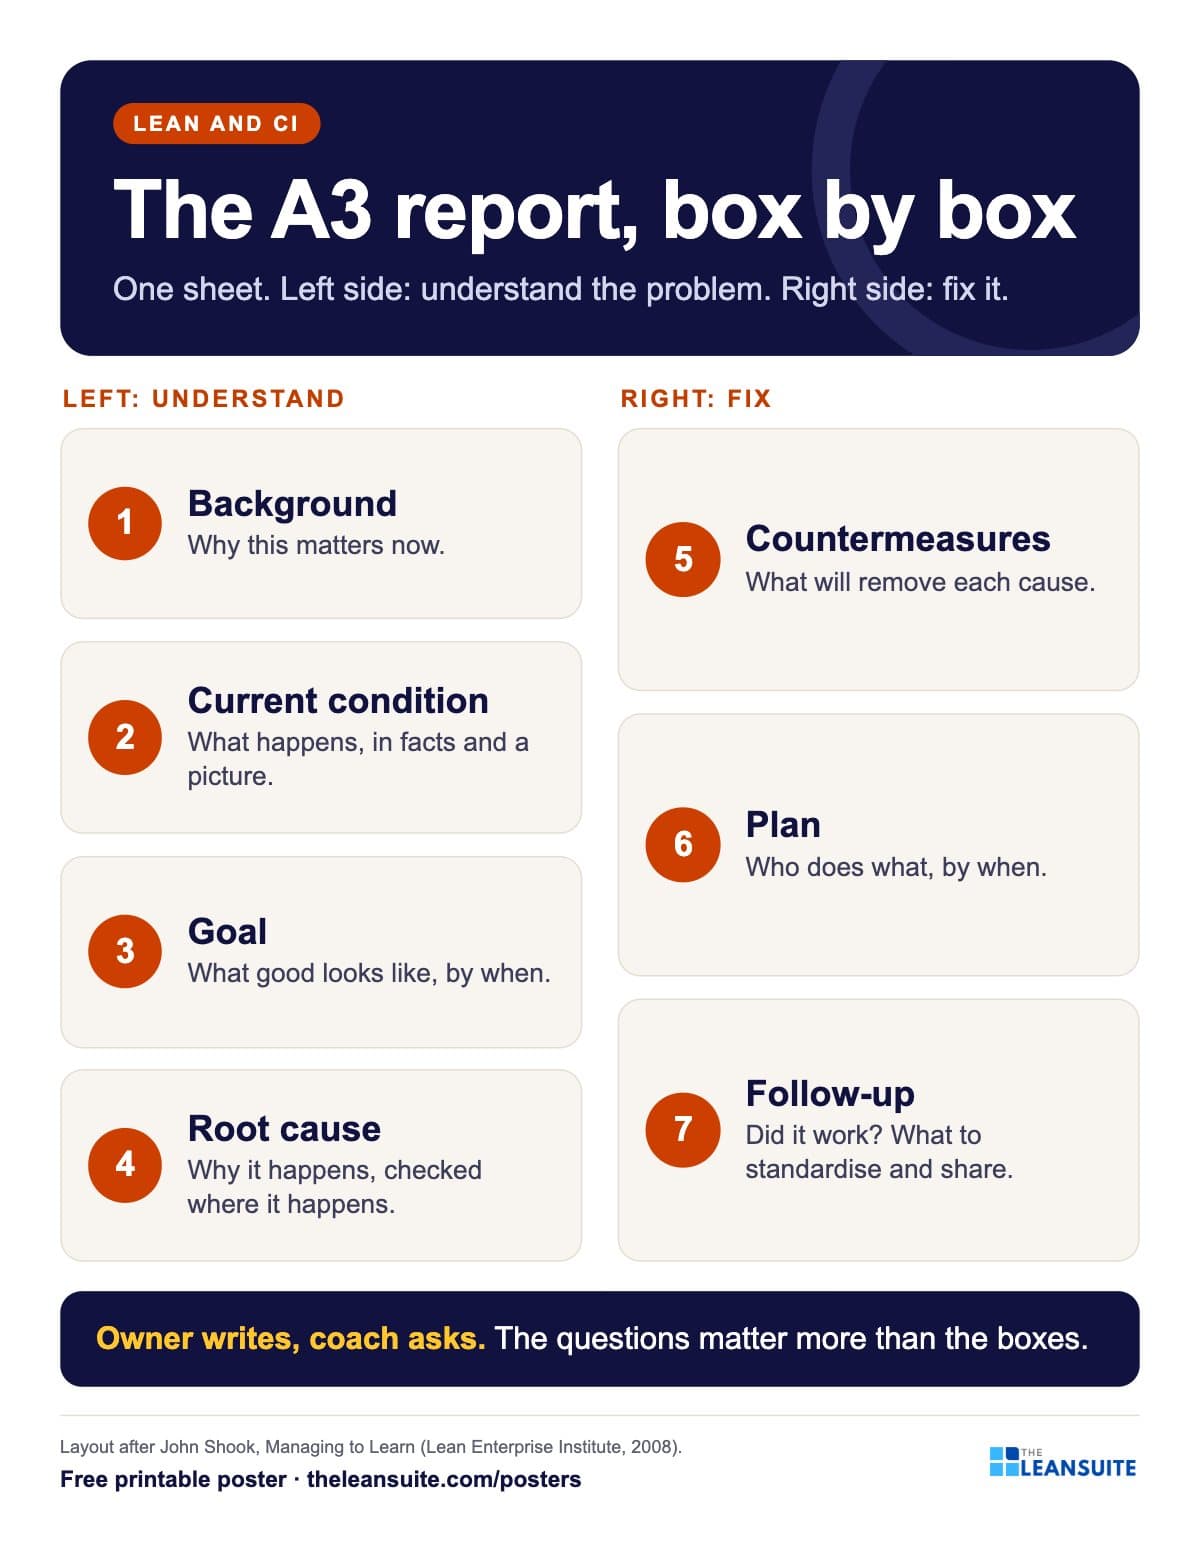 A3 report layout poster
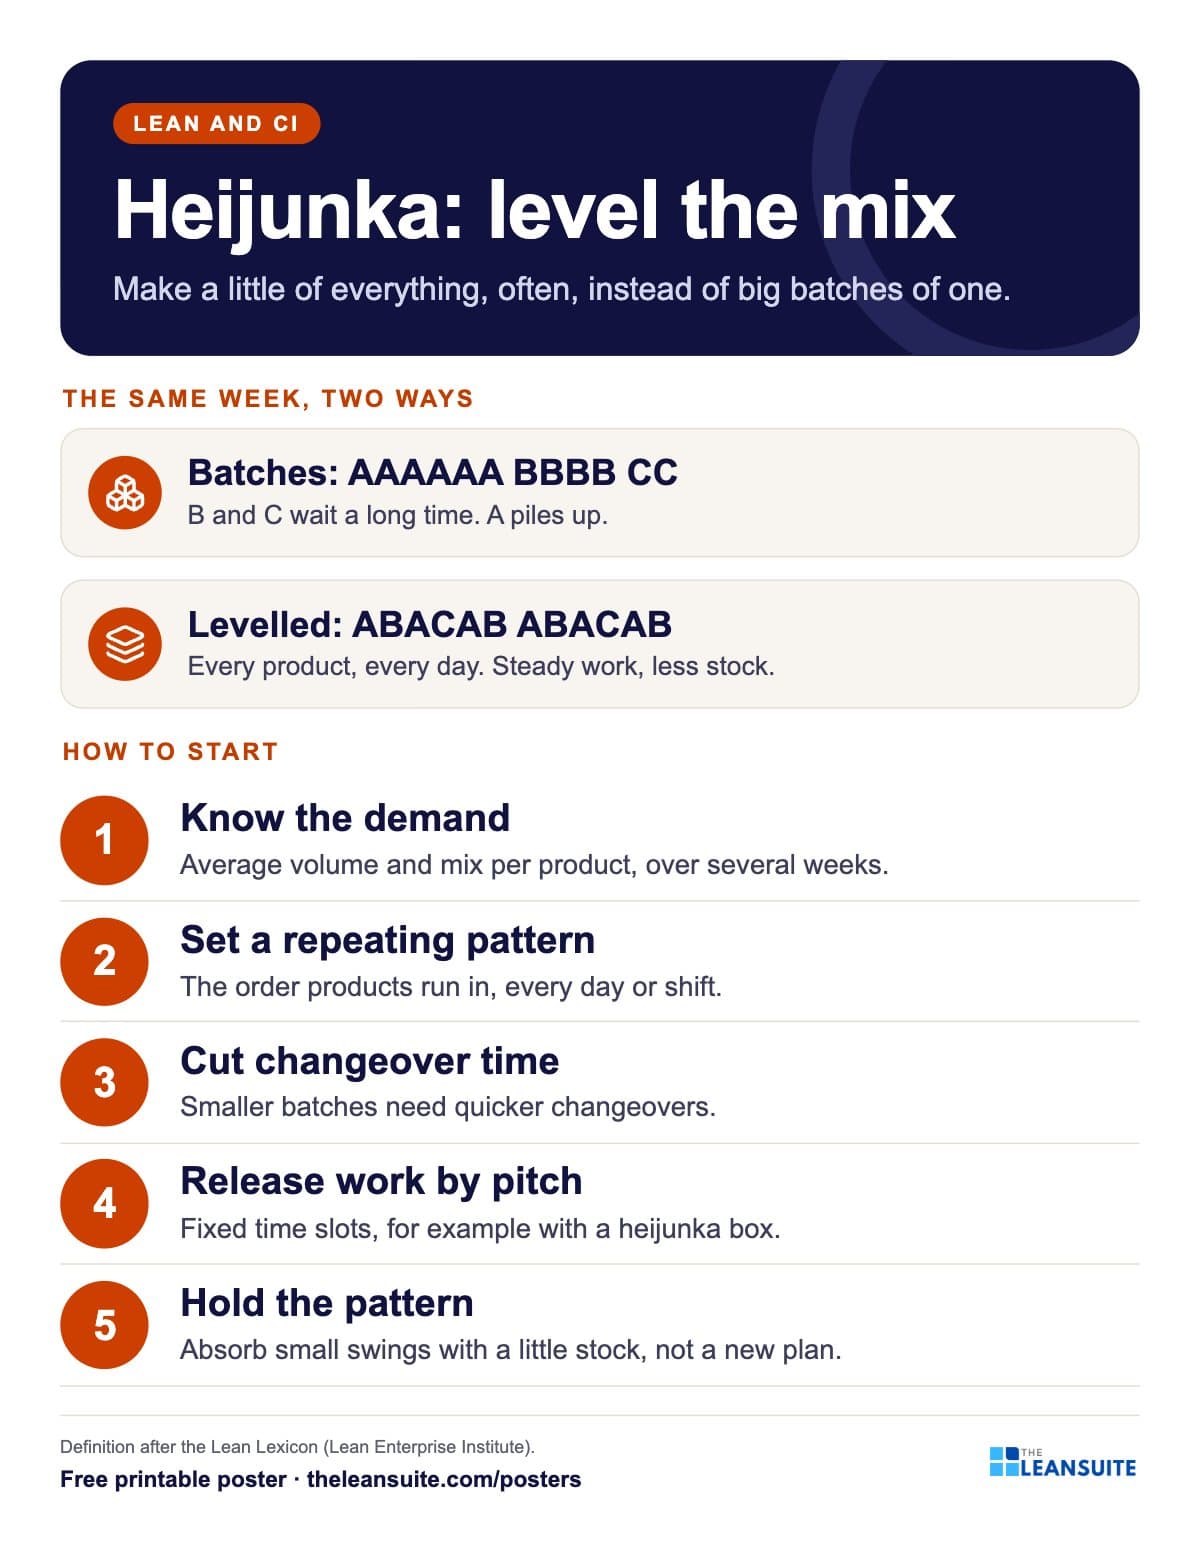 Heijunka production levelling poster
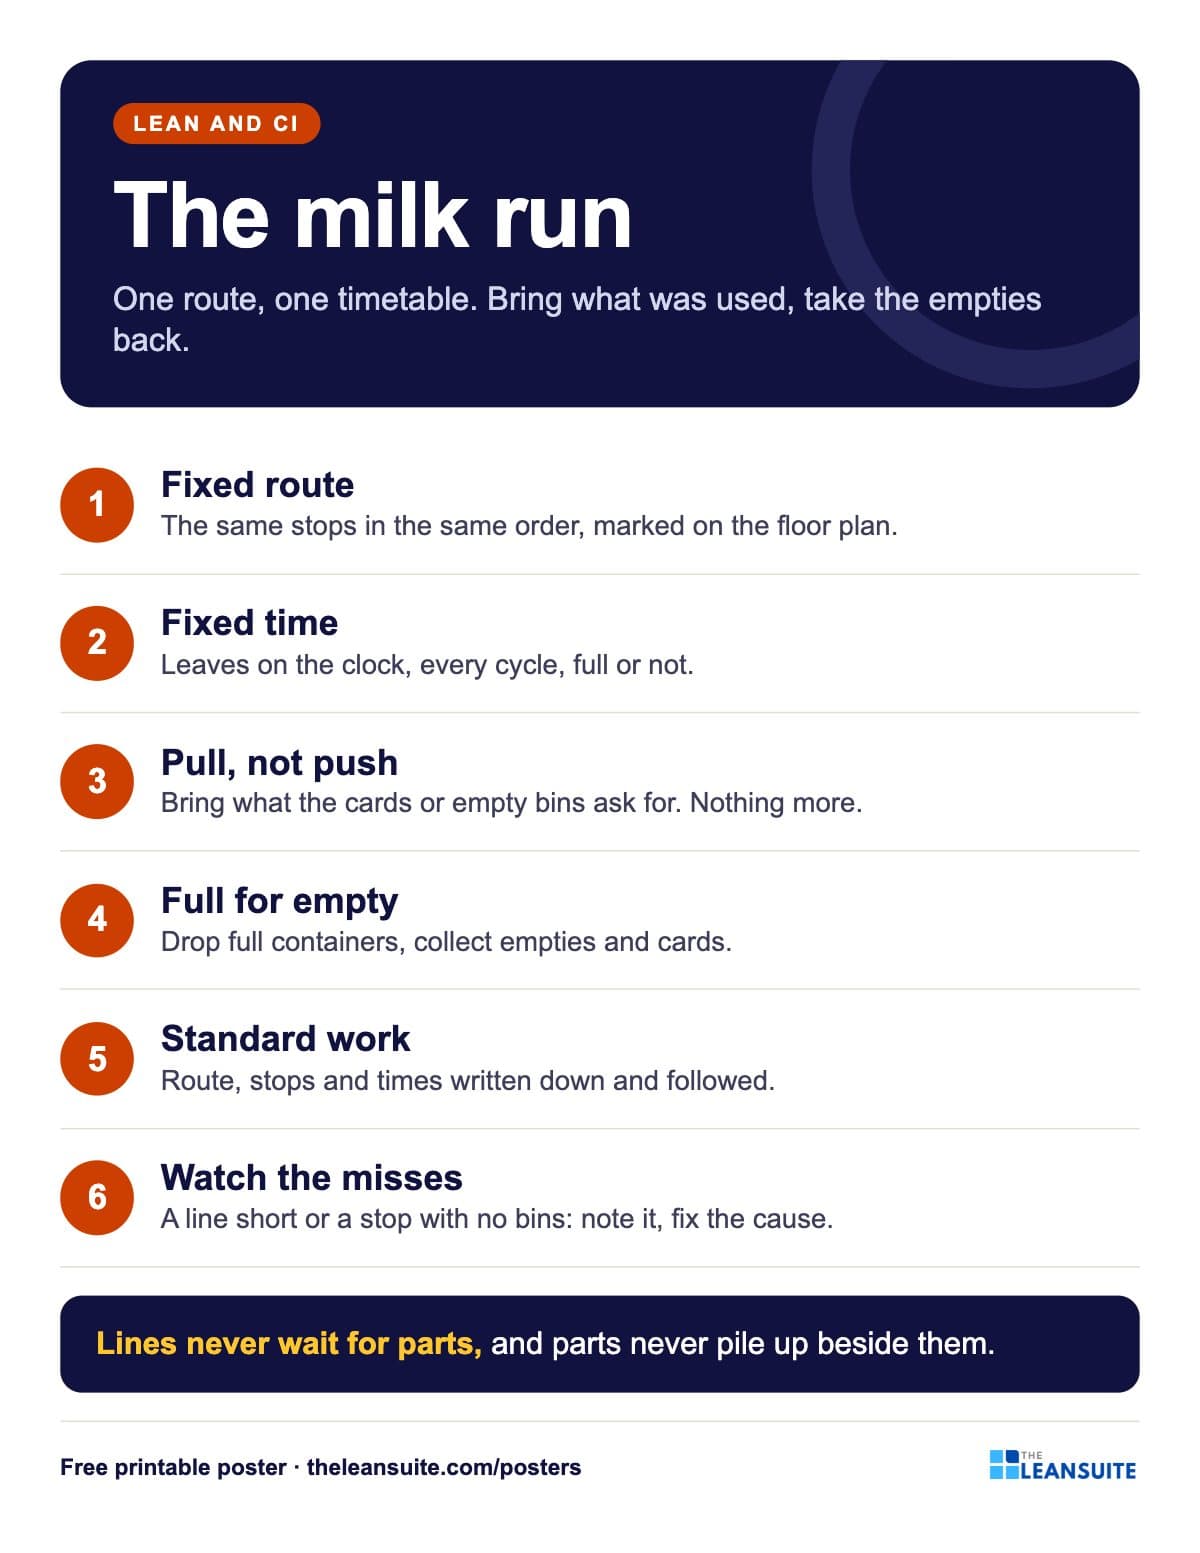 Milk run poster
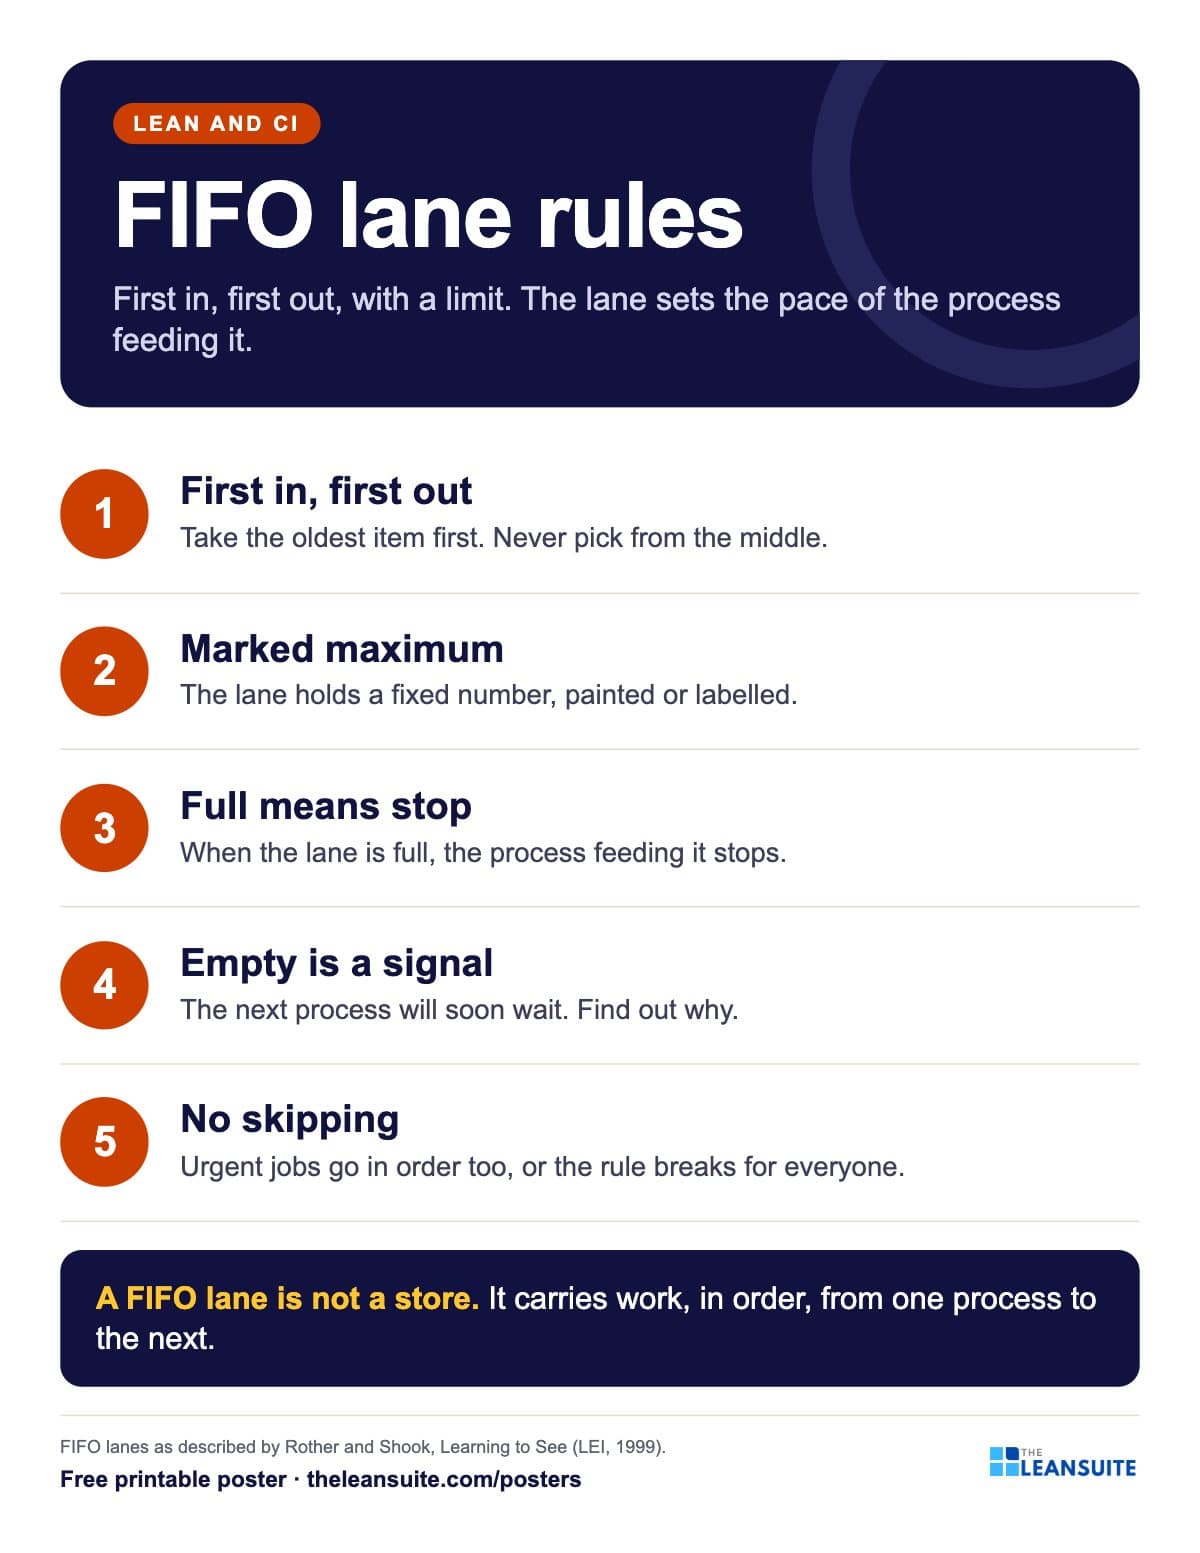 FIFO lane rules poster
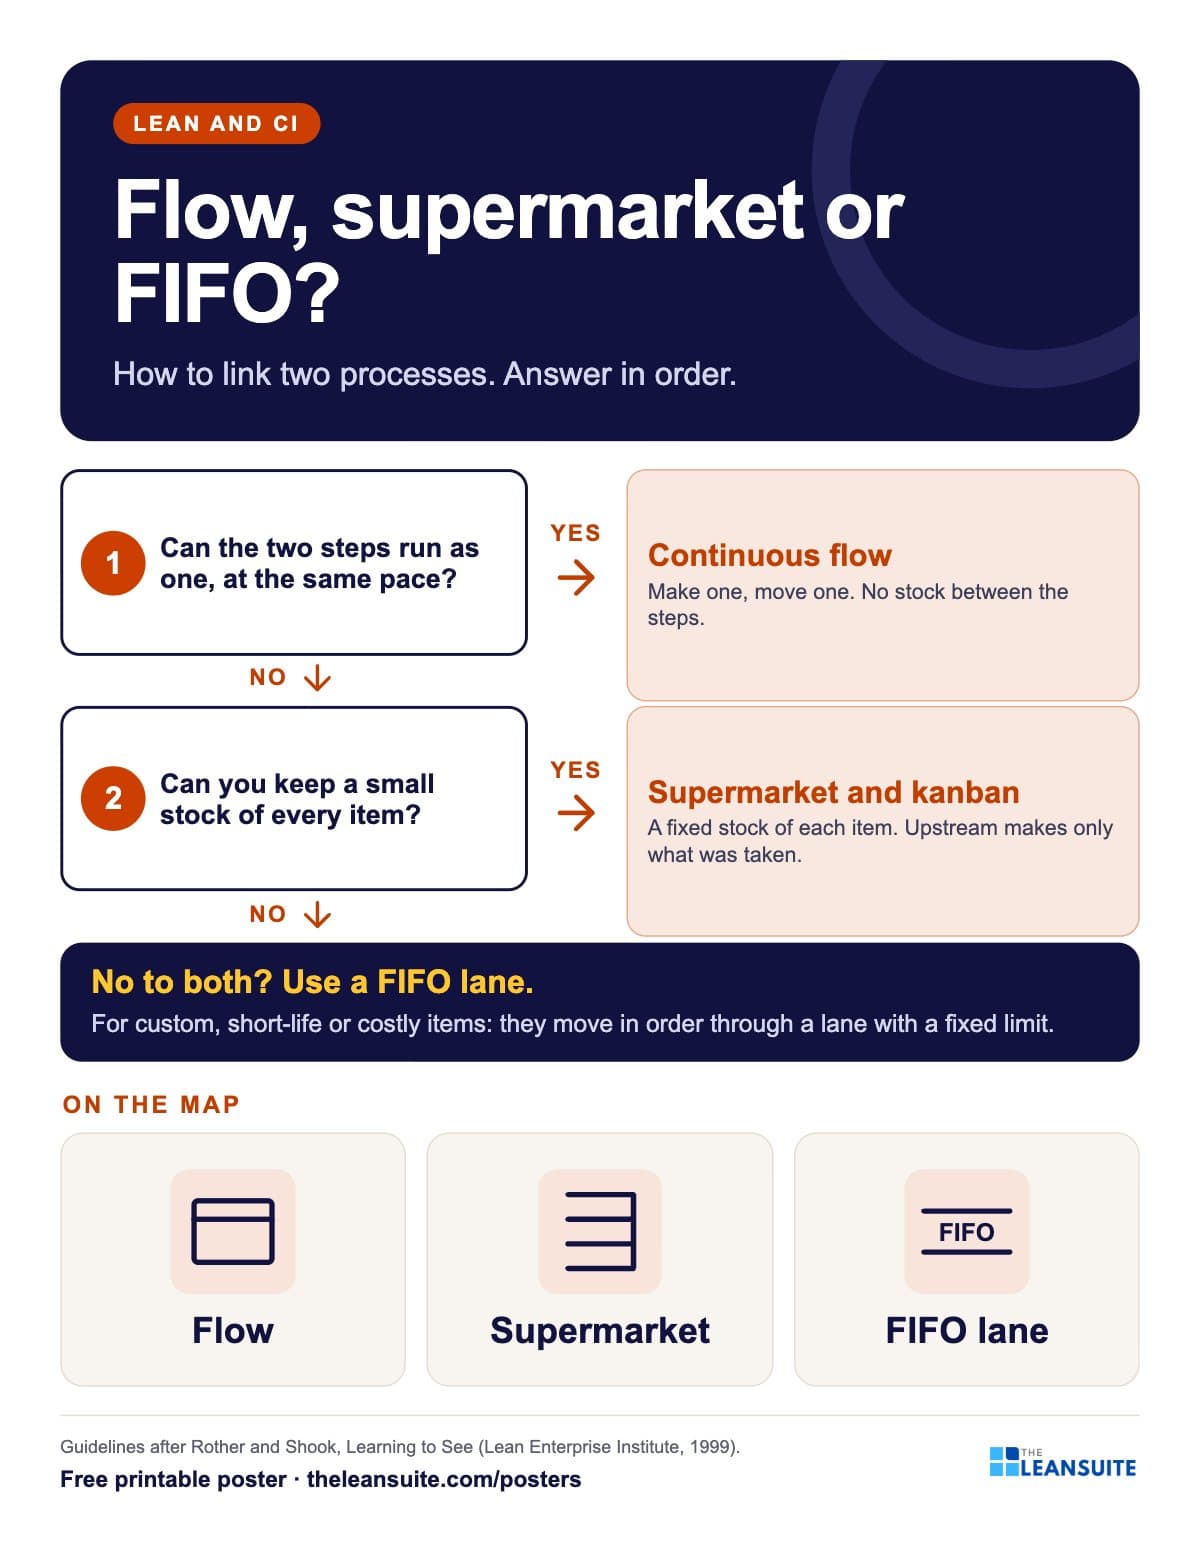 Flow, supermarket or FIFO lane poster
 Bottleneck five focusing steps poster
A poster reminds. A routine makes it stick.
See how plants run their audits, improvements and follow-ups in LeanSuite, on a call built around your own problem.
Book a 45-minute demo