
Free template
Updated
Attribute agreement analysis template
An attribute agreement analysis is a measurement system study for pass or fail decisions made by people or a go/no-go gauge. Several appraisers rate the same parts more than once, and the results are compared with each other and with a known reference. This template has a study sheet for 30 parts, three appraisers and two trials, and an Excel file that works out the agreement, kappa, effectiveness, miss rate and false alarm rate for each appraiser, with a verdict against limits you can change.
Free to use: print it, copy it and edit it for your team. Enter your name and work email once to download.
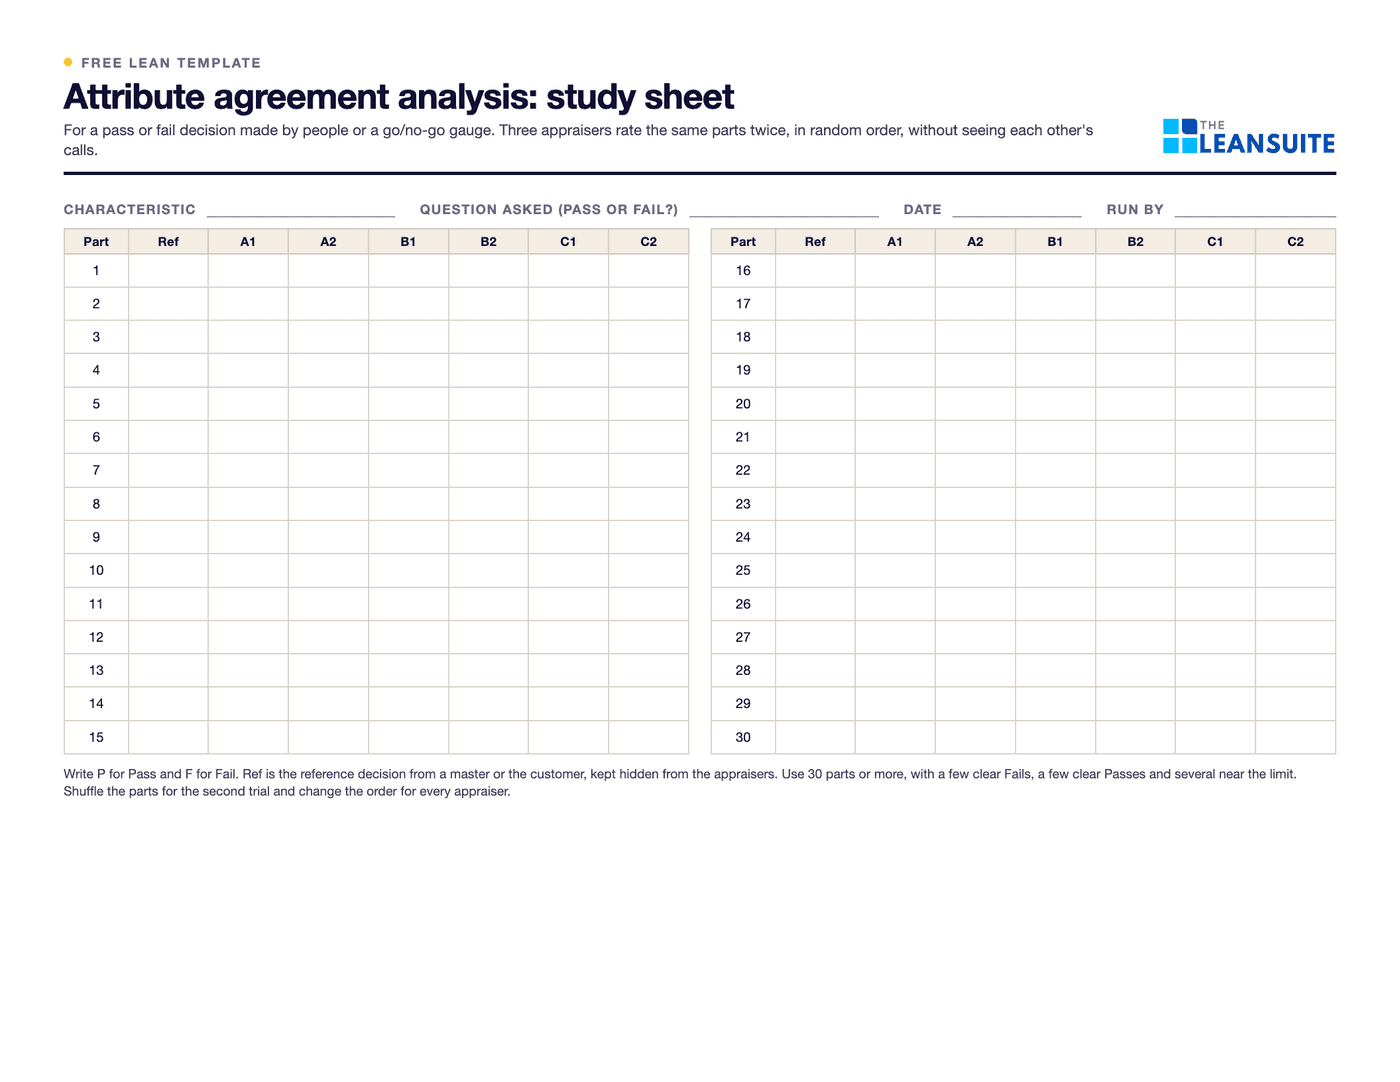 Two blocks of 15 parts each with a reference column and columns for appraisers A, B and C, trials 1 and 2, with fields for the characteristic and the question asked.
When to use it
When to use an attribute agreement analysis
- When quality is judged by eye or by a go/no-go gauge: surface defects, cosmetic grades, visual sorting, a fit check with a gauge.
- Before you trust a visual inspection station, and again after a change of people, lighting, standard or boundary samples.
- When two shifts disagree on what is a reject, and you need numbers to show where the disagreement is.
- As the attribute counterpart to a gage R&R study, which is for measurements that give a number.
- Not for a measurement with a numeric reading. Use a gage R&R study for that.
How to fill it in
- 1
Write the question the appraisers answer
One characteristic and one question with two answers: Pass or Fail. If the standard is not clear enough to write as a question, fix that before you run the study. - 2
Pick 30 parts or more and fix the reference
Include a few clear Fails, a few clear Passes and several near the limit. Have a master or the customer decide the reference for each part and keep it hidden from the appraisers. - 3
Run two trials with three appraisers
Each appraiser rates every part twice, in a different random order each time, without seeing anyone else's calls and without a memory of the first round. Record P or F in the Study sheet. - 4
Read the agreement within each appraiser
Count the parts where trial 1 and trial 2 are the same. Low agreement within one person means the standard is unclear to that person. - 5
Read each appraiser against the reference
The Excel file works out effectiveness, the miss rate (a Fail called Pass), the false alarm rate (a Pass called Fail) and kappa against the reference, then gives Acceptable, Marginal or Unacceptable. - 6
Act on the pattern, then run the study again
A high miss rate means defects get through: fix that first. A high false alarm rate means good parts are scrapped or re-sorted. Retrain, add boundary samples to the standard, and repeat.
The measures
What each measure tells you
Four numbers per appraiser. Read the miss rate first.
| Measure | The question it answers | Where the numbers come from | Watch for |
|---|---|---|---|
| Agreement within the appraiser | Does this person give the same call twice? | Parts where trial 1 equals trial 2, divided by the parts | Low values mean the standard is unclear to that person |
| Effectiveness | How often is the call right? | Correct decisions divided by all decisions (parts times 2) | High effectiveness can hide a high miss rate |
| Miss rate | How often does a defect get through? | Pass called on a part the reference says Fail, divided by all decisions on those parts | The costly one: it reaches the customer |
| False alarm rate | How often is a good part rejected? | Fail called on a part the reference says Pass, divided by all decisions on those parts | Scrap and re-sorting cost |
| Kappa against the reference | How much better than chance is the agreement? | (Observed agreement minus agreement expected by chance) divided by (1 minus agreement expected by chance) | Low kappa with high agreement happens when most parts are Pass |
Agreement within the appraiser
- The question it answers
- Does this person give the same call twice?
- Where the numbers come from
- Parts where trial 1 equals trial 2, divided by the parts
- Watch for
- Low values mean the standard is unclear to that person
Effectiveness
- The question it answers
- How often is the call right?
- Where the numbers come from
- Correct decisions divided by all decisions (parts times 2)
- Watch for
- High effectiveness can hide a high miss rate
Miss rate
- The question it answers
- How often does a defect get through?
- Where the numbers come from
- Pass called on a part the reference says Fail, divided by all decisions on those parts
- Watch for
- The costly one: it reaches the customer
False alarm rate
- The question it answers
- How often is a good part rejected?
- Where the numbers come from
- Fail called on a part the reference says Pass, divided by all decisions on those parts
- Watch for
- Scrap and re-sorting cost
Kappa against the reference
- The question it answers
- How much better than chance is the agreement?
- Where the numbers come from
- (Observed agreement minus agreement expected by chance) divided by (1 minus agreement expected by chance)
- Watch for
- Low kappa with high agreement happens when most parts are Pass
A filled-in example
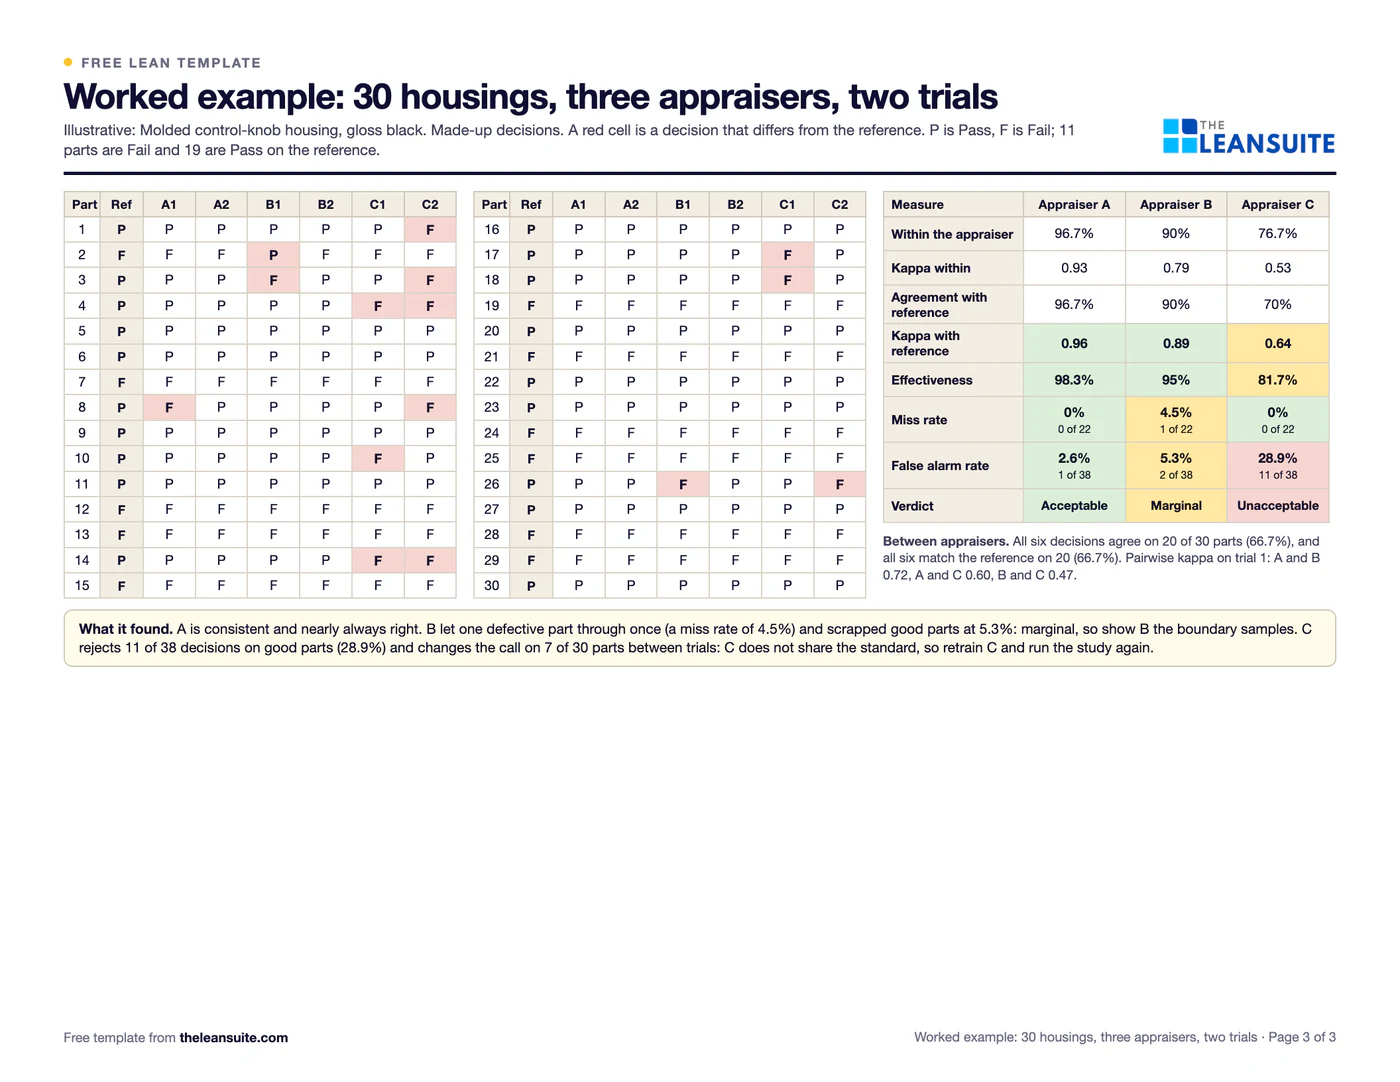
Illustrative, not a benchmarkAn example (illustrative): a made-up study of a molded control-knob housing in gloss black, rated Pass or Fail for surface blemishes by three appraisers, A, B and C, twice each, on 30 parts. All decisions are invented.
- The reference calls 11 parts Fail and 19 parts Pass. That is 22 decisions per appraiser on Fail parts and 38 on Pass parts.
- Appraiser A agrees with themselves on 29 of 30 parts (96.7%), has a kappa against the reference of 0.96, an effectiveness of 98.3%, a miss rate of 0% (0 of 22) and a false alarm rate of 2.6% (1 of 38). Verdict: Acceptable.
- Appraiser B agrees with themselves on 27 of 30 parts (90%), has a kappa of 0.89, an effectiveness of 95%, a miss rate of 4.5% (1 of 22) and a false alarm rate of 5.3% (2 of 38). Verdict: Marginal.
- Appraiser C agrees with themselves on 23 of 30 parts (76.7%), has a kappa of 0.64, an effectiveness of 81.7%, a miss rate of 0% and a false alarm rate of 28.9% (11 of 38). Verdict: Unacceptable.
- Across all three appraisers, all six decisions agree on 20 of 30 parts (66.7%) and all six match the reference on 20 (66.7%). Pairwise kappa on trial 1: A and B 0.72, A and C 0.60, B and C 0.47.
- The verdicts use the default limits: effectiveness at least 90% to be acceptable and under 80% unacceptable, miss rate at most 2% and over 5%, false alarm rate at most 5% and over 10%, and kappa at least 0.75 and under 0.40.
A can keep inspecting. B needs the boundary samples shown. C rejects good parts and changes the call between trials, so C does not share the standard: retrain C and run the study again.
Common mistakes
Letting appraisers see the reference or each other
If a person can see the reference or another person's call, the study measures the answer key, not the inspection.
Using only obvious parts
A sample of clear Passes and clear Fails gives near-perfect agreement and tells you nothing. Include parts near the limit, as many as the line really sees.
Running the trials back to back in the same order
Appraisers remember. Shuffle the parts between trials and between appraisers, and leave time between rounds.
Looking at agreement without the reference
Three appraisers can agree with each other and all be wrong. Read agreement together with the results against the reference.
Treating the limits as law
The 90, 80, 2, 5 and 10 percent limits are widely quoted guidelines. Your customer's requirements, or your own risk, may call for different limits. Change them in the sheet.
Download the template
Free to use: print it, copy it and edit it for your team. Enter your name and work email once to download.
Run this template in LeanSuite
In LeanSuite quality checks run as digital checklists with number limits, an out-of-spec answer can raise a tag or start a CAPA automatically, and KPI Builder tracks quality KPIs against targets.
See it in a 45-minute demoIn the lean glossary
Free tools
FAQ
Attribute agreement analysis template: common questions
Gage R&R is for a measurement that gives a number, and separates variation by the gauge, the appraiser and the part. Attribute agreement analysis is for a pass or fail call, and compares the calls within and between appraisers and against a reference.
This sheet is built for 30 parts, three appraisers and two trials, which is a common size. More parts give steadier numbers. Include parts near the limit, not only clear Passes and Fails.
Kappa compares the agreement you saw with the agreement you would expect by chance, so it is not fooled when most parts are Pass. Minitab credits the Automotive Industry Action Group's Measurement Systems Analysis manual, 4th edition, for treating a kappa of 0.75 or more as good agreement, and the sheet uses 0.75 and 0.40 as its defaults.
They are widely quoted guideline values for effectiveness, miss rate and false alarm rate, set as editable defaults. They are not a standard. If your customer or your own risk assessment sets other limits, type them in the sheet and the verdicts follow.
A master appraiser, a gauge with a known result or the customer, decided before the study and kept hidden from the appraisers. Without a reference you can measure agreement but not whether the calls are right.
More free templates
All templates- 8D report templateD0 to D8 with targets, containment counts, occurrence, escape and systemic causes, verified actions and a worked example.
- Poka-yoke worksheetEach step's errors and what they cost, the device (approach, function, method), payback, and a log that proves each device works.
- Layered process audit (LPA) checklist20 yes, no or N/A checks at the station, a layer and frequency matrix, question banks for four processes and a findings table.
- IATF 16949 internal audit checklist40 audit questions in three parts, one for each internal audit IATF 16949 names (system, manufacturing process, product), each with its clause, the evidence to look for, a core tool tag and a column for the customer's own requirement.
- Process audit checklistAudit one process from inputs to results: 32 questions graded conforms, minor or major, a product check, a score by group and a findings list.
- PFMEA template (process FMEA)Failure modes, effects and causes rated for severity, occurrence and detection, with RPN before and after action.
- Pareto chart templateA tally sheet, the Pareto by count and by cost with the cumulative line and the 80 percent threshold, and a before and after comparison. Excel sorts and draws it.
- Control plan templateWhat is checked at each step, against which limits, how, how often, and what to do when a result is out.
- Corrective action request (CAPA) formOne problem from containment to proof the fix worked, with occurrence and escape causes and a closure check that tells you when it can close.
- ISO 9001 management review kitA 90-minute agenda, data sheet, minutes and action log for the clause 9.3 review, with an Excel planner that flags the next review due.
- Non-conformance report (NCR) formA two-page NCR from the requirement against what was found to disposition and closure, and an Excel NCR log.
- CAPA log templateAn Excel CAPA tracker with status, days open, late flags and counts by source, plus a printable log and monthly review.
- Supplier corrective action request (SCAR) formA SCAR from the problem and containment asked for to the supplier's 8D-style response, verification and closure, with a filled-in example.
- First article inspection report template (AS9102 forms)The three forms in the AS9102 layout (part number, product and characteristic accountability), 22 review checks, the full and partial FAI triggers, and a worked example with one failed characteristic.
- FOD walk checklist (foreign object debris)26 checks for a FOD walk on the production floor in six groups, a FOD found log, an area plan with the route and frequency, and a worked six-week trend of finds per walk.
- Welder continuity log templateA continuity log for welder qualifications with the next lapse date worked out for each process, 20 checks on the records and the log, and a worked example with three welders and one lapse.
- Weld inspection checklist (visual welding inspection)30 checks before, during and after welding, a guide to the discontinuities visual inspection looks for, a weld map report and a worked example on a 12-weld frame.
- AS9100 internal audit checklist42 audit questions on AS9100D clauses 4 to 10 with the aerospace additions, the evidence to look for and a sample for each area, five grades, a finding and corrective action report, and a worked audit carried through to closure.
- Engineering change request (ECR) formAn ECR form with the change, what it touches, risk and approvals, and an Excel log that tracks each change to done.
- Design FMEA (DFMEA) templateA design FMEA worksheet with S, O, D and RPN before and after action, a class column and a design rating guide.
- Process flow diagram templateA squared sheet to draw the flow with a symbol key, and a step table that counts operations, moves, checks, waits and storage.
- PPAP checklistThe 18 PPAP elements with owner, due date and status, the five submission levels and a readiness count.
- Process capability (Cpk) study sheet25 subgroups of readings with Cp, Cpk, Pp and Ppk worked out, control limits to check stability, and a histogram.
- Incoming inspection checklistReceiving inspection checks from paperwork to sample, the sampling plan, the decision, and an Excel log by supplier.
- Supplier audit checklistA supplier process audit of 32 questions scored 0 to 3, with section scores, a rating and the findings.
- Supplier scorecardMonthly PPM, on-time delivery and SCAR measures turned into points, a weighted score and a rating per supplier.
- Pre-shipment inspection checklistThe last check before shipping: part, quantity, labels, packaging, paperwork and photos, then release.
- Defect check sheetTally defects by type and day, with units inspected, defect rates, a location sheet and the week's Pareto.
- QA matrix templateDefect modes against stations in flow order: where each is made and first caught, a weight × occurrence × detection score, an AA to C class and the escapes flagged.
- Is / is not analysis templateWhat, where, when and extent with is, is not, distinctions and changes, then each possible cause tested against every pair and ranked.
- 4M change management sheet (change point)A shift log of every change to Man, Machine, Material, Method or Design, the extra checks after it and when normal checks resume, with a change point board.
- Histogram templateReadings, bins set by the square root rule, a tally and counts, the spec limits drawn and the share out of spec, with the common shapes explained.
- Scatter diagram templateUp to 50 pairs with a group code, r and R², the least squares line, the quadrant count and r for each group.
- Gauge calibration logA gauge register with next due dates and status, a calibration record with as-found and as-left readings, and the steps when a gauge fails.
- Quality alert formA quality alert to post at the line, a sign-off sheet for every shift, and a log of open, expired and closed alerts.
- TQM self-assessment templateThe eight TQM principles in 24 statements you can check on the floor, scored 0 to 4 by several people, with the spread, the top 3 gaps and an action plan.
- Paper forms inventory (paperless manufacturing worksheet)Every paper form, checklist and log in one list: hours a month, who acts on it, how long the paper waits, and which forms to move first.
- Quality circle meeting recordA circle's charter, a one-page record for each meeting and a problem register that follows every problem from selected to closed or escalated.
- People, process, technology (PPT) assessmentCheck one change before go-live: 18 people, process and technology statements scored 1 to 4 by the people who will use it, the lowest element and the actions.
- Jidoka worksheet (stop at abnormality)For one line or cell, every abnormality that should stop the work: how it is detected, how the work stops, who is called, the immediate fix and the root cause step, plus a log of real stops.
- X-bar and R control chart template25 subgroups with means and ranges, control limits from A2, D3 and D4, signal flags, both charts and a reaction log.
- Gage R&R study sheet10 parts, 2 or 3 appraisers, 2 or 3 trials: EV, AV, GRR, PV, %GRR and ndc by the average and range method.
- Root cause analysis templateOne report from problem statement to proof: containment, evidence, analysis, verified causes, actions and the effectiveness check.
- Quality control pillar 90-day model area planThirteen weeks from the QA matrix to the QM matrix on one model area, a KPI board, the day-90 gate and expansion waves.
- Early equipment management 90-day model area planThirteen weeks from lessons on current machines to a tracked start-up on one model equipment project, a KPI board, the day-90 gate and expansion waves.
- Digital manufacturing readiness assessmentScore 24 statements on process, technology and people from 0 to 4, check the balance between them and rank the gaps by what matters in your plant.
- RCM worksheet (failure mode and task selection)Failure modes classed as hidden, safety, operational or non-operational, then a task chosen for each: condition-based, discard, failure-finding, redesign or run to failure.
- Error-proofing verification log (daily master-sample check)Each poka-yoke device proved every day or week with a known-bad sample, with missed checks counted and the hours and parts at risk worked out when one fails.
- Defect catalogue template with boundary samplesEvery defect with a definition, a class and the reason for it, measured accept and reject limits by zone, boundary samples, a defect log with DPU and Pareto, and an inspector agreement check.
- I-MR chart template (individuals and moving range)Up to 100 single readings with moving ranges, limits from a baseline, five run-rule flags, both charts, a second phase and a reaction log.
- Attribute control chart template (p, np, c and u charts)p, np, c and u charts in one workbook: a chart selector, a sample size check, limits for each subgroup, signal flags and four worked examples.
- HACCP plan template: hazard analysis and CCP worksheetThe Codex 12 steps in one workbook: team and product, process steps checked on site, hazard analysis with the CCP decision tree, the CCP table with completeness checks, an allergen matrix and a verification schedule.
- Mock recall template: traceability exercise worksheetTrace a finished lot back to every input lot and forward to every first customer, reconcile the quantities against a tolerance and time it against your target.
- ISO 9001 internal audit checklist (production area)46 audit questions for the production floor in 11 processes, each with its ISO 9001:2015 clause, what evidence to look for and the sample to take, plus five defined grades, a findings log, a finding report and a summary by clause.
- Food plant GMP inspection checklist (21 CFR 117 subpart B)55 checks in the order of 21 CFR 117 subpart B, each citing its paragraph and saying what to look at, with a grade, finding, owner and due date; results by section and grade, a walk route and a bakery example.
- Master sanitation schedule with pre-op verificationA master list of cleaning tasks by area and equipment with frequency, chemical, lockout, who and next due date, a weekly on-time count, and the pre-operational verification log with a release step.
- Measurement uncertainty budget templateA GUM uncertainty budget: Type A and B rows, divisors by distribution, sensitivity coefficients, uc, νeff, k from the t-table, U, TUR and a guard band check.
- Video time study filming checklistA pre-shoot checklist and shot log for filming a time study on video: camera, light, people, settings, power and review.
- Pugh matrix templateCompare up to 8 concepts with a datum as better, same or worse on up to 12 criteria, flag must-haves, and carry the strongest into a second round.
- Defect detection matrix templateMap where each defect is created and where it is found, score the gap and move the check closer to the cause.
- Life cycle cost analysis templateCompare up to three machines over ten years: price, energy, upkeep, failures and down time, discounted to present value.
- Equipment design review checklistGate reviews for a new machine before order, before build and before start-up, with a safety buy-off and a problems journal.
- Preliminary hazard analysis (PHA) worksheetFind and score the hazards of a new line, machine or process before design is fixed, then choose controls and re-score.
- APQP checklistThe five APQP phases as a checklist: deliverables, owners, due dates, gate reviews and an issues list.
- Out-of-control action plan (OCAP) templateA reaction plan for a control chart: the steps, what each signal means, who to call and a log of events.
- Quality inspection checklistAn in-process and final inspection record: measured characteristics, visual checks, a decision and first pass yield.
- AQL sampling plan templatePick a sample size, read accept and reject numbers, record the defects and decide on the lot.
- MSA study workbookBias, linearity and stability study sheets for a gauge, with the arithmetic done and a guide to which study when.
- Incoming quality control stage sheetA register that shows how much control each purchased part has and plans the move from your dock to the supplier's process.
- Internal audit schedule templateA year of internal audits planned by risk: the programme, the register, the auditors and the findings.
- Approved supplier list templateThe list of suppliers you may buy from, with the evidence behind each, certificate expiry alerts and re-evaluation dates.
- Pest control inspection checklistA pest control walk-round for a food plant, with a log of traps and stations and action levels for each type of device.
- Cleanroom audit checklist33 cleanroom checks split by how often they run (each shift, weekly, per plan, system), a gowning order to watch against, a differential pressure log and a findings log, with a worked week of readings.
- GMP audit checklist for drug manufacturing42 self-inspection checks ordered by the subparts of 21 CFR 211, each with its section, the matching EU GMP chapter and whether it is seen on the floor or in records, graded critical, major or minor, with a worked audit of a packaging line.
- Line clearance checklist28 line clearance checks in six sections (area, equipment, materials, printed materials, documents, coder and vision settings), cleared by the operator and verified by a second person, with a printed-materials reconciliation and a worked example that does not balance.
- ISO 13485 internal audit checklist38 questions on ISO 13485 clauses 4 to 8, each with the FDA QMSR section that brings it in or adds to it, a production floor tab (records, current instructions, training, nonconforming product, CAPA) and a worked audit of a catheter line.
- ISO 22716 GMP audit checklist for cosmetics25 cosmetic GMP checks following the sections of ISO 22716, split into a floor walk (people, premises, equipment, materials, production) and system checks (lab, out of specification, deviations, complaints, change control, audits, documents), with a worked audit of a filling line.
- SSOP template: sanitation standard operating procedureOne sanitation SOP sheet per area or machine (steps, chemical, contact time, PPE, lockout, owner), a 23-check pre-op inspection and a verification log for visual, ATP and micro checks.
- SQF internal audit checklist for food manufacturing54 questions in the two parts of the SQF manufacturing code (system elements and GMP), each group mapped to BRCGS and FSSC 22000, graded Conforms to Critical, with findings, a score and a yearly plan.
- Injection molding defects chart16 molding defects with causes by machine, material, mold and method, first checks, and an Excel defect log with a Pareto.
- ESD audit checklist29 checks for an ESD protected area, with daily tests split from periodic verification, a measurement log and a worked audit.
- Management of change formA change request and review form for a plant: what changes, the hazard review, approvals, pre-startup review, training and close-out.
- Goods received note templateA one-page goods received note and an Excel register with accepted to date, still to come and an invoice check for each PO line.
- Part submission warrant (PSW) templateA PSW working form plus twelve checks before anyone signs, and an Excel that works out whether the warrant is ready.
- Ballooned drawing and dimensional results templateA ballooning guide and a results sheet for six parts per characteristic, with OK, NEAR LIMIT or NOT OK worked out for each row.
- DVP&R template (design verification plan and report)A design verification plan and report on one sheet: tests, criteria, owners and dates, with status worked out as of a date.
- Special characteristics matrix templateOne row per special characteristic, followed from drawing to PFMEA, control plan, gauge study and capability, with the first gap named.
- 5S audit checklist template25 checks, five per S, scored 1 to 5, with a score summary and a chart of the five S's.
- 1-1-90 method worksheetOne page: score areas 1 to 5, write the pain point with a before and target number, check days 30, 60 and 90, and plan the next three areas.
- Gemba walk checklistA walk plan and route, 30 prompts in six groups and a findings table with owners and due dates.
- Gemba walk field guideA 20-page pocket guide: the rules, 48 questions by area with good and warning answers, a 30-day route and the follow-through loop, plus an action-log workbook.
- Leader standard work templateA team leader's daily, weekly and monthly routine with a box per day, follow-ups and a weekly review.
- Supervisor leader standard work templateA supervisor's daily, weekly and monthly routine with a box per day, an escalation log and a weekly review.
- Production manager leader standard work templateA production or value stream manager's routine by day, week and month, with an escalation log and a weekly review.
- Plant manager leader standard work templateA plant manager's short routine by day, week and month, with an escalation log and a weekly review.
- Autonomous maintenance (CILR) checklist20 clean, inspect, lubricate and retighten checks with a box per day, an abnormality log and sign-off.
- A3 problem solving templateThe standard seven-box A3 from background to follow-up, with a filled-in worked example. PDF and Excel.
- PDCA templateOne improvement cycle on one page: plan, do, check against the goal, then standardize or adjust. PDF and Excel.
- 5 Whys templateA problem statement, a why chain that can branch, evidence for every answer, root causes and countermeasures that are checked.
- 5W1H templateWho, what, when, where, why and how: a problem statement built from checked facts, and an action plan with nothing left open.
- Skills matrix templatePeople by tasks on a 0 to 4 scale, coverage and gaps per task and shift, and a training plan that closes them.
- Standard work sheet templateTakt time, each element's manual, machine and walk time on a time chart, key points and standard WIP.
- One point lesson (OPL) templateOne topic on one page: wrong way and right way pictures, checkable key points, the standard it belongs to and a sign-off record.
- SMED changeover worksheetChangeover steps with times, internal or external, what can move, ideas and before/after totals.
- Kaizen event charter templateProblem, goal, scope in and out, boundaries, metrics from baseline to target, team and roles, and sign-off before day one.
- RACI matrix template17 kaizen project tasks by 10 roles, with R, A, C, I drop-downs and a check for one accountable per task.
- 5S red tag log and red tagsA log of every red-tagged item with its decision, and six printable red tags to cut out.
- Shift handover templateSafety, production against plan, holds, downtime events, materials and people, and the open actions the next shift takes over.
- Shift schedule packTen shift patterns defined exactly, each with a 28-day calendar, hours worked out from the cycle and a US 40-hour check, plus an Excel roster.
- Kanban card templateSix production and six withdrawal kanban cards to print and cut out, with loop sizing and a card register.
- Idea suggestion formA one-page idea form with the supervisor's answer and points, and an idea log that tracks days to answer.
- Just Do It (JDI) card templateSix Just Do It cards per sheet for quick fixes, with the rules for what counts and a log of every card.
- Quick kaizen templateOne page for a small improvement: before and after, the cause, the countermeasure, the results and whether the standard changed.
- Time study sheetTime each element over 10 cycles and work out the average, lowest repeatable and standard time. Excel does the sums.
- Spaghetti diagram templateSquared paper to trace every trip, a trip log that turns grid squares into feet, meters and walking time, and a before and after comparison.
- OEE tracking sheetOne row per shift for a week. The Excel version works out availability, performance, quality and OEE and charts the week.
- OSHA 300 log workbookA log laid out like OSHA Form 300, a 300A that totals itself, TRIR and DART rates, and an is-it-recordable walk traced to 29 CFR 1904.
- Near miss report formA two-page near miss report from the first report to closure, and an Excel log with status and days open.
- Safety observation card templateFour behavior-based safety cards per sheet, with safe and at-risk checks, the conversation and a tally sheet.
- Job safety analysis (JSA) templateJob steps, hazards, risk scored before and after the controls, the hierarchy of controls, PPE and sign-off.
- Risk assessment matrix template (5×5)A color-coded 5 × 5 severity and likelihood matrix, a scoring guide and a risk register.
- Incident investigation report templateFacts and a sourced timeline, causes at three levels, actions by the hierarchy of controls, a US recordkeeping screen and a closure check.
- Incident report templateThe first report, filled in the same shift: what happened, people, injury or damage, treatment, a US recordkeeping screen, actions and an Excel incident log.
- Toolbox talk templateA record of a short safety talk: topic, key points, questions raised, actions and an attendee sign-in sheet.
- Lockout/tagout (LOTO) procedure templateA machine-specific LOTO procedure: energy sources and isolation points, the steps from shutdown to restart, and the annual review.
- Forklift inspection checklist23 pre-shift checks for a week on one page, a do-not-operate rule, and a defect and repair log.
- Preventive maintenance checklist templateA PM checklist per machine with readings and sign-off, and a PM schedule that works out the next due date.
- Equipment downtime log (MTTR and MTBF)A breakdown and downtime log, with MTTR, MTBF and downtime by machine and cause worked out in Excel.
- Environmental aspects and impacts registerAn ISO 14001-style register of aspects and impacts, with significance scoring, legal requirements, controls and owners.
- Manufacturing process instruction (MPI) templateOperation steps with parameters, tools, quality checks, safety and a photo each, plus revision history and approval.
- Engineering process instruction (EPI) templateScope, parameters and limits, equipment and materials, validation steps, acceptance criteria, change history and approvals.
- Training sign-off sheetAn attendance and sign-off record where each person signs they understood, with a competence check and an Excel log.
- Learning curve and ramp-up workbookBoth learning curve models side by side, a fit from your own observed hours, batch hours, the unit that reaches standard and a weekly ramp plan.
- Operator staffing calculatorTakt, work content, the operators a line needs, a check of your station plan and the roster with absence cover, from your own demand and element times.
- On-the-job training (OJT) checklistThe training record for one trainee on one job: the four TWI steps signed, every try judged, qualified when your rule is met, then tapering follow-up checks.
- New hire onboarding checklist (manufacturing)29 onboarding items from before day 1 to the 90-day review, with owners, dates and review notes.
- Competency assessment formThe one-person assessment behind a skills matrix rating: each task rated 0 to 4 from evidence, checked, with a training plan for every gap.
- Cross-training plan templateWho is learning which task, from and to which level, by when, and how many are qualified on each task.
- Absenteeism tracker templateA monthly attendance grid with codes, absence rate by person and team, and an optional Bradford factor.
- Office 5S audit checklist25 checks written for offices and shared areas, five per S, scored 1 to 5, with a score summary and actions.
- Floor marking color guideA floor marking color standard with swatches, marks and line widths to fill in, and a floor marking check with a layout sketch.
- Shadow board plannerTool inventory with fetch time, a layout planned from each tool's outline size, a month of daily checks with 5S audit evidence, and a missing tool log.
- Lubrication schedule templateEvery lube point with lubricant, method, amount, frequency and who, with next due dates and a monthly sign-off record.
- TPM tag logEvery abnormality tag with type, who fixes it, priority and dates, with days open and counts by type and week.
- Autonomous maintenance step auditCriteria for each of the seven autonomous maintenance steps, scored 0 to 2, with the step result and the decision to move on.
- Inventory cycle count sheetA blind count sheet with variance and tolerance, an ABC count schedule and record accuracy, worked out in Excel.
- Hour-by-hour production boardHourly plan against actual with running totals and the reason for each miss, plus a shift summary by reason.
- Cost savings trackerA savings log with hard and soft savings, payback and Finance's sign-off, plus a glide path against the year's target.
- CapEx request formA capital request with options, costs, benefits, payback and NPV, and the approval levels the amount needs.
- Standard cost variance workbookEight standard cost variances from your standards and actuals, favorable or unfavorable, proved against actual cost, with the questions to ask on the floor.
- Cost-benefit analysis templateUp to three options side by side with costs, hard and soft benefits, payback, NPV and the benefit-cost ratio.
- Cost of poor quality (COPQ) worksheetCost of quality by prevention, appraisal, internal and external failure, with COPQ as a share of sales.
- Receiving logA dock receiving log with quantities, damage, QC holds and putaway, plus a discrepancy report and dock-to-stock time.
- Warehouse safety inspection checklistThirty warehouse safety checks from aisles to fire exits, marked OK or Not OK, with an action for every finding.
- Pallet racking inspection checklistRack checks per aisle with a green, amber and red damage rating, and a damage log with repair dates.
- Material shortage logEvery part short with its need date, line impact, ETA and escalation, and counts by reason and supplier.
- Safety audit checklistThirty-four plant-wide safety checks answered Yes, No or N/A, scored by area, with a risk rating and an action for every No.
- Ergonomic risk assessment checklistScreen a task for 21 ergonomic risk factors, score how long each lasts, and rank tasks so the worst get controls first.
- Work order template for maintenanceA work order template for maintenance: one form per job from request to handback, and a log of response, completion and backlog by priority.
- Six big losses worksheetWhere a machine's planned time goes: the six big losses in minutes, ranked, with A, P, Q and OEE worked out.
- Andon response logEvery andon call with response and fix times, flags against your targets, and counts by type and station.
- Changeover checklist25 checks for every changeover, a record of planned and actual times, and a log of changeover time against target.
- Kanban sizing calculatorHow many kanban cards each loop needs, per part, with the change from today's cards and what the loop holds in days.
- Kaizen event trackerEvery kaizen event on one sheet: status, roles, the metric against target, open actions and the 30, 60 and 90 day checks.
- Standard work audit checklist24 checks of a job against its written standard, ten timed cycles, and each gap sorted by cause before anyone acts.
- TWI job breakdown sheetThe TWI Job Instruction breakdown of a job into important steps, key points and reasons, with a worked example and the four steps.
- Standard work combination tableOne operator's manual, machine, walk and wait time on a time chart against takt, with machine cycles and a process capacity sheet.
- Lead time worksheetProduction lead time from the inventory waiting at each step, value-added time and process cycle efficiency, plus an order traced from order to delivery.
- Waste walk checklist (TIMWOODS)32 things to look for across the eight wastes, with where and how much, and a findings log with dot votes, owners and dates.
- Maintenance KPI trackerMTBF, MTTR, availability and PM compliance per asset and month, plant figures from the totals, planned maintenance % and backlog in weeks.
- Daily huddle agendaA 15-minute start-of-shift stand-up in six timed blocks, with yesterday's SQCDP results, today's plan, actions and escalations.
- DMAIC project charter templateThe Define-phase charter on one page: problem and goal, metrics, scope, team and phase dates, with savings and a tollgate checklist.
- Water spider route plan (mizusumashi)A water spider's fixed route: stops with arrival times, what is delivered and collected, route time against the cycle, cart load and a trip log.
- Cost deployment matrixWCM cost deployment on paper and in Excel: loss quantities by process, causal and resultant losses, the cost of each loss, a Pareto and the projects that recover them.
- Equipment criticality analysisAssets scored 1 to 5 on six criteria with your own weights, ranked and sorted into classes A, B and C with a safety override and a suggested maintenance strategy.
- Bottleneck analysis worksheetEffective capacity per station from cycle time, parallel units, availability and yield, the bottleneck, takt and utilization, a queue cross-check and the five focusing steps.
- Fault tree analysis templateA drawing area with the FTA symbols, an event table with probabilities and minimal cut sets, and the gates worked out bottom-up in Excel.
- 5G investigation sheetConfirm the facts before naming a cause: 5W1H, the five G's with 20 prompts, the gap against the principle and the standard, and the countermeasures.
- Yokoten tracker (horizontal deployment)Copy a proven improvement line by line: the source result, each candidate's own before and after, its share of the source's improvement and the standard updated.
- Coaching kata template (improvement kata storyboard)The learner's storyboard (target condition, current condition, obstacles, PDCA cycles) and a fold-over card with the coach's five questions.
- SMART goals templateWrite a goal, test it against the five SMART letters, then track progress toward the target against the time used.
- Lean readiness assessment templateTwenty statements in four factors, scored 1 to 5 by several people on their own, with averages, the spread between them and the actions.
- Nemawashi template (stakeholder plan)Plan the one-to-one conversations before a decision: who to talk to in what order, their concerns, what changed and where they stand.
- Breakdown analysis reportOne equipment breakdown from the stop to the 90-day check, plus a breakdown log with repeat flags, MTBF and MTTR by asset and a Pareto of causes.
- Heijunka box planner (production leveling)Weekly demand turned into containers a day, takt, pitch and slots, a leveled sequence of products and the heijunka box, with a check that the changeovers fit.
- Future state value stream map worksheetThe eight future-state questions worked through in order: takt, pitch, flow, supermarkets, the pacemaker and the mix, with an EPEI check and current against future lead time.
- Value stream plan (VSM action plan)The future-state map cut into loops, each with an objective and a measurable goal, and its kaizen bursts turned into owned, dated projects on a 12-month timeline.
- Kaizen project plan (Gantt chart)One improvement project as a Gantt chart: tasks by phase with owners, predecessors and working days, a 16-week grid, milestones and a status from planned against actual % done.
- Escalation matrix templateWho is called for each type of issue and after how long, with severity rules, contacts and an escalation log.
- Visual management audit checklist29 checks of whether anyone can tell normal from abnormal at a glance, scored by group, with a trend and actions.
- Employee recognition program templateDesign a recognition program on one page, then run it: points per action, prizes, budget, a points ledger, a monthly leaderboard and a fairness check by team and shift.
- Lean transformation roadmapA plant-wide lean program on one sheet: six phases with exit criteria, six workstreams by quarter over 24 months, the model line, metrics with baseline and target, cadence and risks.
- Obeya room plannerPlan the walls, owners, cadence, agenda and rules of an obeya, then run the weekly review of KPIs, problems, actions and milestones.
- Continuous improvement software evaluation scorecardCompare CI software vendors: a must-have gate, eight weighted criteria scored 1 to 5, points out of 100 and a rank, with a demo script and reference questions.
- Lean principles assessment templateThe five lean principles as 25 things you can see on one value stream, answered yes, partly or no on a walk, with a score per principle, the next step and a trend over walks.
- Employee engagement survey templateA short anonymous pulse survey for shop floor staff: 14 statements in six drivers, two open questions, results by driver and team, and the actions.
- Hansei reflection sheet (lessons learned)A written look back at one finished project, event or launch: goals against results in numbers, causes rather than blame, lessons to keep or change, and where else they apply.
- Safety cross calendarA month drawn as the green cross, colored each day by the most serious safety event, with totals and days since the last injury.
- Daily kaizen routine boardA team's 10 to 15 minute daily routine at the board: one problem from each person, small fixes with one owner, counted every week.
- Weekly maintenance schedule templateNext week's maintenance jobs, scheduled only when ready, loaded against each craft's hours by day, with schedule compliance and break-ins at week end.
- Operational excellence assessment templateThe ten principles of operational excellence as 30 behaviors and practices you can see, scored 1 to 5 by several people, with the spread, the three lowest principles and an action plan.
- Scrum meeting agenda templateTimed agendas for the five scrum meetings, a sprint planning sheet, a retrospective sheet, and an Excel sprint backlog with a burndown.
- Toyota Production System (TPS) house templateThe TPS house for one plant or value stream: roof, two pillars and foundation, with what you do today, the evidence, a status and the next step for each element.
- EPEI and batch size calculatorHow often each part can come round on a shared machine (EPEI) and how big each batch must be, from demand, cycle times and changeovers, now and after SMED.
- Process capacity sheet templateEach machine in a part's routing with manual, auto and tool change time, its capacity per shift, and the step that limits the cell against demand.
- Team charter templateA one-page charter for a standing team: purpose, scope, roles, the KPIs it owns, which decisions it makes itself, norms and cadence.
- Chaku-chaku line plannerPlan a load-load cell: time each machine, load and walk, check that every machine is ready when the operator comes back, compare the cell cycle with takt and size the crew.
- Standard operating procedure (SOP) templateA full SOP in the hierarchical step format, from purpose and scope to the steps, records, revision history and approvals, with review checks and an SOP register.
- Process improvement method selectorEight questions about one problem, an example rule that suggests a method and a matrix of nine methods: when each fits, the usual team and time, and the template to start with.
- Safety pillar 90-day model area planThirteen weeks from the incident pyramid to safety standards on one model area, a KPI board, the day-90 gate and expansion waves.
- Autonomous maintenance 90-day model area planAM steps 0 to 3 on one model machine in 13 weeks, a KPI board, the day-90 gate and expansion waves for months 4 to 12.
- Professional maintenance (PM) 90-day model area planThirteen weeks from breakdown analysis to a running PM calendar on one model machine, a KPI board, the day-90 gate and expansion waves.
- Environment and energy pillar 90-day model area planThirteen weeks from waste and energy maps to area standards on one model area, a KPI board, the day-90 gate and expansion waves.
- Focused improvement 90-day model area planThirteen weeks from the loss Pareto to standardized fixes on one model line, a KPI board, the day-90 gate and expansion waves.
- Logistics and customer service pillar 90-day model area planThirteen weeks from the current-state map to pull on one model value stream, a KPI board, the day-90 gate and expansion waves.
- People development pillar 90-day model area planThirteen weeks from the skills matrix to trained cover on critical tasks in one model area, a KPI board, the day-90 gate and expansion waves.
- Cost deployment pillar 90-day model area planThirteen weeks from the loss map to costed, ranked projects in one model area, a KPI board, the day-90 gate and expansion waves.
- Moving from Excel to one system checklistA 34-point checklist and a file inventory for moving trackers from spreadsheets to one system: keep, move, connect or retire, clean, pilot, run both, retire.
- Prioritization matrix templateScore up to 20 improvement ideas on weighted criteria, rank them, test the ranking with equal weights and place each one on an effort and benefit grid.
- Cost per unit worksheet (manufacturing cost per good unit)One product's cost per good unit by materials, labor, machine and overhead, the gap to target, and which cost lever is worth most a year.
- Manufacturing KPI dashboard templateWeekly plant numbers in, 14 KPIs out: OEE and its parts, first pass yield, scrap, on-time delivery, recordable rate, cost and absence, each against a target.
- Training matrix template with expiry datesPeople by required trainings with expiry dates, OK, due, expired and missing flags, compliance by person and area, cover per training and a renewal list.
- Downtime reason codes template26 starter codes mapped to the six big losses, a log with drop-downs, a Pareto by code and by loss, and a code card for the line.
- Kaizen event preparation checklistEverything that has to be ready before a kaizen event and done after it: 44 items with owners and due dates from 6 weeks before day 1 to 30 days after, five go or no-go gates and a day-by-day agenda.
- Critical spare parts list and stocking levelsAssets ranked by consequence, each part classed and given a stocking policy, and min and max worked out from usage and lead time, with the downtime each stock-out would cost.
- Tier 2 meeting agenda and escalation sheetA 15-minute tier 2 agenda in ten timed blocks, fixed roles and rules, escalation triggers with time limits, and a log that ages every escalation and sends the answer back down.
- Forklift operator training and evaluation recordPer-operator training and evaluation record, a register with three-year due dates and refresher triggers, and a weighted practical evaluation scoresheet.
- REBA worksheet (Rapid Entire Body Assessment)Score up to six postures with REBA: body-part drop-downs, Tables A, B and C as lookups, final score and action level, and a before and after comparison.
- ISO 45001 internal audit checklist44 audit questions for the plant floor in 16 safety topics, each with its ISO 45001:2018 clause, the evidence to look for and the sample to take, plus 12 worker interview prompts, a findings log and a summary by clause.
- Plan for every part (PFEP) templateOne row per part: supplier, pack, container, usage, lead time and locations, with ABC classes, market and line kanban counts and a lineside space check.
- Changeover matrix templateA from-to matrix of changeover minutes with the clean each transition needs (allergen, colour, format), and a weekly planner that totals the order and suggests a shorter one.
- Overhead crane inspection checklist: frequent and periodic34 crane checks tied to OSHA 1910.179: an operator's pre-shift card, frequent and periodic inspections with signed records, a deficiency and tag-out log, and a register of next due dates.
- Maintenance job plan templateOne job planned on one sheet: steps and craft hours, parts checked against stock, tools, lockout and permits, documents, a ready check for the schedule, and technician feedback.
- Reorder point and safety stock sheet (many parts)Safety stock, reorder point, order quantity and an order list for up to 500 parts, worked out from each part's own demand and lead time history.
- OSHA compliance calendar (general industry)37 recurring federal OSHA duties with the paragraph, interval, owner, next due date and an overdue flag, plus a 12-month view and counts by owner.
- TRIR and DART rate trackerMonthly hours, OSHA 300 case counts and near misses in; rolling 12-month TRIR and DART rate, a case budget against your target and a trend chart out.
- Energy use and EnPI trackerMonthly electricity, gas and fuel in one unit, a 12-month regression baseline, expected against actual energy for each month, an EnPI ratio, the running saving and the tests that say whether the model can be trusted.
- FIFO lane sizing sheetThe maximum for a FIFO lane from the stop it must cover, in whole containers, with length, refill and wait checks for up to eight lanes.
- Machine guarding inspection sheetA machine register with due dates and a status per machine, 21 checks tied to OSHA 1910.212, .219 and .147, a guard opening check against Table O-10, and an action log.
- Condition monitoring route sheetA route of measuring points with baselines, alert and alarm limits, a check interval from the P-F interval, readings with rising and overdue flags, and an exceptions list worst first.
- Fire extinguisher inspection checklist and logThe 8 monthly checks for each portable extinguisher, plus a log with the hydro test interval from OSHA Table L-1, annual and 6-year due dates and open issues.
- Quad chart templateA project on one page in four boxes: idea and owner, problem, approach, and cost, schedule and result.
- Toolbox talk topics (52 weekly topics)52 weekly toolbox talk topics, each with a one-line key message and a discussion question, and a tracker for the year.
- Loss tree worksheetBreak one big loss number into area, line, machine, loss type and cause, and stop at the cause a team can fix.
- Equipment register templateOne row per asset, with hierarchy, criticality, PM strategy and owner, and a check that flags what is missing.
- Machine history record templateOne record per machine: components and their life, every breakdown and repair with cost, MTBF and MTTR, and a repair-or-extend check.
- Compressed air leak survey logWalk sheet, printable leak tags and a tracker that puts an annual cost on every leak and follows it to a verified fix.
- Project savings validation checklistThe gate between a project's claim and a reported saving: 20 checks, a claims register and a six-month sustainment check.
- Emergency action plan templateA written emergency plan for a plant: site facts, roles and backups, warden coverage, scenario steps and a drill record.
- Risk register templateOne scored list of operational risks with owners, actions and dates, a heat map and a review log.
- Hot work permit templateA hot work permit with a precautions checklist, fire watch record and close-out, plus an Excel permit log.
- Confined space entry permit templateA confined space entry permit with checks, an air test log, an entry log and cancellation, plus an Excel register.
- Energy loss matrix templateSeven types of energy loss by six energy sources with a cost in each cell, an action plan and an idle-period shutdown checklist.
- Management safety tour formA leader's scheduled safety walk: observation form, operator interview, tally, actions, rota and a tour log with a dashboard.
- Hazard prediction worksheetA pre-task worksheet: score what could go wrong at each step of a job, add a countermeasure and score again.
- Chemical inventory and SDS register templateA register of every chemical on site with its hazard class, safety data sheet and label, and a check that incompatible products are kept apart.
- Safety committee meeting minutes templateMinutes for a safety committee: attendance, nine agenda items, an action log that carries open actions forward, and monthly numbers.
- Environmental compliance audit checklistAn internal environmental audit: 37 questions with what to look for, a findings log with classes and a score by section.
- Vehicle inspection checklist53 checks for a truck, tractor or trailer, each tied to the federal rule it comes from, with a defect log.
- Pre-trip inspection checklistA driver's 42-check walk-round in order, with the driver vehicle inspection report for the end of the day.
- Silica exposure control plan templateA written silica plan for general industry: tasks, controls and housekeeping, plus monitoring, medical surveillance, training and a 31-check plan audit.
- OKR template for manufacturingObjectives with three or four key results each, scored 0 to 1.0 from baseline and target every month, cascaded to facility, department and person with an Other bucket for work that serves no objective.
- Goal cascade and alignment templateA one-page cascade tree from company to person with the catchball reply on every card, and an initiatives list that shows how much work serves a goal and how much sits in Other.
- Monthly business review template (operations review agenda)A 90-minute operations review in nine timed blocks: who speaks when, the KPIs each block reviews with red or green, a prep checklist for every presenter and a log of decisions and actions.
- Rolling action item list (RAIL) templateA single running list of actions kept from meeting to meeting, with a weekly review sheet and age counts.
- Lessons learned templateA one-page lessons log, a 45 minute session guide and an Excel register that shows which actions are done, open or overdue.
- Packing list templateA one-page packing list with a pack checklist, and an Excel file that works out volume, shipped to date and back order.
- Meeting minutes templateA one-page minutes form and an Excel log of decisions and actions with owners, due dates and status.
- Sign-in sheet templateA training and meeting sign-in sheet, a visitor sign-in and out sheet, and an Excel register of attendance and visitors on site.
- Purchase order templateA one-page purchase order and an Excel version that adds up the lines, checks the approval limit and tracks what is still to come.
- Action plan templateA one-page action plan and an Excel tracker with percent done, status and a weekly timeline.
- Maintenance request form templateA one-page request form and an Excel log that times each answer against a priority target.
- Maintenance log templateA maintenance log page and an Excel log that totals cost, downtime and planned work and flags repeat breakdowns.
- Preventive maintenance schedule templateA PM schedule with next due dates and status, and an Excel calendar of the jobs and hours in each month.
- Machine setup sheet templateA setup sheet with limits, a first piece check and setup minutes, and an Excel log of setups against a standard.
- Work instruction templateA one-page work instruction with key points and step times, and an Excel training record that flags re-checks.
Can't find the template you need?
Tell us what you're looking for. We'll make it and send it to your inbox, free.
A shift handover sheet, a red tag log, a changeover checklist for one machine: if your team uses it on the floor, ask.